Executive Summary
Published 1 October 2026

© Crown copyright 2026
This publication is licensed under the terms of the Open Government Licence v3.0 except where otherwise stated. To view this licence, visit nationalarchives.gov.uk/doc/open-government-licence/version/3 or write to the Information Policy Team, The National Archives, Kew, London TW9 4DU, or email: psi@nationalarchives.gov.uk.
Where we have identified any third party copyright information you will need to obtain permission from the copyright holders concerned.
This publication is available at https://www.gov.uk/government/publications/final-evaluation-of-bduk-legacy-vouchers-schemes/executive-summary
This report presents the findings from the final phase of the evaluation of Building Digital UK (BDUK)’s legacy voucher schemes, as delivered up to 2021. This includes two voucher schemes:
-
Gigabit Broadband Voucher Scheme (GBVS): delivered between November 2017 and May 2020, with a focus on connecting Small and Medium Enterprises(SMEs) and stimulating the full-fibre broadband market.
-
Rural Gigabit Connectivity (RGC) voucher scheme: delivered between May 2019 and March 2021, this adapted the voucher approach to support delivery in rural areas only
This final phase uses longer-term data to assess how connectivity and wider economic, social and environmental outcomes have changed over time, and includes an updated assessment of value for money. The report focuses on measuring and assessing the effects of vouchers on improving connectivity, supporting business and local economic growth, delivering social and environmental benefits, and stimulating competition in the broadband market.
1. Effects on connectivity
The evaluation assessed the impact of vouchers on connectivity using changes in average download speeds. It was not possible to measure changes in the coverage of gigabit-capable broadband directly at the very local level required for this evaluation, due to limitations in the consistency of coverage data at small geographic scales. Average download speeds were found to provide a more reliable and consistent indicator over time and were therefore used as a proxy indicator for changes in connectivity. However, this is a limitation of the analysis, as download speeds also reflect the services and speeds that households and businesses choose to subscribe to, as well as the availability of faster connections.
1.1 Vouchers delivered sustained improvements in broadband speeds
The analysis shows that areas receiving vouchers experienced larger increases in average download speeds than comparable areas without vouchers. These differences are statistically significant, giving confidence that vouchers had a positive effect on connectivity. This finding holds across all treatment years and when analysed at both output area and postcode level, with effects lasting for at least three years after connection.
The estimated effects are larger at postcode level than at output area level. This reflects the fact that postcodes are smaller areas and are therefore less affected by the inclusion of nearby premises that did not receive voucher support, which dilutes the measured effect in larger output areas.
Effects of vouchers on average download speeds
| Unit of analysis | Treatment year | Sample size | 1 year median effect | 2 year median effect | 3 year median affect |
|---|---|---|---|---|---|
| Output areas | 2018 | 1,617 | 9.0*** | 12.2*** | 13.7*** |
| 2019 | 3,887 | 1.9*** | 4.8*** | 7.4*** | |
| 2020 | 2,851 | 1.9*** | 9.7*** | 6.3*** | |
| 2021 | 1,853 | 17.4*** | 31.4*** | n.a. | |
| Postcodes | 2018 | 2,293 | 23.8*** | 30.1*** | 34.0*** |
| 2019 | 7,819 | 15.7*** | 30.4*** | 50.4*** | |
| 2020 | 7,490 | 12.6*** | 60.5*** | 61.0*** | |
| 2021 | 5,862 | 58.4*** | 97.3*** | n.a. |
| Source: Belmana |
| Note: Significance levels are 1% (***), 5% (**) and 10% (*). |
1.2 RGC vouchers delivered larger speed gains than GBVS
The analysis shows clear differences between the two voucher schemes. In postcodes treated in 2019 and 2020 (when the two schemes overlapped), RGC vouchers led to much larger increases in average download speeds than GBVS vouchers, with effects that were statistically significant and sustained over time. RGC areas typically received more vouchers and higher subsidy per project. However, even after accounting for this higher investment, RGC vouchers were more cost effective at increasing average download speeds than GBVS.
This assessment focuses on additional speed improvements and therefore aligns more closely with the objectives of RGC, which aimed to maximise additionality and minimise deadweight. GBVS was primarily designed to stimulate the market, where some deadweight was expected. The findings nevertheless show that BDUK’s change in approach between the two schemes was effective in delivering its intended objectives.
Effects of vouchers on average download speeds in treated postcodes by scheme (Mbps)
| Treatment year | Voucher type | No. postcodes | 1 Year median effect | 2 Year median effect | 3 Year median effect |
|---|---|---|---|---|---|
| 2019 | GBVS | 2,686 | 14.7*** | 23.6*** | 37.4*** |
| RGC | 179 | 71.1*** | 190.1*** | 241.2*** | |
| 2020 | GBVS | 1,641 | 0.5 | 4.2 | 14.7*** |
| RGC | 788 | 39.6*** | 90.4*** | 62.2*** |
| Source: Belmana |
| Note: Significance levels are 1% (***), 5% (**) and 10% (*). |
1.3 Project vouchers delivered larger speed improvements than standard vouchers
The evaluation has looked at the effects of two different types of vouchers. Standard vouchers support individual premises, while project vouchers allow multiple vouchers to be combined within a defined area to support a single network build. Overall, the evaluation found that project vouchers were more effective and more cost effective at increasing average download speeds than standard vouchers, with larger and more sustained effects over time. The main exception is 2018, where standard vouchers appear to perform better. This result should be treated with caution, as the data for 2018 is less reliable and consistent than in later years.
1.4 Top-up vouchers: limited evidence of additional connectivity gains
Top-up vouchers were additional local authority contributions used mainly in 2020 and 2021 to supplement voucher values, with the aim of enabling connections in higher-cost and harder-to-reach areas. The evaluation finds limited evidence that top-up vouchers were more effective or more cost effective at delivering connectivity improvements than standard vouchers. Analysis comparing changes in average download speeds in areas with and without top-ups found no consistent evidence of additional impact. However this result should be interpreted with caution, as average download speeds are a limited measure for assessing top-ups, which were designed to extend coverage rather than maximise speeds.
Further analysis using expected premises passed data provided by BDUK suggests that projects using top-ups involved higher subsidy per voucher but delivered fewer expected premises per voucher than projects without top-ups, including in uncommercial areas. However, this evidence is based on small sample sizes, relies on supplier estimates rather than confirmed delivery, and does not fully account for differences between projects. As a result, while the findings raise questions about the relative cost effectiveness of top-up vouchers, they should be treated as indicative rather than definitive.
2. Economic impacts
The evaluation assessed business-level impacts by matching voucher-supported businesses to similar non-supported businesses and comparing their performance over time. Impacts were measured across three indicators: employment, turnover and productivity (turnover per employee).
2.1 Vouchers improved business performance for around three years
Overall, the results show that vouchers had a positive and statistically significant impact on business performance. By the third year after support, businesses that received a voucher had employment levels 6.9 percentage points higher and annual turnover 16.5 percentage points higher than comparable businesses in the control group. While productivity declined across the economy during this period, voucher-supported businesses experienced a smaller decline, estimated to be 9.6 percentage points lower than would otherwise have been the case, indicating improved efficiency and resilience.
These effects are strongest in the first three years following support. By the fourth year, differences between voucher-supported businesses and control groups are no longer statistically significant, suggesting that the main business impacts of vouchers persist for around three years before converging.
2.2 Business impacts were stronger for earlier voucher recipients
When the results are split by cohort, clear differences emerge. Businesses that received a voucher in 2018/19 or 2019/20 experienced much stronger performance than comparable firms. For example, by the third year after support, real turnover was more than 15 percentage points higher than in the control group for both cohorts. By contrast, businesses that received a voucher in 2020/21 did not show a statistically significant difference in turnover compared with similar businesses. This suggests that later voucher recipients did not experience the same benefits as earlier cohorts.
The evaluation cannot identify the exact reasons for these differences. However, a plausible explanation is that early recipients upgraded at a time when gigabit connectivity was less widely available, giving them a first-mover advantage. They also received support before the Covid-19 pandemic, which may have left them better prepared for the rapid shift to digital ways of working. By 2020/21, gigabit availability had expanded and digital adoption was accelerating across the whole economy, reducing the scope for voucher-supported businesses to pull ahead of non-supported firms.
2.3 GBVS delivered stronger business impacts than RGC
Overall, the results show that voucher effects were much stronger for GBVS businesses than for RGC businesses. By the third year after support, employment growth in GBVS businesses was 9.2 percentage points higher than in comparable businesses, compared with 1.3 percentage points for RGC businesses. Differences in turnover were larger still: by year three, turnover growth was 16.1 percentage points higher for GBVS businesses, while RGC businesses were outperformed by their control group.
These differences are likely to reflect timing effects rather than the type or location of businesses supported. GBVS activity was heavily concentrated in 2018/19 and 2019/20, when voucher impacts were strongest, with 93% of GBVS recipients supported in these years. By contrast, just over half of RGC business recipients received support in 2020/21, the cohort where business impacts were more limited.
2.4 Rural businesses benefited as much as, or more than, urban businesses
Further analysis shows that the weaker results for RGC businesses are not due to rural businesses benefiting less from broadband upgrades. Separate analysis of rural and urban businesses finds that vouchers delivered strong and sustained benefits for rural firms.
For businesses supported in 2018/19 and 2019/20, voucher impacts on both employment and turnover were consistently larger for rural businesses than for urban businesses. In the 2020/21 cohort, vouchers continued to have a positive effect for rural businesses: turnover was 10.4 percentage points higher than the control group in the year of support, rising to 17.5 percentage points by year two and remaining 10.2 percentage points higher by year three. In contrast, there were no statistically significant effects for urban businesses in this cohort.
This suggests that the more limited impacts observed for RGC businesses are driven by timing, rather than location. It suggests that, as gigabit connectivity became more widely available in urban areas, non-supported businesses were able to catch up, reducing the additional benefit of vouchers. In rural areas, where coverage remains more limited, voucher-supported businesses continued to enjoy a clearer advantage over comparable firms without a voucher.
2.5 Earnings benefits – national economic impact of vouchers
The evaluation shows that people moving from other jobs into roles created in voucher-supported businesses receive an increase in salary of around 10–15% (referred to in the report as the earnings premium). This represents an increase in workers’ earnings due to moving into more productive jobs enabled by voucher-funded connectivity improvements.
These earnings gains can be treated as a net additional benefit at national level and are therefore suitable for inclusion in the cost–benefit analysis. This is because they reflect higher productivity and income for workers, rather than activity shifting between firms or places. By contrast, changes in employment and turnover cannot be counted nationally, as these may partly reflect displacement from other businesses rather than a net gain to the UK economy.
Using this approach, the evaluation estimates total earnings benefits of around £175 million, almost all of which is attributable to GBVS (£173.5 million), with RGC contributing around £1 million. This difference reflects the much larger scale of business vouchers delivered through GBVS, the fact that GBVS businesses on average had higher levels of baseline employment, and the stronger employment effects observed for GBVS recipients.
2.6 Limited but positive evidence of wider local economic effects
In addition to firm-level impacts, the evaluation examined whether vouchers generated wider economic benefits in the local areas where business vouchers were used. This analysis aimed to capture potential spillover effects, including benefits to nearby businesses that gained access to improved connectivity through voucher-funded projects, even if they did not receive a voucher themselves.
The findings suggest that vouchers were associated with more positive employment outcomes at the local area level. Although employment declined in many areas over the period studied, declines were smaller in areas that received vouchers than in comparable areas without support. This indicates that vouchers may have helped to limit employment losses during a period of wider economic disruption.
The evidence on local turnover effects is weaker and should be interpreted with caution. While some analysis suggests higher turnover growth in voucher areas than in matched control areas, these results are sensitive to data limitations and methodological assumptions, particularly for businesses with multiple sites. In addition, turnover growth in voucher areas was lower than the national average, suggesting that any positive effects were modest in scale.
2.7 No evidence of impact on unemployment
The evaluation found no consistent differences in changes in unemployment between areas that received vouchers and comparable areas that did not. These findings should be interpreted with caution as the analysis used Claimant Count data at Lower Super Output Area (LSOA) level. LSOAs are relatively large areas, and vouchers represent a small intervention compared with wider labour market forces, particularly during the Covid-19 period. As a result, any modest effects of vouchers on unemployment are likely to be difficult to detect at this scale.
3. Social impacts
3.1 Substantial wellbeing benefits for households
The scale and nature of household benefits from improved broadband were explored in detail in the 2023 evaluation, based on a large-scale survey, and this qualitative analysis has not been repeated in the final phase. Instead, this phase focuses on updating the monetary value of wellbeing benefits, using the same modelling approach as the 2023 study but drawing on additional evidence. This includes stronger evidence on the persistence of connectivity benefits and new BDUK data that allows wellbeing benefits to be estimated for households that gained access through voucher-funded projects, even where they did not receive a voucher themselves.
The analysis shows that vouchers have generated substantial wellbeing benefits for households that gained access to gigabit-capable broadband. Based on the updated modelling, annual gross wellbeing benefits are estimated at £40 million to £65 million, reflecting improved life satisfaction associated with better connectivity. After adjusting for deadweight and applying a three-year persistence period, cumulative net additional wellbeing benefits are estimated at £71 million to £116 million. When indirect benefits to households connected through voucher-funded projects are included, total wellbeing benefits rise to £217 million to £367 million over three years. For individual schemes, net additional wellbeing benefits over three years are estimated at £86 million to £142 million for GBVS and £131 million to £225 million for RGC.
These wellbeing estimates are modelled using a range of assumptions and are therefore subject to greater uncertainty than the economic impact estimates, which are based on more robust quasi-experimental methods.
4. Environmental impacts
4.1 Carbon savings through reduced travel
The evaluation finds that vouchers have delivered positive environmental benefits, mainly by supporting changes in travel and working patterns. Building on the 2023 evaluation, this final phase uses the full dataset of delivered vouchers alongside more recent national evidence on homeworking to provide updated estimates.
The analysis shows that households supported by vouchers are travelling substantially fewer miles, largely due to increased homeworking and reduced commuting. This is estimated to generate gross annual carbon savings of around 4,500 tonnes of CO2e. After accounting for additional household energy use and adjusting for deadweight, net additional carbon savings are estimated at around 2,900 tonnes of CO2e per year.
Assuming these behavioural changes persist for three years, consistent with evidence on sustained connectivity improvements, cumulative net additional carbon savings are estimated at around 8,600 tonnes of CO2e. This is presented as a range of 7,800 to 9,500 tonnes to reflect uncertainty in the modelling.
5. Market stimulation effects
Stimulating the broadband market was a core objective of the GBVS, which was introduced at a time when gigabit-capable coverage was very low. The evaluation assessed these effects using a contribution analysis, drawing on supplier interviews, financial data, and case study evidence.
5.1 Vouchers supported the growth of smaller broadband suppliers
There is strong evidence that vouchers helped smaller and newer providers to scale up and grow. Analysis of company accounts shows clear links between voucher use and growth in turnover and assets for a range of alternative network providers. Supplier interviews reinforce this, with many describing vouchers as critical to early expansion, enabling them to operate in areas that would otherwise have been unviable and helping to unlock further private investment.
5.2 Vouchers influenced supplier investment decisions and long-term strategies
The evidence also shows that vouchers shaped supplier behaviour. Suppliers reported that vouchers encouraged shifts towards full fibre networks, supported more ambitious rollout plans, and gave confidence to expand into rural and hard-to-reach areas. For some providers, participation in the voucher schemes helped attract additional private finance, reinforcing longer-term growth.
5.3 Vouchers increased competition at national, regional and sub-regional levels, but not at very local level
At a national and regional level, vouchers contributed to a more diverse and competitive market by supporting new entrants and enabling them to establish a foothold in specific geographies. However, impacts on direct competition at the local level were more limited. In many rural and high-cost areas, vouchers typically supported a single provider, reflecting the limited commercial viability of multiple networks. While vouchers often increased coverage in previously unserved areas, head-to-head competition at postcode level was rare.
6. Cost Benefit Analysis
6.1 Voucher schemes delivered good value for money
The cost–benefit analysis shows that BDUK’s voucher schemes have delivered good value for money. Across both schemes, the total value of monetised benefits realised to date is estimated at £395 million to £546 million, compared with total programme costs of around £139 million. This gives an overall benefit–cost ratio (BCR) of 2.8 to 3.9, meaning that every £1 invested has generated between £2.80 and £3.90 of benefits.
Looking at the schemes separately, the estimated BCR for GBVS is 2.6 to 3.2, while the BCR for RGC is higher, at 3.5 to 5.9. Both schemes therefore represent good value for money. However, the drivers of value differ. For GBVS, the BCR is driven mainly by earnings benefits for workers, which are estimated using robust quasi-experimental methods and can be treated as net additional economic benefits. For RGC, the higher BCR is driven largely by household wellbeing benefits, which are modelled using survey evidence and a range of assumptions and are therefore less robust and subject to greater uncertainty. As a result, greater confidence can be placed in the GBVS BCR than in the higher headline BCR for RGC.
Cost benefit analysis for voucher schemes – based on impacts realised by 2024
| GBVS | RGC | Total | ||||
|---|---|---|---|---|---|---|
| Low | High | Low | High | Low | High | |
| Earnings benefits | 175 | 175 | 1 | 1 | 176 | 176 |
| Wellbeing impacts | 86 | 142 | 131 | 225 | 217 | 367 |
| Environmental benefits | 0.7 | 0.9 | 1.4 | 1.7 | 2.1 | 2.5 |
| Total value of benefits | 261.7 | 317.9 | 133.4 | 227.7 | 395.1 | 545.5 |
| Total value of costs | 100.8 | 100.8 | 38.5 | 38.5 | 139.3 | 139.3 |
| Value of benefits per £ invested | 2.6 | 3.2 | 3.5 | 5.9 | 2.8 | 3.9 |
| Source: GC Insight |
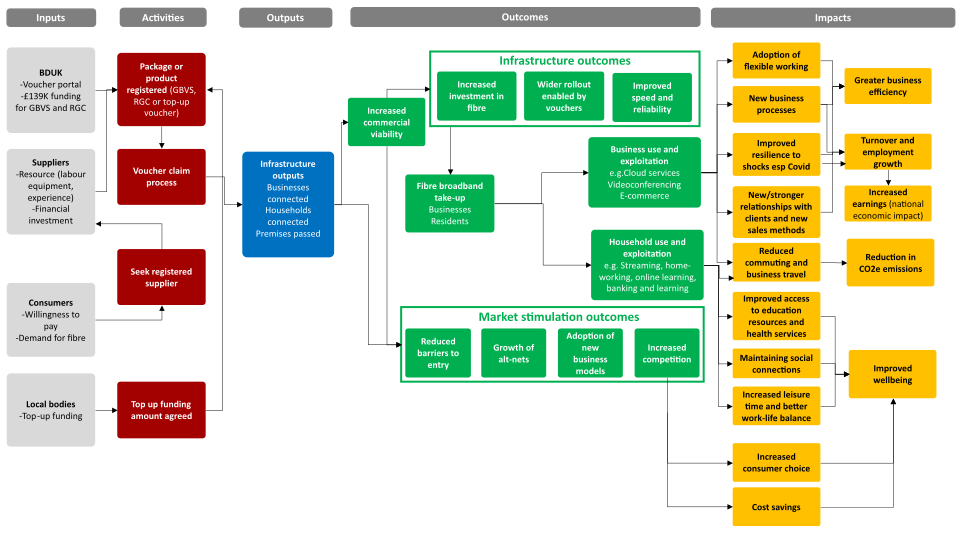
7. Revisiting the Theory of Change
The evaluation has revisited the original theory of change for BDUK’s legacy voucher schemes. Drawing on evidence from across all phases of the evaluation, including quasi-experimental analysis, business and household surveys, and supplier interviews, a revised theory of change has been developed to show which outcomes and impacts can be evidenced.
The revised theory of change also sets out the main causal pathways through which vouchers generated impacts, based largely on reported changes in behaviour and use of broadband captured through survey evidence. Together, this provides a clear and evidence-based summary of how vouchers translated into connectivity improvements and wider economic, social and environmental outcomes.
Revised theory of change for BDUK legacy vouchers