Environmental impacts
Published 1 October 2026

© Crown copyright 2026
This publication is licensed under the terms of the Open Government Licence v3.0 except where otherwise stated. To view this licence, visit nationalarchives.gov.uk/doc/open-government-licence/version/3 or write to the Information Policy Team, The National Archives, Kew, London TW9 4DU, or email: psi@nationalarchives.gov.uk.
Where we have identified any third party copyright information you will need to obtain permission from the copyright holders concerned.
This publication is available at https://www.gov.uk/government/publications/final-evaluation-of-bduk-legacy-vouchers-schemes/environmental-impacts
1. Summary
This report updates the estimates of the environmental benefits generated by Building Digital UK(BDUK) voucher schemes. The 2023 evaluation modelled how upgraded broadband connections affected household travel behaviour and working patterns, drawing on survey data. The final evaluation uses the full dataset of vouchers delivered and more recent national evidence on working from home and its implications for carbon emissions to provide more robust and up-to-date estimates.
The analysis confirms that the behavioural changes identified in 2023, particularly increased homeworking and reduced commuting, have continued since the report was published. Combining survey responses with government emissions factors, we estimate that voucher households are travelling around 742,000 fewer miles each week. This decrease is travel results in gross annual carbon savings of around 4,800 tonnes CO₂ or equivalent in other greenhouse gases (CO2e). This includes savings of 1,900 tonnes CO2e for Gigabit Broadband Voucher Scheme(GBVS) households and 2,900 tonnes CO2e for Rural Gigabit Connectivity(RGC) households.
Allowing for additional household energy use linked to homeworking and reduced office energy demand, the net gross impact remains strongly positive. After adjusting for deadweight, in this case the households that would have upgraded anyway, the net additional carbon savings are estimated at 2,900 tonnes CO2e per year. Between schemes, this represents around 1,000 tonnes CO2e for GBVS and 1,900 tonnes CO2e for RGC.
Assuming these benefits persist for three years, as supported by evidence of lasting improvements in broadband speeds in voucher areas, cumulative carbon savings are estimated at between 7,800 and 9,500 tonnes CO2e, with a central estimate of 8,600 tonnes CO2e.
2. Purpose of report
The 2023 evaluation provided estimates of the environmental impacts of the voucher schemes. These were derived through a modelled approach, using assumptions informed by the household survey which asked beneficiaries how their travel patterns had changed following their upgrade. The estimates focused on the extent to which upgraded broadband reduced commuting and business travel, alongside any effects on household energy use.
The purpose of this report is to update those estimates using the final data on the number of vouchers delivered, together with more recent evidence on working patterns and domestic energy consumption. This ensures the analysis reflects both the full scale of the schemes and the persistence of behavioural changes since the pandemic.
3. Methodology and limitations
3.1 Approach in the 2023 report
The 2023 evaluation estimated environmental impacts using a modelled approach underpinned by a residents’ survey of households that had received a voucher. The survey asked whether their upgraded broadband connection had led to changes in travel behaviour. Respondents provided details on:
-
Whether their commuting or business travel had reduced.
-
How often they travelled.
-
The typical distance travelled
-
The mode of transport used.
This evidence was combined with Department for Transport data on emissions factors to estimate changes in carbon emissions linked to travel.
The 2023 analysis also assessed wider effects from increased working from home. It drew on benchmarks from the Carbon Trust’s Homeworking Report, which compared annual emissions for an average teleworker working at home with those commuting to an office. These benchmarks accounted for:
-
Avoided office-related emissions like heating and electricity use in an office.
-
Additional household emissions from greater domestic energy use.
Survey responses on the number of residents working from home for the first time or working from home more often since receiving a voucher were combined with these benchmarks to estimate net impacts.
3.2 Approach in the Final Evaluation
For the final evaluation, it was not possible to repeat the residents’ survey. Instead, the first step has been to test whether the behavioural changes identified in 2023 have persisted. This involved reviewing national evidence on commuting and working from home trends since the pandemic, and recent studies on the carbon impacts of homeworking and domestic energy use.
Based on this evidence, the evaluation assesses whether the modelling assumptions applied in 2023 remain valid. If they do, updated estimates of carbon savings have been produced using the final dataset of vouchers delivered.
3.3 Limitations
The analysis has several limitations. It relies on self-reported survey data, which may be subject to recall bias or over/under-reporting of behavioural changes. Benchmark estimates from the Carbon Trust are applied at an aggregate level and cannot capture the full variation in household or workplace energy use. Finally, there remains uncertainty around the persistence of behavioural change over time, particularly as commuting and working patterns continue to evolve.
4. Recent evidence of changes in work patterns in the UK
The residents’ survey was carried out between February and March 2022, at a time when working from home and hybrid working had increased significantly due to the Covid pandemic. Evidence from the Office for National Statistics(ONS) Opinion and Lifestyle Survey, which tracked work and travel patterns of adults at regular intervals between January 2021 and October 2024, shows that these patterns remained broadly stable after the residents’ survey was completed.
Allowing for seasonal fluctuations around holiday periods, the ONS data indicates that:
-
Around 40–45% of people worked entirely in an office or other place of work.
-
Around 20–30% worked in a hybrid pattern.
-
Around 10–15% worked entirely from home.
The most recent data, from March 2025, confirms this picture, with 28% of adults hybrid working and 15% working fully from home. Taken together, the evidence shows no meaningful change in work patterns since the 2022 residents’ survey. It is therefore reasonable to assume that the behaviours reported by survey respondents have persisted and that these can be still be used to model the carbon savings from increased working from home enabled by vouchers.
Percentage of working adults by working arrangement, Great Britain, January 2022 to October 2024
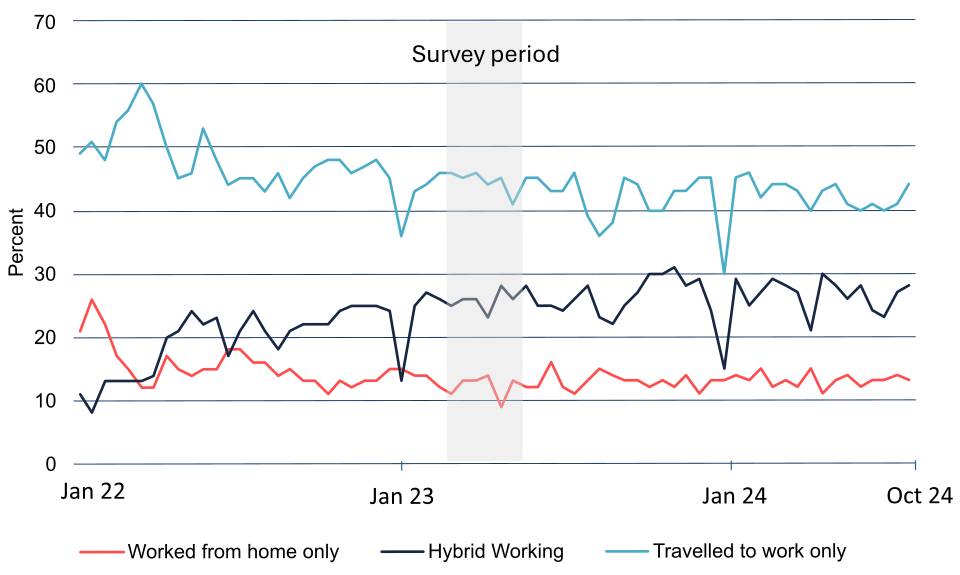
Source: ONS Opinion and Lifestyle Survey
5. Findings of recent studies on environmental impacts of working from home
A number of more recent studies have examined the impact of working from home, sometimes called teleworking, on carbon emissions. These provide useful additional evidence on how commuting patterns, office energy use and household energy consumption interact to influence overall emissions. The table below summarises the key findings of these studies, highlighting their strengths, limitations, and relevance for this evaluation.
However, there are several important limitations to note:
-
Geographic relevance: many of the studies are based on research in North America or the Republic of Ireland. Their findings may not directly apply to the UK, given differences in energy mix, travel behaviour, housing stock, and climate.
-
Scope of impacts: a number of studies focus only on one element of the picture, such as commuting or domestic energy use, rather than capturing the full set of impacts across commuting, workplace energy, and household energy use.
-
Metrics reported: several studies do not provide results in terms of changes in carbon emissions per household or per individual. This makes it difficult to apply them directly within the modelling framework used here.
For these reasons, this evaluation continues to use the Carbon Trust (2021) Homeworking Report as the core evidence base. This study remains the most comprehensive and directly relevant to the UK context, and provides the necessary per-person benchmarks across all three impact domains.
That said, the findings from the newer studies have been used to sense-check the Carbon Trust results and test key assumptions. In particular, they confirm the central role of transport and heating behaviours in determining outcomes and reinforce the Carbon Trust’s conclusion that increased working from home is associated with a net reduction in carbon emissions.
Summary of key findings, strength and weaknesses of recent studies which have examined the relationship between working from home and carbon emissions
| Study | Key findings | Strengths/relevance | Caveats/limitations |
|---|---|---|---|
| Greenhouse gas emissions under work from home vs. office (H. Wu et al., 2024) | Working from home is estimated to reduce greenhouse gas emissions by ~29.11% or 4.06 kg CO2e/person/day compared to working in office. The reduction includes both avoided commuting and lower workplace emissions, offset by higher home emissions. | More recent, quantitative comparison; includes all of the same domains as the Carbon Trust study (commuting, domestic and workplace-based emissions) | US based study so transferability of findings may be limited. |
| Pilot study to measure the energy and carbon impacts of teleworking (Simon & O’Brien, 2023) | In a small sample of 11 participants, they found that more than 94% of telework-related energy comes from transportation and home heating/cooling. ICT, lighting, equipment accounted for the remaining < 6%. The majority of participants showed net reductions in emissions from telework vs conventional work. | Empirical measurement rather than modelling; useful for validating assumptions about component shares (transport vs home) | Very small sample; conducted in Canada, with specific climate, building stock, energy systems |
| The impact of teleworking on domestic energy use and carbon emissions: An assessment for England (Shi, Sorrell, Foxon, et al., 2024) | Focuses on the increase in domestic energy use from teleworking. Finds that if homeworkers heat their entire house during working hours, emissions could be up to 117% higher compared to a non-homeworking baseline; but if they limit to heating one room, the increase is limited to ≈16% relative to office-based scenarios. | UK based study so directly relevant to UK energy mix and housing stock. Useful for testing assumptions relating to emissions from home heating and sensitivity testing to reflect the impact of different home choices of teleworkers. | Focuses on the domestic side so provides no evidence about emissions from commuting or workplace activity. Findings are very sensitive to assumptions about heating behaviour. |
| Examining the long-term reduction in commuting emissions (Stefaniec et al., 2024) | Uses multiple emissions estimation methods to assess telecommuting’s long-term effect on greenhouse gases and air pollutant emissions. Finds that if half of white-collar workers worked from home and electric vehicles made up one-third of the fleet, emissions from travel activities could be reduced by up to 35% for carbon dioxide and 25% for particulate matter. | Useful for insight into longer-term persistence of benefits | Based on data for the Republic of Ireland. Runs multiple scenarios and does not provide estimates of carbon emissions per household. Relates only to commuting so provides no evidence about domestic or workplace energy consumption. |
6. Gross carbon impacts
6.1 Avoided commuting emissions
The residents’ survey asked voucher beneficiaries whether their upgraded broadband connection had changed their travel behaviour, and if so, by how much. The responses have been used to estimate the total reduction in travel for voucher recipients.
Cumulatively, survey respondents reported they were travelling 221,400 fewer miles each week following the upgrade. This figure is higher than the total reported in the 2023 evaluation (107,540 miles). The difference reflects a refinement to how outliers are identified and treated. In the earlier analysis, responses more than two standard deviations from the mean were excluded, which proved overly conservative and resulted in the removal of some plausible responses. In this study, outliers are defined more strictly as responses more than three standard deviations from the mean, with values between two and three standard deviations reviewed individually for consistency and plausibility. This approach aligns more closely with standard evaluation practice and reduces the risk of understating impacts by excluding valid responses.
The mean average reduction among all households that reported travelling less was 100 miles per week. The results were broadly similar across the two voucher schemes, with average reductions of 99 miles per week for GBVS households and 103 miles per week for RGC households.
To estimate the reduction in travel across all voucher households, we applied the survey findings to the full population of beneficiaries. The calculation involved three steps:
1. Identify households reducing travel – Based on the survey, 47% of GBVS households and 43% of RGC households reported travelling less after their upgrade.
2. Apply average weekly reduction – Among those households, the mean reduction was 99 miles per week for GBVS and 103 miles per week for RGC.
3. Scale to voucher population – These average reductions were applied to the estimated number of households in each scheme that reduced travel, assuming the survey sample is representative of all voucher households.
Using this method, we estimate that households supported by the voucher schemes are travelling 742,000 fewer miles per week. By scheme, this splits to 308,000 less miles for GBVS households and 434,000 for RGC households. The steps and results are summarised in the table below.
Estimated reduction in weekly miles travelled by voucher households
| Scheme | No. residential vouchers | % reducing travel (from survey) | Households reducing travel | Miles saved per household per week (from survey) | Total miles saved (000 per week) |
|---|---|---|---|---|---|
| GBVS | 6,617 | 47% | 3,110 | 99 | 308 |
| RGC | 9,804 | 43% | 4,216 | 103 | 434 |
| Total | 16,421 | 7,326 | 742 |
| Source: GC Insight |
The next step was to apportion these miles saved to the different modes of transport used by voucher recipients based on responses to the residential survey. This is shown in the table below.
Total miles saved by mode of transport
| Proportion of miles travelled by mode | Total miles saved | ||||
|---|---|---|---|---|---|
| GBVS | RGC | GBVS | RGC | Total | |
| Aeroplane | 2% | 0% | 4,753 | 1,767 | 6,520 |
| Bus | 1% | 0% | 3,695 | 1,982 | 5,677 |
| Car - diesel | 40% | 47% | 123,266 | 204,250 | 327,516 |
| Car - electric | 3% | 3% | 8,181 | 11,918 | 20,099 |
| Car - hybrid | 2% | 0% | 6,297 | 1,152 | 7,449 |
| Car - petrol | 30% | 30% | 93,366 | 131,697 | 225,063 |
| Cycling / walking | 1% | 0% | 3,553 | 819 | 4,372 |
| Motorcycle | 0% | 1% | 772 | 4,353 | 5,125 |
| Train / metro | 21% | 17% | 63,763 | 74,373 | 138,136 |
| Tram | 0% | 0% | 6 | 397 | 403 |
| Van | 0% | 0% | 238 | 384 | 622 |
| Not applicable | 0% | 0% | - | 1,127 | 1,127 |
| Total | 100% | 100% | 307,889 | 434,219 | 742,108 |
| Source: GC Insight |
The survey evidence on reduced travel has been translated into estimated carbon savings by applying standard emissions factors to the distance saved by each mode of transport. Distances reported in miles were first converted into kilometres, and then multiplied by the relevant emissions factor to calculate the associated reduction CO2e.
The emissions factors used are drawn from the UK Government Greenhouse Gas Conversion Factors (2024). These provide the most up-to-date, nationally consistent estimates of average emissions per passenger-kilometre across different modes of transport, reflecting the UK’s current energy mix and vehicle fleet.
Applying these factors to the estimated weekly reduction in distance travelled by voucher households indicates total savings of 45,854 kg CO2e per week for GBVS recipients or 2, 400 tonnes CO2e per annum, and 67,047 kg CO2e per week for RGC recipients or 3,500 tonnes CO2e per annum.
This is equivalent to an annual reduction of 767 kg CO2e per household for GBVS recipients based only on those who reported a reduction in their travel since the upgrade, and 826 kg CO2e per household for RGC recipients.
Estimated carbon savings per week for voucher recipients
| Number of miles saved per week | Emission factor (kg CO₂e per passenger-km) | CO2 savings per mode of transport per week (kg CO2e) | ||||
|---|---|---|---|---|---|---|
| GBVS | RGC | GBVS | RGC | Total | ||
| Car (petrol/diesel) | 231,110 | 349,017 | 0.18 | 41,600 | 62,823 | 104,423 |
| Train/metro/tram | 63,769 | 74,770 | 0.04 | 2,551 | 2,991 | 5,542 |
| Motorcycle | 772 | 4,353 | 0.114 | 88 | 496 | 584 |
| Bus | 3,695 | 1,982 | 0.105 | 388 | 208 | 596 |
| Van | 238 | 384 | 0.245 | 58 | 94 | 152 |
| Aeroplane (assumed domestic) | 4,753 | 1,767 | 0.246 | 1,169 | 435 | 1,604 |
| Total | 304,336 | 432,273 | 45,854 | 67,047 | 112,901 | |
| Source: GC Insight using UK Government Greenhouse Gas Conversion Factors |
6.2 Additional domestic energy related emissions
In the absence of detailed information on the energy consumption of voucher households or the size of their homes, we have followed the same approach as the 2023 report. This uses the average domestic energy emissions per teleworker estimated by the Carbon Trust for post-Covid scenarios, set at 441 kgCO2e per teleworker per year.
This figure has been applied to the estimated number of adults who reported using the internet to work from home for the first time, or more often, as a result of their upgrade. According to the residents’ survey:
-
36% of GBVS recipients or around 1,124 households, and
-
26% of RGC recipients or around 3,802 households
reported such a change in working patterns. We have not applied this factor to those who indicated that they were only using the internet to work from home more easily or effectively, since their frequency of homeworking was unchanged.
To scale the results, these percentages were applied to the total number of adults living in households where respondents reported increased homeworking. The survey did not collect information on the working patterns of other adults in the household, so it has been assumed that they share the same working pattern as the respondent.
Using this method, summarised in the table below we estimate that increased homeworking is associated with an additional 1,140 tonnes CO2e per year for GBVS households and 1,210 tonnes CO2e per year for RGC households.
Increased domestic emissions from increased working from home
| GBVS | RGC | Total | |
|---|---|---|---|
| Total households receiving a voucher | 6,617 | 9,804 | 16,421 |
| % working from home for first time or more often | 36% | 26% | 30% |
| Total number of adults in household | 7,176 | 10,632 | 17,808 |
| Estimated number of adults working from home for first time or more often | 2,586 | 2,752 | 5,338 |
| Increase in domestic emissions (tonnes CO2e) | 1,140 | 1,214 | 2,354 |
| Source: GC Insight using BDUK data and Carbon Trust (2021) Homeworking Report |
6.3 Avoided office energy consumption
Avoided office energy consumption has also been modelled using the assumptions from the Carbon Trust report on the carbon savings per teleworker for the post Covid 2022 scenario. However, in line with the approach used in the 2023 report, we have reduced the estimated saving per worker to take account of the fact that certain costs such as heating and lighting are more fixed, and will not vary with the number of people in the office (which is assumed in the Carbon Trust model).
The UK Green Building Council estimate that heating accounts for 36% of the energy used in UK offices, with lighting accounting for a further 26%. We have therefore reduced the carbon savings per worker by 50%, on the basis that there may be some heating or lighting savings associated with fewer people being in the office. This reduces the carbon savings from 510 kg CO2e per worker to 255 kg CO2e per worker. However there is some uncertainty about this assumption.
This has been applied to the estimate of the number of people in voucher households who are working from home more often or for the first time. This results in total avoided emissions of 659 tonnes CO2e for GBVS households and 702 tonnes CO2e for RGC households.
Avoided office emissions from increased working from home (tonnes CO2e per annum)
| GBVS | RGC | Total | |
|---|---|---|---|
| Estimated number of adults working from home for first time or more often | 2,586 | 2,752 | 5,338 |
| Avoided office emissions per teleworker | 255 | 255 | 255 |
| Avoided office emissions (tonnes CO2e) | 659 | 702 | 1,361 |
| Source: GC Insight using BDUK data and Carbon Trust (2021) Homeworking Report |
6.4 Summary
The table below summarises the net change in carbon emissions resulting from increased levels of homeworking among voucher households. We estimate that this has led to gross carbon savings of 4,880 tonnes CO2e per year:
-
1,900 tonnes CO2e attributable to GBVS households, and
-
2,970 tonnes CO2e attributable to RGC households.
The table also shows the average reduction in carbon emissions per teleworker per working day. This is estimated at 2.83 kgCO2e for GBVS recipients and 4.16 kgCO2e for RGC recipients. The average for all vouchers is 3.51 kgCO2e
For context, these figures are broadly in line with those reported in Wu et al. (2024), which estimated net carbon savings of 4.06 kgCO2e per teleworker per day. However, Wu’s study was based on the United States and is not directly comparable. There are also methodological differences. Wu et al. used a life-cycle, activity-based accounting model that captures indirect effects such as the embodied energy of office facilities and broader lifestyle changes. By contrast, our approach is narrower, focusing on direct savings from reduced travel and additional household energy use.
Given the uncertainty inherent in modelled estimates, the results should be treated as central estimates, with actual gross savings likely to fall within the range of 4,400 to 5,500 tonnes CO2e per year (based on a ±10% margin of error).
Gross change in carbon emissions following the broadband upgrade ( tonnes CO2e per annum)
| GBVS | RGC | All vouchers | |
|---|---|---|---|
| Reduced travel | -2,384 | -3,486 | -5,870 |
| Increased domestic emissions | 1,140 | 1,214 | 2,354 |
| Reduced office energy consumption | -659 | -702 | -1,361 |
| Total change in emissions (central estimate) | -1,903 | -2,974 | -4,877 |
| Total change per person per working day (kgCO₂e) | -2.83 | -4.16 | -3.51 |
| Total change in emissions (lower estimate) | -1,713 | -2,677 | -4,390 |
| Total change in emissions (upper estimate) | -2,093 | -3,271 | -5,364 |
| Source: GC Insight using BDUK data and Carbon Trust (2021) Homeworking Report |
7. Net carbon impacts
7.1 Adjusting for deadweight
The estimates presented above are based on the gross change in carbon emissions. To arrive at net additional savings, it is also necessary to account for deadweight; that is, the carbon reductions that would have occurred even without the voucher.
For consistency, we have applied the same deadweight assumptions used in the wellbeing analysis: 49% for GBVS recipients and 36% for RGC recipients. These figures are based on survey evidence of what beneficiaries said they would have done in the absence of a voucher. Specifically:
-
Respondents who said they would have obtained the same connection at the same time are treated as 100% deadweight.
-
Respondents who said they would have upgraded later, or to a lower-speed connection, are treated as 50% deadweight, on the basis that some of them would still have been able to work from home.
It is important to note, however, that the majority of respondents who now work from home reported that the upgrade was critical: 70% said it was very important and a further 21% said it was important in enabling them to do so. This suggests that actual deadweight may be lower than assumed.
Applying these assumptions produces the results shown in the table below. On this basis, the net carbon savings are estimated at 2,870 tonnes CO2e per annum, with a plausible range of 2,590 to 3,160 tonnes CO2e per annum. This includes:
-
GBVS: between 870 and 970 tonnes CO2e (central estimate: 970 tonnes).
-
RGC: between 1,710 and 2,090 tonnes CO2e (central estimate: 1,900m).
Net additional carbon savings from working from home (tonnes CO2e per annum)
| Gross change | Net change after deadweight | |||||
|---|---|---|---|---|---|---|
| GBVS | RGC | All vouchers | GBVS | RGC | All vouchers | |
| Low estimate | 1,713 | 2,677 | 4,390 | 873 | 1,713 | 2,586 |
| Central estimate | 1,903 | 2,974 | 4,877 | 971 | 1,903 | 2,874 |
| Upper estimate | 2,093 | 3,271 | 5,364 | 1,068 | 2,093 | 3,161 |
| Source: GC Insight using BDUK data and Carbon Trust (2021) Homeworking Report |
7.2 Adjusting for persistence
In line with the approach taken for modelling wellbeing impacts, we assume that the carbon savings from increased homeworking persist for three years. This is based on clear evidence that areas supported by vouchers continue to have significantly higher average download speeds at least three years after receiving support.
The actual benefits may last considerably longer, but at present there is no firm evidence to support modelling beyond this period. Using a three-year timeframe is therefore a cautious assumption.
We apply the same persistence assumption to both GBVS and RGC vouchers, as analysis shows that areas supported by each scheme maintain an additional speed premium three years after support.
On this basis, we estimate that increased home working enabled by vouchers results in total carbon savings of 8,620 tonnes CO2e, based on the central estimate, ranging from 7,760 to 9,480 tonnes CO2e. This includes:
-
GBVS: between 2,620 and 3,200 tonnes CO2e (central estimate: 2,910 tonnes).
-
RGC: between 5,140 and 6,280 tonnes CO2e (central estimate: 5,710 tonnes).
Cumulative carbon savings from increased home working over three years (tonnes kgCO2e)
| GBVS | RGC | All vouchers | |
|---|---|---|---|
| Low estimate | 2,620 | 5,140 | 7,760 |
| Central estimate | 2,912 | 5,710 | 8,622 |
| Upper estimate | 3,203 | 6,280 | 9,483 |
| Source: GC Insight using BDUK data and Carbon Trust (2021) Homeworking Report |
7.3 Monetising carbon savings
In order to assess the value for money of the vouchers schemes it is necessary to convert all benefits to monetary values, wherever possible. To do this, we have used the current “carbon value” used in UK policy appraisal (i.e. the Green Book supplementary guidance), which is £228 per tonne CO2e for non-traded emissions in 2020 prices, and £266 per tonne in 2024 prices.
Applying this to the carbon calculations gives the results in the table below. The central estimate of the total value of carbon savings is estimated to be £2.3m but ranging from £2.1m to £2.5m. The central estimates for GBVS and RGC are £0.78m and £1.52m respectively.
Monetary value of carbon savings (£000)
| GBVS | RGC | All vouchers | |
|---|---|---|---|
| Low estimate | 697 | 1,367 | 2,064 |
| Central estimate | 775 | 1,519 | 2,293 |
| Upper estimate | 852 | 1,671 | 2,523 |
| Source: GC Insight |