Cultural Recovery Fund data report
Updated 16 October 2023

© Crown copyright 2023
This publication is licensed under the terms of the Open Government Licence v3.0 except where otherwise stated. To view this licence, visit nationalarchives.gov.uk/doc/open-government-licence/version/3 or write to the Information Policy Team, The National Archives, Kew, London TW9 4DU, or email: psi@nationalarchives.gov.uk.
Where we have identified any third party copyright information you will need to obtain permission from the copyright holders concerned.
This publication is available at https://www.gov.uk/government/publications/evaluation-and-data-report-for-the-culture-recovery-fund/cultural-recovery-fund-data-report
Preface
This report is based on management data based on applicant-supplied information, and is not classified as an Official Statistic. However the data has been compiled using best practice in line with the UK Code of Practice for Statistics, where possible. A full statement of voluntary compliance is included in the accompanying data tables. Included are various breakdowns of the data, in addition to supplementary analysis using external sources. Full caveats and notes on the data and its interpretation are included in the accompanying data tables.
Headline data
The Culture Recovery Fund (“CRF”) was a diverse package of funding measures designed to support England’s cultural sector. It included:
-
direct emergency funding for DCMS-sponsored cultural organisations
-
resource funding grant schemes (“recovery grants”)
-
loan schemes (“repayable finance”)
-
capital grant schemes (“capital grants”)
-
the Cultural Assets Fund (“CAF”)
The total investment through these strands totals around £1.6 billion.
The CRF investment also gave rise to Barnett consequentials for Devolved Administrations, and administration costs were incurred for the delivery of the fund.
Within the CRF package, cultural sector organisations were awarded £1.42bn in total through CRF1, 2 and 3. In addition, £152m has been provided in emergency support to DCMS-sponsored cultural organisations. To date, £20m has been committed for the Cultural Assets Fund, which remains in delivery in 2022-23. This brings the total CRF package investment to around £1.6 billion.
This publication sets out commentary relating to the capital, recovery, and repayable finance schemes that were included in CRF1, 2, and 3. It does not, for example, provide commentary or data on the Cultural Assets Fund, or the support to DCMS-sponsored cultural organisations. A full breakdown of the scope of the data release is provided in the accompanying tables.
This publication summarises and provides some commentary on the data provided in the management data transparency release published in parallel, which is up to date as of 1 April 2022 (the end date of the grant-making period of the programme):
-
CRF1, 2, and 3 award data by round for organisations across England;
-
CRF1, 2, and 3 application and award breakdowns by region, discipline and sector;
-
Funding awarded analysed by local authority areas according to their deprivation levels, heritage indices and arts engagement levels.
This release uses data from CRF applications provided to each of the four arm’s-length bodies (“ALBs”) responsible for distributing CRF funding; (i) Arts Council England (ACE), (ii) British Film Institute (BFI), (iii) Historic England (HE) and (iv) the National Lottery Heritage Fund (NLHF).
These ALBs hold Accounting Officer responsibility for the grants they have made, and therefore represent the authoritative sources for this data. Any divergence between the combined data here and individual ALB data is likely to be due to adjustments over the passage of time.
Funding across CRF rounds
This funding was distributed across the three rounds of CRF as follows:
-
£822m (57.6%) was awarded in the initial round of funding;
-
£396m (27.8%) was awarded in the second round of funding;
-
£208m (14.6%) was awarded in the final round of funding.
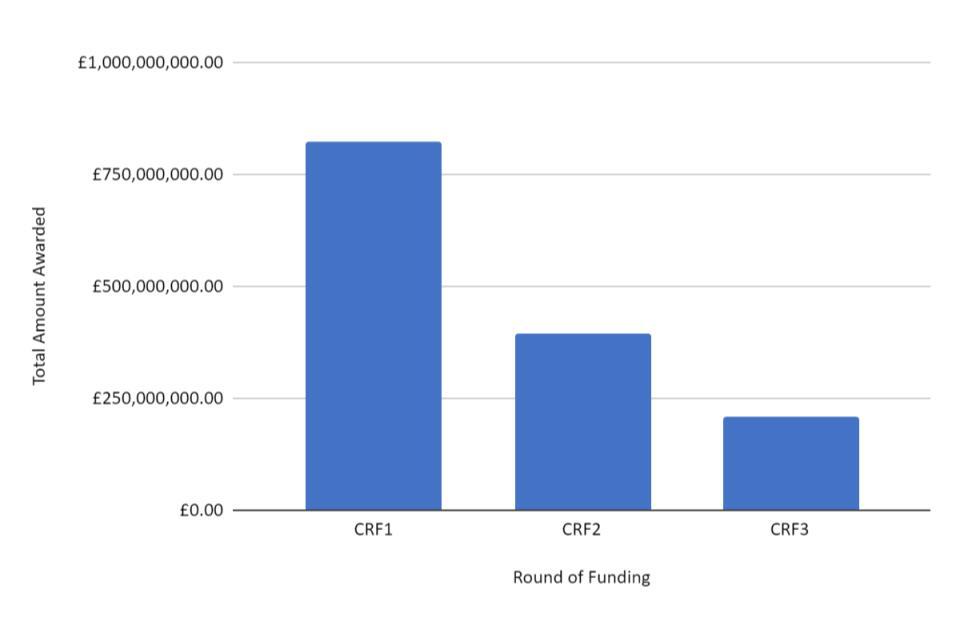
Figure 1.1 shows that CRF1 distributed the largest amount of support, followed by CRF2 and CRF3.
CRF funding was awarded with the intent of supporting the country’s vibrant and diverse cultural and creative sectors through the impact of COVID-19. To this end, funding was awarded across three different funding strands, each of which served a different purpose and had differing award criteria.
-
The majority of funding awarded by CRF was via recovery grants, totalling just over £1bn.
-
Larger organisations were offered funding through repayable finance. In total, £254m was awarded through loans.
-
£165m was awarded via capital grants.
The average award differed significantly by the category of funding:
-
The average recovery grant award across 4451 organisations was £226,400;
-
The average capital grant award across 653 organisations was £252,500;
-
The average repayable finance award across 37 organisations was £6,866,200.
In total, 7,185 unique organisations applied for funding from the Cultural Recovery Fund (excluding capital applicants). 4,473 (62.3%) of these applicants were successful in receiving funding. N.B. Capital figures are not included in success-rate data as some capital programmes were subject to stricter eligibility rules, and application rates are therefore not comparable to the rest of the CRF.
Applicants were most successful at receiving awards in the final round of funding (72.9%) followed by the initial round (66.9%) and then the second round (56.7%).
Funding by region
Cultural sector organisations were awarded £1.42bn of funding in total, of which:
-
Sites in London were supported with £494m, or 34.63% of the total;
-
Sites in the South West were supported with £159m, or 11.12% of the total;
-
Sites in the North West were supported with £158m, or 11.11% of the total;
-
Sites in the South East were supported with £158m, or 11.05% of the total;
-
Sites in the West Midlands were supported with £124m, or 8.73% of the total;
-
Sites in Yorkshire and the Humber were supported with £124m, or 8.72% of the total;
-
Sites in the East of England were supported with £85m, or 5.97% of the total;
-
Sites in the East Midlands were supported with £71m, or 4.97% of the total; and
-
Sites in the North East were supported with £51m, or 3.61% of the total.
-
A small number of awards (10) were given to organisations based in Scotland, Wales, the Channel Islands and Northern Ireland, but where the organisation’s activity primarily benefited England. These organisations received a total of £1.5m, or 0.11% of the total.
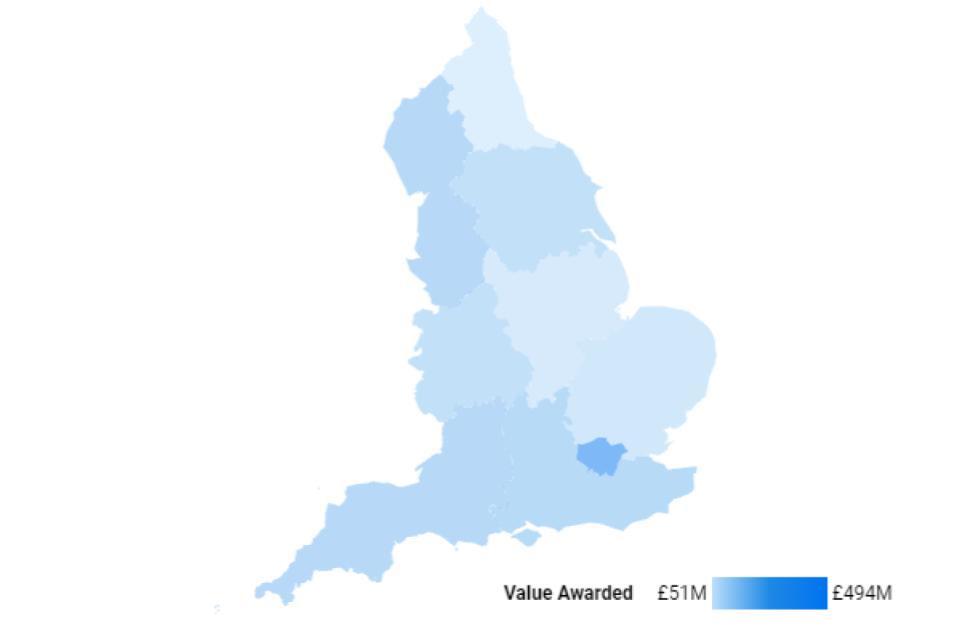
Figure 1.2 shows a heat-map of CRF funding by region. It shows London as the area with the highest level of CRF funding.
Success rate data is not directly correlated with absolute funding numbers. N.B. Capital figures are not included in success-rate data as some capital programmes were subject to stricter eligibility rules, and application rates are therefore not comparable to the rest of the CRF.
-
Applicants from the North East were most successful at receiving funding, with 69.8% of unique applicants receiving funding, and 72.6% of the funding applied for being awarded.
-
By contrast, only 61.7% of applicants from London received funding, with 60.0% of the funding applied for being awarded.
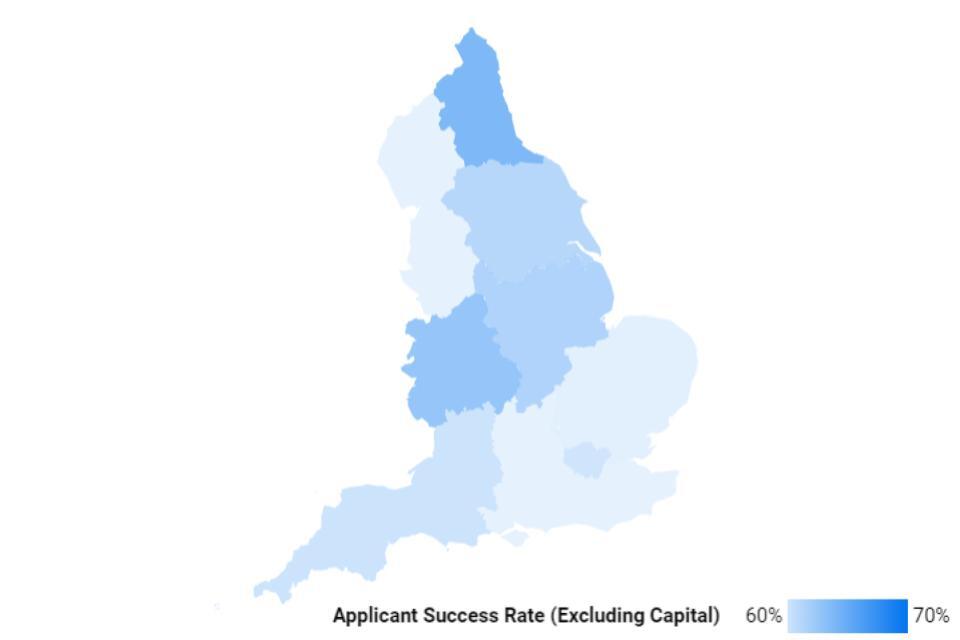
Figure 1.3 shows a heat-map of application success rates. It shows the West Midlands and the North East having high success rates.
Funding by discipline
CRF funding was awarded to firms across 12 different disciplines:
-
Heritage organisations received the greatest amount of funding (£296m), followed by theatre organisations (£288m) and music organisations (£249m).
-
Combined arts organisations (£170m), museums and archives (£107m), visual arts organisations (£53m), film organisations (£42m), dance organisations (£32m), literature organisations (£9.6m) and libraries (£1.4m) were also awarded funding.
-
The remainder of the funding (£179m) was awarded to firms in other disciplines across the cultural sector, or which are non-discipline-specific.
Funding by arm’s-length body
CRF funding was awarded by four arm’s-length bodies:
-
Arts Council England (ACE) awarded the majority of funding, totalling £1.15bn;
-
The National Lottery Heritage Fund (NLHF) in partnership with Historic England awarded £156m of funding;
-
Historic England (HE) awarded £91m of funding;
-
The British Film Institute (BFI) awarded £34m of funding to independent cinemas.
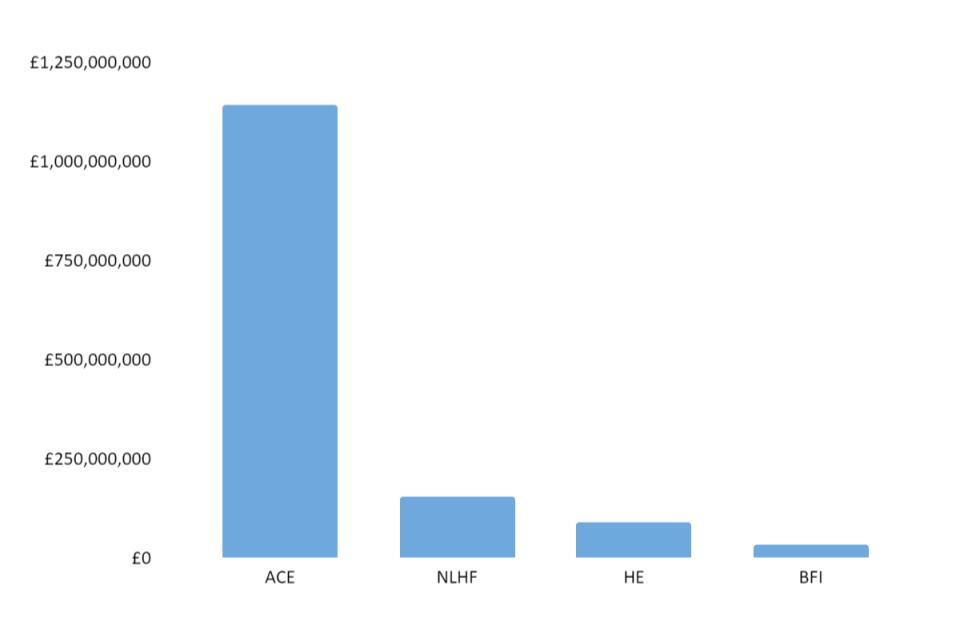
Figure 1.4 shows that Arts Council England was the distributor of the significant majority of funding.
Funding distribution according to key indices
The 2019 English Indices of Deprivation survey ranks 32,844 small areas (lower-layer super output areas) in England from most deprived to least deprived areas.
By ranking each of these areas according to their index scores and separating them into five categories ranging from very high (the most deprived areas) to very low (the least deprived areas) we can assess the distribution of CRF funding across these broad categories.
Figure 1.5 shows the average funding per capita, as well as the proportion of awards granted by quintile:
-
Areas in the most deprived areas received a greater than average proportion of funding. The most deprived areas received 32.2% of funding, with areas of high deprivation receiving 21.6%, and medium levels of deprivation receiving 24.4%.
-
Areas in the most deprived areas were also awarded a greater level of funding per capita in contrast to those with low levels of deprivation. Areas with medium levels of deprivation received the greatest funding per capita (£31.69 per capita).
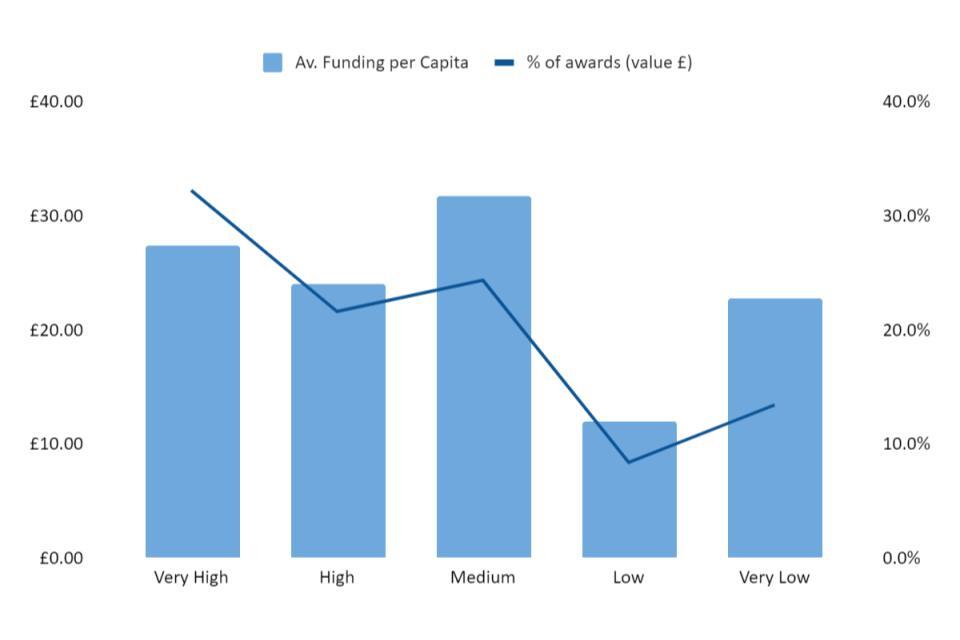
Figure 1.5 shows that areas in the most deprived areas received a greater than average proportion of funding.
The 2020 Heritage Index collects data at the local authority level. It ranks each local authority across seven categories, such as by their landscape and natural environment, or historic built environment, building a strong profile of assets across an area’s heritage. These categories are weighted and are used to calculate the final Heritage Index score for each local authority.
By ranking each of these areas, we are able to distribute them into quintiles, ranging from a very high of Heritage Index score to areas with a very low Heritage Index score. We can then use these quintiles to assess the distribution of CRF funding according to heritage categories.
Figure 1.6 shows the average funding per capita, as well as the share of awards granted by quintile:
-
It is clear that the areas with the most higher Heritage Index scores received significantly more cultural recovery funding per capita than the areas with lower Heritage Index scores. The areas with the highest scores received £47.99 of funding per capita, in contrast to £13.75 in the areas with the least. There is a clear downward trend in the data, suggesting that areas with lower Heritage Index scores received less CRF funding per capita.
-
It also appears that the areas with the higher Heritage Index scores, received a greater share of the overall funding, shown by a significant drop from the “high” category to the “medium” category.
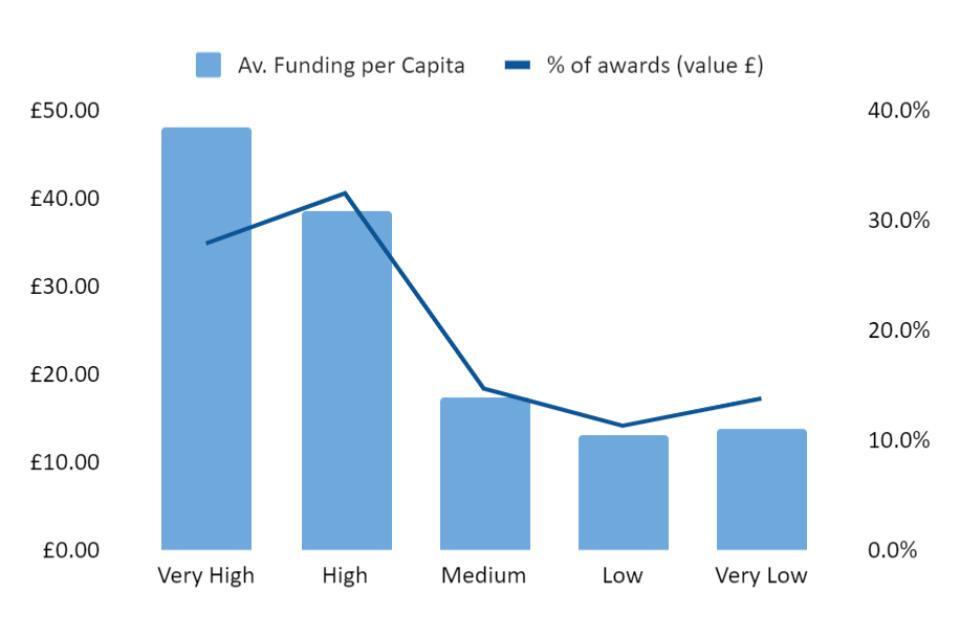
Figure 1.6 shows funding per capita compared to Royal Society of the Arts Heritage Index scores of areas. It shows that the areas with the most higher Heritage Index scores received significantly more cultural recovery funding per capita.
Figure 1.7 shows the same breakdown for heritage funding only:
-
When considering the same breakdown for only heritage funding, the difference between the areas in the very high quintile and the other categories is even more stark. 38% of all funding awarded went to local authorities with very high levels of heritage. Only 25.8% of all funding was awarded to local authorities in the low and very low categories.
-
Local authorities in the very high quintile of the Heritage Index received significantly greater heritage funding per capita than any other region (£12.03 per capita). Organisations in the low quintile received the least (£1.17 per capita).
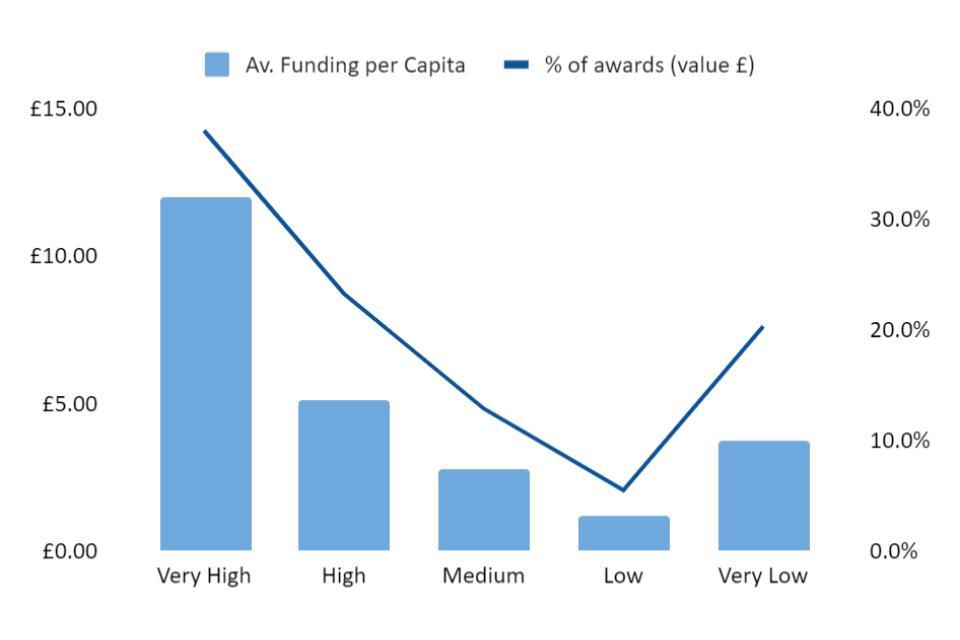
Figure 1.7 shows that when comparing awards to heritage organisations to the RSA Heritage Index, the difference between the areas in the very high quintile and the other categories is significant.
Funding distribution according to organisation size
Cultural recovery funding was awarded to a whole host of organisations, from those with just a few full time employees and volunteers to those who employ large numbers of people, all with the aim of protecting our country’s cultural and creative sectors.
Of the c. 5000 organisations who were awarded CRF funding, small firms (0 - 49 full time employees) were awarded the majority of the funding, over £900m. Medium-sized firms (50 - 249 FTEs) were awarded almost £208m, and large firms (250+ FTEs) were awarded £16m. For 592 organisations the dataset does not detail the number of employees working at their organisation. For these organisations, £300m was awarded in CRF funding.
Medium-sized firms were most successful in applying for funding, with 77.9% of applicants receiving awards, followed by small firms (61.9%), large firms (59%). Organisations for which this data is not included in our dataset were the least successful at applying for funding (46.2%). N.B. Capital figures are not included in success-rate data as some capital programmes were subject to stricter eligibility rules, and application rates are therefore not comparable to the rest of the CRF.
Funding distribution according to commercial status
Of the 5067 successful applicants who were awarded Culture Recovery Fund funding. Excluding organisations who were awarded capital funding, 1732 organisations were ‘for profit’, 2492 organisations were ‘not for profit’.
Some sub-programmes within CRF did not gather for/not for profit data in a binary fashion, meaning that it is not consistently included in the dataset. There is therefore a significant subset of organisations (249) whose commercial status is marked as “not specified in dataset” for non-capital applicants.
There was one successful for-profit applicant for capital funding, 92 not-for-profit capital awardees and 560 organisations who were awarded capital funding whose commercial status is “not specified in dataset”.
Of the 5067 firms who were awarded CRF funding, not for profit organisations were awarded the majority of funding, £714m. For profit organisations were awarded almost £378m. Firms for whom commercial status is not clear in the dataset were awarded just over £334m.
Not-for-profit organisations were more successful than others at receiving funding, with 67.8% of applicants being funded. By contrast, 57% of for-profit applicants were awarded funding. (N.B. these figures exclude capital grant awards).
Breakdown by region
This section of the release presents an analysis of the CRF funding by region.
For some organisations, it was possible for delivery bodies to estimate the breakdown of funding between sites where an organisation had multiple areas of benefit. This was done in particular by BFI and Historic England, but it was not possible across the board. Where it was possible it gives a more accurate impression of the area of benefit for the funding. Therefore for regional distribution, funding has been allocated to the sites (per estimated breakdowns), rather than by HQ location, where possible.
Key points to note from figure 2.1 are:
-
Excluding capital, the figures show that London applied for (£791m) and received more funding (£474m) than any other region.
-
Yorkshire and the Humber (74.2%) and the North East (72.6%) received the highest proportion of the funding amount applied for.
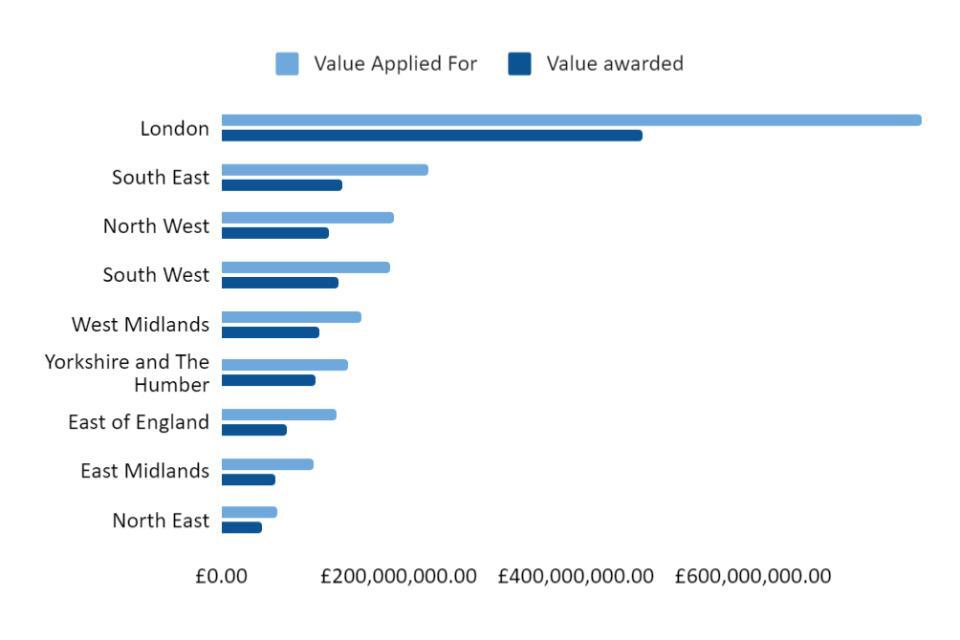
Figure 2.1 shows the amount applied for, and the amount received in each region of England. It shows that London both applied for and received more than other regions.
Figure 2.2 shows the funding awarded to each region by funding strand:
-
London received more repayable finance funding than any other region (£168m), making up a greater proportion of its funding (33.9%) than for any other region;
-
London organisations received a greater amount of capital funding than any other region (£52.6m), followed by the South West (£36.4m) and the North West (£33.3m).
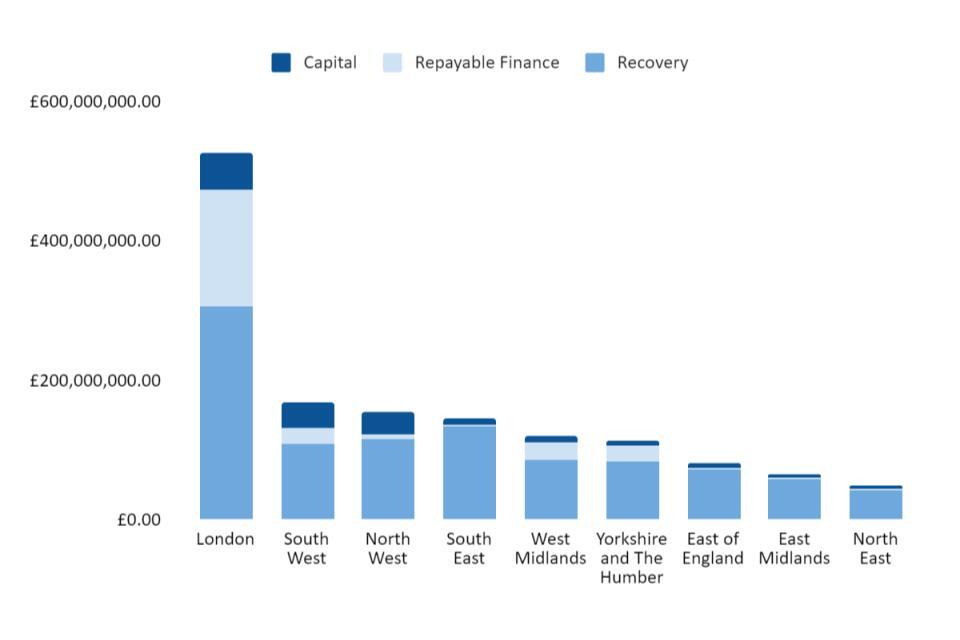
Figure 2.2 shows how regional funding totals are divided by CRF funding strand. This shows that a significant proportion of the funding for London was through the Repayable Finance programme strand.
Success Rates by Region
When excluding capital, across the three rounds of the CRF, 62.2% (4488) of applicant organisations received funding.
Figure 2.3 shows the success rates of CRF applicants by region:
-
CRF applicants in the North East were most successful at receiving funding, with 69.8% of these applicants being granted awards.
-
Applicants across the East of England (60%), the South East (59.7%) and the North West (59.6%) were the least successful at receiving funding.
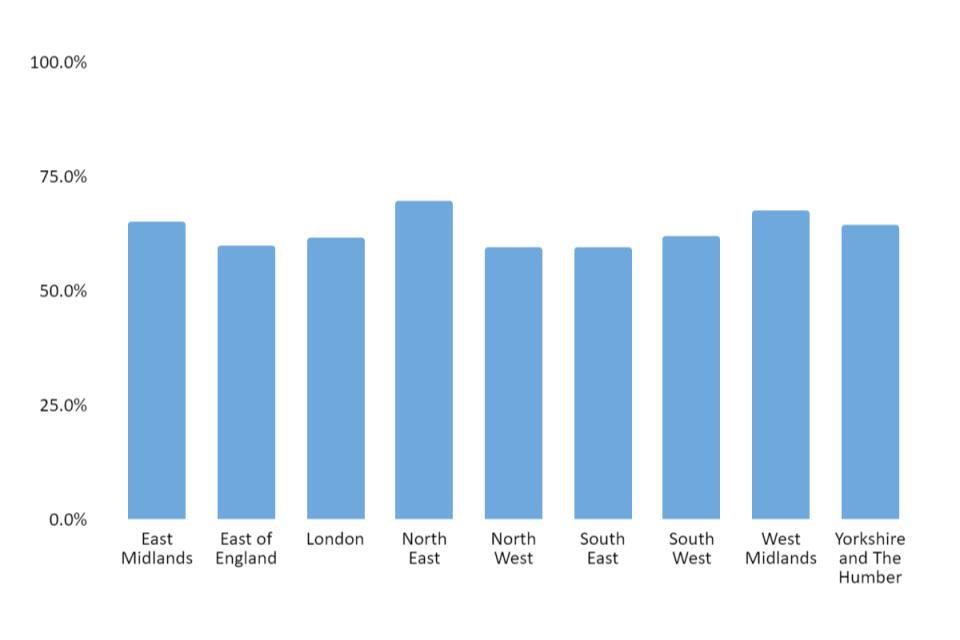
Shows the success rates of CRF applicants by region. It shows that CRF applicants in the North East were most successful at receiving funding, with 69.8% of these applicants being granted awards.
Funding per Capita
Funding amounts can be weighted for population by providing per capita breakdowns. With the exception of London as an outlier, the per capita figures show a more even regional distribution.
-
London organisations received the greatest level of funding per capita, £58.81. Organisations in the East of England received the least, at £12.98 per capita.
-
London received the majority of repayable finance funding, as it holds many of the country’s largest cultural venues, and loans were taken up more by larger organisations. Per capita, London received £18.71 of repayable finance funding. Organisations in the East Midlands received the lowest repayable finance funding per capita, £0.21.
-
The South West (£6.47) and London (£5.87) were awarded the most capital funding per capita. The South East (£0.91) received the least.
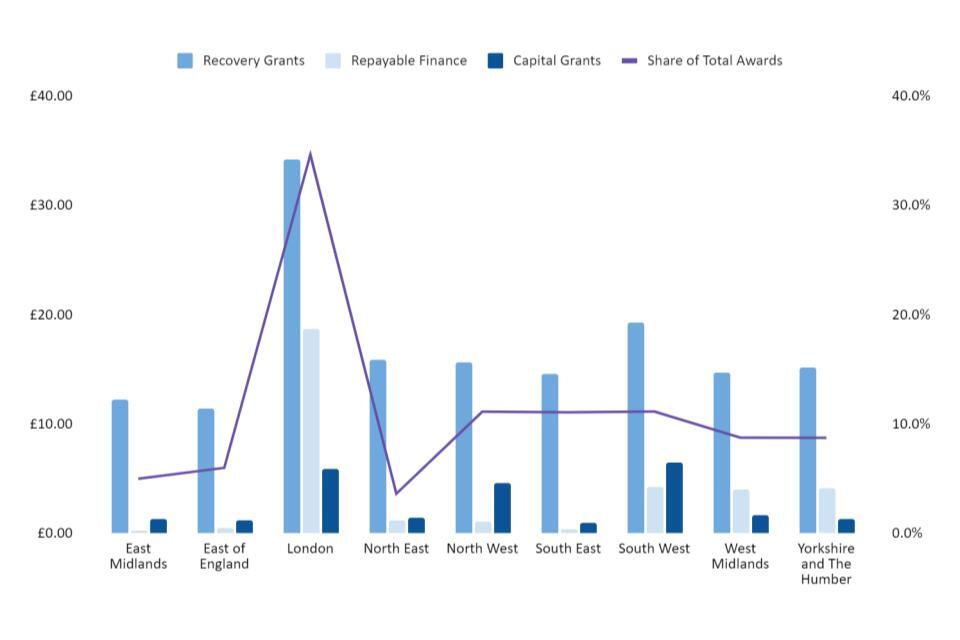
Figure 2.4 shows CRF funding per capita, and share of total awards by region, broken down by programme strand.
Breakdown by discipline
This section of the release presents an analysis of the CRF funding by discipline.
Figure 3.1 shows funding awards to organisations for each discipline, by funding strand:
-
Heritage organisations received the greatest amount of capital funding (£98.4m) and repayable finance (£67.9m).
-
Theatre organisations received the greatest amount of recovery grant funding (£216.3m).
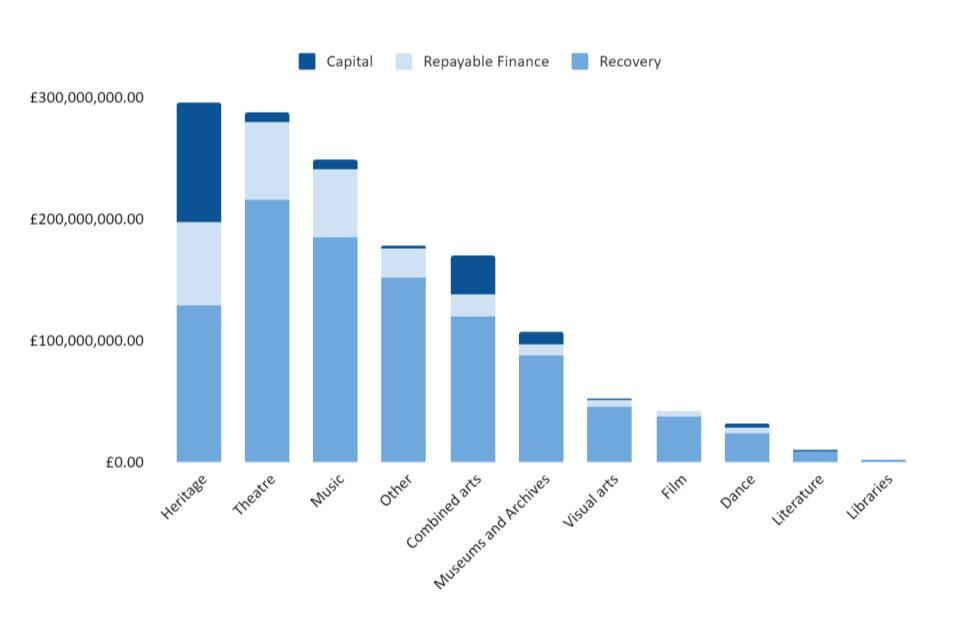
Figure 3.1 shows funding awards to organisations for each discipline, by funding strand. Heritage organisations received the greatest amount of capital funding and repayable finance.
Success rates by DCMS Disciplines
When excluding capital, across the three rounds of the CRF, 62.2% (4488) of applicant organisations received funding.
Key points to note from figure 3.2 and 3.3 are:
-
Excluding capital, theatre organisations applied for (£385m) and received (£280m) the greatest amount of funding. Libraries applied for (£1.7m) and received (£1.5m) the least.
-
Excluding capital, film organisations were awarded a smaller proportion of the funding applied for than other cultural organisations, receiving only 43.9% of the funding value applied for, below the average of 62.6%. However, film organisations were most successful in receiving at least some CRF funding, with 79.9% of applicants being granted awards.
-
Libraries (89.4%) as well as museums and archives (85.9%) achieved a higher proportion than average of the total funding they applied for. Libraries however were less likely to receive at least some CRF funding, with only 50% of applications being successful. This puts them with Heritage organisations (57.2%) at the lower end of success rate by application.
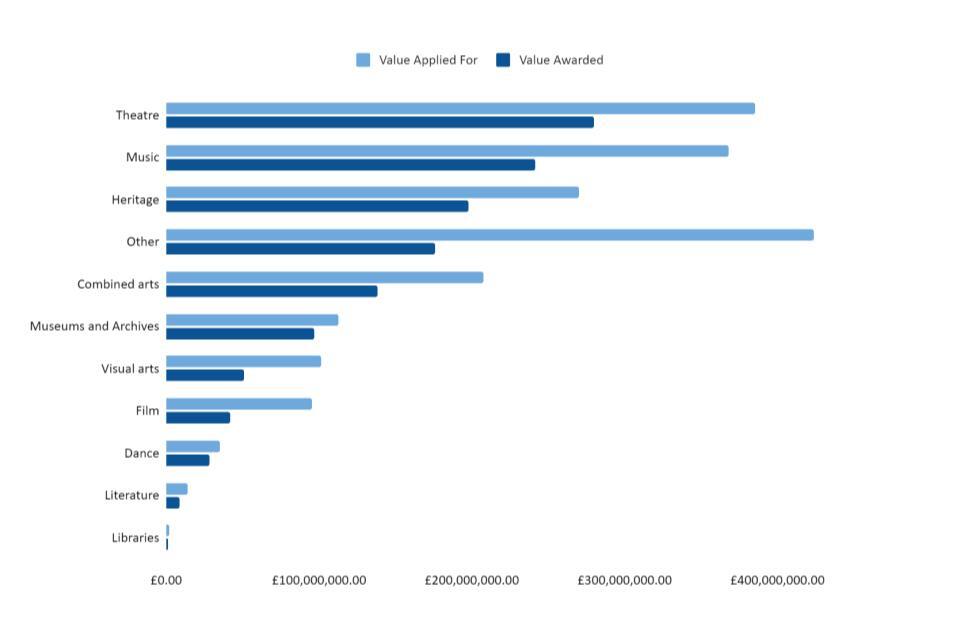
Figure 3.2 shows that, excluding capital funding, Theatre organisations applied for and received the largest amount of funding, followed by music and heritage organisations.
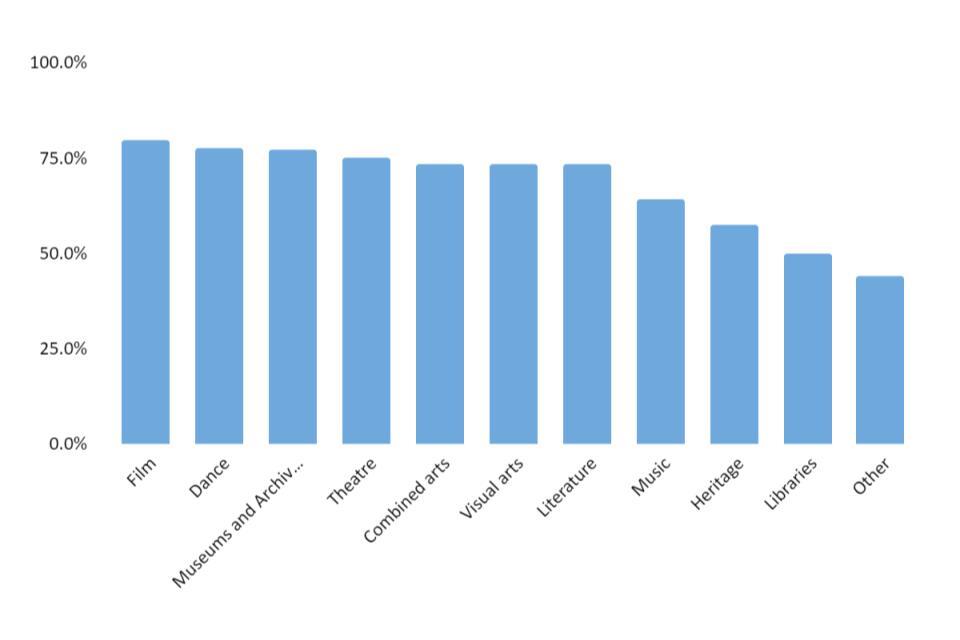
Figure 3.3. Shows that film and dance organisations had the highest success rates in applications (excluding capital), and that libraries and heritage organisations had the lowest success rates, along with “Other” sub-sectors.
Data sources
The data for this release was provided by the Department of Digital, Culture, Media & Sports arm’s-length bodies. It covers self reported data from all applicants at the most recent time of application to the Culture Recovery Fund. For instance, an organisation who has applied to the initial and final round of the CRF would be defined according to the information provided in the latter application.
This publication covers all CRF awards made by our ALBs from the start of the scheme up until the 31st March 2022, by which time all final award decisions were made. Award levels may change in the future as retrospective revisions to grants are made.
Arm’s-length Bodies (ALBs)
Details on awards made by DCMS’s ALBs through the Culture Recovery Fund are set out on ALB websites. These are periodically updated as grant values change, and as new grants are made:
-
Arts Council England CRF data webpage
-
National Lottery Heritage Fund: Grant decisions webpage
-
British Film Institute CRF webpage
-
Historic England CRF data webpage
The awards data from our ALBs used in this report is accurate as of April 1st 2022 - the end of the grant-making phase of the programme. It is likely that there will be slight revisions to the total figures as grants values change or awardees decide to not use all of their available funding.
External Data
For the purpose of transparency, we have included a breakdown of CRF funding by local authority, according to several indices in this report:
- English Indices of Deprivation 2019
- RSA 2020 Heritage Index 2020
- Taking Part 2019/20 - Arts
- Estimates of the Population for the UK, England, Wales, Scotland and Northern Ireland
Background
The Culture Recovery Fund was an unprecedented fund set up to tackle the crisis that has faced our most loved cultural organisations and heritage sites during the coronavirus (COVID-19) pandemic. The Culture Recovery Board was created to oversee the delivery of the Fund.
In response to the coronavirus (COVID-19) pandemic and the unprecedented challenges it brought to culture and creativity across the UK, the government announced a series of measures in March 2020 to help save these sectors, maintaining jobs and keeping businesses afloat.
On 5 July 2020, the Department for Digital, Culture, Media & Sport announced a £1.57 billion Culture Recovery Fund rescue package for cultural organisations to help the sector survive, and when possible, reopen.
On 25 June 2021 the third round of the Culture Recovery Fund was announced to provide further support to cultural, heritage and creative sectors as they recover and reopen. Grants are no longer being made through the Culture Recovery Fund, with final grant offers announced in March 2022. Links with further information on the funds can be found on the website of each delivery body:
Up to date information about the Culture Recovery Fund can be found on the GOV.UK website.