Evaluation Academy - Final Evaluation Report 2025 (HTML)
Published 29 October 2025

© Crown copyright 2025
This publication is licensed under the terms of the Open Government Licence v3.0 except where otherwise stated. To view this licence, visit nationalarchives.gov.uk/doc/open-government-licence/version/3 or write to the Information Policy Team, The National Archives, Kew, London TW9 4DU, or email: psi@nationalarchives.gov.uk.
Where we have identified any third party copyright information you will need to obtain permission from the copyright holders concerned.
This publication is available at https://www.gov.uk/government/publications/evaluation-academy-final-evaluation-report/evaluation-academy-final-evaluation-report-2025-html
This evaluation was conducted by the Evaluation Task Force, a joint Cabinet Office and HM Treasury unit.
| Project Title | Evaluation Academy 2025 - Impact and Process Evaluation |
| Principal investigator(s) | Lydia Beckett, Dr. Jack Blumenau, Jake Dolby, Prof. Oliver Hauser, Miriam Styrnol |
| Design | - Impact evaluation - Two-armed waitlist randomised controlled trial - Implementation and Process evaluation |
| Evaluation setting | Hybrid (Intervention delivered in person, data collection conducted online) |
| Target group | Civil servants |
Executive Summary
- The Evaluation Academy is a capability building course, developed by the Evaluation Task Force (ETF), which uses a train-the-trainer model to improve civil service analysts’ ability to teach others about evaluation methods. The ETF conducted an impact evaluation (IE) and an implementation and process evaluation (IPE) of the first stage of the Evaluation Academy’s train-the-trainer model in July 2025.
- The impact evaluation employed a randomised controlled trial (RCT) which used a two-arm, individual-level waitlist design to investigate the impact of the Evaluation Academy on two primary outcomes – participants’ confidence in delivering evaluation training and the size of participants’ evaluation network – and one secondary outcome – participants’ knowledge of evaluation methods and processes.
- The impact evaluation demonstrated large and significant effects of the Evaluation Academy on both primary outcomes. Compared to those in the control group, participants reported substantially higher levels of confidence in delivering evaluation training (an average increase of approximately 1-point on a 5-point scale) as well as substantial increases in the size of their cross-government evaluation networks (an average increase of 8 people).
- By contrast, the impact evaluation found more limited evidence of impact on participants’ knowledge of evaluation methods and processes. Although treatment group participants performed better on average than the control group on a post-intervention set of evaluation knowledge questions, this difference was not statistically significant. The absence of large knowledge effects reflects the fact that civil servants participating in the first stage of the train-the-trainer model had reasonably high levels of pre-existing evaluation knowledge.
- The implementation and process evaluation aimed to understand participant and teacher experiences of the Evaluation Academy to inform future delivery. Data was collected from surveys, participant and teacher feedback, a focus group, and observations. Key findings revealed that the Academy was well-organised, and the in-person format, mixed groupings, and external expert support enabled networking and confidence building. Barriers included the intense pace, assumed prior knowledge, and text-heavy slide packs. Participants recommended refreshing materials, clearer expectation setting, and more support for online/hybrid delivery in the future.
- The IPE complemented the IE, broadly finding that it was delivered as intended which was key to delivering the key outcomes and obtaining positive feedback from participants. It also provided clear recommendations for improving future iterations of the Academy to maximise its impact and usefulness to participants in Phase 2 which is crucial for the overarching aim of the course to improve the quantity and quality of evaluation across government.
1. Introduction
1.1 Background
The Evaluation Academy is a training programme designed to increase analytical civil servants’ ability to teach policy evaluation skills, with the ultimate aim of improving the quantity and quality of evaluation across government. Conceived and delivered by the Evaluation Task Force (ETF), a joint Cabinet Office and HM Treasury unit, the Academy was created in response to a National Audit Office and Public Accounts Committee report (National Audit Office 2021) which identified skills shortages as a long-standing barrier to evidence-based policymaking.
The Evaluation Academy is a train-the-trainer model which follows a two-stage process:
- In stage 1, evaluation specialists train a group of analytical civil servants (“the participants”) to provide evaluation training. In this stage, the Academy focuses on improving the ability of participants to deliver training on a variety of topics, such as technical evaluation methods and planning and managing evaluations. This component of the Academy is delivered in person in a five-day workshop spread over two weeks.
- In stage 2, participants then use the materials and skills developed in stage 1 to provide training in evaluation methods and skills to others in their home departments. Departmental models of delivering this training differ, with some concentrating delivery in short periods of time, and others delivering the training over longer time periods.
The initial design of the Academy was developed to overcome a range of issues reported by participants of existing internal and external evaluation training. Interviews with participants on previous rounds of the Evaluation Academy revealed that these courses were prohibitively expensive for most departments; did not include relevant content that could be easily applied to departmental contexts; or were often too high level, only providing a short introduction to evaluation methods. As a result, the train-the-trainer model of the Evaluation Academy was designed to offer cost-effective, in-depth, customised training that can be rolled out across departments.
The ETF has delivered the Academy for two consecutive years, and has conducted research with these participants to understand the delivery and perceived impact of the training. This is the first impact evaluation of the Academy on participant outcomes. The ETF delivered stage 1 of the Academy for a third time in July 2025. This represented an opportunity to gather evidence on the train-the-trainer stage (stage 1) of the programme, which has matured over multiple rounds of delivery[footnote 1].
This report describes the impact and process evaluation conducted by members of the Evaluation Task Force for stage 1 of the Evaluation Academy. The impact evaluation employs a waitlist randomised controlled trial (RCT) design, measuring the effects of the Academy on participants’ confidence in delivering evaluation training, the size of participants’ evaluation networks across government, and on participants’ knowledge of evaluation methods. The process evaluation provides an understanding of participants’ experiences and insight into the implementation of the programme.
1.2 Intervention
Who
Stage 1 of the Evaluation Academy is aimed at upskilling UK government evaluation specialists to provide evaluation training in their home departments. Prospective recipients of the intervention were nominated by central evaluation teams across government departments, arm-length bodies, and non-departmental public bodies. Departments were only able to nominate individuals with prior experience in evaluation methods and delivery. This was necessary as this stage of the Academy focusses on upskilling participants in how to deliver evaluation training to others, rather than on developing their skills in the practice of evaluation itself. Participants were eligible if they had not participated in the stage 1 training before and if they were able to attend each day of the workshop.
What
Participants of the Academy were provided free, in-person training over the course of five days across a two-week period. The course material for the workshop was split across 10 modules: Introduction to evaluation; Theories of change; Scoping an evaluation; Process evaluations; Experimental designs; Quasi-experimental methods; Theory-based evaluations; Value for money evaluations; Planning and managing an evaluation; Communicating evidence[footnote 2].
The Evaluation Academy aims to ensure that participants will be able to deliver and explain the content of the course to a high level. The goal is for participants to be able to both understand and deliver the theoretical material on evaluation, as well as to be able to explain to participants how to apply the content in real-life evaluation scenarios.
The first week of training was delivered by evaluation experts from the Evaluation Task Force, the Evaluation and Trial Advice Panel[footnote 3] (ETAP), and by previous trainers trained through the Academy. Participants were split into three cohorts and each cohort received instruction of three modules from the list above, followed by coaching on how to deliver those modules. All cohorts were trained to deliver the final module, Communicating evidence.
In the second week, participants then taught the modules they studied in week one to participants in other cohorts. Participants received the associated slides, facilitator guide and technical guidance for the modules they were teaching, and they delivered training to other participants in a two-hour long session. These materials, alongside training from evaluation experts, were intended to provide participants with the confidence and ability to deliver training to their Academy peers, before going on to train others in their department in the future.
In addition, ‘extracurricular’ sessions that included presentations and speeches from senior stakeholders as well as previous trainers aimed to provide further motivation and to build participants’ confidence in promoting evaluation across the Civil Service.
All activities for the Academy took place in-person rather than online, as formative evaluations of the previous two cohorts of the Academy had highlighted the benefits of this delivery model for participants. The five-day in-person course allows participants to build professional connections with fellow attendees, and highlights common barriers/opportunities faced by attending analysts. When facilitating the training, a strong emphasis is therefore put on allowing participants to collaborate and independently discuss the material and how it applies to their individual contexts. A key rationale for in-person delivery is that the Academy aims to foster analysts’ cross-departmental professional networks.
When
The version of the Academy studied in this trial took place between 1st July and 9th July 2025. The first week of the Academy involved the delivery of training from the group of contributing evaluation experts. The second week included participants’ delivering training of the modules to their Academy peers.
1.3 Theory of Change and Participant Outcomes
A Theory of Change (ToC) was developed for the Evaluation Academy by members of the Evaluation Task Force (see Figure 1). The inputs column on the left hand side of the ToC outlines the resources, activities and materials that go into running stage 1 of the Academy. The outputs column details the deliverables that are produced and the data that is captured.
The figure separately presents outcomes for the Academy in short-term and long-term categories. The short-term outcomes relate to the types of changes that the Academy is expected to induce in participants in stage 1 (i.e. in the train-the-trainer phase of the Academy). The long-term outcomes are those which are expected to manifest after stage 2 of the academy (when participants go on to train colleagues in their departments). Finally, the impact column outlines the intended impact that the Evaluation Academy is expected to have on government evaluation capability, delivery and networks in the long run.
In this trial, we concentrate particularly on those short-term outcomes that are associated with stage 1 of the Academy. Due to the variation in delivery of stage 2 of the Academy, it was not practical to include the second stage of delivery within this study. This will require another phase of evaluation to consider the delivery and effect of training in departments. For stage 1, the most relevant outcomes are those that relate to participants’ ability to deliver evaluation training in their home departments.
The main purpose of the first stage of the Academy is to improve participants’ confidence and ability to deliver evaluation training, to build participants’ connections with other evaluation specialists across government, and to ensure that participants have a comprehensive baseline knowledge of evaluation before they deliver training in their home departments. While these all represent short-term outcomes, our Theory of Change reflects our working hypothesis that increased confidence, networks and knowledge will improve the evaluation skills of other civil servants who are subsequently trained by Academy participants. This is supported by existing research into the train the trainer model in other contexts (Nexo et al, 2024; Yarber et al, 2015), however, assumes that this holds to the specific context of government capability building.
Increased confidence in delivering training is expected to improve the quality and clarity of instruction received by other civil servants in participants’ home departments. Expanded evaluation networks enable participants to draw on peer support and shared learning, increasing the consistency and quality of evaluation practice across government. A strong foundational knowledge of evaluation methods ensures that participants are equipped to deliver accurate, credible, and methodologically sound guidance to others. While measuring long-term effects of the Academy will require further research on the second stage of delivery, demonstrating that the Academy’s first stage has positive effects on these short-term outcomes would therefore represent an important confirmation of key links in the Theory of Change for the programme as a whole.
We classify confidence in delivery and the size of participants’ evaluation networks as our primary outcomes, and evaluation knowledge as a secondary outcome, based on the Academy’s intended role in enabling participants to teach others and embed evaluation practice within their departments.
Confidence in delivering training and communicating evaluation findings is a direct mechanism through which the Academy supports a train-the-trainer model. Networks matter because effective evaluators rarely work in isolation – peer support and shared learning are critical enablers of high-quality evaluation work. These outcomes represent the clearest short-term pathways through which the Academy can influence broader evaluation capacity.
We treat evaluation knowledge as secondary because the training is not aimed at novices; participants are expected to enter the programme with a reasonable baseline of evaluation knowledge. While it is clearly a relevant measure of individual learning, the expected gains of the first stage of the Academy are therefore smaller and more variable, given the expected level of participants’ pre-existing understanding.
| Process: Inputs | Process: Outputs | Impact: Short-Term Outcomes | Impact: Long-term outcomes | Impact |
|---|---|---|---|---|
| Buy-in from key, senior stakeholders into the need for the Academy Budget required to procure a contractor to facilitate the course Budget required to enable all participants, facilitators, and trainers are able to attend in person Communication with departments to recruit attendance Lecture theatre and breakout rooms to host sessions Production of course material Co-design of content and provision of relevant case studies with departments Adapting materials to suit departmental needs based upon previous deliveries of the Academy Resource from ETF and current trainers to deliver the course materials Attendance from analysts across government departments Survey to capture relevant pre/post academy metrics |
Deliverables 5 days across a 2 week period 10 modules covering technical evaluation method training, soft skills, and project management Training on how to effectively present material back to team members after the course Data Monitoring of number of participants receiving training Pre and post survey data capturing understanding of evaluation methods/importance of evaluation Feedback from departments on what elements of the course worked well and what could be improved Departments/individuals 64 participants receive training Approximately 200 old and new trainers receive networking opportunities |
Primary outcomes Trainers… …increased confidence and ability in presenting the material …increased size of trainers’ evaluation networks across government Secondary outcomes Trainers… …increased technical knowledge of evaluation methods …increased ability to develop robust and proportionate evaluation plans for policies/programmes …increased planning and project management skills in order to deliver high quality evaluations …increased ability to advocate for why evaluation should be included across the policy cycle …increased ability to influence policy design to support evaluation |
Trainers… …upskill a broader cohort of analysts across government Government… …increased number of analysts trained in evaluation methods …increased number of policies and programmes with high quality evaluation plans The Academy… …monetary savings to HMG by delivering training through the train-the-trainer model …a sustainable and adaptable evaluation capabilities offer for government |
Departments build strong internal evaluation training capabilities to support development across the GSR and analytical professions. The importance of evaluation is recognised across government. Government has the resource and capability to deliver evidence-based policymaking across departments. Establishment of a sustained cross-departmental network of evaluation specialists |
Figure 1: Theory of Change diagram for the Evaluation Academy, from left to right: inputs, outputs, short-term outcomes, long-term outcomes, and impacts
1.4 Research Questions
1.4.1 Impact Evaluation
Using the participants’ outcomes identified in the Theory of Change, we developed two primary research questions, and one secondary research question to be tested in this study. The aim of the impact evaluation is to answer these research questions.
Primary research questions:
- What impact does the train-the-trainer stage (stage 1) of the Evaluation Academy have on participants’ confidence in delivering evaluation training?
- What impact does the train-the-trainer stage (stage 1) of the Evaluation Academy have on the size of participants’ evaluation networks?
Secondary research question:
- What impact does the train-the-trainer stage (stage 1) of the Evaluation Academy have on participants’ technical knowledge of evaluation processes and methods?
1.4.2 Implementation and Process Evaluation
Alongside the impact evaluation, we also conducted an implementation and process evaluation (IPE). The main aims of the IPE were:
- To understand what participants thought about the Academy;
- To identify factors that helped or hindered participants’ engagement with the Academy;
- To gather feedback from participants about how the delivery and benefits of the Academy could be maximised;
The research questions addressed in the IPE were:
- Was the Academy delivered in the way that was envisaged?
- What were the key opportunities and barriers to effective participation in the Academy?
- What were participants’ experiences of attending the Academy?
- What are participants’ recommendations for improvement of the training in the future?
1.5 Ethics
This study received ethical exemption from the UCL Department of Political Science research ethics committee. The study was deemed exempt from ethics approval because of the low-risk nature of the research and the fact that the research only involved the use of educational tests, survey and interview procedures on participants in the public arena.
2. Impact Evaluation
| Trial design, including number of arms | Two-arm, individual-level waitlist randomised controlled trial |
| Unit of randomisation | Individual civil servants |
| Stratification variables | Department |
| Primary Outcome(s): Variable | 1. Confidence in Delivering Evaluation Training 2. Size of Evaluation Network |
| Primary Outcome(s): Measurement (instrument, scale, source) | 1. Bespoke survey with two confidence questions using the mean response to form a single “Evaluation Confidence” scale 2. Bespoke survey with single question with integer outcome |
| Secondary Outcome: Variable | Evaluation Knowledge |
| Measurement | Evaluation Knowledge Scale (online survey, 27 item battery, see annex 6.1) |
2.1 Evaluation Design
The design and analysis strategy were pre-registered prior to the delivery of the Academy, and a pre-analysis plan was published on the Open Science Framework repository (Beckett et al. 2025)[footnote 4]. All design choices and analysis decisions described below were implemented as described in the pre-analysis plan.
This trial used a two-arm, waitlist RCT design. Randomisation was conducted at the level of individual civil servants. In total, 118 participants were recruited for participation in the trial, which represented a slight under-recruitment versus our target of 126. Individuals were recruited from central evaluation teams within departments, as detailed in section 2.4 below. The Academy had capacity for 63 training places, which led to a somewhat imbalanced allocation ratio with 63 treatment units and 55 control units. Participants were aware of their treatment status, as those assigned to the treatment group attended the July 2025 Academy training, while those in the control group were informed they would be offered a place in a future round.
Randomisation was blocked by department, such that participants were randomly assigned to treatment or control within their own departmental group. This ensured approximate treatment-control balance within each department. However, as the number of participants from each department was uneven with some odd numbers, treatment probabilities varied across departments. The maximum treatment probability was .66 and the minimum probability was .44. Randomisation was conducted after baseline data collection. We account for the unequal treatment probabilities within blocks in the analysis strategy described in section 3.
Treatment group respondents received the stage 1 of the Evaluation Academy training in July 2025. Control group respondents did not receive the training in July 2025, but were scheduled to receive the same training in November 2025.
2.2 Data Collection
The primary data for this study came from survey instruments designed by members of the Evaluation Task Force and distributed online. Baseline survey data which captured information relating to both the primary and secondary research questions for the impact evaluation (described in more detail below) was collected before randomisation into treatment and control groups, approximately 6 weeks before the intervention. The baseline survey was distributed through an email containing a link to a self-completed online survey hosted on Qualtrics.
Endline survey data was collected from both treatment and control groups immediately after the intervention ended (i.e. after the trainer-the-trainer training). For the treatment group, endline survey data was collected via a self-completed online survey that participants were instructed to complete in-person during the final session of the Academy. Participants were briefed before beginning the survey that they should not collaborate with each other or use anything other than their own knowledge to complete the survey. The survey was conducted in silence, with an invigilator in the room to prevent participants from discussing the survey with one another[footnote 5]. The control group participants were emailed the online survey to complete at the same time and were encouraged to complete it as soon as possible. The control group were sent two reminders to complete the endline survey and all control group responses were received within 28 days of the treatment-group data collection. The trial experienced very limited attrition, with endline data collected from 96.6% of participants (95.2% in the treatment group, and 98.2% in the control group).
Once data collection for each survey was complete, researchers in the Evaluation Task Force cleaned and validated the data. ETF researchers then implemented the analyses described below.
2.3 Outcomes
The evaluation team undertook a rapid review of outcome measures that might be used to measure the core concepts of interest in the primary and secondary research questions: confidence in teaching evaluation, the size of evaluation networks, and evaluation knowledge. We considered two survey instruments used at different stages of the Academy in previous years: a survey used in the 2024 delivery of stage 1 to capture technical evaluation knowledge; and a pre/post survey designed by Cabinet Office colleagues to measure confidence in evaluation methods and processes after stage 2. However, neither included measures suitable for the primary outcomes of this study. We also referred to a reasoning scale developed by Drummond and Fischhoff (2017) designed to capture the skills needed to read and evaluate scientific evidence. However, this scale is not well-tailored to measuring evaluation knowledge, particularly in the context of evaluation in government. This review therefore indicated that there are no existing tools or measures that are immediately suitable for measuring the outcomes of the Evaluation Academy.
We therefore developed a bespoke survey which aimed to measure the two primary outcomes of our study (confidence in communicating about evaluation and size of evaluation network) and the secondary outcome of our study (evaluation knowledge). In developing the survey, the research team drew on the Theory of Change for the Academy, as well as on the materials used in the delivery of the Academy. We pre-tested this survey on a small number of evaluation experts from the Evaluation Task Force. We also received input on the survey design from two expert reviewers from outside of HM Government. We made several changes to the design of the survey in response to feedback from these reviewers.
In addition, following our baseline data collection (but before the delivery of the Academy) we also conducted some additional analyses to determine the reliability of our survey items, particularly those designed to measure evaluation knowledge (our secondary outcome measure). In particular, we investigated the discrimination and difficulty of the battery of evaluation knowledge items using an item response theory (IRT) model. We used this model to identify any questions that were insufficiently difficult, such that almost all respondents answered them correctly in the baseline survey. In addition, we also used this model to identify questions which fail to differentiate sufficiently between participants of varying knowledge levels. As a result of this analysis, we decided to exclude 10 items of the knowledge battery from our analysis of the RCT. These items either were too easily answerable by the vast majority of our respondents or were ineffective at distinguishing between participants with higher/lower levels of evaluation knowledge. We made no other changes to the survey instrument between baseline and endline data collection. We provide more detail of this IRT analysis in annex 6.2 and we provide the full survey instrument for all of the questions that inform our outcome variables in annex 6.1.
In the next sections, we describe the survey questions that we used to measure these concepts and the construction of the outcome variables derived from those measures. We present the distributions of both our primary outcomes and our secondary outcome in Figure 8 in annex 6.6.1.
2.3.1 Primary Outcomes
Confidence in Delivering Evaluation Training
We asked two questions aimed at assessing the confidence of participants in delivering evaluation training and communicating technical information to non specialists. These questions are presented in a grid format, with a common introduction text:
How would you rate your confidence in the following…
- Delivering evaluation training to members of your department
- Communicating technical evaluation methods to non-specialists
Each of the items in this battery were Likert scale questions, using a five-point scale ranging from “1 = Not at all confident” to “5 = Completely confident”.[footnote 6]
The outcome variable we use in our primary analysis is formed from the mean response of participants across these two questions[footnote 7]. We denote the score on this variable for a given respondent i in a given survey wave t as Confidenceit.
Size of Evaluation Network
We asked one question aimed at assessing the size of a participant’s evaluation network across government:
Approximately how many individuals across government would you feel comfortable approaching for advice on evaluation? Please insert a number below.
Participants then input a numerical response. We use this number in its raw form as our outcome variable, which we denote for respondent i in a given survey wave t as EvaluationNetworkit.
2.3.2 Secondary Outcome
Evaluation Knowledge
The secondary outcome variable we use for our analysis is based on 27 questions which cover a wide range of evaluation-related subjects, such as developing a Theory of Change, scoping an evaluation, and technical knowledge of process, impact and value for money (VfM) methodologies. The battery consists of questions asking participants to directly recall content from the 10 modules, in addition to questions asking them to apply this knowledge to real-world scenarios.
We calculated the proportion of correct responses across these questions and used this as our outcome variable[footnote 8]. We denote the score on this variable for a given respondent i in a given survey wave t as EvaluationKnowledgeit
2.4 Sample
The target population for this evaluation was civil servants working in evaluation roles across UK government departments, arm’s-length bodies (ALBs), and non-departmental public bodies. To recruit participants, central evaluation teams within these organisations were each invited to nominate up to 10 individuals to take part in the Academy. Nominees were required to meet the following eligibility criteria:
- Have prior experience in delivering evaluations in government (c. 2 years experience)
- Not have previously participated in stage 1 of the Evaluation Academy
- Be able and willing to deliver at least two Evaluation Academy sessions in their home department each year following the training
- Be available to attend all sessions of the July 2025 Academy
Nominations from departments were reviewed by a member of the Evaluation Task Force, and eligible individuals were enrolled in the study. In this review process, a small number of nominees were rejected based on the fact that they were unable to attend all five days of training. This sample formed the basis for randomisation into treatment and control groups as described in section 2.5 below. The final sample comprises 118 civil servants from across a broad set of departments and public bodies.
The sample is not likely to be representative of broader populations of civil servants. It is, in essence, a convenience sample of those departments and individuals who were interested in receiving training through the Academy and met the eligibility criteria. This represents a potential limitation to the external validity of the trial, as it means we cannot be confident that the effects that result from the trial population would replicate if the training was rolled out more broadly across government evaluators. That said, concerns about external validity may be limited in this context, as the Academy is a relatively standardised intervention with content designed to be broadly applicable, and there are no strong theoretical reasons to expect substantial variation in treatment effects across different types of analysts.
2.5 Randomisation
Randomisation was conducted using R on 19th May 2025. The randomization was conducted at the individual level, blocking on department. Using blocked-randomisation serves two purposes in this context. First, from a delivery perspective, blocking ensured that departments received roughly equal proportions of participants in the July 2025 delivery of the Academy[footnote 9]. Second, from an analytical perspective, blocking by department ensures that the treatment and control groups have similar distributions of departments across participants, something which tends to improve the precision of the estimates of the treatment effects of interest (Gerber and Green 2012, 110).
2.6 Analysis Strategy
We estimate the intention to treat (ITT) effect of participating in stage 1 of the Academy using a covariate-adjusted linear regression model.[footnote 10] The model we use estimates the degree to which participation in the Academy affected three key outcomes – Confidence in Delivering Evaluation Training (primary), Size of Evaluation Network (primary), and Evaluation Knowledge (secondary) – by comparing participants who received the training (treatment group) to those who didn’t (control group).
To maximize statistical power and precision, the analysis accounts for baseline measures of the outcomes, participants’ department, and their civil service grade. Because participants were randomly assigned to groups within their departments (blocked randomisation), the model includes department fixed effects to ensure that we compare treatment and control groups fairly within the same department block.
We pre-specified three directional hypotheses corresponding to our research questions described in above. Given the directional nature of these hypotheses – that the Evaluation Academy will improve trainer confidence, network size, and evaluation knowledge – we use one-tailed tests to assess each of these hypotheses.[footnote 11]
- H1: The train-the-trainer stage (stage 1) of the Evaluation Academy has a positive impact on participants’ confidence in delivering evaluation training
- H2: The train-the-trainer stage (stage 1) of the Evaluation Academy has a positive impact on the size of participants’ evaluation networks
- H3: The train-the-trainer stage (stage 1) of the Evaluation Academy has a positive impact on participants’ evaluation knowledge
To ensure valid inference despite the blocked design and modest sample size, we rely on a randomisation inference procedure for p-values and confidence intervals. Finally, we use the Benjamini-Hochberg (1995) procedure to control the False Discovery Rate and account for multiple hypothesis testing. A full description of the analysis strategy can be found in annex 6.3.
2.7 Participant Flow
The number of participants recruited into the panel was 118. After baseline survey collection, these individuals were block-randomised by department to treatment and control groups, with 63 allocated to the treatment group and 55 allocated to the control group. The trial experienced a very small amount of attrition due to some participants dropping out of the trial and not completing the endline survey. The attrition rates by treatment group are given in Table 1 below.
| Category 1 | Category 2 | Treatment | Control | Total |
|---|---|---|---|---|
| Number of individuals | Randomised | 63 | 55 | 118 |
| Included in endline analysis | 60 | 54 | 114 | |
| Attrition | Number | 3 | 1 | 4 |
| Percentage | 4.8% | 1.8% | 3.4% |
Table 1: Data table showing individual attrition from the participants recruited into the panel
In the analyses described below, our sample therefore includes 114 respondents in total, with 60 treatment group respondents and 54 control group respondents. In annex section 6.7, we assess whether the (very limited) attrition we observe is consequential for the results we present using an extreme-bounds analysis (Lee 2009) and find that our results are not affected by attrition. In addition, of the 60 treatment group respondents included in the endline analysis, seven respondents failed to attend the Academy (but did provide both baseline and endline data), resulting in one-sided non-compliance in our analysis sample.[footnote 12] Annex section 6.7 assesses the consequences of this non-compliance using a two-stage least-squares approach. We again find that non-compliance does not affect any of the substantive results that we report.
2.8 Balance in Baseline Characteristics
Table 2 presents individual level characteristics for the treatment and control groups at the point of analysis taken from the baseline survey. The figures presented here show that with just a small amount of attrition, randomisation resulted in two balanced groups in our trial. The average network and knowledge scores were slightly higher in the treatment group at baseline but these differences are not statistically significant. This coincides with there being a slightly higher percentage of participants from senior grades (G7 and above) in the treatment, however the difference relative to the control group is again not statistically significant. Blocking randomisation by department also ensures that the treatment and control groups have similar distributions of departments across participants. Taken together, Table 2 indicates that imbalance in baseline characteristics and outcomes between treatment and control groups is unlikely to be a threat to inference in this setting.
| Category | Treatment Group | Control Group | All |
|---|---|---|---|
| Mean confidence score | 2.95 | 3.12 | 3.03 |
| Mean network score | 7.58 | 7.24 | 7.42 |
| Mean knowledge score | 0.67 | 0.65 | 0.66 |
| Grade (%): | |||
| HEO/SEO | 53.33% | 55.56% | 54.39% |
| G7/G6/SCS | 46.67% | 44.44% | 55.61% |
Table 2: Mean baseline characteristics of treatment and control groups, including confidence, network and knowledge scores as well as the percentage of each group at different civil service grades. None of the differences between treatment and control groups are statistically significant at conventional levels.
2.9 Results
The results from the regression analyses (described in section 2.6) are presented in Table 3 and Figure 2. These analyses investigate the relationship between attending the Academy and the endline responses for each of three outcomes, while controlling for the relevant baseline responses and the department and the grade (measured at baseline) of Academy participants.[footnote 13]
Table 3 includes two presentations of the estimated effects. The “Estimated effect” column describes the size of the estimated effect in units of the original outcome variables. In addition, the “Standardised effect” column describes the size of the estimated effects in standard deviation units of the outcomes as measured from the control group at endline. The standardised effect sizes make it easier to facilitate comparisons of treatment effects across our outcome variables, which are all measured on different scales.
| Outcome | Estimated effect | 95% Confidence interval | Standardised effect | n | P-value |
|---|---|---|---|---|---|
| Confidence in Delivering Evaluation Training | 0.84*** | [0.6, 1.08] | 0.92 | 114 | 0.00 |
| Size of Evaluation Network | 7.97*** | [2.23, 13.99] | 1.25 | 114 | 0.00 |
| Evaluation Knowledge | 0.03 | [-0.01, 0.07] | 0.22 | 114 | 0.07 |
- p < 0.05, ** p < 0.01, *** p < 0.001
Table 3: OLS regression estimates for outcome variables (confidence, network size and knowledge) at endline. Covariates include the baseline measures of the relevant outcome and participants’ department and grade at baseline. Standardised effect sizes represent control-group standard deviation differences between treatment and control.
Comparison of Standardised Treatment Effects Across Outcomes
Point estimates with 95% Confidence Intervals
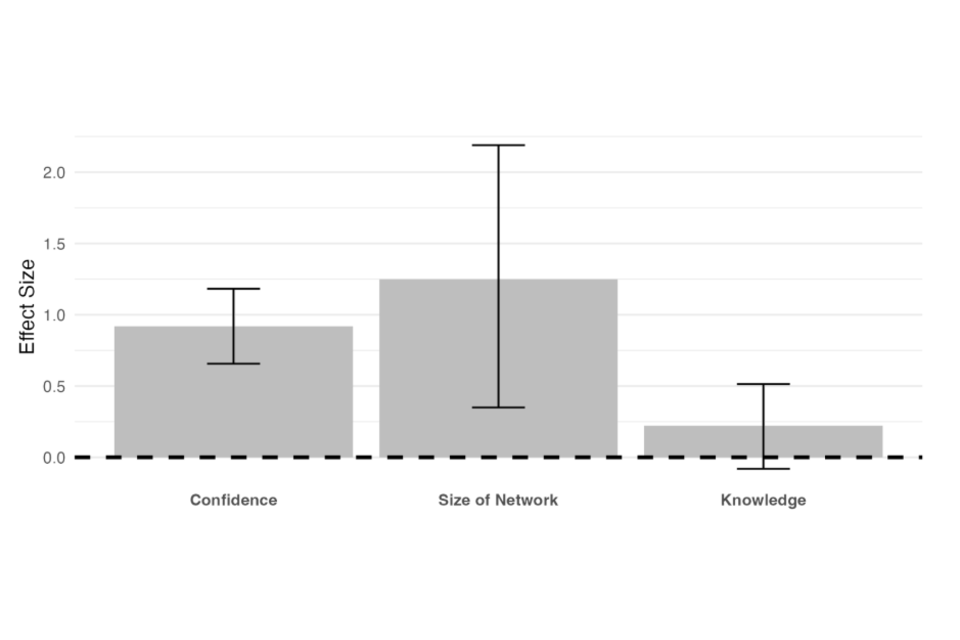
Figure 2: Standardised treatment effects across the three outcome variables (confidence, network size and knowledge) at endline.
Primary Outcomes
The results demonstrate that participating in stage 1 of the Evaluation Academy had significant impacts on both of the primary outcome variables.
For the confidence outcome, the estimated effect is 0.84 which indicates that those assigned to participating in the Academy reported confidence in delivering evaluation training at endline that, on average, was 0.84 points higher than those assigned to the control group. Given that the confidence variable is measured on a 5 point scale, this represents a substantive difference between the means of the two groups. This difference is statistically significant at the 99% level. The standardised effect size for the confidence variable was 0.92 of the standard deviation of the control group at the endline which is typically considered to be a large effect size.
For the network outcome, the estimated effect is 7.97. This indicates that those assigned to participate in the Academy reported an additional 8 people in their cross-government evaluation network relative to those assigned to the control group (a standardized effect size of 1.25 times the standard deviation of the control group at endline). This difference is also statistically significant at the 99% level.
Together, these effect sizes are large in magnitude and, despite the relatively small sample size in the trial, sufficiently precisely estimated for us to be able to comfortably reject the null hypothesis of no effect. This provides strong evidence that the Evaluation Academy training caused an increase in the self-reported confidence of those assigned to participate, as well as an increase in the self-reported size of their evaluation networks.
Secondary Outcome
Table 3 and Figure 2 reveal that, at endline, those assigned to participating in the Academy scored 3 percentage points higher on the evaluation knowledge battery than those assigned to the control group. However, while the confidence intervals on this effect are sufficiently narrow that we can rule out meaningful negative effects of the Academy of evaluation knowledge, we are not able to rule out the possibility of null effects as the difference we estimate is not statistically significant at conventional levels. This finding is consistent with the discussion above which indicated that knowledge gains from the first stage of the Academy are likely to be relatively hard to achieve, given that the sample of participants is expected to have a high level of evaluation knowledge before beginning the training.
2.10 Addressing Threats to Inference
Non-compliance: Some treatment group participants failed to attend the Academy despite being allocated a place.[footnote 14] Although the level of non-compliance was relatively modest (11.6% of those allocated to the treatment group failed to participate in the Academy), we mitigate the concern that non-compliance could bias our effect estimates in annex section 6.7 by estimating Complier Average Treatment Effects (CATEs) using a two-stage least squares approach as described in Gerber and Green (2012, 151). The treatment effects estimated from this approach are substantively and statistically very similar to those presented in the section above.
Attrition: As documented in section 2.7, there was limited attrition between baseline and endline in either the treatment or the control group. Nevertheless, to ensure that the estimates presented above are not biased by the slight differential attrition between treatment and control, in annex section 6.7 we calculate “worse-case” or “extreme-value” bounds on the treatment effects for all three outcome variables (Lee 2009). Extreme-value bounds on the treatment effects assess the potential consequences of differential attrition by examining how the estimated treatment effect would vary when making different assumptions about the missing outcomes that arise due to non-response. The results of this analysis indicate that the substantive conclusions drawn from the main analysis are very unlikely to be affected by differential attrition.
Robustness: All quantitative analyses require making analytical decisions which can be consequential for the resulting estimates. The analysis presented above follows the statistical analysis plan that we preregistered before commencing endline data collection (Beckett et al. 2025). Nevertheless, it is possible that the estimates we present would have changed had we made different analysis decisions. In order to assess this possibility, annex section 6.8 presents the results of a multiverse analysis (Steegen et al. 2016). A multiverse analysis is a systematic approach to conducting robustness checks for an evaluation in which the analyst identifies all reasonable analytical choices that could have been included in a statistical analysis plan and systematically produces and reports results for each possible combination of these choices. The multiverse analysis we conduct reveals that the conclusions reported above are insensitive to the specific analytical decisions we employ.
2.11 Limitations
There are limitations to the findings reported above. First, the outcome measures are self-reported survey responses which may overstate effects if participants felt pressure to demonstrate improvements. Future evaluations should consider more objective approaches to measuring the outcomes of focus here. Second, the endline survey environment was different for treatment and control participants in that the treatment group completed the endline survey in person in exam conditions whereas the control completed it independently online. Future evaluations should consider whether a more consistent approach could be taken without impacting on the response rates of the endline survey. Third, the trial focused on only a subset of the short-term outcomes articulated in the Academy’s Theory of Change, and did not assess whether improvements in confidence and networks translate into higher-quality training delivery within departments. Nor does the current design allow assessment of the Academy’s longer-term impact on evaluation capability across government. Future evaluation should therefore prioritise assessing stage 2 of the Academy, tracking how participants apply their training within departments, and investigating whether short-term gains in confidence and networks translate into sustained improvements in evaluation quality and capability across government.
2.12 Summary
The results of the impact evaluation indicate that stage 1 of the Evaluation Academy was successful in achieving its primary short-term objectives. Participants assigned to the July 2025 cohort reported substantially higher levels of confidence in delivering evaluation training (average increase of 1-point on a 5-point scale) and a marked increase in the size of their cross-government evaluation networks (an average increase of 8 people). These effects were large in magnitude, precisely estimated, and robust to alternative analytical strategies, providing strong evidence that the Academy training produced meaningful improvements in these outcomes.
The evaluation found limited impacts on participants’ technical knowledge of evaluation methods and processes. This is consistent with the expectations outlined in the sections above. Participants selected for stage 1 of the Academy were expected to have existing evaluation expertise, and stage 1 was designed to improve the ability to teach and disseminate evaluation content, rather than to build basic evaluation knowledge. The absence of large knowledge effects could serve as confirmation that the programme was appropriately targeted at civil servants with pre-existing evaluation knowledge. However, further research should investigate other potential reasons for the absence of large knowledge effects given that the baseline results did show the potential for significant improvements.
3. Implementation and Process Evaluation
3.1 Overview of the approach
In addition to the impact evaluation, we also conducted an implementation and process evaluation (IPE) to understand participant and teacher experiences of the Academy. The IPE aims to inform future delivery of the Academy through understanding any barriers and facilitators to participation and successful implementation. The delivery of the Academy has been iterated over the two previous years of delivery, taking on board research with participants and trainers about the effectiveness of its design. However, the aim of this IPE is to provide further useful insights to shape the ongoing delivery of the Evaluation Academy which, in turn, will improve participant ability to engage effectively in the training.
The research questions for the IPE are:
- Was the Academy delivered in the way that was envisaged?
- What were the key enablers and barriers to effective participation in the Academy?
- What were participants’ experiences of attending the Academy?
- What are participants’ recommendations for improvement of the training in the future?
We collected and triangulated a variety of data sources (see next section) to draw conclusions about participant experiences and answer these research questions.
3.2 Methodology
This IPE relied on data from five separate sources which are outlined in Table 4 below.
| Data type | Source | Information included | Sample Size |
|---|---|---|---|
| Monitoring data | Registration form | - Department - Grade - Job role |
59 |
| Qualitative feedback from participants on the Academy | An anonymous feedback survey completed post-Academy in participants’ own time. | A battery of 9 questions outlined in annex 6.4. These are a mixture of multiple choice and free-text responses. | 25 (42% response rate) |
| Qualitative feedback from teachers on the Academy | Feedback form for teachers completed at the end/during sessions | - What overall feedback do you have about the delivery of the Evaluation Academy? - Was there any content in your module that should have been included? - Were there any mistakes or needs that you spotted that should be changed before next year? |
25 |
| Qualitative feedback from teachers on the Academy | 60 minute focus group session with ETF teachers | - What went well/less well in the delivery of the Academy? - What were the barriers/facilitators to participant engagement in the Academy? - Is there anything that you would change about the delivery of the Academy for next year? |
15 |
| Observations | Observations from Evaluation Academy organisers | - Notes taken by organisers across the 5 days | 2 |
Table 4: Data types, data source, data points, and sample size for the data collected and used for the IPE.
In order to contextualise the qualitative analysis in this process evaluation, monitoring data was first analysed to produce descriptive statistics of the types of participants taking part in the Academy. Qualitative data from participant and teacher feedback was then triangulated with observations from Evaluation Academy organisers to explore themes relating to each of the four research questions. This method was chosen with careful consideration, given that participants were engaging in an intensive training programme and taking part in a trial which required surveying, so researchers were reluctant to add additional burden by requesting them to engage in lengthy interviews or focus groups.
All qualitative data outlined in Table 4 was analysed by internal ETF researchers, and quality assured externally by Cabinet Office analysts. Qualitative data was analysed to explore teachers’ and participants’ experiences, views, and perceptions. During this process, care was taken to ensure that information shared during surveys, interviews and focus groups does not contain identifiable data.
3.3 Results
3.3.1 Research Question 1
Was the Academy delivered in the way that was envisaged?
The July 2025 Evaluation Academy was developed with a number of intentional design choices to support the delivery of its intended outcomes.
Size of Evaluation Network
The Academy was intentionally designed by the ETF to be delivered in person, with time allocated for networking, and intentionally mixed groupings in order to support the intended outcome of strengthened networks for attendees.
An external facilitator has been commissioned by the ETF over the last three years to facilitate the Academy train-the-trainer course and these facilitators are well placed to provide insights into whether the course was delivered as intended. The facilitators observed that the July 2025 Academy had the highest standard of participant delivery that they had seen to date. Both facilitators and ETF organisers observed that the choice to split the Academy across two weeks and to include more breaks throughout the day compared to previous years allowed attendees more space and time to prepare for their masterclasses, as well as absorb and reflect on what they had learnt. In order to embed these additional breaks into the agenda, teaching times were reduced compared to previous years. This was an intentional design choice by the ETF which involved trade-off between networking and teaching.
The ETF decided that more time for networking was crucial to the Academy delivering its intended primary outcomes and so should be given more emphasis. However, as a result of this, facilitators and ETF organisers observed that some sessions overran by up to 10 minutes (particularly the technical teach-in sessions). When asked how the Academy could be improved, participants and teachers felt that some sessions had too much content for the allocated time and should be extended. As a result of these sessions overrunning, some participants did not get as much networking time as originally intended. Future delivery design should consider how to avoid these overrunning sessions to ensure that the networking time is prioritised given the link to the primary outcome of the Academy.
Another design feature of the Academy was the intentionally mixed participant groupings from a diverse range of departments. In July 2025, 57 participants attended the Evaluation Academy training. Participants attended from 22 government departments, devolved governments, and government organisations. Table 5 shows the breakdown of attendees per organisation. This range of organisations was as intended in the design to support participants to grow their networks with other evaluators.
| Department/Organisation | Number of attendees |
|---|---|
| Cabinet Office | 5 |
| Crown Prosecution Service | 1 |
| Department for Business and Trade | 4 |
| Department for Environment, Farming, and Rural Affairs | 2 |
| Department for Education | 2 |
| Department for Health and Social Care | 2 |
| Department for Work and Pensions | 4 |
| Foreign, Commonwealth, and Development Office | 4 |
| Food Standard Agency | 2 |
| Government Office for Science | 1 |
| HM Revenue and Customs | 3 |
| HM Treasury | 2 |
| Home Office | 4 |
| Intellectual Property Office | 2 |
| Ministry for Housing, Communities, and Local Government | 2 |
| Ministry of Defence | 3 |
| Office of Gas and Electricity Markets | 4 |
| Office for National Statistics | 1 |
| Scottish Government | 3 |
| UK Health Security Agency | 3 |
| Valuation Office Agency | 1 |
| Welsh Government | 2 |
| Total attendees: | 57 |
Table 5: Table to show the number of Academy attendees from each of the 22 participating Government Organisations.
Confidence in Delivering Evaluation Training
The Academy was also designed to very quickly build participant confidence to deliver training themselves by employing an in person, hands-on approach to teaching over five days. This involves participants presenting from day one of the course and being pushed out of their natural comfort zones where required.
Six participants dropped-out of the Academy ahead of the training’s commencement due to being unable to get time away from their day-to-day work. Due to the intense nature of the course, it is not possible to partially attend the course and this requirement could have encouraged last-minute dropouts. Non-attendance could have been due to the timing of the Academy, which coincided with a period after the Spending Review and before Summer Recess began. As a result of the drop-outs, 57 out of a potential 64 Evaluation Academy places were taken up in July 2025.[footnote 15] For the 57 participants who attended, all 10 modules of the Academy were delivered across five days as intended (please see annex 6.5 for the full July 2025 Academy agenda).
As discussed in section 1.1, stage 1 of the Academy is designed to teach analysts who have pre-existing evaluation knowledge to teach others about evaluation. Another intentional design choice for the Academy was that participants were required to have around two years of experience in evaluation roles so that they could keep up with the pace of the course and focus learning on how to deliver, rather than learn, the technical content. As a consequence, attendees to the Academy are likely to be of a higher civil service grade given the need for more experience. However, participants may not have experience in all aspects of evaluation knowledge, leaving room for improvement in evaluation knowledge as a secondary outcome of the Academy.
Participants were from several civil service grades, ranging from Higher Executive Officer to Grade 6. Almost all attendees (98%) were below Grade 6, with the majority (86%) being either Senior Executive Officers or Grade 7s. See Figure 3 below for a full grade breakdown. This means that the majority of participants were in mid or senior level management roles as expected given the requirement to have existing evaluation knowledge at attend stage 1 of the Academy.
Attendees by grade (n=56)
| Grade | Percentage of attendees |
|---|---|
| HEO | 13% |
| SEO | 41% |
| Grade 7 | 45% |
| Grade 6 | 2% |
Figure 3: Bar chart showing the proportion of Evaluation Academy attendees by grade, ranging from HEO to Grade 6.
Evaluation Knowledge
Despite the expectation that participants have existing experience in evaluation, the ETF made the design choice to include ‘teach-in sessions’ for each module to ensure that those with knowledge gaps in specific topics could be brought up to speed. The teach-in sessions involved evaluation experts running through the module content in their own teaching style, and answering technical questions while also providing tips on delivering the training. Participants also received supplementary materials with additional technical information, case studies, and frequently asked questions to support their learning.
In conclusion, the Evaluation Academy was developed with a number of intentional design choices to support the delivery of key outcomes in the theory of change:
- Size of Evaluation Network: Additional breaks, mixed groupings and an in person format to support enhanced networking opportunities;
- Confidence in Delivering Evaluation Training: In person, hands on activities, delivered to analysts with existing evaluation experience from the first day supported rapid confidence building for presenting;
- Evaluation Knowledge: Teach-in sessions and supplementary materials supported upskilling attendees in evaluation methods.
3.3.2 Research Question 2
What were the key enablers and barriers to effective participation in the Academy?
There were several key enablers and barriers to effective participation in the Academy which were highlighted by participants and teachers in their feedback. These can be divided into overarching factors as well as those that relate to the three outcomes of interest for this evaluation. The below analysis explores each in detail. A summary of the barriers and facilitators for each outcome is summarised in Table 6 below.
| Theme | Enablers | Barriers |
|---|---|---|
| Overarching factors | - Well organised | - Temperature |
| Size of network | - In person - ETAP support |
|
| Confidence in delivering evaluation training | - Academy facilitator - Observing a range of teaching styles - Senior speakers |
- Pace/intensity - Assumed prior knowledge - Wordy slidepacks |
| Evaluation knowledge | - ETAP support |
Table 6: Summary table of the enablers and barriers to participation for participants of the Evaluation Academy.
Overarching factors
Participants and teachers both reported that the Academy was well organised which helped the course run smoothly from both participant and teacher perspectives. However, a barrier to participation for participants was the temperature on the first two days of the course because it was during a heatwave and the building did not have air conditioning in the majority of its rooms. This was coupled with a more limited access to water, as participants needed to be escorted to fill water bottles due to security restrictions. This made concentration difficult for some attendees on those first two days.
Prior to the Academy being delivered, there were concerns about participant engagement in the Academy content given that they would have access to their work laptops. In the first two train-the-trainer Academies, all materials had been printed and no laptops were allowed for attendees. However, this year the ETF chose not to print materials due to sustainability and financial considerations. This posed a risk that attendees would be distracted by messages from colleagues in their day jobs. Facilitators did observe some participants with work content open on their laptops. However, they did not observe this as a barrier to participation nor did attendees or teachers note this as an issue in their feedback.
Size of Evaluation Network
As discussed in the previous section, there were a number of intentional course design choices which were made to support participants to network. Participants and teachers both expressed that having training delivered in person across five days was beneficial for networking but also to keep learners engaged in the content more easily. Furthermore, ETF teachers who had also supported the Academy, noticed that the format, which did not place sessions across lunch breaks, allowed for more networking opportunities and collaboration. Many participants also noted that the Academy’s mixed groupings helped them to form new networks across departments and engage with people that they would not have encountered otherwise. Academy groups were between eight to ten people, with a mix of individuals from different departments. The participants also set up a Whatsapp group and two social meet-ups throughout the week for the whole cohort of their own volition which showed the strength of connection made. This in person, collaborative aspect of the course design was a key enabler for the primary outcome of increasing participant networks. This compliments the findings from the IE which found that participants’ networks increased by eight people on average.
The Academy also enlisted the support of evaluation experts from the Evaluation and Trials Advice Panel (ETAP) to teach the technical content alongside ETF members. Participants reported that they found ETAP involvement in the Academy important for building a network of subject matter experts.
Confidence in Delivering Evaluation Training
In their feedback about the Academy experience, many participants noted that the course was busy and intense but that this did not feel overwhelming once it began. One participant stated, “It felt a bit like being thrown in at the deep end - but in a good way!”. This reflects the intentional design choices as mentioned in the previous section to design a course which quickly builds confidence by rapidly pushing people to present materials to a group. One participant stated, “teaching right from the start was good as it meant by the time we got to the masterclass I didn’t feel at all nervous about presenting”. For a small proportion of participants, however, the pace and intensity was more of a barrier to confidence building because it moved too quickly, stretching them too far out of their comfort zone.
One major enabler reported by participants for effective participation which led to confidence building was the involvement of the Academy facilitator. Many participants named the expert facilitator directly as a key contributor to their positive learning experience, both through his specific sessions and general supportive nature. The facilitator built a supportive culture for the course right from the beginning, setting norms and expectations for learner participation. The facilitator also led many group sessions focused on giving participants practical tips for how to effectively engage audiences and teach content. They not only built confidence by reassuring participants that the course was designed to be challenging, but also by providing them with the practical skills to deliver training themselves. The facilitator was a key enabler for participation for participants linked to the primary outcome of building confidence.
Another enabler for confidence building reported by participants was the ability to observe a range of teaching styles from the ETF, ETAP, and each other. Participants felt that seeing this diversity in approaches and being able to discern which worked best for them made them more able and more confident to stand up and deliver the masterclass themselves. Participants also noted that engagement from senior speakers including Catherine Little[footnote 16], Nick Donlevy[footnote 17] and David Halpern[footnote 18] helped to keep them engaged and focused on the key mission of the Academy which is to ultimately support better evaluation across government. These speeches, which were spaced throughout the week, were designed to motivate participants by reminding them periodically about the importance of evaluation in decision making. Having this ultimate aim clear throughout the course supported participants to be confident in delivering this training as it was clearly supported by visible senior stakeholders.
One barrier to participation related specifically to confidence in delivering evaluation training was that some participants felt that there was too much assumed prior knowledge. The Academy is designed for individuals who have been working in evaluation for at least two years, and is not marketed as an evaluation training. The premise of the course is to teach participants how to teach methods to others. However, some participants felt that they did not have enough baseline evaluation knowledge to confidently present technical evaluation information. On the other hand, in the optional post-Academy feedback survey, the majority of respondents (76%) reported that they felt the content was about right for their level of experience and only 12% reported that it was too advanced (see Figure 4). As discussed in annex section 6.6.1, participants’ evaluation knowledge prior to the intervention (as measured in our baseline survey) was shown to be reasonably good in relation to the level of questions asked, with some variation across the sample. This variation is consistent with the pattern shown in the qualitative research that the majority of participants found the level of required prior knowledge about right but a small proportion found it too advanced and a barrier to their effective participation. It is important to note that the same proportion of respondents rated the training as too basic as rated it as too advanced. There is a careful balance to strike in ensuring that the course content is of sufficient quality and detail whilst not overburdening the majority of participants.
Thinking about the three sessions as a whole (Teach-in, Delivery Practice and Coaching, and Masterclasses), how would you rate the training in relation to your level of experience?
| Response | Percentage of respondents |
|---|---|
| Too basic | 12% |
| About right | 76% |
| Too advanced | 12% |
Figure 4: Bar chart showing responses to the optional Academy feedback survey. This question asked “Thinking about the three sessions as a whole (Teach-In, Delivery Practice and Coaching, and Masterclasses), how would you rate the training in relation to your level of experience?”. The total number of responses for this question was 25.
One other barrier to participation related to confidence in delivering evaluation training that participants cited in the post-Academy survey was the design of the module slidepacks. Participants noted that the slides were often too text-heavy and some animations were broken which meant that they found them challenging to present or understand. Our ETAP and ETF teachers also gave similar feedback on the slides, adding that some of the content could be refreshed to allow for easier teaching and more up to date examples.
Evaluation Knowledge
Whilst the pace of the course acted as an enabler to quickly build participant confidence in delivering evaluation training, for some it acted as a barrier to knowledge building as it did not leave much time for additional learning. A small number of students felt that there was too much assumed prior knowledge, which both impacted confidence and knowledge building. The impact evaluation revealed no negative impact on knowledge caused by the Academy training, however, the intentional design choice for the Academy to get participants quickly presenting across a range of modules, may have limited participant ability to make significant positive shifts in their evaluation knowledge.
An important enabler for participation related to evaluation knowledge building highlighted by participants in their feedback was ETAP teachers. Participants commented on the benefit of being able to ask in depth, technical questions to these volunteers to expand their technical knowledge beyond the baseline content. ETAP members were also able to bring a wealth of experience in teaching evaluation methodologies to the sessions, and alongside the ETF’s experience in applying this to a government context, participants found the combination to be helpful. Both participants and teachers remarked that some more consistency in teachers across the week might have made the content delivery easier and built even stronger relationships. ETAP involvement in the course design was a key enabler for the secondary outcomes of increasing evaluation knowledge, however, this could be enhanced further in the future by having more consistent teaching throughout the week.
3.3.3 Research Question 3
What were participants’ experiences of attending the Academy?
Whilst it is important to understand whether the Academy was delivered as expected and any barriers/enablers for participation, it is also crucial to understand the participant experience of attending. During the five days of the Academy, ETF organisers observed participants being vocal about how much they were enjoying attending an in-person event and meeting new people. On day 1, there was a great sense of anticipation and some nervousness about the task at hand. However, confidence grew throughout the week as did connections between attendees and by the final day there was a sense of accomplishment across the group. One participant remarked that it was the best training they have ever attended. This growth in confidence is consistent with the significant increase in confidence found in the impact evaluation.
In a post-Academy optional feedback survey, we asked participants about their experiences on the course. Firstly, we asked about how useful they found the supplementary sessions run by the facilitator. These sessions were focused on teaching participants how to effectively facilitate the Academy modules in their home departments and ensure that what they teach stays with their learners. 60% of the respondents to this question rated the facilitator’s sessions as extremely useful for preparing them to facilitate the Academy modules (see Figure 5 below). During the course, participants also gave verbal feedback that these sessions with the facilitator were also valuable for preparing them for the masterclass sessions in the second week. Attendees did report that they would have liked some more advice on how to deliver training effectively in an online or hybrid environment. They noted that this is most likely how they will need to deliver their training sessions and so they called for more advice on how to do this effectively.
Thinking about the workshops that the facilitator led, how useful were they to help prepare you to facilitate the Academy Modules?
| Score (5=extremely useful, 1=not useful) | Count (n=25) |
|---|---|
| 1 | 0 |
| 2 | 0 |
| 3 | 3 |
| 4 | 7 |
| 5 | 15 |
Figure 5: A bar chart showing responses to a question in the post-Academy optional feedback survey which asked “Thinking about the workshops that the facilitator led, how useful were they to help prepare you to facilitate the Academy modules?”. The total number of responses for this question was 25.
In the same survey, participants were also asked to rate how useful the three different types of module sessions (Teach-in, Delivery Practice and Coaching, and Masterclass) were for preparing them to deliver the Academy. Sessions were rated on a scale of 1 to 5 where 1 was equal to not at all useful and 5 was equal to extremely useful. Figure 6 shows the responses to this question for each type of session.
The masterclass session had the highest proportion of respondents rate it as extremely useful (56%). This is likely due to the fact that this session is designed as a dress rehearsal for the delivery of the Academy in participants’ home departments. The teach-in and delivery practice and coaching had much lower proportions of respondents ranking them as extremely useful with 8% and 20% respectively.
The teach-in sessions had a mixed response from respondents about their usefulness. They had the highest proportion (52%) of respondents rating it 3 or below. However, it also had 48% of respondents rating it 4 or 5. Therefore, we can determine that there was a mix of opinions on these sessions. This might be due to the range of prior evaluation knowledge held by attendees. Those with lower evaluation knowledge may have found teach-in sessions more useful to upskill them on the content while those with a higher existing evaluation knowledge may have found these sessions less useful as they were already familiar with the content being taught in these sessions.
The delivery practice and coaching session also split opinions across the respondents with 36% of respondents rating it 3 or lower and 64% rating it above 3. In the anonymous feedback survey, respondents reported that these sessions were helpful for gaining more confidence in presenting to others and getting feedback on different approaches. However, participants also reported that the usefulness of these sessions are limited because no time is given between the teach-in session to prepare for the delivery practice. Participants also reported a range of experiences in the coaching from teachers in that some provided hugely helpful feedback and pointers, whereas others were more reluctant to share constructive feedback. These anecdotal accounts might explain the range of responses to this question.
Thinking about the three different types of sessions, how useful were they in preparing you for delivering the Evaluation Academy?
| Score (1=not at all, 5=extremely useful) | Teach-in Session - Count (n=25) | Delivery Practice and Coaching Session - Count (n=25) | Masterclass session - Count (n=25) |
|---|---|---|---|
| 1 | 1 | 1 | 1 |
| 2 | 4 | 2 | 0 |
| 3 | 8 | 6 | 2 |
| 4 | 10 | 11 | 8 |
| 5 | 2 | 5 | 14 |
Figure 6: Bar chart showing responses in an optional post-Academy feedback survey to the question “Thinking about the Teach-in, Delivery Practice and Coaching, and Masterclass sessions. How useful were they to help prepare you to facilitate the Academy Modules? (5=extremely useful, 1=not useful)”. The total number of responses for this question was 25.
One further question asked participants to what extent they could apply what they have learnt to their work. Respondents were asked to rate this on a scale of 1 to 5 where 1 was equal to not at all and 5 was equal to a lot. 84% of respondents rated a 4 or higher for this question (see Figure 7). This suggests that the majority of respondents found what they learnt during the Academy to be applicable in their daily work. This is likely due to the fact that many respondents work in evaluation roles across government and because the general presentation skills taught on the course are also useful for non-evaluation roles.
Thinking about the overall experience, to what extent do you think you can apply what you’ve learned to your work?
| Score (5=a lot, 1=not at all) | Count (n=25) |
|---|---|
| 1 | 0 |
| 2 | 2 |
| 3 | 2 |
| 4 | 10 |
| 5 | 11 |
Figure 7: Bar chart showing responses to a question in the post-Academy feedback survey which asked “Thinking about your overall experience, to what extent do you think you can apply what you’ve learned to your work? (1=not at all, 5=a lot)”. The total number of responses for this question was 25.
3.3.4 Research Question 4
What are participants’ recommendations for improvement of the training in the future?
Participants made several recommendations for how to improve the training for future cohorts. In the optional feedback survey, respondents were asked about one thing they would change about the Academy. Three of the recommendations were related to the primary outcome of confidence in delivering evaluation training:
1. Materials refresh - as reported in 3.3.2, participants noted that a barrier to participation in the Academy was that the slides were too text heavy which made them difficult to present confidently. They also noticed some small formatting errors that they recommended should be rectified and suggested running the materials through accessibility checks. This feedback was also echoed by our teachers who have collated the changes they see as necessary to make in a feedback document. Therefore, participants recommended that these slides and accompanying materials be refreshed to ensure that they could confidently present them.
2. Clearer expectation setting - participants reported that they would like to see the ETF setting expectations more clearly ahead of the course. This was suggested for two reasons, the first one being that a clearer expectation of the time commitment required outside of the five days for masterclass preparation would have helped them to manage their workloads better in their day to day jobs. The second reason was to 1. ensure that participants are aware of the level of baseline technical knowledge to effectively engage with the course and build confidence delivering the training.
3. More support for delivering the Evaluation Academy online - participants were vocal about their appreciation for attending the train-the-trainer course in-person. However, many remarked that when they deliver the training it will likely be in a virtual or hybrid format. Much of the supplementary sessions, delivered by the Academy facilitator, to teach attendees how to deliver effective training was focused on in-person delivery and attendees remarked that they would also like to see more advice about online delivery in order to make them feel confident for stage 2.
Another recommendation made my participants in their feedback was related to the outcomes of increasing participants’ evaluation network and evaluation knowledge:
4. Prevent overrunning teach-ins - participants frequently recommended that more time should be allocated to the teach-in sessions to allow the teachers to explain concepts in more detail and prevent the sessions from overrunning and taking away from breaks. Participants wanted more time to ask questions and dig into the technical details for each module to build their knowledge to be able to answer questions they might get asked when delivering the module themselves. Future delivery design might build in a formal networking session with ETAP and ETF experts to allow participants to ask these questions in an allocated session rather than forcing teach-in slots to overrun. This would support both the primary outcome of increasing participant networks and the secondary outcome of increased evaluation knowledge through embedding additional time with evaluation experts.
3.4 Limitations
There are limitations to the research presented above. First, this IPE was a small-scale study which focused on the short-term effects of the training programme. A more comprehensive process evaluation might include rigorous interviews and focus groups with participants, as well as follow-up studies. However, this group of 57 participants had been heavily surveyed throughout the waitlist RCT and so additional research commitments would have risked research fatigue leading to attrition from the course. Taking the above considerations into account, we determined the triangulation of the above research methods to be the most appropriate and proportionate for this research context. However, future research should consider running a more in-depth theory-based evaluation in the future to investigate the mid-/long-term effects of the Academy on participants and key stakeholders.
Second, the ETF planned to conduct the participant feedback survey in person, however, due to time constraints and the risk of survey fatigue we decided to instead send the feedback survey to participants after the course to complete online in their own time. This may have yielded a higher response rate, however, it gave participants some time to reflect on their experience and so equally may have obtained some more rounded and reflective feedback.
Third, the research presented above heavily relies on individual experiences and observations. This evidence is a powerful tool in research to understand people’s experiences. In conjunction with quantitative evidence, it can help us to fill research gaps and better understand anomalies and regularities in the data (Gupta 2025). However, given that this IPE relies heavily on anecdotal evidence, we cannot be as confident in the findings arising from it as we can the quantitative impact evaluation. A future study should look to collect this data at a large scale and more systematically to improve the robustness of the IPE methodology.
3.5 Summary
In conclusion, the Implementation and Process Evaluation (IPE) of the Evaluation Academy’s train-the-trainer course in July 2025 reveals its broad success in achieving intended delivery and eliciting positive feedback from both participants and teachers. Participants consistently rated the Academy as effective in preparing them for content delivery within their departments and highly relevant to their broader professional responsibilities. The IPE identified the in-person and hands-on design, alongside the involvement of the Evaluation and Trials Advice Panel and facilitators, as crucial enablers for effective participation and the realisation of desired outcomes identified in the impact evaluation.
However, the IPE also highlighted several barriers to effective participation, including the demanding pace of modules, an assumed level of prior knowledge among participants, and the textual density of slide presentations. This research has yielded clear, actionable recommendations to enhance the Academy experience for future attendees and bolster its effectiveness in achieving its objectives. These recommendations include updating course materials, establishing clearer participant expectations, preventing teach-in sessions from exceeding their allotted time, and providing increased support for online delivery in subsequent phases.
4. Discussion
The findings from this evaluation contribute to growing research in the use of train the trainer programmes for capability building. The results of the impact evaluation convincingly show that stage 1 of the Evaluation Academy was successful in achieving its primary short-term objectives of increasing participant confidence in delivering evaluation training and network size. The impact evaluation found little to no impact on participants’ technical knowledge of evaluation methods and processes which is consistent with the ETF’s expectations. It is important though that these knowledge gains are present in stage 2 of delivery in order to support the ultimate goal of the Academy to improve evaluation quality and quantity across government. Future research should, therefore, explore whether knowledge gains are made at stage 2. Ultimately, further research is needed to track outcomes over a longer period and into stage 2 to see if (a) the teachers retain the competency; (b) those who attend sessions increase their knowledge; and ultimately (c) if the quality and quantity of evaluation increases in the organisations with Academy trainers.
The IPE generated clear recommendations for future delivery of stage 1 of the Evaluation Academy. The ETF will work to embed these into the future design of the Academy to increase the effectiveness of the training and maximise its impact. Thinking to the future, if exploring applying the Evaluation Academy design to other contexts, such as non-analytical civil servants, the ETF should consider how they might design the programme to support knowledge building as a primary outcome.
5. References
Beckett, Lydia, Jack Blumenau, Jake Dolby, Oliver Houser, and Miriam Styrnol. 2025. “Evaluation of the Evaluation Academy: Study Protocol and Statistical Analysis Plan.” Open Science Framework. https://doi.org/10.17605/OSF.IO/7SM59.
Benjamini, Yoav, and Yosef Hochberg. 1995. “Controlling the false discovery rate: a practical and powerful approach to multiple testing.” Journal of the Royal statistical society: series B (Methodological) 57, no. 1 (January): 289-300.
Gerber, Alan S., and Donald P. Green. 2012. “Field Experiments: Design, Analysis, and Interpretation.” N.p.: W. W. Norton.
Gupta, A. 2025. “Is Anecdotal Evidence Science?”. American Journal of Qualitative Research, 9(1), 75-85. https://doi.org/10.29333/ajqr/15880
Lee, David S. 2009. “Training, Wages, and Sample Selection: Estimating Sharp Bounds on Treatment Effects.” The Review of Economic Studies 76, no. 3 (January): 1071–1102.
National Audit Office. 2021. “Evaluating Government Spending: HMT Treasury, Cabinet Office. National Audit Office.” www.nao.org.uk. https://www.nao.org.uk/wp-content/uploads/2021/12/Evaluating-government-spending.pdf.
Nexø MA, Kingod NR, Eshøj SH, Kjærulff EM, Nørgaard O, Andersen TH. 2024. “The impact of train-the-trainer programs on the continued professional development of nurses: a systematic review.” BMC Med Educ. 2024 Jan 4;24(1):30.
Simonsohn, Uri, Joseph P. Simmons, and Leif D. Nelson. 2020. “Specification curve analysis.” Nature Human Behaviour 4, no. 1 (July): 1208-1214.
Steegen, Sara, Francis Tuerlinckx, Andrew Gelman, and Wolf Vanpaemel. 2016. “Increasing Transparency Through a Multiverse Analysis.” Perspectives on Psychological Science 11, no. 5 (Jan): 702-712.
Yarber, L., Brownson, C.A., Jacob, R.R. et al. 2015. “Evaluating a train-the-trainer approach for improving capacity for evidence-based decision making in public health.” BMC Health Serv Res 15, 547.
6. Annexes
6.1 Survey Instrument
This section includes all questions from the bespoke survey which were used in the analysis of our study. In the Evaluation Knowledge section, correct answers to questions are designated with a ✓.
Department and Grade
1. Please select the government department, government agency, devolved government body or public body you work in from the list below:
- List of government departments, government agencies, devolved government bodies or public bodies
2. Please select your grade:
- EO
- HEO
- SEO
- Grade 7
- Grade 6
- SCS 1
- SCS 2
- SCS 3
- Other
Confidence in Delivering Evaluation Training
| Category | 1 = Not at all confident | 2 | 3 | 4 | 5 = Completely confident |
|---|---|---|---|---|---|
| Delivering evaluation training to members of your department | ’ | ’ | ’ | ’ | ’ |
| Communicating technical evaluation methods to non-specialists | ’ | ’ | ’ | ’ | ’ |
Size of Evaluation Network
4. Approximately how many individuals across government would you feel comfortable approaching for advice on evaluation? Please insert a number below.
- Insert number
Evaluation Knowledge
5. Theories of Change are particularly helpful for… (select all that apply)
- building common understanding among stakeholders about the programme ✓
- identifying the causal impact of a programme
- checking how participants feel about their participation in the programme
- identifying intermediate steps that need to occur in order for the programme to succeed ✓
6. Theories of Change sometimes specify ‘moderating factors’ - these are factors which could…
- determine whether or not the programme succeeds overall
- cause the programme to have different effects for different groups ✓
- be monitored throughout the programme to assess whether it is being delivered as planned
7. Why do we scope evaluations? (select all that apply)
- To determine the best evaluation method ✓
- To increase the likelihood of positive evaluation results
- To anticipate and plan for obstacles ✓
- To be able to clearly communicate findings to stakeholders
8. Why is it important to involve key stakeholders (e.g. partners in government, participants in the programme, relevant third party organisations) in your evaluation scoping? (select all that apply)
- It can strengthen the design of the evaluation by including diverse perspectives and incorporating feedback ✓
- It can help ensure that the results of the evaluation end up being used ✓
- It can help to avoid the programme receiving later criticism
- It can help identify partners who may be able to support the delivery of the evaluation ✓
9. An Invitation to Tender (ITT) specification should ask a supplier (select all that apply)
- Which evaluation methods they intend to use ✓
- What the key strengths, weaknesses, and risks of the proposed evaluation approach are ✓
- Whether their bid is more robust than other suppliers’ bids
- What plans they will put in place for quality assurance and ethics requirements ✓
10. You are writing ITT questions for an upcoming process evaluation. Which of the following is the best approach to take?
- Provide strict criteria that the methodology must adhere to, ensuring that each supplier’s bid follows the same format
- Provide little-to-no specification on the methodology, the supplier should be given complete autonomy over which details to include
- Provide a detailed suggestion of how you would like the evaluation to be conducted, but allow the supplier to make recommendations ✓
11. For each of the following evaluation approaches, please select which type of evaluation they best fit with.
| Category | Theory-based impact evaluation | Experimental impact evaluation | Quasi-experimental impact evaluation | Value for money evaluation |
|---|---|---|---|---|
| Realist analysis | ✓ | |||
| Randomised controlled trials | ✓ | |||
| Social cost-benefit analysis | ✓ | |||
| Regression discontinuity | ✓ | |||
| Contribution analysis | ✓ | |||
| Propensity Score Matching | ✓ |
12. Implementation & process evaluations are good for… (select all that apply)
- understanding how the context of the programme influenced delivery ✓
- identifying whether a programme worked or not
- identifying why a programme worked or not ✓
- identifying the contribution of a programme to a particular outcome
13. The main benefit of using a randomised controlled trial design is that…
- it creates a comparison group which is very similar to the group which receives the programme being assessed ✓
- it identifies why a programme works or does not work
- it means that your results will generalise to the national population
- it removes the need to collect baseline data before the intervention
14. Power calculations can tell you… (select all that apply)
- the impact that the intervention will have
- the number of participants you will need to detect an effect of a given size ✓
- the smallest possible effect of an intervention that you will be able to confidently identify with a given sample size ✓
- the approximate cost of running the evaluation
- whether your study findings will be statistically significant with a given sample size
15. Below are brief descriptions of some evaluation designs. For each description, select the correct type of study.
| Category | Individual RCT | Cluster RCT | Waitlist RCT |
|---|---|---|---|
| A government programme randomly assigns job centres to implement a new employment support service, while others continue usual services. Outcomes are measured at the level of individuals who access services. | ✓ | ||
| All patients who are referred for a new therapy are told they will receive support. Half are randomly selected to begin therapy immediately, while the others are scheduled for a future date. | ✓ | ||
| A sample of unemployed individuals is randomly assigned to either receive job coaching or not. The sample is drawn from only three local authority areas. | ✓ |
16. Why might you use a quasi-experimental design rather than a randomised controlled trial? (select all that apply)
- Because you want to increase the statistical power of your analysis
- Because the programme has already been rolled out, and you need to evaluate retrospectively ✓
- Because you want to reduce the cost of your evaluation
- Because it may not be ethical or feasible to randomly assign participants to treatment and control groups ✓
- Because quasi-experimental designs provide more generalisable results than randomised controlled trials
17. Which of the following best describes the “parallel trends” assumption in a difference-in-differences evaluation design?
- In the absence of the intervention, the treatment and control groups would have experienced the same change in outcomes over time. ✓
- Prior to the intervention, the treatment and control groups must have had the same outcome levels.
- There should be no differences in either observable or unobservable characteristics between the treatment and control groups.
- The control group outcomes must not change over time.
- Prior to the intervention, the treatment and control groups must have experienced the same outcome trends over time.
18. What are the benefits of theory-based evaluation designs? (select all that apply)
- They are well suited to evaluation in complex contexts ✓
- They provide confidence to apply a programme in a new context ✓
- They can confirm that your programme works
- They help you to understand why or how a programme works ✓
19. Which of the following are potential benefits of value for money evaluations? (select all that apply)
- They can help to understand how the benefits of a programme compare to the costs ✓
- They allow you to measure why a programme works
- They can support benchmarking of the relative value of different programmes ✓
- They can allow you to measure what works
- They can provide accountability for whether spending has achieved its objectives ✓
20. A council wants to test the effectiveness of a new text messaging service designed to remind residents about the family support services on offer in their local area. The council believes that this will increase the uptake of these services. They have a database of households in the area. How could the council most rigorously evaluate the impact of this text messaging service?
- Send text message reminders to all households in the area for a month and then see if the number of people making use of family support services increases compared to the previous month.
- Send text message reminders to all households in economically disadvantaged areas and no reminders to residents in other areas. Compare whether people from the targeted areas subsequently access family support services more than people in other areas.
- Send text message reminders to a random selection of households in the area and no reminders to other households. Compare whether people from the randomly selected households subsequently access family support services more than people in other areas. ✓
21. A local authority is implementing a new community health initiative aimed at improving mental health support among young adults. They are particularly interested in understanding how vulnerable groups feel about the initiative. The initiative includes peer-led workshops and access to online resources. To assess the implementation of the programme and understand its effectiveness, the authority intends to gather feedback from participants and measure engagement levels. How could the local authority most effectively evaluate the implementation and process of this community health initiative?
- Distribute an optional online survey to all participants at the end of the programme, asking about their overall satisfaction and perceived benefits of the initiative.
- Approach potential recipients of the initiative at a community health centre to collect qualitative feedback throughout the initiative to understand their experiences and engagement levels, and assess any barriers to participation ✓
- Monitor attendance and participation rates over the course of the programme, comparing them to a control group of young adults who did not take part, to evaluate any observable trends in engagement.
22. A government department is running an RCT to evaluate the impact of a new intensive mentoring programme on the employment rates of long-term unemployed individuals. The evaluation involves randomly assigning 200 participants to either the mentoring programme or to a control group who receive standard job centre support. After six months, the evaluators find that 30% of the participants in the mentoring programme have dropped out of the study, and only 10% of control group participants have dropped out. Which of the following is the most significant challenge that this poses for the evaluation?
- The sample size has decreased, which might reduce the statistical power of the study.
- It will be more difficult to conduct the final data analysis with different numbers of participants.
- The estimates from the RCT might be biased if the reasons for dropping out are related to participants’ likelihood of finding employment. ✓
- It suggests that randomisation has failed as the groups are not equivalent
23. A new national policy was introduced that provides additional funding to schools in areas with high levels of deprivation. The policy was rolled out across all eligible schools at the beginning of the academic year. The government wants to understand if this additional funding has led to an improvement in the average GCSE results of these schools. Which quasi-experimental design would be most suitable for evaluating the impact of this policy?
- A randomised controlled trial
- An interrupted time series analysis using historical GCSE data for the eligible schools
- A matching analysis, comparing eligible and ineligible schools which are similar to each other on observed characteristics
- A difference in differences design comparing changes in GCSE grades over time for eligible and ineligible schools ✓
24. A national “active travel” fund provides grants to local authorities aimed at reducing car use, improving air quality and promoting healthier lifestyles. The uptake of “active travel” varies widely across areas, with some communities embracing cycling and walking while others see little change despite similar investments. The Department of Transport suspects that outcomes may depend on different factors such as perception of safety, local culture, existing infrastructure etc. The department wants to better understand how these factors influence programme outcomes and what mechanisms are triggered in different contexts. Which of the following evaluation methods would be the most suitable?
- Contribution analysis to assess whether the programme’s intended outcomes (e.g reduced car use, improved air quality, healthier lifestyle) can plausibly be attributed to the Active Travel Fund.
- Realist analysis to understand how the intervention works, for whom, and under what conditions by exploring the interaction between different contexts (e.g urban vs rural, low vs high existing infrastructure), mechanisms (e.g. increased perceived road safety, social norms) and outcomes. ✓
- Randomised controlled trials to estimate the causal impact of the fund on travel behaviour and air quality by comparing outcomes on randomly assigned control geographical areas.
6.2 IRT Analysis
In our baseline survey, our evaluation knowledge battery included 37 questions which aimed to test respondents’ knowledge and understanding of evaluation processes and methods. As no existing measurement instrument for evaluation knowledge exists, these questions were written by members of the Evaluation Task Force, informed by previous pilot surveys that were fielded in prior waves of the academy. The items in this battery included a mix of multiple choice questions, each of which had either one or multiple correct answers.
Given that this was the first application of this particular battery, we conducted some additional analyses (after baseline data collection but before endline data collection) to investigate the reliability of these survey items. The goal of these analyses was to determine whether the questions included in the final RCT analysis were sufficiently difficult that not all respondents answer them correctly and that they differentiate sufficiently between participants of varying knowledge levels.
After completing baseline data collection, we therefore investigated the discrimination and difficulty of the knowledge items using an item response theory (IRT) model. We specified a unidimensional, 3-parameter logistic IRT model where the test items were variables capturing binary correct/incorrect responses to our knowledge battery. We used the estimated model to investigate the difficulty and discrimination parameters of each item in the knowledge battery.
As a result of the IRT analysis, we decided to exclude 10 items of the knowledge battery from the RCT analysis. These items either had very low difficulty (thereby suggesting that they were too easily answerable by the vast majority of our respondents) or had low discrimination parameters (thereby suggesting that they were ineffective at distinguishing between participants with higher/lower levels of evaluation knowledge). We therefore included the remaining 27 items in the construction of our outcome measure (at both baseline and endline) for the final analysis.
6.3 Analysis Strategy
The primary analysis aims to estimate the intention to treat effect (ITT) of being assigned to participate in stage 1 of the Academy on three pre-specified outcome variables (two primary outcomes, one secondary outcome):
- Confidence in Delivering Evaluation Training (Confidenceit , primary outcome)
- Size of Evaluation Network (EvaluationNetworkit , primary outcome)
- Evaluation Knowledge (EvaluationKnowledgeit , secondary outcome)
For each outcome (which we denote in using Yi, t below), we estimate treatment effects using a covariate-adjusted linear regression model of the following form:
Yi, t=1 = β₀+β₁Treatmenti+β₂Yi, t=0+dd Departmenti,d+ggGradei+દit
Where:
- Yi, t=0 is the outcome variable for individual i at baseline
- Yi, t=1 is the outcome variable for individual i at endline
- Treatmenti is an indicator equal to 1 if individual i was assigned to the treatment group and 0 if assigned to the control group
- Departmenti,d is a vector of dummy variables denoting the government department or public body of the individual at baseline
- Gradei,g is a vector of dummy variables denoting the individual’s civil service grade at baseline
- દit is the error term
Our primary quantity of interest is β₁, the coefficient on the treatment variable which is an estimator for the intention to treat effect. The analysis strategy aims to maximise the power of the design by controlling for a set of covariates that we expected to be associated with endline survey responses. In addition to controlling for the relevant baseline survey responses (e.g. when estimating the effect of the treatment on evaluation confidence at endline, we will control for evaluation confidence at baseline), we also include controls for the department and the grade[footnote 19] (measured at baseline) of our participants on the basis that these variables are also likely to be predictive of the three outcomes we study.
Because treatment was randomly assigned within departments, our analysis strategy must respect this block structure. The key principle is that treatment and control groups should be compared within, not across, departments. To ensure valid inference, our regression model includes department fixed effects, which control for between-department differences in outcome levels and mean that our estimates of the treatment effect is identified only through within-block variation in treatment statuses. This thereby aligns the analysis with the design of the trial. An alternative approach would be to use a weighted regression, where each observation is weighted by the inverse of its treatment probability within its block (Gerber and Green 2012, 116-117). This method also ensures comparisons are made within blocks and accounts for any imbalance in treatment probabilities. While our primary analysis uses the fixed-effect approach, we include the weighted regression method as a robustness check within our multiverse analysis (see section 6.8).
We estimate this model separately for each of the three outcome variables. We pre-specified three directional hypotheses corresponding to our research questions.
- H1: The train-the-trainer stage (stage 1) of the Evaluation Academy has a positive impact on participants’ confidence in delivering evaluation training
- H2: The train-the-trainer stage (stage 1) of the Evaluation Academy has a positive impact on the size of participants’ evaluation networks
- H3: The train-the-trainer stage (stage 1) of the Evaluation Academy has a positive impact on participants’ evaluation knowledge
Given the modest sample size, the non-normality of some of our outcome variables, and our blocked randomisation procedure, traditional approaches to conducting hypothesis tests and calculating standard errors do not adequately account for the actual assignment mechanism and may result in incorrect estimates of uncertainty. As a result, we instead report p-values and confidence intervals based on a randomisation inference procedure. To implement the randomisation inference procedure, we randomly generate 10,000 alternative treatment assignments, implement the analysis strategy described above, and calculate p-values under the sharp (one-tailed) null hypothesis of no effect.
To account for multiple hypothesis testing across our three outcomes, we control the false discovery rate at =0.05 using the Benjamini-Hochberg procedure (Benjamini and Hochberg 1995). This approach limits the expected proportion of false positives among the outcomes we declare statistically significant.
We conducted power calculations ahead of the trial to understand the range of effect sizes we could detect with acceptable power considering our sample size was constrained by programme delivery. These power calculations revealed our design was able to reliably detect effects of approximately 0.4 standard deviations in each of our outcome variables at 80% power. While these effect sizes are non-trivial, it is also a priori plausible that effects of that magnitude could result from the trial given the relatively intensive nature of the Academy training. Further detail on the power analysis can be found in the pre-registered statistical analysis plan for the evaluation (Beckett et al. 2025).
6.4 Participant Feedback Questionnaire
The following questions are asked to participants on the final day of the course through a slido format and facilitated by the course leader.
1. Thinking about the overall experience, to what extent do you think you can apply what you’ve learned to your work?
a. “1 not at all” - up to “5 a lot”
2. Thinking about the workshops the facilitator led - e.g. facilitating impactful training/making learning stick/reflections. How useful were they to help prepare you to facilitate the Academy Modules?
a. “1 not useful” - up to “5 extremely useful”
3. Thinking about the overall experience, for your experience level, the training was…
a. too advanced
b. about right
c. too basic
4. Thinking about the workshops the facilitator led - e.g. facilitating impactful training/making learning stick/reflections. The balance between theory and practical was…
a. the right balance
b. Too much theory
c. Too many practical activities
5. What was the most interesting thing you learned?
6. If you could change one thing about this course what would it be?
7. Thinking about the Teach-In. How useful were they help prepare you to facilitate the Academy Modules?
a. “1 not useful” - up to “5 extremely useful”
8. Thinking about the Delivery Practice and Coaching. How useful were they help prepare you to facilitate the Academy Modules?
a. “1 not useful” - up to “5 extremely useful”
9. Thinking about the Masterclass. How useful were they help prepare you to facilitate the Academy Modules?
a. “1 not useful” - up to “5 extremely useful”
6.5 Evaluation Academy Agenda
Week 1
Tuesday 1st July
| Time | Session Title | Group |
|---|---|---|
| 9:30 - 10:00 | Welcome tea & coffee | - |
| 10:00 - 10:30 | Welcome and opening remarks from Cat Little | All |
| 10:30 - 11:15 | Intro to academy / housekeeping / norms and culture building | All |
| 11:15 - 12:30 | Overview of the Evaluation Academy | All |
| 12:30 - 13:15 | Lunchtime | - |
| 13.15-14.45 | Intro to Evaluation - teach-in with Eval Experts | Cohort 1 |
| 13.15-14.45 | Theory of change - teach-in with Eval Experts | Cohort 2 |
| 13.15-14.45 | Scoping an Eval - teach-in with Eval Experts | Cohort 3 |
| 14:45 - 15:00 | Break | - |
| 15:00 - 16:30 | Intro to eval - delivery practice and coaching | Group A and Group B |
| 15:00 - 16:30 | Theory of change - delivery practice and coaching | Group C and Group D |
| 15:00 - 16:30 | Scoping an eval - delivery practice and coaching | Group E and Group F |
| 16:30 - 16:45 | Reflections | All |
Wednesday 2nd July
| Time | Session Title | Group |
|---|---|---|
| 9:00 - 9:30 | Welcome tea & coffee | - |
| 09:30 - 09:45 | Intro to the day | All |
| 09:45 - 11:15 | Workshop: Facilitating impactful training | All |
| 11:15:11:30 | Break | - |
| 11:30-13:00 | Planning and managing an evaluation - teach-in with eval experts | Cohort 1 |
| 11:30-13:00 | Process evaluation - teach-in with eval experts | Cohort 2 |
| 11:30-13:00 | Experimental eval designs - teach-in with eval experts | Cohort 3 |
| 13:00 - 13:45 | Lunchtime | - |
| 13.45-15:15 | Planning and managing an evaluation - delivery practice and coaching | Group A and Group B |
| 13.45-15:15 | Process evaluation - delivery practice and coaching | Group C and Group D |
| 13.45-15:15 | Experimental eval designs - delivery practice and coaching | Group E and Group F |
| 15:15 - 15:30 | Break | |
| 15.30-16.30 | Applying behavioural insights to make learning stick / reflections | All |
Thursday 3rd July
| Time | Session Title | Group |
|---|---|---|
| 9:00 - 9:30 | Welcome tea & coffee | - |
| 09:30 - 09:40 | Intro to the day | All |
| 09:40 - 10:40 | Communicating evidence - teach-in with eval experts | All |
| 10:40 - 10:45 | Transition time | - |
| 10:45 - 12:15 | Value for Money - teach-in with eval experts | Cohort 1 |
| 10:45 - 12:15 | Theory based evaluations - teach-in with eval experts | Cohort 2 |
| 10:45 - 12:15 | Quasi-experimental designs - teach-in with eval experts | Cohort 3 |
| 12:15 - 13:15 | Lunchtime | - |
| 13.15-14:45 | Vfm designs - delivery practice and coaching | Group A and Group B |
| 13.15-14:45 | Theory based evaluations - delivery practice and coaching | Group C and Group D |
| 13.15-14:45 | Quasi-experimental designs - delivery practice and coaching | Group E and Group F |
| 14:45-14:55 | Break | - |
| 14:55 - 15:55 | Communicating evidence - delivery practice and coaching | Group A, B, C, D, E, F |
| 16:00 -16:30 | End of first week reflections with David Halpern + masterclass instructions / prep | All |
Week 2
Tuesday 8th July
| Time | Session Title | Group |
|---|---|---|
| 9:30 - 10:00 | Welcome tea & coffee | - |
| 10:00 - 10:15 | Intro to the day | All |
| 10:15 - 12:30 | Masterclass cohort 2 (6x groups) | Red, Yellow, Green, Orange, Blue, Purple |
| 12:30 - 13:30 | Lunchtime | - |
| 13:30 - 15:45 | Masterclass cohort 3 (x6 groups) | Red, Yellow, Green, Orange, Blue, Purple |
| 15:45 - 16:00 | Break | - |
| 16:00-16:30 | Reflections and closing | All |
Wednesday 9th July
| Time | Session Title | Group |
|---|---|---|
| 9:30 - 10:00 | Welcome tea & coffee | - |
| 10:00 - 10:15 | Intro to the day | All |
| 10:15 - 12:30 | Masterclass cohort 1 (6x groups) | Red, Yellow, Green, Orange, Blue, Purple |
| 12:30 - 13:30 | Lunchtime | - |
| 13:30 - 14:15 | Existing trainer panel | All |
| 14:15 - 15:30 | Summary Activity and Endline Survey | All |
| 15:30 - 16:00 | Graduation with Lucie Moore & Nick Donlevy | All |
6.6 Descriptive Results
The following section presents descriptive statistics for our three outcome variables at the point of randomisation, which was conducted just after baseline data collection.
6.6.1 Baseline Data
Confidence in Delivering Evaluation Training
The confidence outcome variable we use in our primary analysis is formed from the mean response of participants across two questions measuring self-reported confidence in delivering evaluation training. We present the distribution of this outcome variable from our baseline survey in the left-hand panel of Figure 8 below. Confidence scores were approximately normally distributed with a mean of 3 and a standard deviation of .92. While a small fraction of participants provided the maximum score across the two components of this variable, the distribution implies that ceiling effects are likely to be limited and therefore that this measure was likely to be adequately sensitive to detect upward changes in endline responses.
Size of Evaluation Network
The network size outcome variable measures how many individuals across government respondents would feel comfortable approaching for advice on evaluation. We present the distribution of this outcome variable from our baseline survey in the centre panel of Figure 8 below. The distribution of this variable was positively skewed with a mean of 7.3, a median of 5, and a standard deviation of 6.5. A small fraction of respondents provided large (though not implausible) network size values, which again indicated the potential for upward movement in endline responses.
Evaluation Knowledge
The secondary outcome variable of evaluation knowledge is calculated by taking the proportion of correct responses across a battery of 27 questions which covered a wide range of evaluation-related subjects, such as developing a Theory of Change, scoping an evaluation, and technical knowledge of process, impact and value for money (VfM) methodologies.
We present the distribution of this outcome variable from our baseline survey in the right-hand panel of Figure 8 below. Evaluation knowledge scores were approximately normally distributed with a mean of .66 and a standard deviation of .14. No participant in our baseline data had a perfect knowledge score but it was clear that, as previewed in our discussion of the Theory of change for the programme, the participants of the first stage of the Academy did (on average) have reasonably good baseline levels of evaluation knowledge. That said, there was meaningful variation across participants, and baseline knowledge was far from uniform, which indicated that there remained scope for improvement in the endline survey.
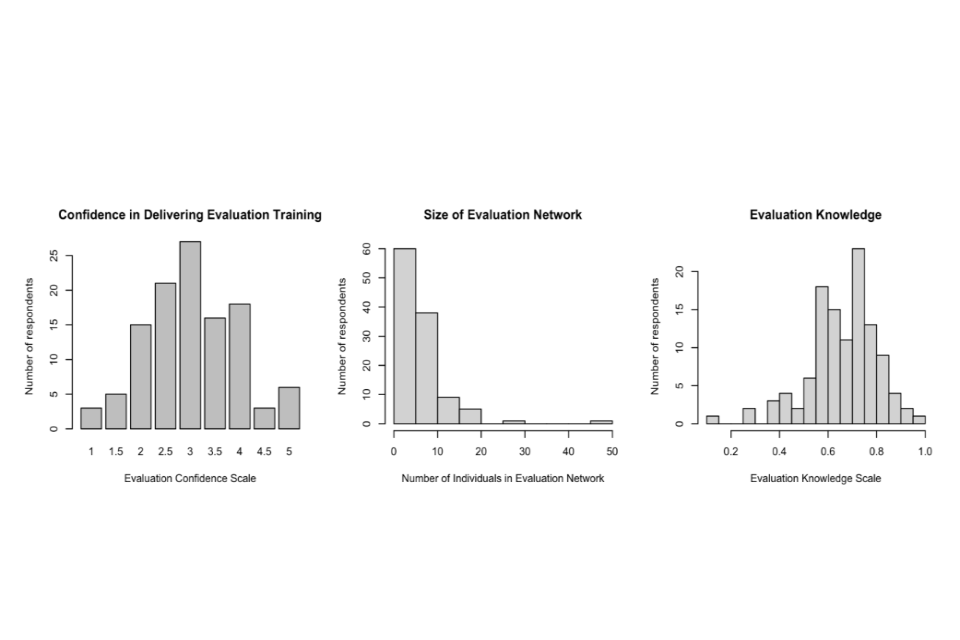
Figure 8: Distribution of outcome variables at baseline
6.6.2 Endline Data
The outcomes used in the analysis were confidence in delivering training, size of evaluation network, and evaluation knowledge. This section presents descriptive statistics of the endline variable for each outcome.
Confidence in Delivering Evaluation Training (primary outcome)
The participants in the final analysis (114 participants) had a mean endline confidence score of 3.57 on a five point scale ranging from 1 to 5 and a standard deviation of 0.85. The treatment group had a mean of 3.92, a median of 4 and a standard deviation of 0.6 whereas the control group had a smaller mean of 3.17, a median of 3 and a standard deviation of 0.91.
Size of Evaluation Network (primary outcome)
The participants in the final analysis (114 participants) had a mean endline network of 12.33, a median of 8 and a standard deviation of 18.56. The treatment group had a mean of 16.76, a median of 10 and a standard deviation of 24.08. The control group had a mean of 7.4, a median of 5 and a standard deviation of 6.44. The particularly large standard deviation of the treatment group is due to two participants responding with particularly large network sizes. In annex section 5.7 we demonstrate that removing these two outliers does not affect the substantive findings reported below.
Evaluation Knowledge (secondary outcome)
The participants in the final analysis (114 participants) had a mean evaluation knowledge score at endline of 0.7, a median of 0.7 and a standard deviation of 0.13. The treatment group had a mean evaluation score of 0.72, a median of 0.74 and a standard deviation of 0.12 whereas the control group had a mean endline knowledge score of 0.6, a median of 0.69, and a standard deviation of 0.13. No respondent answered all questions in the battery correctly in the endline survey, with the highest score of 0.96 being achieved from a respondent in the treatment group.
6.7 Accounting for Attrition and Non-Compliance
Attrition occurs when some participants who provide baseline data do not go on to provide data in the endline survey. Non-compliance occurs when participants in the treatment group fail to receive the treatment, or when participants in the control group go on to participate in the treatment.
We have evidence of low levels of attrition and non-compliance in the trial. Of the 118 people originally enrolled across both treatment and control groups, we have 114 with endline data, indicating an attrition between survey waves of just 3.4%. In addition, there was a low level of one-sided non-compliance with treatment, with 11.6% of treatment group respondents failing to participate in the Evaluation Academy (we have perfect compliance in the control group).
We pre-registered different strategies for checking the sensitivity of our results to attrition and non-compliance. First, we address non-compliance in our treatment group by estimating Complier Average Treatment Effects (CATE) using a two-stage least-squares approach (Gerber and Green 2012, 151). In this context, the CATE provides the average treatment effect for those participants who actually complied with their assigned treatment. We define non-compliers in the treatment group as those who failed to attend all of the Academy sessions, as we do not have more fine-grained data on attendance rates.
Complier Average Treatment Effects
Point estimates with 95% Confidence Intervals
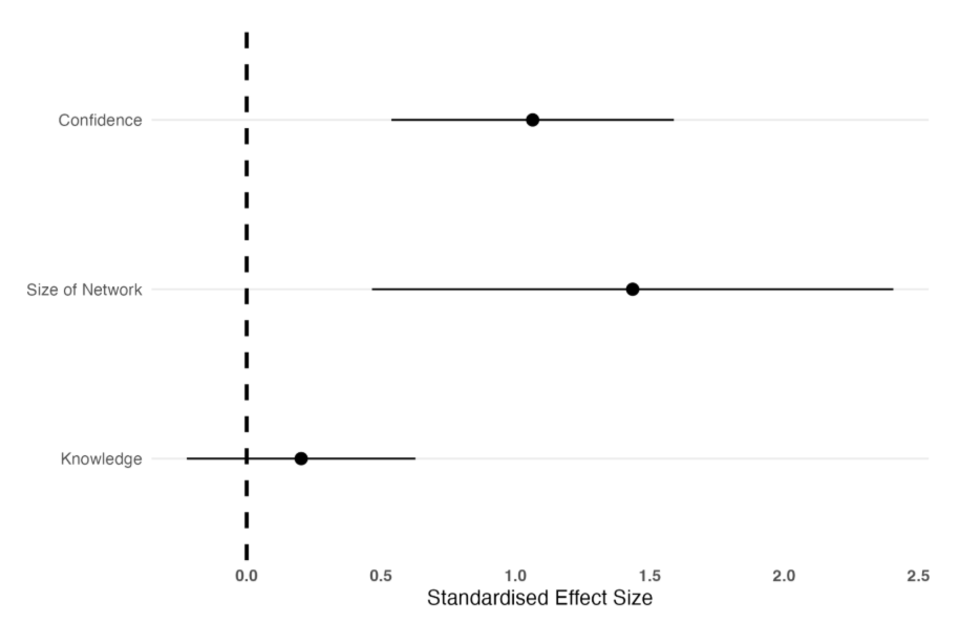
Figure 9: The figure presents Compiler Average Treatment Effects (CATE) from a two-stage least squares approach. The CATE provides estimates of the average treatment effect for those participants who complied with their treatment assignment
We present estimates of the CATE for each outcome variable in Figure 9. As is clear from the figure, adjusting for non-compliance makes very little difference to the effect estimates from the trial.
Second, we pre-registered an intention to implement a robustness check in which we would use inverse-probability of treatment weights (IPAWs) to adjust for differential attrition. IPAWs measure the inverse of the probability of a given observation being observed in a given analysis, on the basis of the observable covariates of that observation. However, IPAWs require estimating the relationship between attrition and the available covariates and because we have very low levels of attrition, these weights are likely to be very poorly calibrated in our setting. We therefore decided not to implement this analysis.
Instead – and as also pre-registered – we calculate “worse-case” or “extreme-value” bounds on the treatment effects for all three outcome variables (Lee 2009). Extreme-value bounds on the treatment effects assess the potential consequences of differential attrition by examining how the estimated treatment effect would vary when making different assumptions about the missing potential outcomes that arise due to non-response.
We construct these bounds separately for each outcome variable by following the procedure in Lee (2009). Intuitively, this procedure works by “trimming” either the treatment or control observations such that the share of observations with observed outcomes at endline is the same for both groups. The trimming process is implemented to correspond to two extreme assumptions about the missing information. In our case, the bounds are formed by trimming the control group observations (the group with higher attrition) such that either the largest or smallest values are excluded from the analysis. We construct an upper bound on the treatment effect by excluding the control group observations with the largest outcome values. We construct the lower bound on the treatment effect by excluding the control group observations with the smallest outcome values. The resulting bounds can be interpreted as the treatment effect that we would have estimated had there been equal attrition between treatment and control groups, under different assumptions about which units dropped out of the sample.
We present the results of the bounds analysis in Table 7 below. Given the low levels of attrition overall, the estimated bounds on the treatment effects are very narrow and in no case do the bounds overlap with zero, indicating that the substantive conclusions that we draw from the main analysis are unaffected by this sensitivity check.
| Outcome | Estimate | Lower Bound | Upper Bound |
|---|---|---|---|
| Confidence | 0.76 | 0.67 | 0.83 |
| Size of Network | 9.21 | 8.97 | 9.89 |
| Knowledge | 0.04 | 0.03 | 0.05 |
Table 7: Lee (2009) bounds for treatment effects. The table presents treatment effect bounds that bracket the possible range of treatment effects after accounting for differential attrition between treatment and control groups. The lower and upper bounds correspond to the most extreme assumptions about the missing information that are consistent with the observed data.
6.8 Multiverse Analysis
All quantitative analyses require making analytical decisions which can be consequential for the resulting estimates. The analysis presented above follows the statistical analysis plan that we preregistered before commencing endline data collection (Beckett et al. 2025). Nevertheless, it is possible that the estimates we present would have changed substantially had we made different analysis decisions, even if they were preregistered.
In order to assess this possibility, we present below the results of a multiverse analysis (Steegen et al. 2016). A multiverse analysis is a systematic approach to conducting robustness checks for an evaluation. Rather than reporting results from one (potentially arbitrary) statistical analysis, or presenting results from one set of (potentially arbitrary) robustness checks, in a multiverse analysis we identify all reasonable analytical choices that could have been included in a statistical analysis plan and systematically produce and report results for each possible combination of these choices.
We identify 6 sets of analytical choices that could be consequential for the estimates that we present. In particular, we re-run the core analyses in the evaluation, varying whether we:
- Control for the department of participants
- Control for the grade of participants
- Control for baseline outcome measures
- Estimate treatment effects using Ordinary Linear Regression (OLS) or Two-Stage Least Squares (TSLS) regression (as in section 6.7)
- Weight our regression approaches using inverse-probability of treatment weights (as suggested in Gerber and Green (2012, 222))
- Remove observations with large outlying values on the Size of Network outcome variable (Only for the Size of Network outcome analysis)
To implement our multiverse analysis, we estimate the treatment effects for each of our outcome variables for each combination of choices listed above. For the Confidence and Knowledge outcomes, that results in 25=32 total analyses, and for the Networks outcome (where we also vary whether we exclude outlying data points) it results in 26=64 total analyses. Each analysis produces a treatment effect estimate relating to a particular outcome variable from a particular combination of analysis choices.
With these estimates in hand, we can assess the degree of variability in the estimates in order to understand the robustness of the results presented in the evaluation. To do so, we use a specification curve (Simonsohn, Simmons, and Nelson 2020), which orders all the estimates from the multiverse analysis from the most negative effect to the most positive effect, and indicates which effect pertains to which analytical specification. We present specification curves for all three outcome variables in Figure 10 below.
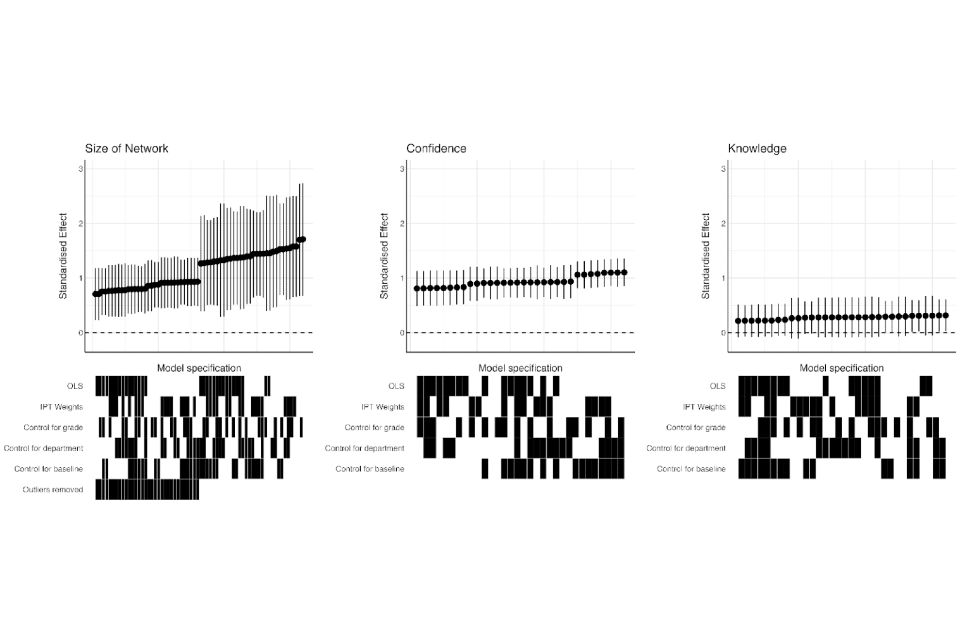
Figure 10: Specification curve. Each point in the top panels represents the estimated effect of attending the Evaluation Academy on the relevant outcome, alongside associated 95% confidence intervals. The boxes aligned vertically below (under “Model specification”) indicate the analytical decisions behind the relevant estimates in the panels above. A total of 64 specifications were estimates for the Size of Network outcome, and 32 specifications for the Confidence and Knowledge outcomes.
The y-axis of the top panels of Figure 10 measures the treatment effect for each of our outcome variables, and the x-axis indicates the specification to which that treatment effect relates. The boxes aligned in the bottom panels indicate the analytical decisions behind each specification and estimate. For instance, the left-most specification for the Confidence outcome was an OLS regression, using inverse-probability of treatment weights, where we control for grade, but do not control for either department or the baseline outcome. By contrast, the left-most specification for the Size of Network outcome was an OLS regression estimated without IPT weights, with no control variables, and where outlying values were removed.
In general, the specification curves reveal that the estimates we produce are largely insensitive to the analytical decisions we employ. For the Size of Network and Confidence outcomes, the effects are positive and significant regardless of which specification is used, though there is some variation in effect magnitude. Most notably, it is clear that removing outlying values from the Size of Network variable both decreases the magnitude of the estimated treatment effect and the uncertainty associated with that effect (as indicated by the narrowing of the confidence intervals for specifications in which outliers are removed). For the Knowledge outcome, regardless of specification, we estimate small positive treatment effects which are generally insignificantly different from zero.
Overall, this analysis is reassuring as it strongly implies that the substantive conclusions we draw from the evaluation are not sensitive to the specific analytical decisions we employ.
-
Due to the variation in how stage 2 of the programme is delivered across departments, it was not practical to include this stage within this study. ↩
-
Materials relevant to the 2024 version of the Evaluation Academy. While some minor changes were made to the content of some modules (particularly the quasi-experimental design module) for the 2025 version of the Academy, the structure of the course remained unchanged. ↩
-
Please see more information about the Evaluation and Trial Advice Panel. ↩
-
Participants were given 30 minutes to complete the survey in this format before. Any participants who needed extra time were moved into a separate room to finish their responses while the other participants moved onto a wash-up activity. ↩
-
This question battery also included a third option (“Knowing where to go for support with evaluation design and training”) but we do not include this as one of our outcomes of interest here. ↩
-
In the baseline data collection, these questions have a Pearson’s correlation coefficient of .6, giving us confidence that they are measuring a common latent factor. ↩
-
An alternative approach would be to use the respondent-level scores from an IRT model as our outcome variable. However, the correlation between the individual latent scores from the IRT model and the proportion of correct responses is .88 across respondents in our baseline survey. This suggests that there is little advantage to using the IRT scores as the outcome variable and given that the additive index is significantly easier to interpret, we opt to use the simpler measure as our outcome variable. ↩
-
Because each department nominated only a relatively small number of participants, and some departments nominated odd numbers of participants, treatment probabilities varied marginally across blocks. ↩
-
We have a small number of non-compliers in our treatment group (see section 2.7 below). As a consequence, the ITT effects presented below are highly unlikely to differ substantively from the analogous average treatment effects. Nevertheless, in annex 6.7 we present results from a two-stage least-squares approach which estimates complier average treatment effects and demonstrates that none of our conclusions are dependent on this decision. ↩
-
This directional approach is consistent with standard practice when theory and programme design strongly suggest that any effect – if it exists – will be positive. Pre-specifying one-tailed tests improves statistical power without inflating Type I error, provided the direction is clearly justified and registered in advance, as it is here (Gerber and Green 2012, 64-66). Nevertheless, none of the inferential tests we present below are sensitive to this choice: any time we reject the null hypothesis of no effect using a one-tailed test, we can also reject the null hypothesis of no effect using a two-tailed test. ↩
-
None of the control group respondents attended the Academy. ↩
-
Some of the respondents assigned to the treatment group did not attend the Academy but did provide responses to our endline survey. Due to this non-compliance in the treatment group, the estimated effects described in Table 3 and Figure 2 should be interpreted as intention-to-treat effects (ITT) rather than average treatment effects. That is, they describe the extent to which being assigned to attend the Academy changed outcomes for respondents. In annex section 6.7, we use a two-stage least-squares approach to calculate alternative treatment effects which measure the effect of attending the Academy for those treatment group respondents who complied with their treatment assignment. Our results are substantively identical using this alternative approach. ↩
-
Compliance in the control group is guaranteed by design. ↩
-
Note that the number of participants in the July 2025 Academy is higher than the number of treatment group participants for the impact evaluation. This is because we conducted some additional recruitment post-randomization to fill spaces due to drop-outs. ↩
-
Catherine Little, Chief Operating Officer for the Civil Service and Permanent Secretary to the Cabinet Office. ↩
-
Nick Donlevy, Director of Public Spending at HM Treasury. ↩
-
David Halpern, President Emeritus at the Behavioural Insights Team. ↩