Strategies for evacuation of occupants from high-rise residential buildings involved in fire
Published 5 February 2024
Applies to England

© Crown copyright 2024
This publication is licensed under the terms of the Open Government Licence v3.0 except where otherwise stated. To view this licence, visit nationalarchives.gov.uk/doc/open-government-licence/version/3 or write to the Information Policy Team, The National Archives, Kew, London TW9 4DU, or email: psi@nationalarchives.gov.uk.
Where we have identified any third party copyright information you will need to obtain permission from the copyright holders concerned.
This publication is available at https://www.gov.uk/government/publications/evacuation-from-high-rise-residential-buildings-involved-in-fire/strategies-for-evacuation-of-occupants-from-high-rise-residential-buildings-involved-in-fire
Summary report of operational research and testing conducted by the University of Central Lancashire
1. Executive summary
This is a Home Office summary report of live evacuation testing research conducted by the University of Central Lancashire (UCLan) to test the efficiency of evacuation strategies from high-rise residential buildings (HRRBs) using 5 live operational testing strategies. The Home Office derived this summary in its entirety from the original live evacuation testing research conducted by UCLan and reflects UCLan’s analysis and interpretation of the original dataset. This summary helps make findings accessible to a wide range of stakeholders in the fire and rescue service sector.
The Home Office derived the following research questions based on the methodology applied:
Research Question 1: Which strategies are likely to lead to the fastest evacuation of a high-rise residential building?
Research Question 2: To what extent do each of the evacuation strategies lead to congestion in stairwells?
Research Question 3: What impact do evacuees with impairments have on evacuations?
Research Question 4: What further factors could affect live evacuations from high-rise residential buildings?
Research Question 5: How accurately can Pathfinder modelling software simulate the live evacuation testing?
The study comprised live operational tests of 5 evacuation strategies between 3 and 6 May 2022, using fire and rescue service (FRS) staff and other volunteers from stakeholder groups to act as residents. The research tested 5 evacuation strategies of a HRRB during a fire incident when it becomes untenable to expect residents to remain in the building, and the FRS Officer in Charge (OIC) initiates a full evacuation.
These results cover one of the 2 tests conducted for each of the following 5 strategies. For each strategy tested, UCLan processed data with the most complete video data. Tests analysed were:
Test 1-1 of Strategy 1: A full simultaneous evacuation using an Evacuation Alert System (single staircase).
Test 2-2 of Strategy 2: A full evacuation with door-knocking alerts from bottom to top of the building, without an Evacuation Alert System (single staircase).
Test 3A-2 of Strategy 3A: A full evacuation using an Evacuation Alert System (single staircase): phased bottom-up from above the fire.
Test 3B-2 of Strategy 3B: A full evacuation using an Evacuation Alert System (single staircase): phased top-down from above the fire.
Test 4-2 of Strategy 4: A full simultaneous evacuation using an Evacuation Alert system with 2 staircases.
In this report, ‘strategy’ refers to the overall evacuation approach, whereas ‘test’ refers to the live trial of a strategy.
The results are limited to the specific conditions of the tests and by the number of tests performed, and so there is uncertainty around how results would be affected if the test conditions changed. The report has made comparisons between tests that are approximately equivalent. However, it should also be noted that while these controls created a degree of consistency between the strategy tests, there were multiple factors which changed between them, including the number of evacuees, which may have influenced the results.
1.1 Research Question 1: Which strategies are likely to lead to the fastest evacuation of a high-rise residential building?
The findings indicate that 2 staircases are likely to support a faster evacuation from a HRRB than one staircase. Where 2 staircases were used (one for evacuation and one for firefighting), evacuation times were shorter than all other evacuation strategies. Strategy 1 and Strategy 4 both tested full evacuations with an Evacuation Alert System (EAS). Test 4-2 (with 2 staircases) was completed in 9 minutes 2 seconds (542 seconds), approximately half the time of Test 1-1 (with single-staircase), which was completed in 19 minutes 15 seconds (1,155 seconds).
For operational decision-makers, the findings suggest that using an EAS (Strategy 1) results in faster evacuation than a door knocking system (Strategy 2). In Test 1-1, the EAS sounded on all floors within 2 minutes and the final evacuee left within 20 minutes. Whereas in Test 2-2, where the test replicated manual floor-by-floor door knocking, it took over 28 minutes to complete.
The findings were not clear in showing whether either a ‘top-down’ or ‘bottom-up’ evacuation strategy is faster and should be preferred during an evacuation. While the ‘top-down’ test was completed in less time than ‘bottom-up’, confounding variables in the tests mean further research would be required to establish robust conclusions. It should also be noted that the effectiveness of such evacuation strategies would also be sensitive to several factors not explored here (for example, different building configurations, fire location)
1.2 Research Question 2: To what extent do each of the evacuation strategies lead to congestion in stairwells?
Findings identified more congestion developed following the EAS signal (Strategy 1) than when firefighters co-ordinated the timing of door-knocking signals on floors (Strategy 2). When the door-knocking strategy was applied, the maximum queue length was 6 people, compared with queues of up to 25 people in stairwells when EAS was used. This was possibly due to the EAS more effectively initiating evacuation movement.
Higher levels of congestion did not necessarily lead to slower evacuation time. While the double-staircase test (Test 4-2) resulted in large queues behind evacuees walking with crutches, the queues did not prevent the 2-staircase firefighting and evacuation completing in far less time (by over 10 minutes) than when firefighting and evacuation combined in a single staircase (Test 1-1). In Test 4-2, the total evacuation time was 9 minutes 2 seconds (542 seconds) with 79 participants, whereas Test 1-1 had a total evacuation time of 19 minutes 15 seconds (1,155 seconds) with 80 participants.
Evacuees moving at a slower pace often caused congestion. Queues formed where evacuees were ‘caught up’ with those moving at a slower pace and occupying additional space in stairwells. This included some who were asked to walk at half pace with crutches, and evacuation chairs guided by one or 2 other people (evacuees or firefighters).
When implementing strategies as part of real evacuation plans, consideration should be given to potential congestion. As well as affecting evacuation time, congestion may have further consequences, such as increased likelihood of slips and delays to access the staircase. It should also be noted that the emotional impact of congestion was not tested, and that this may impact overall evacuation times in a live situation.
1.3 Research Question 3: What impact do evacuees with impairments have on evacuations?
Indicative findings suggest that people evacuating other residents on evacuation chairs can delay the movement of those evacuees behind them. Such delays may also be affected by the degree of familiarity with the evacuation chair equipment and (for firefighters) the cumbersome nature of the equipment worn.
The higher the floor where the residents with impairments were located, the greater the total evacuation time for the evacuees behind them. There was evidence for Tests 1-1, 2-2 and 3A-2 that speeds may be limited for those starting on higher floors, because the transit of evacuees with mobility impairments impacted the speed of those joining stairwells from higher floors.
The appropriate evacuation strategy may also vary depending on the evacuee’s specific needs, but this study did not find consistency in how evacuation needs impacted upon speed. This may be due to the different evacuation needs – for instance, one evacuee was assisted while others were moving under their own volition. In Test 1-1 (Strategy 1), it was observed that evacuation chairs can move at greater speeds than some evacuees walking with crutches, whereas in Test 2-2 (Strategy 2), the opposite was observed.
1.4 Research Question 4: What further factors could affect live evacuations from high-rise residential buildings?
Local movement speed varied by floor. Faster speeds were generally recorded at lower floors, with slower speeds at the top and in the middle floors of the building, close to the fire, where obstacles and congestions were more likely to be present.
For the majority of evacuees, there was no clear effect of having obstacles on the floor, such as hoses. But it was observed that the speed of evacuees with impairments, especially those using crutches, was reduced on those floors.
Evacuees who were instructed to climb stairwells first, rather than immediately evacuate, did not have a demonstrable negative effect on other evacuees. However, the impact of upward movement of evacuees cannot be ruled out when combined with other factors, such as flow density and evacuees with mobility impairments descending.
Similarly, movement of firefighters within the staircase did not appear to have a major impact on evacuation times. However, in some instances where the OIC initiated the activation of the EAS after receiving information that the preceding floor had been cleared, the counter flow of firefighters moving to alert higher floors impacted on movement speed of some evacuees.
1.5 Research Question 5: How accurately can Pathfinder modelling software simulate the live evacuation testing?
The findings suggest that the Pathfinder modelling software, using data from live operational tests, may accurately predict these outcomes via software simulations. This would help reduce the need for full-scale live operational tests to consider changes in evacuation scenario parameters (or might enhance confidence in the test results by allowing replication).
However, it should also be noted that the close match to the live operational tests may be due to an element of over-fitting in the model. This is shown through model variables being tailored to observations from the trial, rather than to expected values from literature. This significantly reduces the extent to which the results can be extrapolated to other strategies.
Overall, the Pathfinder modelling software gave reasonable predictions of results for 4 of the strategies tested (Strategy 1, 2, 3A and 3B), but not for Strategy 4 (which used 2 staircases).
2. Introduction
This is a Home Office summary research report of live evacuation testing conducted by the University of Central Lancashire (UCLan) to test the efficiency of evacuation strategies from high-rise residential buildings (HRRBs) using 5 live operational testing strategies. The Home Office commissioned UCLan to conduct live evacuation testing and follow-up modelling to provide evidence to support the development of national guidelines for carrying out evacuations from HRRBs, which was a recommendation from the Grenfell Tower Inquiry Phase 1. This report summarises key details from a longer paper written by UCLan.
2.1 Acknowledgements
We would like to thank the London Fire Brigade (LFB) for providing access to the building in which UCLan conducted the testing and for the staff who helped run and participate in the live testing. We are also very grateful to all the participants who acted as residents in the evacuation tests. We would like to thank UCLan for managing the study and providing the data and much of the content included within this report (Dr Shephard Ndlovu, James Fowler, Dr Eleni Asimakopoulou, Prof Champika Liyanage, Dr Gabriel Ernesto Castelblanc, Dr Khalid Khan, Dr Howard Parkinson, Daniel Basher and Dr Jianqiang Mai). This summary was edited by Will Dawes, Darrelle Cocozza, Clare Lambley, Amy Butler, Alice Plumridge, and Silviya Gancheva from the Home Office.
2.2 Context and background
This report discusses the findings of live evacuation tests conducted in May 2022 and computer modelling based on evacuation simulations. This research sought to explore the most effective methods of evacuating people from HRRBs. The UCLan research team conducted a scoping study prior to the design of the live testing, comprising a literature review and engagement with over 400 key stakeholders, through semi-structured interviews and questionnaires, to understand their experience and views on evacuation from HRRBs. Stakeholders included professional firefighters, building managers and occupants of HRRBs. The scoping study informed the design and methodology of subsequent live evacuation tests. It was recommended that controls should be incorporated into the design to enable consistency with live evacuation tests. This included exploring the impact that residents with impairments and standard firefighting procedures had on each evacuation strategy.
The British Standard for the application of fire safety engineering, BS7974 (BSI, 2019), states that for complex buildings and HRRBs, the fire alarm system should be a hub of both alerting occupants and of connecting with other building management systems. However, stakeholder consultation revealed a research gap around alarm systems, and that only a minority of residents were aware of an Evacuation Alert System (EAS) in their building. As such, this study examines the use of EASs and how they impact on evacuation times. Using findings from the scoping study, the Home Office and UCLan designed a range of tests to understand efficient evacuation strategies.
2.3 Objective and research questions
The objective of this study was to test a range of evacuation strategies in HRRBs to assess the efficiency of the evacuation procedures. While the Home Office set high-level research questions when commissioning UCLan, through the course of scoping and designing the methodology, these questions were not directly assessed in the live operational testing. The Home Office therefore derived the following research questions based on the methodology applied:
Research Question 1: Which strategies are likely to lead to the fastest evacuation of a high-rise residential building?
Research Question 2: To what extent do each of the evacuation strategies lead to congestion in stairwells?
Research Question 3: What impact do evacuees with impairments have on evacuations?
Research Question 4: What further factors could affect live evacuations from high-rise residential buildings?
Research Question 5: How accurately can Pathfinder modelling software simulate the live evacuation testing?
2.4 Evacuation definitions
Evacuation: the direction of people from a dangerous place to somewhere safe.
Simultaneous evacuation: a strategy in which all occupants vacate the building at the same time regardless of their threat exposure prior to evacuation.
Phased evacuation: a strategy in which only occupants at an elevated risk are initially evacuated (such as those in the immediate vicinity of the fire), while others remain in place for later evacuation.
3. Method
The study comprised live operational tests of 5 evacuation strategies between 3 and 6 May 2022, using fire and rescue service (FRS) staff and other volunteers from stakeholder groups to act as residents. These were tests of potential evacuation strategies for situations in which it becomes untenable to expect residents to remain in the building under ‘stay put’ (NFCC, 2017), and so the FRS Officer in Charge (OIC) initiates a full evacuation.
3.1 Evacuation strategies
UCLan tested evacuation strategies twice for each of the following 5 tests (as detailed further in Appendix 2) over a 4-day period, based on the HRRB evacuation strategies identified in the project scoping phase:
Strategy 1 (Test 1-1): A full simultaneous evacuation using an Evacuation Alert System (with a single staircase).
Strategy 2 (Test 2-2): A full evacuation using door knocking, without an Evacuation Alert System (with a single staircase).
Strategy 3A (Test 3A-2): A full evacuation using an Evacuation Alert System (with a single staircase): phased bottom-up from above the fire.
Strategy 3B (Test 3B-2): A full evacuation using an Evacuation Alert System (with a single staircase): phased top-down from above the fire.
Strategy 4 (Test 4-2): A full simultaneous evacuation using an Evacuation Alert System (with 2 staircases).
In this report, ‘strategy’ refers to the overall evacuation approach, whereas ‘test’ refers to the live trial of a strategy.
3.2 Overview of tests
A disused 17-storey tower block used by LFB for various exercises was selected for the evacuation tests as an example of a typical UK HRRB.
For each test, the fire started on floor 6 and was assumed to spread upward to floors 7 and 8. FRS Stairwell Protection Teams (SPT) initiated the evacuation tests based on the Standard Operating Procedures (SOPs) and operational techniques appropriate to this incident (LFB, 2021, LFB, 2017 and NFCC, 2022). Important features of each strategy are as follows.
Strategies 2, 3A and 3B involved FRS evacuating each floor in phases replicating either a floor-by-floor EAS (3A and 3B) or door knocking (Strategy 2). The command given to evacuate each floor level was given on the direction of the Incident Commander based on SOPs and the actual operational activity in the strategy being tested. The time intervals depended on the actual operational activity so cannot be given with precision.
Strategies 1 and 4 used an EAS to alert residents on all floors almost immediately, rather than floor by floor. As such, simultaneous evacuation took place once the alert was given.
Other than for Strategy 1, in which everyone evacuated simultaneously, those on the floor of the fire (floor 6) and the 2 floors immediately above the fire (floors 7 and 8) were evacuated first.
For Strategy 3A, after evacuating the floors around the fire as above, the remaining floors were then evacuated at phased intervals working up sequentially from floor 9 to the top floor (floor 12). Strategy 3B used a similar strategy but instead evacuated ‘top-down’ sequentially from floor 12 to floor 9.
Each strategy (other than 4) was tested using the same stairwell in the block, and the lowest floor in which residents were based was floor 4. For Strategy 4, residents evacuated through another staircase from floor 2, while firefighters operated through the staircase used in the other tests.
Strategies 1, 2 and 4 were tested through the evacuation of 10 floors. Strategies 3A and 3B were tested through the evacuation of 9 floors to control for the different number of volunteers.
Timelines and scripts for the strategies tested were displayed on each locked flat door to instruct how volunteers, who were initially stationed outside the flat door at the beginning of the test, should move during evacuations.
Firefighters commenced each test by checking the ‘Secure Information Box’ (SIB) to identify the locations of residents who required the use of an evacuation chair. This helped firefighters to decide whose evacuation they would commence, if possible, with support from other residents during the early stages of the fire incident (that is, within the first 8 minutes). During the tests, these residents were originally positioned on floors 7 and 4.
It is known that movement speed reduces when the density of people in stairwells increases. Therefore, to maintain population density and demand for stairwell space, when volunteer numbers reduced (for example, through variable attendance, drop-outs), the highest floor was removed from the test (left empty). As such, only 9 floors were used for Tests 3A and 3B.
Each test was performed twice to mitigate the risk of problems occurring during the tests, such as unplanned actions of firefighters/volunteers or technical issues. This ensured there was a full set of video capture data suitable for analysis. The purpose of conducting tests twice was not to increase the statistical validity of any data produced. During tests, some cameras and memory cards failed, so UCLan processed video capture data for one version of each test. The version selected for each test was based on data completeness. The final floor coverage captured for each test and number of participants is shown in Appendix 3, table 6 (processed tests) and table 7 (non-processed tests).
3.3 Data collection
Each stairwell within the building was fitted with battery-powered digital video cameras to collect images and data throughout the tests. Video analytics helped assess stair usage, counter flows, flow rate (persons per minute), individual walking speeds (metres per second (m/s)), and total movement times. Additionally, researchers watched the videos to count evacuees, and to identify hold-ups and any resulting queues.
The ’experimental time’ presented throughout this report corresponds to the time elapsed after the switch from ‘stay put’ to each ‘full evacuation’ strategy. In this report, timings are generally presented as minutes and seconds, but may additionally be reported as seconds only, to correspond with the labelling of analytical graph axes.
3.4 Controls
Each evacuation test had the same fire incident conditions (type, location and resident profile) based on London Fire Brigade operational guidance (LFB, 2021 and LFB, 2017). Appendix 2 outlines the controls put in place throughout each test.
Where possible, volunteers participated in one of the 4 days of testing to avoid becoming overly familiarised with the tests. Literature (SFPE, 2019) has suggested that evacuation times could be reduced if the occupants are aware of the location of the closest exit routes and the existence of fire protective lifts, sprinklers and other safety measures. However, this research did not seek to test against occupant awareness of evacuation methods.
3.5 Participants
FRS recruited participants to act as evacuees using a detailed information sheet and consent form. Not all volunteers participated for the full day, meaning each of the 2 tests did not have the same volunteer populations (outlined in Appendix 3, table 4 and table 5). This report refers to residents, participants, volunteers and occupants as ‘individuals who acted as residents’.
The scoping phase found that few previous studies explicitly considered people with impairments. Therefore, all tests were planned to include at least 10% of evacuees briefed to represent residents with impairments. This provided a more realistic spread of evacuee mobility, occupation of space within stairwells and speed. Briefed evacuees with impairments were assigned specific roles, which included:
- individuals with a mobility impairment (all strategies tested), briefed to walk at half pace (including some using elbow crutches)
- mannequins on evacuation chairs assisted by residents and/or firefighters, used to simulate/represent individuals requiring this method of assistance (see evacuation strategy detail in Appendix 2
- an individual with a visual impairment holding a white cane (Strategies 3A and 3B)
It should also be noted that one volunteer took part with a 3-year-old child (Strategy 2).
In each test (except Test 4-2), one or 2 individuals were briefed to commence by moving up 2 floors (to replicate seeking another resident) from floor 10 while other people were going in the opposite direction, before evacuating at their own walking pace.
3.6 Assumptions and limitations
There are a range of assumptions and potential limitations associated with this research (set out in full in Appendix 7).
Key assumptions included that the external hallway EAS would be fully functioning. The research did not control for the impact of the built environment, smoke on visibility, pre-movement time and social interactions.
The UCLan research team planned the tests before the outcome of the 2021 Personal Emergency Evacuation Plans (PEEPs) consultation, using the prevailing terminology at that time.
The results are limited to the specific conditions of the tests and so there is uncertainty around how results would be affected if the test conditions changed. It should also be noted that while these controls created a degree of consistency between the strategy tests (that is, the same evacuation procedures were adopted aside from the differences in strategies tested), there were multiple factors which changed between them (for example, the number of evacuees, type of impairments present, firefighter activity). It is important to note that the tests did not always include the same numbers of floors. For example, Strategy 3A and 3B used 9 floors while the remaining tests used 10 floors). Similarly, Strategy 4 used a different evacuation stairwell to the other strategy tests. There were also large differences in the number of evacuee participants, meaning much caution should be applied when comparing strategies given some differences between the numbers of evacuees used in each test (the most extreme example was Test 3B-2 with 43 evacuees and Test 1-1 used 80 evacuees).
It is also important to note that the evacuation times are partly a function of the method of evacuation alert and not just the movement times of evacuees. For example, all residents were notified at once in Strategy 1, but for Strategy 2, firefighters verbally notified (as a proxy for door-knocking) each floor, taking approximately 23 minutes to notify the final floor in Test 2-2.
Some participants were instructed to simulate evacuees with impairments, such as using crutches at half pace or carrying people in evacuation chairs. While instruction sought to ensure the impact of these impairments was replicated, other factors may have impacted evacuation speed (for example, familiarity of use of crutches).
In addition, although 2 tests were completed for each strategy, the results are based on a single test of each strategy. This introduces some uncertainty around whether the results would be consistent if tested on multiple occasions. It also makes deriving clear conclusions on what is being tested more challenging (that is, assigning outcomes of research to any one specific change in the test conditions) and softens many of the conclusions.
The research is based on the travel times of participants down the building’s stairwell. It should be noted that the participant evacuation times did not consider:
- the additional response times for FRS to get onsite, as all tests in the research had the service response starting on site
- the additional response times within flats after an alarm was raised and movement from initial location to doorway, as volunteers did not have access to flats and instead began the test at the doorway
- the additional response times for participants who were in evacuation chairs; by using mannequins in evacuation chairs, reaction times do not consider a wheelchair user’s possible exit from a flat, their transfer into an evacuation chair, the likelihood that a person would not weigh the same as a mannequin, nor that a wheelchair may be a possible obstruction in a hallway for other individuals
Although there were limitations, they were present throughout all evacuation strategies and did not affect any individual scenario.
3.7 How the data collected will address the research questions
Research Question 1 (Which strategies are likely to lead to the fastest evacuation of a high-rise residential building?) will be primarily answered through ‘building exit curves’ (percentage exited by time elapsed). It will also consider flow rate (persons per minute), individual walking speeds (m/s), and total evacuation times. The question will specifically look to compare evacuation times across evacuation strategies, with an emphasis on looking at the effectiveness of EASs, the sequence in which floors above the fire were evacuated and the use of one versus 2 stairwells.
Research Questions 2 (To what extent do each of the evacuation strategies lead to congestion in stairwells?) and Research Question 3 (What impact do evacuees with impairments have on evacuations?) will be assessed through video analysis of queues, congestion and individual walking speeds. The questions will also be answered through the assessment of movement of individual evacuees (using person IDs) through each floor of the building by time elapsed and speed. This will allow analysis of flows and bottlenecks to be reviewed to identify potential contributory factors, such as unusual actions (for example, walking upwards) or the presence of evacuees with impairments.
Research Question 4 (What further factors could affect live evacuations from HRRB?) seeks to understand any qualitative factors, not addressed in Research Questions 1 to 3, that were observed during the tests and may impact evacuations (such as those in relation to the evacuation test, the building or behaviour of participants). It will use video analysis to review indicators such as blockages and other factors influencing the outcomes of each strategy tested.
Research Question 5 (How accurately can Pathfinder modelling software simulate the live evacuation testing?) will be addressed through the replication of each of the 5 strategies using Pathfinder simulation software and will use speed and total evacuation times as key metrics.
4. Test results
4.1 Summary of results
These results cover one of the 2 tests conducted for each strategy, which had the most complete video data. Tests analysed were:
Test 1-1 of Strategy 1: A full evacuation using an Evacuation Alert System (single staircase).
Test 2-2 of Strategy 2: A full evacuation using door knocking, without an Evacuation Alert System (single staircase).
Test 3A-2 of Strategy 3A: A full evacuation using an Evacuation Alert System (single staircase): phased bottom-up.
Test 3B-2 of Strategy 3B: A full evacuation using an Evacuation Alert System (single staircase): phased top-down.
Test 4-2 of Strategy 4: A full evacuation using an Evacuation Alert System (2 staircases).
Test 1-1 (Strategy 1) and Test 4-2 (Strategy 4) used simultaneous evacuation on commencement of the EAS. Strategy 2 (2-2) used a door knocking strategy but did not use an EAS.
In Tests 1 and 2, volunteers were originally positioned across 10 floors (floors 13 to 4), while in Test 3A and 3B, volunteers were originally positioned across 9 floors (floors 12 to 4). Test 4 also had volunteers originally positioned across 10 floors, however, they were on floors 2 to 11.
Table 1 presents the evacuation times for all tests at the first camera sighting (when the cameras first pick up movement, indicating that the evacuation has started), and when 25%, 50%, 75% and 100% of participants have evacuated (the total evacuation time).
Any comparisons made between tests should be made with caution, especially where the number of evacuees and floors used were different. This particularly limits comparisons between the tests for strategies 3A/B and the others.
The shortest total evacuation time observed across the different strategies was in Test 4-2, at 9 minutes 2 seconds; whereas the longest total evacuation time was observed in Test 2-2, at 28 minutes 38 seconds.
The first camera sighting in Tests 1-1 and 2-2 was at 6 minutes or above, which is higher than that of Tests 3A, 3B and 4-2, between 2 minutes 47 seconds and 3 minutes 50 seconds.
The times for 25%, 50% and 75% of participants to have evacuated varies across all tests compared to their initial camera sighting. Test 4-2 had comparatively small gaps between these points of around 1 minute. Similarly, Test 1-1 had relatively small gaps of around 2 minutes (ranging from 1 minute 47 seconds to 2 minutes 30 seconds). Test 3A-2 had gaps ranging from 4 minutes 35 seconds to 5 minutes 2 seconds between these evacuation points. Test 3B-2 had gaps ranging from 2 minutes 33 seconds to 5 minutes 44 seconds. Test 2-2 had varying gaps sizes from 2 minutes 38 seconds to 8 minutes 3 seconds.
Table 1: Percentage of persons evacuated and evacuation times for all tests (in minutes and seconds)
| Strategy | 1 | 2 | 3A | 3B | 4 |
|---|---|---|---|---|---|
| Test | Test 1-1 (80 evacuees) | Test 2-2 (68 evacuees) | Test 3A-2 (49 evacuees) | Test 3B-2 (43 evacuees) | Test 4-2 (79 evacuees) |
| 1st camera sighting | 6 mins, 30 secs (390 secs) | 6 mins (360 secs) | 3 mins, 50 secs (230 secs) | 2 mins, 47 secs (167 secs) | 3 mins, 11 secs (191 secs) |
| 25% exited | 8 mins, 17 secs (497 secs) | 13 mins, 10 secs (790 secs) | 8 mins, 52 secs (532 secs) | 7 mins, 31 secs (451 secs) | 4 mins, 18 secs (258 secs) |
| 50% exited | 10 mins, 47 secs (647 secs) | 21 mins, 13 secs (1,273 secs) | 13 mins, 27 secs (807 secs) | 11 mins, 8 secs (668 secs) | 5 mins, 17 secs (317 secs) |
| 75% exited | 12 mins, 58 secs (778 secs) | 23 mins, 41 secs (1,421 secs) | 17 mins, 23 secs (1,043 secs) | 13 mins, 41 secs (821 secs) | 6 mins, 39 secs (399 secs) |
| 100% exited | 19 mins, 15 secs (1,155 secs) | 28 mins, 38 secs (1,718 secs) | 20 mins, 6 secs (1,206 secs) | 18 mins, 1 sec (1,081 secs) | 9 mins, 2 secs (542 secs) |
Across the tests, it was observed that evacuees without impairments did not appear to be majorly affected by firefighting equipment covering the floors, while the speed of evacuees with impairments (for example, those using crutches, or infants) were reduced when there were obstacles.
Similarly, across the tests, the higher the floor where the residents with impairments were located, the greater the total evacuation time for the evacuees behind them.
Furthermore, it was observed that irregular behaviours, for example, evacuees going up during the evacuation, may be successfully prevented when firefighters stay on specific floors. Notably, firefighters deployed as SPTs could offer guidance to evacuees.
There was inconsistency in the evacuation speeds of some evacuees with mobility impairments. In Test 1-1, it was noted that evacuees using an evacuation chair may take less time than evacuees using crutches but in Test 2-2, the opposite was observed, where it could take twice as long as evacuating residents simulating a mobility impairment using crutches.
The main findings for each strategy are outlined in sections 4.2 to 4.6. It should be noted that these sections seek to address key features of each strategy tested, but do not always compare tests directly against each other. Equally, the test results make observations about each test, but cannot always explain the causes. Further detail is outlined in Appendix 4.
4.2 Test 1-1 – Full evacuation using Evacuation Alert System
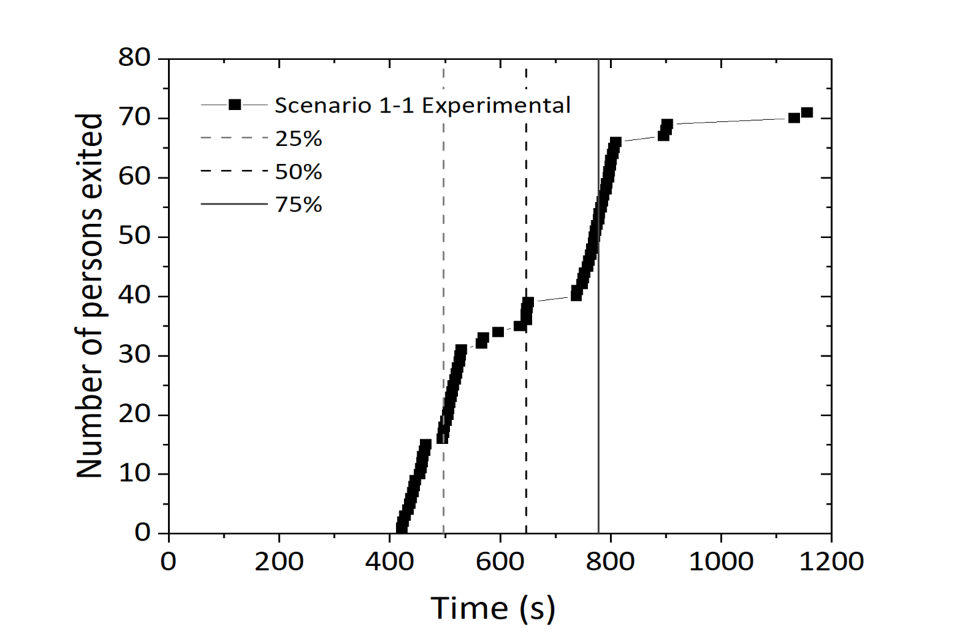
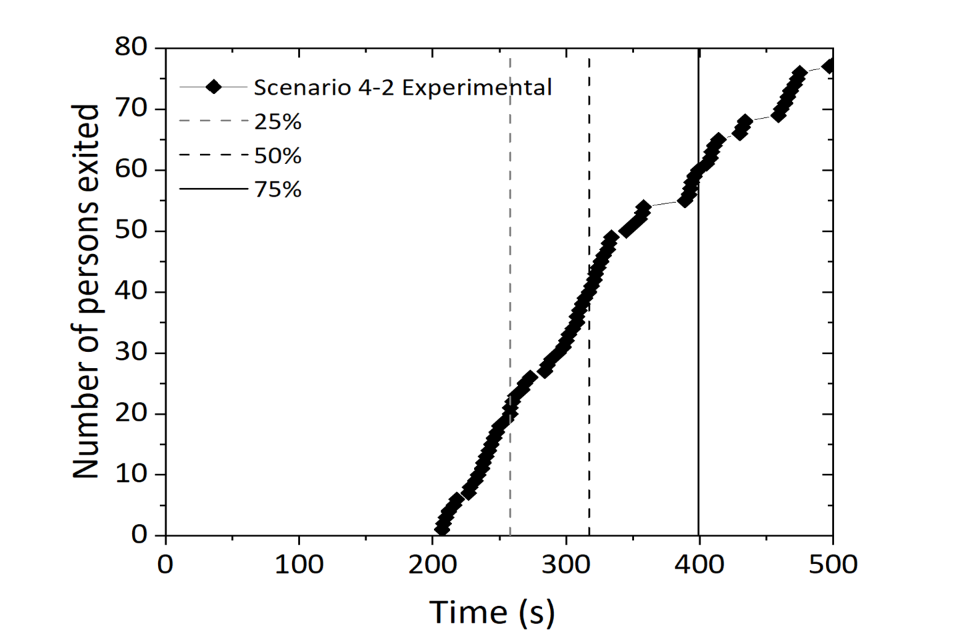
Test 1-1 (Strategy 1) was a simultaneous evacuation of all floors through a single staircase once an EAS was triggered. Figure 1 depicts the number of persons that exited the building during this (Test 1-1), with vertical lines marking the times by which 25%, 50% and 75% of the total number of people evacuated.
It was found that 25% of evacuees had exited at 8 minutes 17 seconds (497 seconds), 50% at 10 minutes 47 seconds (647 seconds), 75% at 12 minutes 58 seconds (778 seconds) and 100% at 19 minutes 15 seconds (1,155 seconds). Congestion was seen throughout Test 1-1, represented by the horizontal lines in figure 1 where the number of evacuees exiting the building remained unchanged.
Figure 1: Number of persons exited by time (seconds) with lines indicating 25%, 50% and 75% evacuated during Test 1-1
Evacuees with impairments took on average 4 to 5 seconds longer to pass each floor than those without impairments. Moreover, evacuees with impairments took 21 seconds longer to pass floor 6, the origin of the fire, than those without impairments. However, evacuees without impairments generally did not appear to be substantially affected by obstacles such as hoses on the floor.
In this test, during the simultaneous evacuation of all floors, there was congestion and delays on the upper floors due to evacuees with reduced speeds, including occupants with impairments, and the presence of firefighting equipment in the staircase. More detail is in Appendix 4.
4.3 Test 2-2 – A full evacuation using door knocking, without an Evacuation Alert System (single staircase)
Test 2-2 (Strategy 2) was an evacuation of all floors through a single staircase using door knocking rather than an EAS. After evacuating floors 6 to 8 (the fire floor and the 2 above it), the remaining floors were evacuated from the lowest floor (4) up. Firefighters verbally notified (as a proxy for door-knocking) each floor, taking approximately 23 minutes to notify the final floor.
Evacuation was therefore slower in Test 2-2 when firefighters notified evacuees floor by floor than when a simultaneous EAS was used in Test 1-1. This finding is potentially strengthened because Test 1-1 involved more evacuees than Test 2-2 (80 in Test 1-1, compared to 68 in Test 2-2).
Generally, there was little congestion evident in the staircase, although evacuees were occasionally slowed down by firefighters moving up the stairs, resulting in a slight increase in the density of evacuees at floor 6 (involving 2 firefighters wearing breathing apparatus and 4 evacuees). This compared with up to 25 people when floors were alerted simultaneously via EAS (in Strategy 1). The coordination between the firefighters initiating the evacuation on each floor of the test without EAS (effectively implementing phased evacuations at appropriate intervals) resulted in much less congestion in stairwells than when EAS was used.
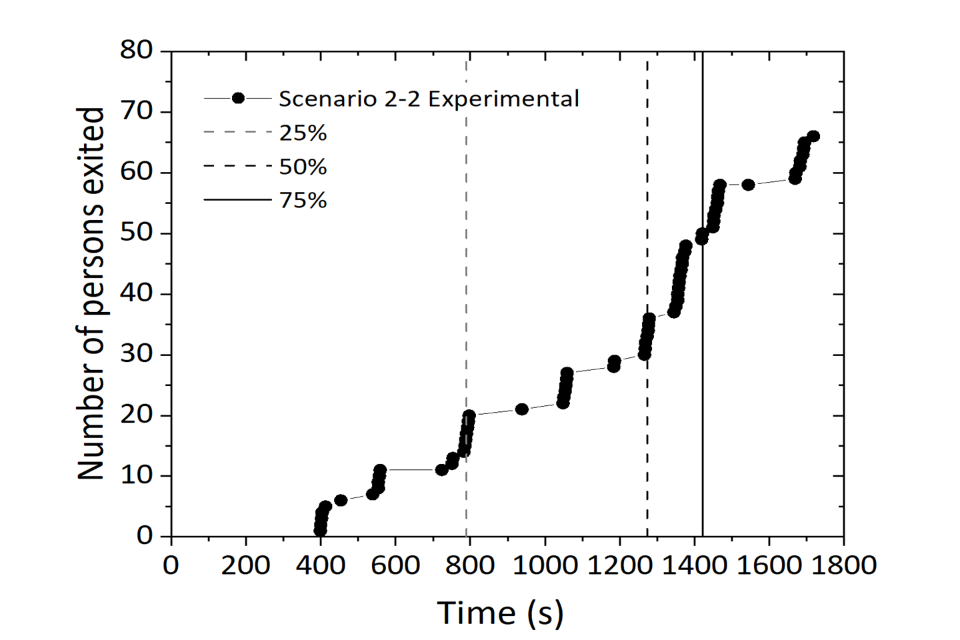
Figure 2 shows the number of persons that exited the building during Strategy 2, with vertical lines marking the times by which 25%, 50% and 75% of the total number of people evacuated.
It indicates that 25% of evacuees had exited at 13 minutes 10 seconds (790 seconds), 50% at 21 minutes 13 seconds (1,273 seconds) and 75% at 23 minutes 41 seconds (1,421 seconds). Critically, 100% evacuation was achieved at 28 minutes 38 seconds (1,718 seconds) for Test 2-2, compared with 19 minutes 15 seconds (1,155 seconds) when EAS was used in Test 1-1, a difference of 9 minutes 23 seconds (563 seconds) longer than full evacuation using EAS.
Figure 2: Number of persons exited by time (seconds) with lines indicating 25%, 50% and 75% evacuated during Test 2-2
4.4 Test 3A-2 – A full evacuation conducted in phases with an Evacuation Alert System, bottom-up strategy
Test 3A-2 (Strategy 3A) was an evacuation of all floors through a single staircase using an EAS in a top-down phased approach. Once floors 6 to 8 had been evacuated, the ‘bottom-up’ aspect of the test took place by phased EAS evacuation from floors 9 up to 12. All other occupants on floor 5 and then floor 4 were finally evacuated.
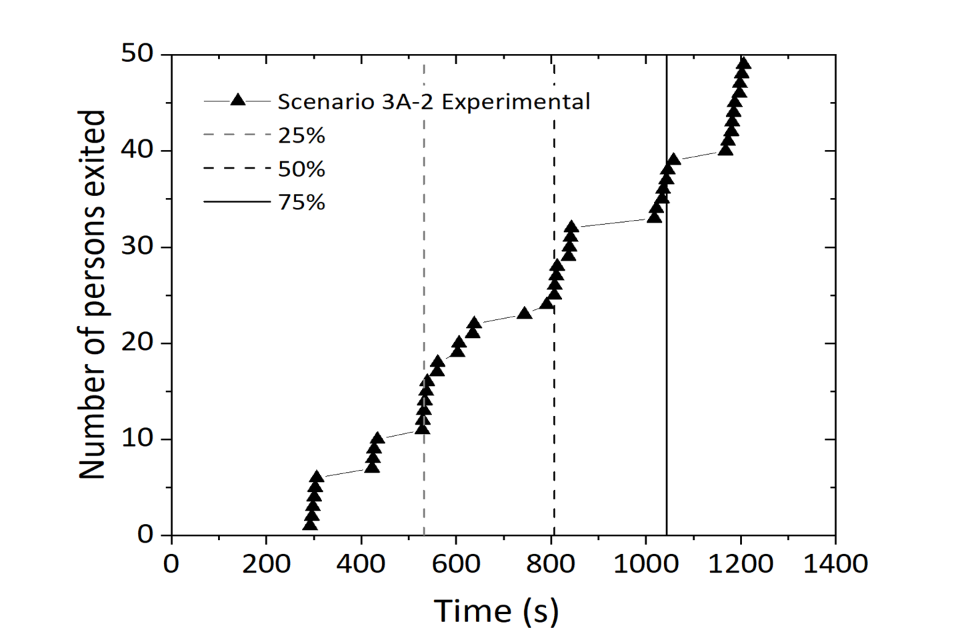
Figure 3 shows the number of persons that exited the building during Test 3A-2 (phased, bottom-up above the fire), with vertical lines marking the times by which 25%, 50% and 75% of the total number of people evacuated. It indicates that 25% of evacuees had exited at 8 minutes 52 seconds (532 seconds), 50% at 13 minutes 27 seconds (807 seconds) and 75% at 17 minutes 23 seconds (1,043 seconds).
Finally, in Test 3A-2, 100% of evacuees had exited after 20 minutes 6 seconds (1,206 seconds) a very similar time compared to the 19 minutes 15 seconds (1,155 seconds) during Test 1-1 (where a full EAS was used in a single staircase).
Figure 3: Number of persons exited by time (seconds) with lines indicating 25%, 50% and 75% evacuated during Test 3A-2
4.5 Test 3B-2 – A full evacuation conducted in phases with an Evacuation Alert System – Top-down strategy
Test 3B-2 (Strategy 3B) was an evacuation of all floors through a single staircase using an EAS in a top-down phased approach. Once floors 6 to 8 had been evacuated, the ‘top-down’ aspect of the test took place by phased EAS evacuation from floors 12 down to 9. All other occupants in floor 5 and then floor 4 were finally evacuated.
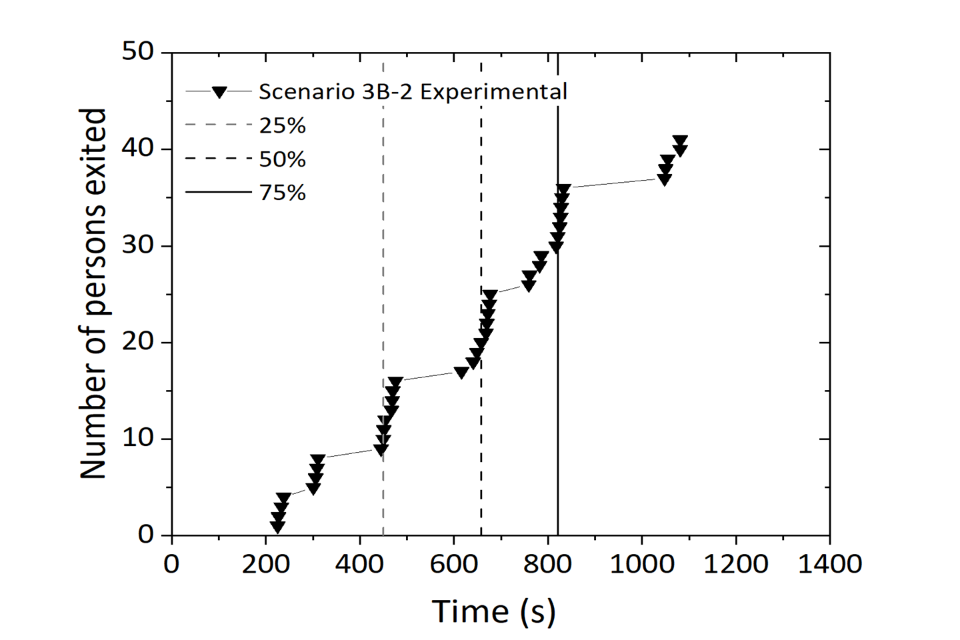
Figure 4 shows the number of persons that exited the building during Test 3B-2 (phased, top-down) with vertical lines marking the times by which 25%, 50% and 75% of the total number of people evacuated.
It indicates that 25% of evacuees had exited at 7 minutes 31 seconds (451 seconds), 50% at 11 minutes 8 seconds (668 seconds) and 75% at 13 minutes 41 seconds (821 seconds), and finally at 100% it was 18 minutes 1 second (1,081 seconds). Top-down phased full evacuation with an EAS (Strategy 3B) resulted in marginally shorter evacuation times compared to bottom-up phased full evacuation with an EAS (Strategy 3A).
Figure 4: Number of persons exited by time (seconds) with lines indicating 25%, 50% and 75% evacuated during Test 3B-2
4.6 Test 4-2 – Two staircases, full evacuation using an Evacuation Alert System
Test 4-2 (Strategy 4) used a simultaneous evacuation of all floors using EAS (replicated Strategy 1). However, residents evacuated through another staircase from floor 2, while firefighters operated through the staircase used in the other tests.
Figure 5 shows the number of persons that exited the building during Test 4-2, with vertical lines marking the times by which 25%, 50% and 75% of the total number of people evacuated. It indicates that 25% of evacuees had exited at 4 minutes 18 seconds (258 seconds), 50% at 5 minutes 17 seconds (317 seconds), 75% at 6 minutes 39 seconds (399 seconds) and 100% at 9 minutes 2 seconds (542 seconds).
The speed of the full evacuation in this 2-staircase strategy was much faster than both the single-staircase evacuation with EAS (Strategy 1), where it took 19 minutes 15 seconds (1,155 seconds), and a single-staircase evacuation without EAS (Strategy 2) where it took 28 minutes 38 seconds (1,718 seconds) for 68 evacuees (with 23 minutes (1,380 seconds ) elapsing between the first and last floors being notified to evacuate).
These tests reflect the positive impact of having 2 staircases – one staircase used exclusively for evacuation and the other for firefighter operations, removing obstacles that have been seen in other strategies. The average speed for evacuees in Test 4-2 was 15% faster than in Test 1-1.
Figure 5: Number of persons exited by time (seconds) with lines indicating 25%, 50% and 75% evacuated during Test 4-2
In Test 4-2, there was an increase in the average movement speed. For instance, the average movement speed was higher than in Test 1-1 reflecting the impact of having one staircase used exclusively for evacuation. However, there was also an increase in the length of the queues, possibly due to evacuees with impairments in the staircases. In fact, in Test 4-2, queues caused by evacuees with crutches were longer than the queues with evacuation chairs guided by firefighters.
4.7 Evacuation speed analysis
Evacuation speed analysis calculates the distance in metres that the individual had to travel (using 7.5m as the distance between each floor/camera location) divided by the time an individual takes to move from the first stairwell camera to the last. This analysis provides evidence relevant to Research Question 1 (Which strategies are likely to lead to the fastest stairwell evacuation of a high-rise residential building?). It is also related to the performance of those with impairments and therefore is relevant to Research Question 3 (What impact do evacuees with impairments have on evacuations?).
Table 2 presents the average speeds of all occupants while they descend for all tests and the movement speed range (min to max) for the processed tests of this study. The table includes stair descent speeds for 2 other studies conducted by (Proulx et al., 1995) and (Proulx, 1995). These studies collected data on evacuation times in high-rise and mid-rise apartment buildings, respectively. This included the time taken to start the evacuation (since all occupants were in their home when the fire alarm sounded); the time to move, the time to evacuate and the speed of movement in the staircase. While there are observable differences between the tests conducted and the external studies, it is important to note that there are differences in the methodology, such as the buildings were occupied buildings, the number of occupants taking part in the study and their level of familiarity with the layout of the buildings.
Table 2: Stair descent speeds for each test
| Study / test | Average movement speed (m/s) | Movement speed range (m/s) |
|---|---|---|
| Test 1-1 | 0.39 | 0.19 – 0.71 |
| Test 2-2 | 0.62 | 0.20 – 0.82 |
| Test 3A-2 | 0.48 | 0.19 – 0.78 |
| Test 3B-2 | 0.59 | 0.15 – 0.83 |
| Test 4-2 | 0.45 | 0.18 – 0.89 |
| Proulx et al. (1995a) | - | 0.95 – 1.07 |
| Proulx (1995) | - | 0.52 – 0.62 |
Faster speeds were generally recorded on lower floors, slow speeds on top floors, and even slower speeds in the middle floors in the building (close to the fire where it was assumed to start on floor 6 and spread to floors 7 and 8) where obstacles were more likely to be present. For example, in Test 1-1, slower speeds were recorded on floors 6, 7, 8, 9, 10 and 11.
Evacuation chairs guided by 2 evacuees were typically faster than those guided by one evacuee and one firefighter. The mannequin in the evacuation chair guided by 2 evacuees in Test 1-1 had an average speed of 0.29m/s and evacuated quicker than the mannequin in the evacuation chair led by one firefighter and one evacuee in Test 3B-2, with an average speed of 0.15m/s (although it is important to note that these speeds were observed under the different test conditions including the strategy, the number of participants, and the number of participants with impairments). Similarly, the evacuation chair guided by 2 evacuees in Test 3B-2 reached an average speed of 0.31m/s. It is possible that this finding may partly be a function firefighting equipment slowing evacuation speeds, but also that firefighters may replicate more accurately carrying a person in an evacuation chair.
Movement speeds derived in the single-staircase strategies where there was specialist evacuation, firefighting equipment and FRS personnel in the staircase was relatively slower when compared to movement speeds recorded by (Proulx, 1995 and Proulx et al., 1995), where such equipment was not in the staircase during evacuation.
Appendix 4 describes this data further with figures outlining the minimum, mean and maximum stairs descend speeds.
5. Evacuation modelling
The aim of the modelling was to test whether modelling may reduce the need for full-scale live tests and to answer Research Question 5: How accurately can Pathfinder modelling software simulate the live evacuation testing?
Pathfinder evacuation modelling software was used to perform evacuation simulations. Pathfinder is a software tool that simulates evacuations that use steering behaviours to model occupant motion. It comprises 3 modules:
- a graphical user interface
- the simulator
- a 3D results viewer (more details are in Appendix 5)
5.1. Design and inputs
The building (including corridors, habitable rooms and staircases) was constructed in the Pathfinder software using the floor plans and elevations. The models were built up to the 13th floor (the highest used in the tests) though the building is taller. All doors were assumed to be fully open during the evacuation; however, for strategies 1, 2, 3A and 3B where a single-staircase strategy was taken, the cross-corridor doors were locked and all occupants were in one half of the building, with access to only one stairwell. Both stairwells were modelled to discharge into a corridor on the ground floor, leading to a final exit lobby.
The primary data input parameter is the evacuation speed (m/s), which is taken from the test video data, and set to be constant throughout.
Population flow rates through doors were assumed to be the maximum suitable for the widths of the doors. Wheelchairs within the software were used to simulate the evacuation chairs used in the tests, with sizes adjusted to pass through the stair doors, but no smaller, as observations showed evacuees did not overtake evacuation chairs within stairwells.
The modelling simulation set-up mirrored the parameters of the live tests, with all occupants positioned at the apartment doors and evacuation chair users positioned on floors 4 and 7. The full interpretation of strategies into models to represent the experiments are in Appendix 5.
5.2. Modelling analysis
Experimental and simulation results were similar for Tests 1-1, 2-2, 3A-2 and 3B-2.
As can be seen from the difference, ε (%) in Table 3, differences between experimental and numerically modelled results were below 5%. We calculated this difference using the following expression as depicted in the equation below:
ε = ( (M−E) / M ) × 100
Where:
M : is the numerical value (modelled time seconds).
E : is the experimental evacuation time (seconds).
Numerical data on the building exit curves and how the model compares with the experimental data is presented in figure 11 to figure 15 in Appendix 6. The shape of the modelled exit curve generally follows that of the corresponding experimental exit curve.
The total time to exit the building varied between tests. Other than in Test 3A-2, the modelled exit time was greater than the actual times observed in the tests.
However, the greatest differences between experimental observation and numerical modelling occurred for Test 4-2, where there was a 23% over-prediction of evacuation time by the modelling.
Table 3: Evacuation times as recorded in the tests, simulation times, and difference
| Test 1-1 | Test 2-2 | Test 3A-2 | Test 3B-2 | Test 4-2 | |
|---|---|---|---|---|---|
| Experimental evacuation time(s) | 19 mins, 15 secs (1,155 secs) | 28 mins, 38 secs (1,718 secs) | 20 mins, 6 secs (1,206 secs) | 18 mins, 1 sec (1,081 secs) | 9 mins, 2 secs (542 secs) |
| Modelled evacuation time(s) | 19 mins, 19 secs (1,159 secs) | 28 mins, 43 secs (1,723 secs) | 19 mins, 19 secs (1,159 secs) | 18 mins, 5 secs (1,085 secs) | 11 mins, 50 secs (710 secs) |
| Difference, ε | 0.35% | 0.29% | -4.06% | 0.37% | 23.7% |
Overall, the Pathfinder modelling software gave reasonable predictions of experimental results for Tests 1-1, 2-2, 3A-2 and 3B-2. However, Pathfinder modelling for Test 4-2 (full evacuation using EAS and 2 staircases), which resulted in the fastest overall evacuation time in the experimental results, gave a much longer predicted evacuation time. Hence, further testing and modelling comparisons would be required before using Pathfinder modelling to replicate evacuations with 2 staircases in use.
It should also be noted that the close match to the live tests may be due to an element of over-fitting in the model. This is shown through model variables being tailored to observations from the trial, rather than to expected values from literature. For example, in Test 1-1, the evacuees on higher floors were programmed to move slower than occupants on lower floors, instead of necessarily recreating the conditions that resulted in slower movement. This was based on average speeds measured during the trial and would be consistent with congestion slowing people on higher floors while their counterparts below moved more freely. The impact of this is that the exit times from the modelling closely replicate the trial, but only because they have been programmed to do so. This significantly reduces the extent to which the results can be extrapolated to other strategies.
6. Key findings
This section addresses the 5 research questions derived by the Home Office from the research methodology.
6.1 Research Question 1: Which strategies are likely to lead to the fastest evacuation of a high-rise residential building?
The findings indicate that 2 staircases are likely to support a faster evacuation from a HRRB than one staircase. When using 2 staircases (one for evacuation and one for firefighting), evacuation times were shorter than for all other evacuation strategies. Strategy 1 and Strategy 4 both tested full evacuations with an EAS. However, Test 4-2 (with 2 staircases) was completed in 9 minutes 2 seconds (542 seconds), approximately half the time of Test 1-1 (with single-staircase exercise) which completed in 19 minutes 15 seconds (1,155 seconds).
For operational decision-makers, the findings indicate that using an EAS (Strategy 1) results in faster evacuation than a door-knocking system (Strategy 2). In Test 1-1, the final evacuee left in under 20 minutes (1,155 seconds). Whereas in the Test 2-2, where the test replicated manual floor-by-floor door-knocking, it took over 28 minutes (1,718 seconds) to complete. Future research could look to understand the impact of resident awareness of EAS on evacuation effectiveness, as this study’s scoping found that this is an important feature of it working well.
The findings were not clear in showing whether either a ‘top-down’ or ‘bottom-up’ evacuation strategy is faster and which should be preferred during an evacuation. In these tests, evacuation starting from the highest floor above the fire (‘top-down’) completed in less time than ‘bottom-up’, where evacuation began from the first feasible floor above the fire. However, due to the confounding variables in participants’ profiles (such as the number of participants and the amount instructed to walk at half pace), further testing would be required to establish robust conclusions.
6.2 Research Question 2: To what extent do each of the evacuation strategies lead to congestion in stairwells?
The findings identified more congestion developed following the EAS signal (Strategy 1) than when firefighters co-ordinated the timing of door-knocking signals on floors (Strategy 2). This was despite the use of an EAS resulting in a faster evacuation than door-knocking. When the door-knocking strategy was applied, the maximum queue length was 6 people, compared with queues of up to 25 people in stairwells when EAS was used.
Evacuees moving at a slower pace often caused congestion. Queues formed where evacuees were ‘caught up’ with those moving at a slower pace and occupying additional space in stairwells. This included some of those walking with crutches, and evacuation chairs guided by one or 2 other people (evacuees or firefighters). Though it should be noted that in some instances evacuees passed others that were walking more slowly.
Higher levels of congestion did not necessarily lead to slower evacuation time. While the double-staircase test (Test 4-2) resulted in large queues behind evacuees walking with crutches, the queues did not prevent the 2-staircase firefighting and evacuation completing in far less time (by over 10 minutes) than when firefighting and evacuation combined in a single staircase (Test 1-1). In Test 4-2, the total evacuation time was 9 minutes 2 seconds (542 seconds) with 79 participants, whereas Test 1-1 had a total evacuation time of 19 minutes 15 seconds (1,155 seconds) with 80 participants.
When implementing strategies as part of real evacuation plans, consideration should be given to potential congestion. As well as influencing evacuation times, there may be further consequences that congestion could cause, such as slips and obstruction to operational response. It should also be noted that the emotional impact of congestion was not tested, and that this may impact overall evacuation times in a live situation.
6.3 Research Question 3: What impact do evacuees with impairments have on evacuations?
Indicative findings suggest that people evacuating other residents on evacuation can delay the movement of those evacuees behind them. Such delays may also be affected by the degree of familiarity with the evacuation chair equipment and (for firefighters) the cumbersome nature of the equipment worn.
The higher the floor where residents with impairments live, the greater the potential detrimental effect on the evacuation speeds from following evacuees with impairments. There was evidence for Tests 1-1, 2-2 and 3A-2 that evacuation speeds may be limited for those starting on higher floors. This is because the transit of evacuees with a mobility impairment appeared to affect the evacuation speed of those joining stairwells from higher floors.
The appropriate evacuation strategy may also vary depending on the evacuee’s specific needs, but this study did not find consistency in how evacuation needs affected speed. In Test 1-1 (Strategy 1), it was observed that evacuation chairs can move at greater speeds than some evacuees walking with crutches, whereas in Test 2-2 (Strategy 2), the opposite was observed. Therefore, it is important to note uncertainty in these findings, given the number of limitations in assessing the impact of participants with impairments.
6.4 Research Question 4: What further factors could affect live evacuations from high-rise residential buildings?
There were several key observations from the testing that should be considered as factors affecting evacuation and may need to be considered in planning the strategies for evacuation.
Local movement speed varied by floor. Faster speeds were generally recorded at lower floors, with slower speeds at the top and in the middle floors of the building, close to the fire, where obstacles were more likely to be present.
For most evacuees, there was no clear effect of having obstacles on the floor, such as hoses. But it was observed that the speed of evacuees with impairments was reduced on those floors.
Evacuees instructed to climb stairwells first, rather than immediately evacuate, did not have a demonstrable negative effect on other evacuees. However, the impact of upward movement of evacuees cannot be ruled out when combined with other factors such as flow density, evacuees with a mobility impairment descending and when occurring on other floors (not just the highest floors).
Similarly, movement of firefighters within the staircase did not have a major impact on the evacuation. However, in some instances where the OIC initiated the activation of the EAS after receiving information that the preceding floor had been cleared, the counter flow of firefighters moving to alert higher floors impacted on movement speed of evacuees who waited in the staircase landing to allow firefighters to pass.
6.5 Research Question 5: How accurately can Pathfinder modelling software simulate the live evacuation testing?
The findings suggest that the Pathfinder modelling software, using data from live operational tests, may accurately predict these outcomes via software simulations. This would help reduce the need for full-scale live operational tests to consider changes in evacuation scenario parameters (or might enhance confidence in the test results by allowing replication).
However, it should also be noted that the close match to the live operational tests may be due to an element of over-fitting in the model. This is shown through model variables being tailored to outcome observations from the trial (for example, the speed was based on what was seen in the trials rather than wider physiological evidence about movement speeds). This significantly reduces the extent to which the results can be extrapolated to other strategies.
Overall, the Pathfinder modelling software gave reasonable predictions of experimental results for Test 1-1, 2-2, 3A-2 and 3B-2.
However, Pathfinder modelling for Test 4-2 (full evacuation using EAS and 2 staircases), which resulted in the fastest overall evacuation time in the experimental results, gave a much longer predicted evacuation time by 23.7%. Hence, further testing and modelling comparisons would be required before using Pathfinder modelling to replicate evacuations with 2 staircases in use.
7. Considerations for future research
This study unearthed valuable insights that can be useful for evacuation planning and strategy. However, in the process of conducting the live evacuation strategy tests, this study has identified opportunities that can serve as a springboard for future enhancements in both the methodology and how similar tests could be conducted.
While field experiments are challenging to conduct, maintaining control over key experimental conditions (for example, population size) is imperative for comparison between results and inferring implications. Future research can explore ways to address whether the same outcomes from the evacuation strategies would hold outside of the context of the experiment.
The research highlighted the importance of the participant population in enabling like-for-like repetition. This was borne out in this study because of limitations in participation due to conducting the study while COVID-19 risks had to be managed.
The small number of tests for each strategy limited confidence in the results produced. Future research could run more tests or include participants with impairments to improve the robustness of the findings. Future research may also include tests with participants without the simulation of their impairments to examine the impact of them on the evacuation performance.
Scenario-specific conditions may also be improved in future research. There was limited access to apartments which affected the initial pre-evacuation/pre-movement delays of participants who were initially position at apartment entrances. Evacuees had prior warning that an evacuation would take place. This may have had an impact on their evacuation behaviour, precluding the assessment of participant response. Future research may explore avenues to improve the degree of similarity of scenario-specific conditions to everyday experiences before and during evacuation.
The Pathfinder modelling software used in the study may in future be applied to explore and test the conditions in this research in different contexts and situations. For instance, the modelling software can include data on building designs and population sizes, which will improve the applicability of the research in new and emerging evacuation strategies.
8. Appendix 1: Supplementary methodological detail
8.1 Building description and layout
The UCLan research team selected a disused 17-storey tower block (Hereford House in Carlton Vale, NW6) for the experiments in this study. The building represents a common UK HRRB and is comparable to other buildings used to conduct evacuation studies in HRRBs (Lovreglio et al., 2019) and was deemed particularly relevant for the questions posed in this work. LFB uses the site (within a gated perimeter wall) for multi-flat fire training, fire survival guidance and evacuation exercises. While LFB train at the venue, Brent Council maintain the lifts and power supplies to the communal area’s electrical sockets.
The building had 2 staircases: a firefighting staircase (right-hand side), where the dry riser outlets were located; and an evacuation staircase (left-hand side). The building was divided horizontally into equal compartments at every level with a cross-corridor fire door and could simulate a single-staircase HRRB. The cross-corridor fire doors were locked, and approximately only half the building was used to simulate the single-stair evacuation tests. All flats were inaccessible, meaning that volunteers representing residents commenced exercises from flat entrance doors, following specifically assigned scripts. Each volunteer was told that they have been allocated a floor and a flat number and they would be expected to stand outside the flat entrance. The notice on the flat door indicated how they should move during the exercise.
Therefore, experimental times did not include simulation of response within flats, only within communal corridors and staircases.
The briefing covered the following:
- the purpose of the tests
- that the tests are based on prior research
- which test the participant will take part in
- their floor and flat number (told to stand outside the flat entrance and not to enter any flats)
- the notice on the flat door informed them on how to move during the exercise; for example, the action to take during each test, for Strategy 1 for example, “On hearing the Evacuation Alert System start to move towards the stairs and evacuate”
- told that “When (they) enter the staircase to evacuate in a safe manner taking into consideration events that are happening in your surroundings”
An EAS installed within the building provided audible alerts and evacuation signals in the communal corridors of each floor and had manual controls operated by FRS. The EAS was purely used to enable an evacuation signal and initiate the experiments – its functionality was not tested during the experiments.
8.2 Building occupancy levels and volunteer arrangements
The study measured the building occupancy in accordance with the work of Hopkin et al. (2019) drawing on the English Housing Survey (MHCLG, 2019), which estimated the mean number of occupants per bedroom in high-rise apartments as 1.19. Hereford House had 215 bedrooms across 143 flats on 17 floors, so using the mean value of 1.19 residents per bedroom, the total number of residents expected to reside in the building was 256. However, the tests placed residents in parts of 9 or 10 floors, reducing the number of volunteers required to replicate the expected level of occupancy. In response to the number of volunteers available, only half of each floor was used, allowing access to evacuate through a single staircase.
Volunteers received a project aims information sheet and were debriefed and allocated a Person ID number and directed to the individual start position for that ID number.
Research indicated that people with mobility impairments were likely to move more slowly through buildings (Boyce et al., 1999). Tests were planned to include a prescribed number of volunteers (from specific floors and flats) scripted to act as residents with mobility impairments, such as simulating walking at half speed with an elbow crutch, slow walkers, and residents using evacuation chairs (containing mannequins for safety). A small sample of volunteers (at least 10%, consistent with ONS, 2021) were identified to act with mobility impairments scripted for specific flats (consistent throughout each test). The experiments did not account for future demographic changes between mobility, cognitive and sensory impairments, so the results may need to account for this aspect when informing future policy.
Residents requiring assistance with evacuation chairs were simulated by mannequins on evacuation chairs outside flats on floors 4 and 7. These chairs were assisted by a pair of volunteers, a volunteer with a firefighter, or solely by firefighters (detailed in the test descriptions in Appendix 2).
The flat associated with the scripted impairment had the relevant instructions placed on a notice at the entrance. The test timelines and scripts (displayed on each flat door) were used to direct volunteer movements.
The number of volunteers for each test is detailed in Table 4 (in Appendix 3).
8.3 Planning and preparation
A week ahead of the experiment, the project team (UCLan) met with all subcontractors. They developed the evacuation procedure (including floor plans highlighting planned start positions of participants) and undertook risk assessments.
Pre-project scoping work identified that many FRSs were either using, or piloting the use of, smoke curtains to protect staircases from the spread of smoke. Therefore, such equipment was incorporated into the exercises, in line with the expected operational procedure at this type of incident, and in line with the SOP by which curtains are fitted by SPT (Williams, 2019).
LFB service personnel including an Area Manager, a Station Manager (as Evacuation Officer) and an Evacuation Command Vehicle plus a support fire appliance (to support the Evacuation Officer) supported the experiments. A Fire Safety Enforcement Officer advised on the building’s fire protection features and over 40 FRS staff participated in the tests. Existing LFB operational techniques for HRRB emergency evacuation procedures, communication strategies and firefighting equipment were used in all tests. The testing required the resources (personnel, firefighting equipment and fire appliances) associated with the normal predetermined attendance (PDA) for a HRRB fire incident. This figure varies across the UK; however, 8 fire appliances were required with additional personnel resources to supplement the evacuation procedures being tested. The fire control room on site supported the tests. Actions resulting from mobilising control handling and communicating the information to the Incident Command Unit was simulated at specific times during each of the tests, at 5, 10 and 20 minutes.
The day before the tests, extended life digital video camera batteries were charged, camera memories cleared, and all equipment was checked. For each test day, time was allotted for setting up and testing cameras and monitoring equipment.
The 2 evacuation chairs and 2 mannequins (both standard FRS training models) were used in the experiments (these are ‘GBRH’, with a green body ‘GB’, and red head and ‘RB’, with a red body and red head). In all tests, mannequins were placed on evacuation chairs prior to commencement of the evacuation. The chair from flat 47 (floor 4) was assisted by 2 residents that were specially briefed and flat 77 (floor 7) was assisted by firefighters.
8.4 Data collection
In total, 17 digital cameras were used to collect the video data during the experiments, positioned in each stairwell landing at a height of 2 metres. The digital cameras covered each staircase and each floor.
Digital Transit Limited (DTL) vision system processed video feeds that were recorded during the evacuation testing. The vision system collated multiple video inputs, detected the number of people within each frame of the footage and could detect whether a person was travelling up or down the stairs. The system tracked people as they moved up and down staircases and allowed the manual identification of evacuation chairs (GBRH and RB) within video footage from digital cameras throughout the HRRB’s staircase. Within videos, evacuees were identified by a sequential number; however, each volunteer wore a separate pre-allocated ID number linked to their individual ‘resident’ script.
Data processing was carried out off-site. A video technique called optical flow detected speed and behaviour, such as hesitation or stumbling. Resulting data allowed for comparison with Pathfinder evacuation modelling software.
Records were kept of the incident command communication directed towards participants during the tests, and the video system recorded evacuation times floor by floor. Fire Service Guidance calls were included in the experiments at an operationally appropriate time in the evacuation. These calls were straightforward and designed to imitate additional movements of FRS resources and residents, but they did not seek to test control operator techniques.
9. Appendix 2: Tests
The test plan schedule determined the firefighters’ actions. The volunteers on each level reacted within a timeframe according to a predetermined script describing how residents were to respond.
FRS staff taking part in the tests were briefed on the key parameters and objectives of the experiments and their own role in the test.
Each test commenced as follows:
- A fire was reported on floor 6, in a flat directly adjacent to the stairwell entry point.
- On arrival, the Officer in Charge (OIC) recognised the severity of the incident and immediately increased the available resource to 8 pumps.
- Firefighters entered the building to set up and fight the fire internally (hose deployment, breathing apparatus procedures and command structures, and initial SPTs were in position before each experiment).
- Subsequently, the fire developed, spreading to the 2 floors above.
- The OIC recognised the implications of the fire development and took the decision to implement the strategy being tested.
- The ‘Secure Information Box’ (SIB) provided information on residents who needed evacuation chairs. They were located on floors 4 and 7. These residents were evacuated by chair (however, during these experiments, mannequins were used to represent these residents).
Typical obstructions seen during firefighting operations, such as firefighting hoses and other firefighting equipment within the staircase, were also used in each test.
During the experiments, FRS used the functioning EAS manual controls on each floor (for all except Test 2-2), allowing simultaneous (Test 1-1 and 4-2) or phased (3A-2 or 3B-2) evacuation signals. Throughout the tests, the Incident Commander considered control measures, and FRS staff communicated as per standard command procedures. This included the exact timing of alerts (EAS simultaneous, EAS phased or door knocking), checking the SIB for residents with a mobility impairment who require an evacuation chair, and then assisting with the evacuation of these residents.
Features of the control measures as per SOPs included:
- withdrawing
- use of breathing apparatus
- LFB-standard firefighting equipment
- ventilation
- patrolling the staircase(s) continuously to ensure that exit routes were safe and free of obstructions
- searching floors, staircase(s), hallways and lifts for residents who may have been trapped
- identifying residents who may be a priority or may need specialist assistance during evacuation
- reporting back to the Incident Commander – reporting conditions at each floor to the Fire Sector Commander or, when in place, the Search Sector Commander
- deploying to Fire Survival Guidance calls
- managing resident evacuation; and ensuring the stairs were clear of smoke where possible
During all tests, the SPT simulated the requirement to deploy breathing apparatus. SPTs were deployed on each floor of the building, adopting the SOPs and techniques for this incident type (LFB, 2021 and LFB, 2017). SPT duties included:
- fitting smoke curtains
- supervising the entry into the staircase to minimise the spread of smoke
- keeping the exit routes clear of obstructions
- warning others if they noticed significant fire development
9.1 Strategy 1 – A full evacuation using an Evacuation Alert System
Both tests of Strategy 1 took place on Wednesday 4 May 2022. The experiment involved the evacuation of 80 residents distributed across 10 floors (4 to 13).
Impairments simulated:
- nine volunteers were briefed to walk at half pace
- four volunteers were briefed as evacuation chair assistants
- two volunteers on floor 10 were briefed to move up 2 floors and then evacuate down the staircase at their own walking pace
The residents on each level reacted within a time frame according to their predetermined script. The EAS signalled residents to evacuate simultaneously.
9.2 Strategy 2 – A full evacuation without an Evacuation Alert System
This method of manual alert (door knocking) of residents is most common operationally, due to the scarcity of HRRB currently fitted with an EAS.
Both tests of Strategy 2 took place on Tuesday 3 May 2022. The experiment involved the evacuation of 68 residents distributed across 10 floors (across floors 4 to 13).
Impairments simulated:
- eight volunteers were identified to walk at half pace
- three volunteers and 2 firefighters were briefed as evacuation chair assistants
- two volunteers on floor 10 were briefed to move up 2 floors and then evacuate down the staircase at their own walking pace
One volunteer was a 3-year-old child (attending with a parent).
Firefighters physically alerted residents by knocking on flat doors. The residents were positioned outside the flat doors and reacted on each level within a timeframe according to a predetermined script on the flat door.
9.3 Strategy 3 – A full evacuation conducted in phases (that is, certain floors) with an Evacuation Alert System
Strategy 3A: Bottom-up
The first test of Strategy 3A took place on Wednesday 4 May 2022 and the second attempt on Thursday 5 May 2022. Test 3A-2 involved the evacuation of 49 residents distributed across 9 floors (4 to 12).
Impairments simulated:
- four volunteers were briefed to walk at half pace
- three volunteers and 2 firefighters were briefed as evacuation chair assistants
- one volunteer on floor 10 was briefed to move up 2 floors and then evacuate down the staircase at their own walking pace
One volunteer had a visual impairment and used a cane to assist navigation.
Evacuation started from the floor immediately above the fire at-risk area, and worked up sequentially, floor by floor, to the top of the building.
Strategy 3B: Top-down
Both tests of Strategy 3B took place on Thursday 5 May 2022. Test 3B-2 involved the evacuation of 43 residents distributed across 9 floors (4 to 12).
Impairments simulated:
- three volunteers were identified to walk at half pace
- three volunteers and 2 firefighters were briefed as evacuation chair assistants
- one volunteer on floor 10 was briefed to move up 2 floors and then evacuate down the staircase at their own walking pace
One volunteer had a visual impairment and used a cane to assist navigation.
Evacuation started from the floor immediately above the fire at-risk area, and worked down sequentially, floor by floor, to the bottom of the building.
9.4 Strategy 4 – Two staircases, full evacuation using an Evacuation Alert System
Both tests of Strategy 4 took place on Friday 6 May 2022. The experiment involved the evacuation of 79 residents distributed across 10 floors.
Impairments simulated:
- seven volunteers were briefed to walk at half pace
- two volunteers and 3 firefighters were briefed as evacuation chair assistants
The residents on each level reacted within a timeframe according to their predetermined script. The EAS signalled residents to evacuate simultaneously.
10. Appendix 3: Data capture
Table 4 shows the tests that were processed along with the number of participants in total and starting on each floor. Table 5 shows the tests that were unprocessed along with the number of participants.
Table 4: Total number of volunteers per floor for tests (processed)
| Processed and analysed | |||||
|---|---|---|---|---|---|
| Experiment | 1-1 | 2-2 | 3A-2 | 3B-2 | 4-2 |
| Total volunteers | 80 | 68 | 49 | 43 | 79 |
| Floor 16 | - | - | - | - | - |
| Floor 15 | - | - | - | - | - |
| Floor 14 | - | - | - | - | - |
| Floor 13 | 9 | 4 | 0 | 0 | 0 |
| Floor 12 | 8 | 5 | 4 | 3 | 0 |
| Floor 11 | 8 | 8 | 4 | 4 | 6 |
| Floor 10 | 8 | 8 | 4 | 4 | 8 |
| Floor 9 | 8 | 8 | 4 | 4 | 7 |
| Floor 8 | 8 | 7 | 5 | 5 | 8 |
| Floor 7 | 9 | 6 | 6 | 6 | 8 |
| Floor 6 | 6 | 6 | 6 | 4 | 7 |
| Floor 5 | 9 | 8 | 8 | 7 | 8 |
| Floor 4 | 7 | 8 | 8 | 6 | 14 |
| Floor 3 | - | - | - | - | 6 |
| Floor 2 | - | - | - | - | 7 |
| Floor 1 | - | - | - | - | - |
Table 5: Total number of volunteers per floor for reserve tests (unprocessed)
| Unprocessed | |||||
|---|---|---|---|---|---|
| Experiment | 1-2 | 2-1 | 3A-1 | 3B-1 | 4-1 |
| Total volunteers | 64 | 69 | 64 | 49 | 86 |
| Floor 16 | - | - | - | - | - |
| Floor 15 | - | - | - | - | - |
| Floor 14 | - | - | - | - | - |
| Floor 13 | 8 | 4 | 8 | 0 | 0 |
| Floor 12 | 5 | 5 | 5 | 4 | 0 |
| Floor 11 | 7 | 8 | 7 | 4 | 8 |
| Floor 10 | 8 | 8 | 8 | 4 | 8 |
| Floor 9 | 3 | 8 | 3 | 4 | 8 |
| Floor 8 | 7 | 8 | 7 | 5 | 8 |
| Floor 7 | 6 | 6 | 6 | 6 | 8 |
| Floor 6 | 5 | 6 | 5 | 6 | 7 |
| Floor 5 | 7 | 8 | 7 | 8 | 8 |
| Floor 4 | 8 | 8 | 8 | 8 | 15 |
| Floor 3 | - | - | - | - | 8 |
| Floor 2 | - | - | - | - | 8 |
| Floor 1 | - | - | - | - | - |
Where a camera failed, it was sometimes possible to extrapolate its data accurately by looking at the camera data from the floors above and below. However, where there were continuous camera failures (see table 6 and table 7), there was an unacceptable level of uncertainty. For each test, the footage with the lowest number of continuous camera failures was selected to be processed and analysed. If no continuous failures occurred in either run of the test, then the run with lowest total number of failures was chosen, or the higher number of volunteers (as in Test 1-1).
For each of the processed and analysed experiments, detailed second-by-second data was reviewed on the number of evacuees on each floor, and the movement of individual evacuees (using person IDs) through each floor of the building by time elapsed and speed. This allowed the analysis of flows and bottlenecks to be reviewed to identify potential contributory factors, such as unusual actions (for example, walking upwards) or the presence of evacuees with impairments.
Table 6: Camera failures in processed experiments
| Experiment | |||||
|---|---|---|---|---|---|
| 1-1 | 2-2 | 3A-2 | 3B-2 | 4-2 | |
| Floor 0 | BM | ||||
| Floor 1 | CF | ||||
| Floor 2 | SD | ||||
| Floor 3 | |||||
| Floor 4 | |||||
| Floor 5 | SD | ||||
| Floor 6 | |||||
| Floor 7 | |||||
| Floor 8 | |||||
| Floor 9 | CF | ||||
| Floor 10 | |||||
| Floor 11 | |||||
| Floor 12 | |||||
| Floor 13 |
DB = Drained Battery; BM = Battery Malfunction; SD = SD Data Corrupt; CF = Camera Failure
Table 7: Camera failures in non-processed experiments
| Experiment | |||||
|---|---|---|---|---|---|
| 1-2 | 2-1 | 3A-1 | 3B-1 | 4-1 | |
| Floor 0 | |||||
| Floor 1 | |||||
| Floor 2 | BM | ||||
| Floor 3 | |||||
| Floor 4 | BM | ||||
| Floor 5 | |||||
| Floor 6 | BM | ||||
| Floor 7 | BM | ||||
| Floor 8 | |||||
| Floor 9 | CF | ||||
| Floor 10 | SD | ||||
| Floor 11 | SD | ||||
| Floor 12 | DB | ||||
| Floor 13 |
DB = Drained Battery; BM = Battery Malfunction; SD = SD Data Corrupt; CF = Camera Failure
11. Appendix 4: Further observations from tests
11.1 Further observations from analysis of Test 1-1 (a full evacuation with an EAS)
Although the evacuation signal was sounded simultaneously across all floors, variations in evacuees’ readiness and reaction time resulted in evacuees from higher floors being blocked on the staircase while lower floor evacuees were still leaving their initial floor. Up to 9 evacuees could be seen within the stairwell of a single floor. Contributing to the congestion were 2 evacuees who used crutches to walk downstairs – their speed was slow, particularly where firefighting equipment covered the floor, causing queues above. There was a relationship between the floor level where evacuees using crutches entered stairwells and the length of queue they produced as they descended. A queue of 15 evacuees formed behind a crutch user from floor 5, while 25 people were observed queuing behind the evacuee using crutches from floor 8.
While the firefighters ascended the stairs in the first 3 minutes of the experiment, before volumes of evacuees built up, congestion occurred due to evacuees descending from higher floors merging with those emerging from lower floors.
It was observed that evacuating an individual in an evacuation chair may take less time than the evacuation of an individual using crutches (average speeds of 0.3m/s and 0.32m/s for those using crutches compared with averages of 0.2m/s and 0.4m/s for evacuation chairs).
11.2 Further observations from analysis of Strategy 2 (full evacuation without an EAS)
Congestion was seen for several short periods during Strategy 2, for example at around 9 minutes 10 seconds to 11 minutes 40 seconds (550 to 700 seconds). Furthermore, just a few evacuees left the building between 13 minutes 20 seconds to 17 minutes 30 seconds (800 and 1,050 seconds), and between 17 minutes 55 seconds to 21 minutes 15 seconds (1,075 to 1,275 seconds), after which, several people left in quick succession. A few short gaps were then seen between exits, until another pause around 24 minutes 10 seconds to 27 minutes 30 seconds (1,450 to 1,650 seconds).
The plateau in evacuees exiting the building from 13 minutes 54 seconds (834 seconds) corresponds with the movement of an evacuation chair guided by 2 firefighters. Analysis found 2 firefighters wearing breathing apparatus were delayed by 4 evacuees going down the stairs on floor 6, and an interaction of 1 minute 30 seconds (90 seconds) between 2 evacuees aiming to ascend from floor 10 were prevented by 2 firefighters, which also created brief congestion.
Within this experiment, video analysis showed that evacuating an evacuation chair (assisted by firefighters) could take longer than evacuating using crutches. This is different to that observed in Test 1-1, but each evacuee with a mobility impairment (or simulating a mobility impairment through the use of cutches) will be different. For instance, in Test 2-2 the evacuation chair guided by 2 firefighters went down from floor 3 to floor 1 in 1 minute 16 seconds (76 seconds), while the evacuation chair guided by evacuees (in Test 2-2) covered the same floors in 59 seconds.
Except when navigating hoses at floor 6, the participation of a 3-year-old child in this test did not greatly reduce the walking speed of the adult holding their hand (average time per floor of 15 seconds, compared to 13 seconds for adults without impairments). However, it is important to note that this may not reflect the actual time it takes for parents to evacuate because it is possible that there will be both more parents and children in the event of a real evacuation, which may impact the overall evacuation time.
11.3 Further observations from analysis of Strategy 3A (full evacuation conducted in phases with an EAS, bottom-up)
It was observed that 2 firefighters wearing breathing apparatus had to wait at the landing of floor 5 to give priority to one firefighter and one evacuee guiding an evacuation chair, creating congestion. Firefighters engaged in the evacuation of an occupant in an evacuation chair were also delayed by 2 evacuees in the landing of the staircase at floor 3; the congestion was due to narrowness of the stairs and firefighters trying to accommodate the evacuation chair.
Observations show that the evacuee with a visual impairment had little effect on movement speed, as an evacuee walking at half pace was setting the pace of that group of evacuees.
11.4 Further observations from analysis of Strategy 3B (full evacuation conducted in phases with an EAS, top-down)
This evacuation test resulted in less congestion between floors than in the simultaneous evacuation (Test 1-1). The mannequin in the evacuation chair guided by 2 residents evacuated more quickly than the mannequin in the evacuation chair led by one firefighter and one evacuee, potentially due to the firefighting equipment that might have contributed to slower movement of the firefighters.
Video observations showed that an evacuation chair guided by an evacuee and 2 firefighters blocked the path of another evacuee from floor 4 to the exit.
When the firefighters co-ordinated the evacuation via door knocking (as in Strategy 2), there was less congestion compared to Strategy 1 (full evacuation with EAS).
11.5 Further observation from analysis of Strategy 4 (2 staircases, full evacuation using an EAS)
Within this test, there was a notable reduction in visibility in the staircase of floor 5 due to less illumination when an evacuee closed the door from the corridor of that floor. This impacted the average speed of evacuees. When there was reduced visibility, the average speed of the 9 evacuees affected by the decrease in visibility was 0.33m/s, which was 12% slower when compared to the average speed of the 35 evacuees that passed the floor before the door was closed and light reduced (0.37m/s).
11.6. Average movement analysis
The following figures (figure 6 for Test 1-1, figure 7 for Test 2-2, figure 8 for Test 3A-2, figure 9 for Test 3B-2 and figure 10 for Test 4-2) demonstrate the average movement speeds per person per floor during each test.
The diamond symbols represent each of the volunteers’ speed per floor. Each box plot shows the distribution of data, that is, the speeds of volunteers per floor based on 5 quantities. Each box shows the minimum data value, lower quartile (25%), mean (50%), upper quartile (75%) and maximum data value within 2 standard deviations above and below the median movement speed.
The cameras used to record the data in these charts were placed in stairwells. Therefore, the floor number on the charts corresponds to the camera in the stairwell between that floor and the floor above. For example, evacuees recorded as they descended from floor 13 to 12 are represented on floor 12 in the charts.
Figure 6 represents the speed of each of the 80 residents during the evacuation on each floor, starting from their original position on floors 4 to 13 and moving down to evacuate. Higher speeds were recorded on floors 12, 2 and 1 (the highest on floor 12 at 1.25m/s) whereas the slowest speeds were recorded on floors 9, 8, 7 and 6 (between 0.078m/s and 0.11 m/s).
Figure 6: Average movement speeds per person per floor for Test 1-1
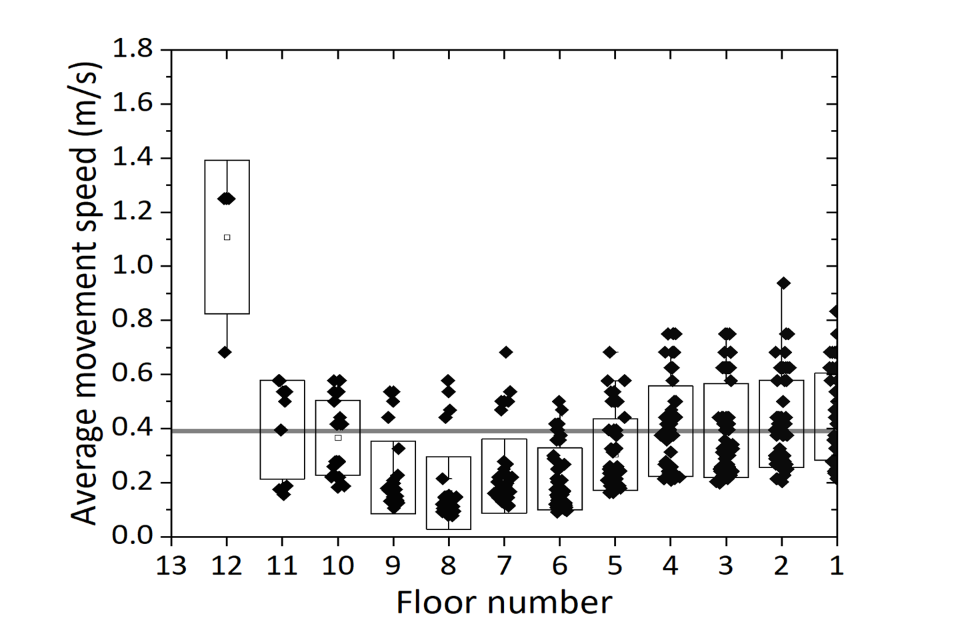
Figure 7 represents the speed of each of the 68 residents during the evacuation on each floor for Test 2-2, starting from their original position on floors 4 to 13 and moving down to evacuate. The slowest speeds were recorded between floors 3 to 8 with speeds of approximately 0.15m/s to 0.23m/s while the fastest speeds were recorded on floors 8 and 2 (at speeds of 1.071m/s). It is important to note that due to a camera failure in Test 2-2, there is no recording of average movement speeds on floor 1, hence the chart is blank for floor 1.
Figure 7: Average movement speeds per person per floor for Test 2-2
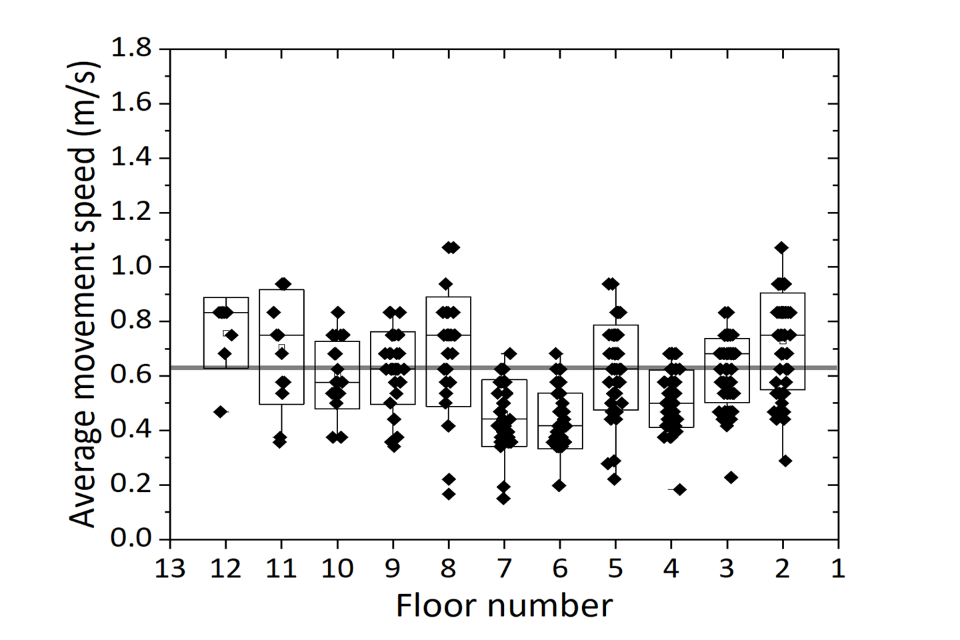
Figure 8 represents the speed of each of the 49 residents during the evacuation on each floor for Test 3A-2, starting from their original position on floors 12 to 4 and moving down to evacuate. The fastest speeds were recorded on floor 3 at around 1.5m/s and the slowest speeds were recorded on floors 11 and 10, both of which were at around 0.1m/s.
Figure 8: Average movement speeds per person per floor for Test 3A-2
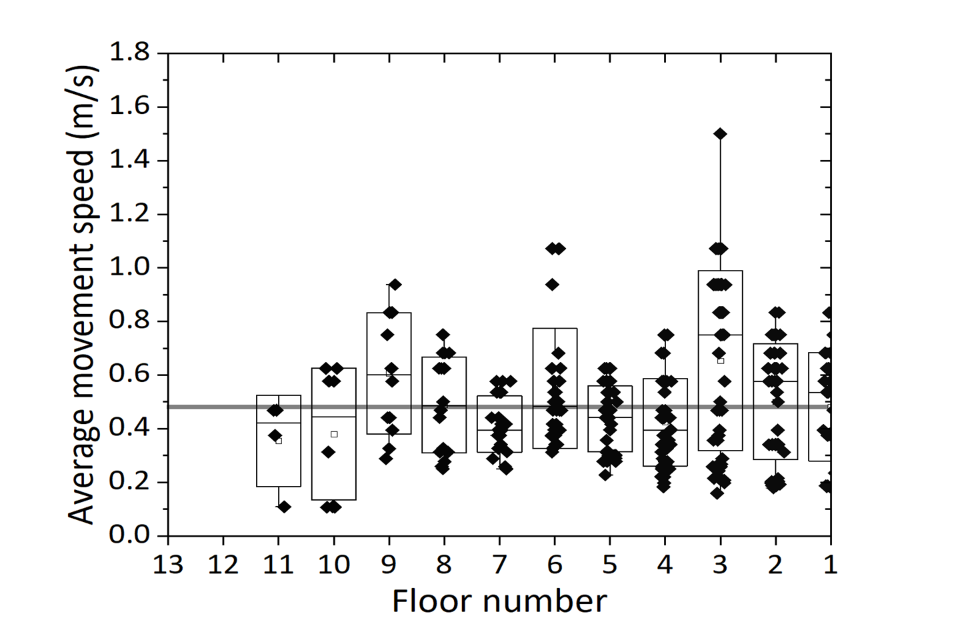
Figure 9 represents the speed of each of the 43 residents during the evacuation on each floor for Test 3B-2, starting from their original position on floors 12 to 4 and moving down to evacuate. The fastest speed was on floor 6 at around 1.5m/s while the slowest speed was recorded on floor 1 at below 0.08m/s.
Figure 9: Average movement speeds per person per floor for Test 3B-2
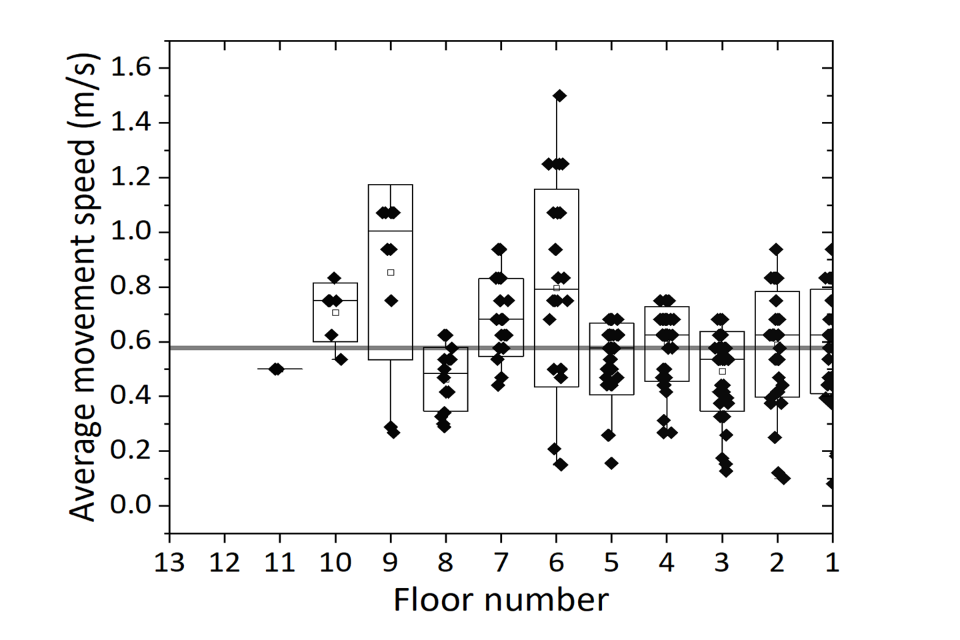
Figure 10 represents the speed of each of the 79 residents during the evacuation on each floor for Test 4-2, starting from their original position on floors 11 to 2 and moving down to evacuate. The fastest speeds recorded were on floor 6 at 1.87m/s while the slowest speeds were recorded on floors 8, 7, 6 and 1, at around 0.16m/s to 0.2m/s.
Figure 10: Average movement speed per person per floor for Test 4-2
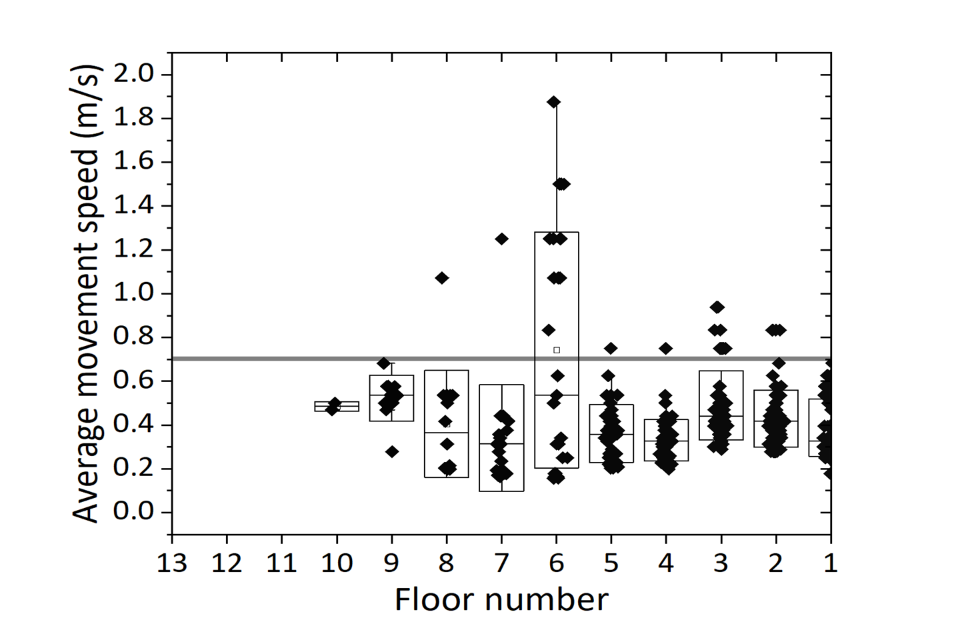
12. Appendix 5: Additional modelling information
For Pathfinder simulation of Strategies 1, 2, 3A and 3B, the model used one staircase with agents distributed across test floors, all on the left-hand side of the simulated building. For Strategy 4 (2 staircases), the Pathfinder simulation used a different distribution of start locations for the agents, with agents distributed across the breadth of simulated floors, on each side of both staircases.
When describing the modelling information, this research refers to agents and simulations to distinguish between tests and simulation models.
12.1 Modelling of Strategy 1 – A full simultaneous evacuation with EAS
To mirror the live operational test, 2 agents were instructed to move up 2 floors (10 to 12) before evacuating. In the test, there were 69 participants (with 2 mannequins in the evacuation chairs.), hence the model included 71 agents.
The model runs from 0 seconds, EAS was triggered at 6 minutes 30 seconds (390 seconds) to reflect the conditions in Test 1-1, and all agents had evacuated at 19 minutes 19.3 seconds (1,159.3 seconds).
12.2 Modelling of Strategy 2 – A full evacuation without EAS
In the modelling of Strategy 2, 2 agents were instructed to move up from floor 10 to floor 12, before evacuating. In the experiment, there were 64 participants (with 2 mannequins in the evacuation chairs, and 3 firefighters assisting), hence the model included 66 agents.
Modelling of Strategy 2 examined a phased evacuation. In the live test, firefighters notified participants floor by floor (at approximately 2-minute per floor intervals). However, the phased evacuation examined in the modelling generally used 2-minute intervals between evacuation of floors, starting with floor 6 (the seat of the fire) and working upwards to floor 13 (top floor in use) before re-commencing at floor 5, then working downwards.
The model runs from 0 seconds, EAS was triggered at 6 minutes (360 seconds) to reflect the conditions in Test 2-2, and all agents had evacuated at 28 minutes 42.5 seconds (1,722.5 seconds).
12.3 Modelling of Strategy 3A – Full phased evacuation with EAS, bottom-up
In Test 3A-2, there were 49 participants with 2 mannequins in the evacuation chairs, hence this model included 51 agents.
This model operated using the same phased sequence as in the model of Strategy 2 but reduced the time intervals to approximately 1-minute between floors.
The model runs from 0 seconds, EAS was triggered at 3 minutes 50 seconds (230 seconds) to reflect the conditions in Test 3A-2, and all agents had evacuated at 19 minutes 18.8 seconds (1,158.8 seconds).
12.4 Modelling of Strategy 3B – Full phased evacuation with EAS, top-down
In Test 3B-2, there were 43 participants with 2 mannequins in the evacuation chairs, hence this model included 45 agents.
This model also operated similarly to models 2 and 3A, but instead of a constant time interval, slightly random time intervals were used to reflect the conditions in Test 3B-2.
The model runs from 0 seconds, EAS was triggered at 2 minutes 47 seconds (167 seconds), and all agents had evacuated at 18 minutes 5 seconds (1,085 seconds).
12.5 Modelling of Strategy 4 – Full simultaneous evacuation with EAS, 2 staircases
Test 4-2 used a 2-staircase approach, with all firefighting apparatus located to the second stairwell, and all evacuation taking place through the first stairwell. Therefore, all the cross-corridor doors were opened, and participants’ start positions distributed across the whole floor area, with access to both staircases (and in contrast to the live testing experiment, modelled evacuation used both staircases). Other settings of this model are the same as in Test 4-2.
In Test 4-2, there were 79 participants with 2 mannequins in the evacuation chairs, hence the model included 81 agents.
The model runs from 0 seconds, EAS was triggered at 3 minutes 11 seconds (191 seconds) to reflect the conditions in Test 4-2, a simultaneous evacuation of the building was modelled using both the stairwells converging at a single exit at the ground floor level, and all agents had evacuated at 11 minutes 49 seconds (709 seconds).
13. Appendix 6: Building exit curves
Numerical data on the building exit curves and how the model compares with the live operational test data are presented in figure 11 for Test 1-1, figure 12 for Test 2-2, figure 13 for Test 3A-2, figure 14 for Test 3B-2 and figure 15 for Test 4-2. The following 5 figures use labels, such as ‘Scenario 1-1’, which refers to the experimental activity Test 1-1, and ‘PF1’, which refers to the Pathfinder modelling applied to the corresponding strategy.
Figure 11 shows that the simulated results over-predicted the evacuation times in all stages of Test 1-1. Nevertheless, the total evacuation time predicted for Test 1-1 was 19 minutes 19 seconds (1,159 seconds), compared with 19 minutes 15 seconds (1,155 seconds) during the experiments. This resulted in an error of 0.35%. Also, the first person evacuating the building was relatively accurately predicted, as they were shown to exit the building approximately 50 seconds later than the test data.
Figure 11: Building exit curve for Test 1-1
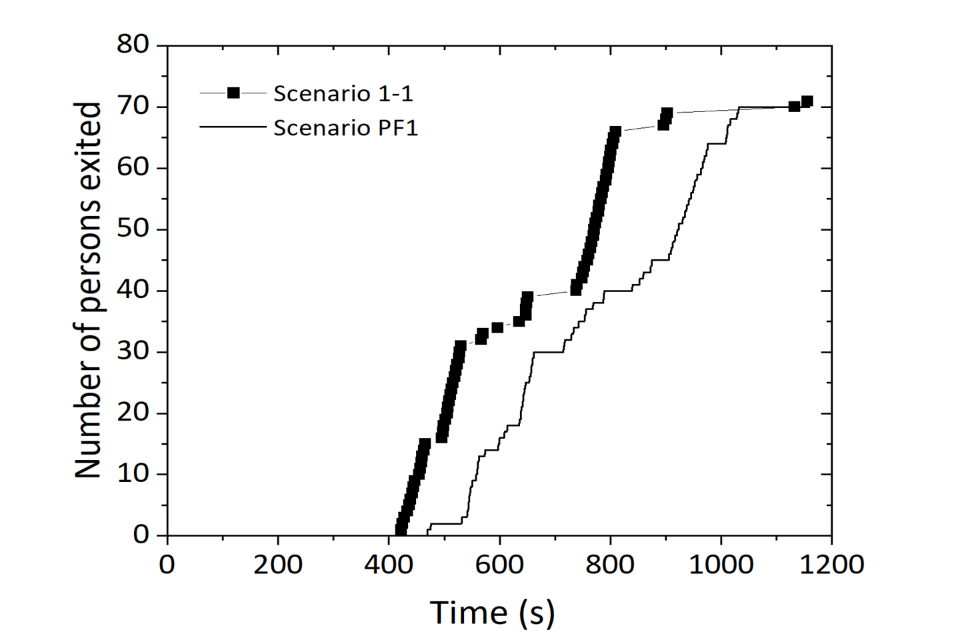
Figure 12 shows that the simulated results were close to the experimental evacuation times in all stages of the evacuation. Also, the total evacuation time predicted for Test 2-2 was 28 minutes 43 seconds (1,723 seconds), compared with 28 minutes 38 seconds (1,718 seconds) during the experiments. This resulted in a very low error of 0.29%. The first person evacuating the buildings was relatively accurately predicted, as they were shown to exit the building approximately 30 seconds later than the test data.
Figure 12: Building exit curve for Test 2-2
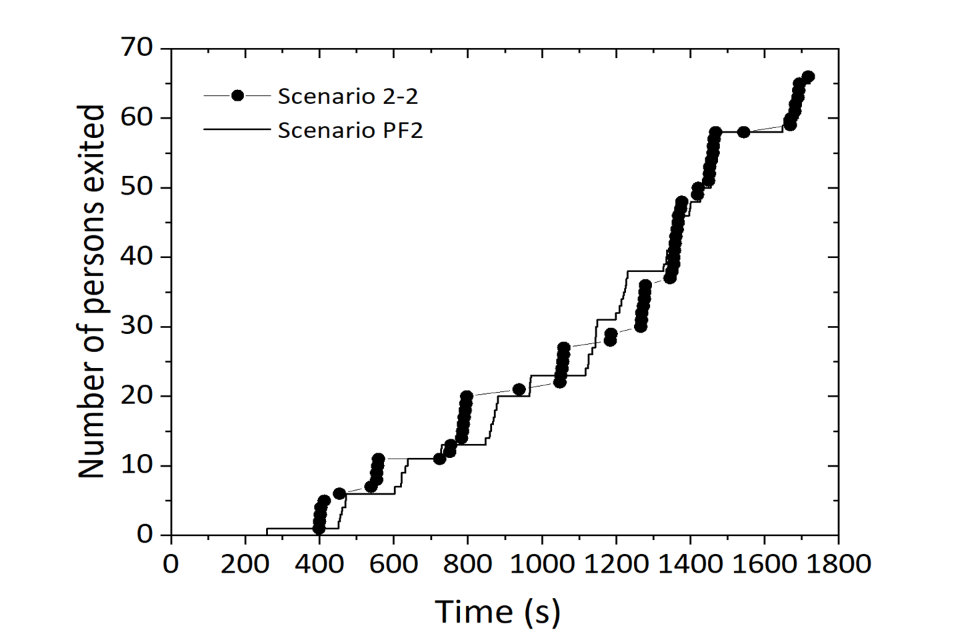
Figure 13 shows that the simulated results were close to the test evacuation 3A-2. The total evacuation time predicted for Test 3A-2 was 19 minutes 19 seconds (1,159 seconds), compared to 20 minutes 6 seconds (1,206 seconds) during the experiments. This resulted in an error of -4.06%. In this case, the first person evacuating the buildings was relatively accurately predicted as they were shown to exit the building approximately 50 seconds later than the test data.
Figure 13: Building exit curve for Test 3A-2
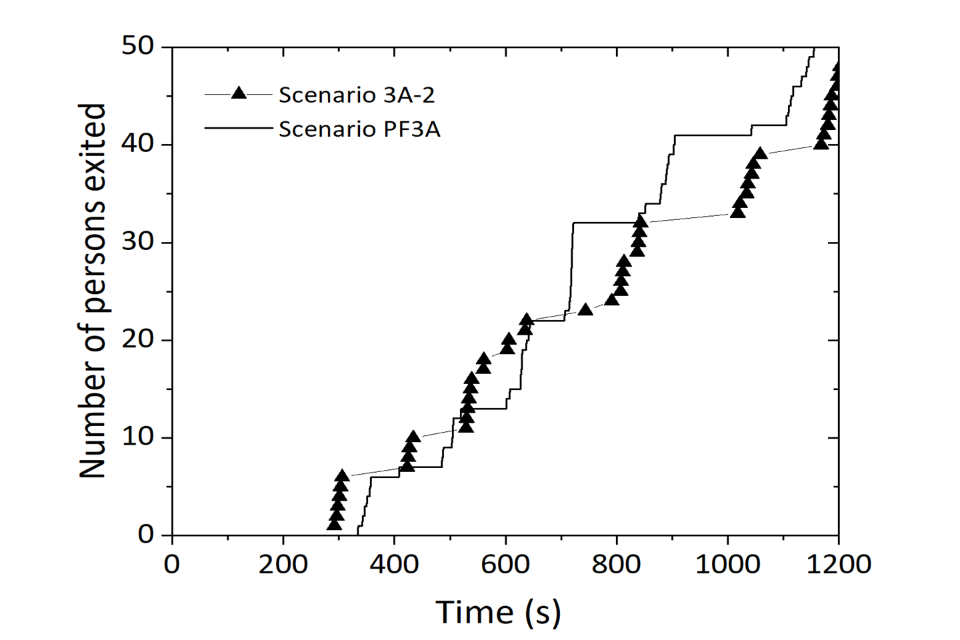
Figure 14 shows that the simulated results were close to the experimental evacuation times in all stages of the evacuation. The total evacuation time predicted for Test 3B-2 was 18 minutes 5 seconds (1,085 seconds), compared to 18 minutes 1 second (1,081 seconds) during the experiments. This resulted in an error of 0.37%. The first person evacuating the buildings was relatively accurately predicted as they were shown to exit the building approximately 60 seconds later than the experimental data.
Figure 14: Building exit curve for Test 3B-2
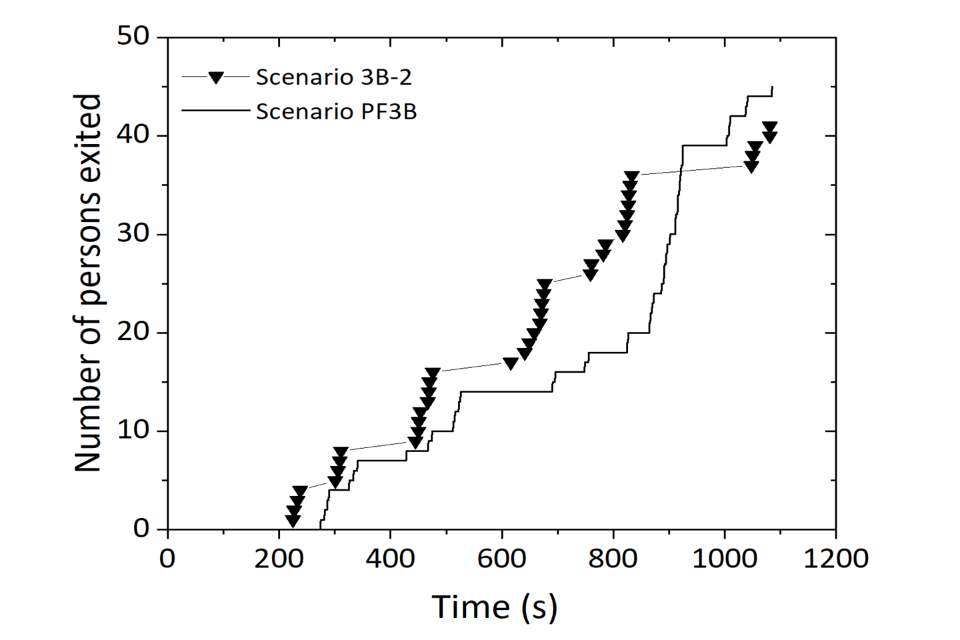
Figure 15 shows that the simulated results were fairly close to the test evacuation times in all stages of the evacuation. The total evacuation time predicted for Test 4-2 was 11 minutes 50 seconds (710 seconds), compared to 9 minutes 2 seconds (542 seconds) during the experiments. This resulted in an error of 23.7%. The first person evacuating the buildings was over-predicted as they were shown to exit the building approximately 80 seconds later than the experimental data. However, it must be noted that the model allowed evacuation through 2 staircases, whereas during the live tests, firefighting operations took place in the original staircase and evacuation was only carried out in the second staircase.
Figure 15: Building exit curve for Test 4-2
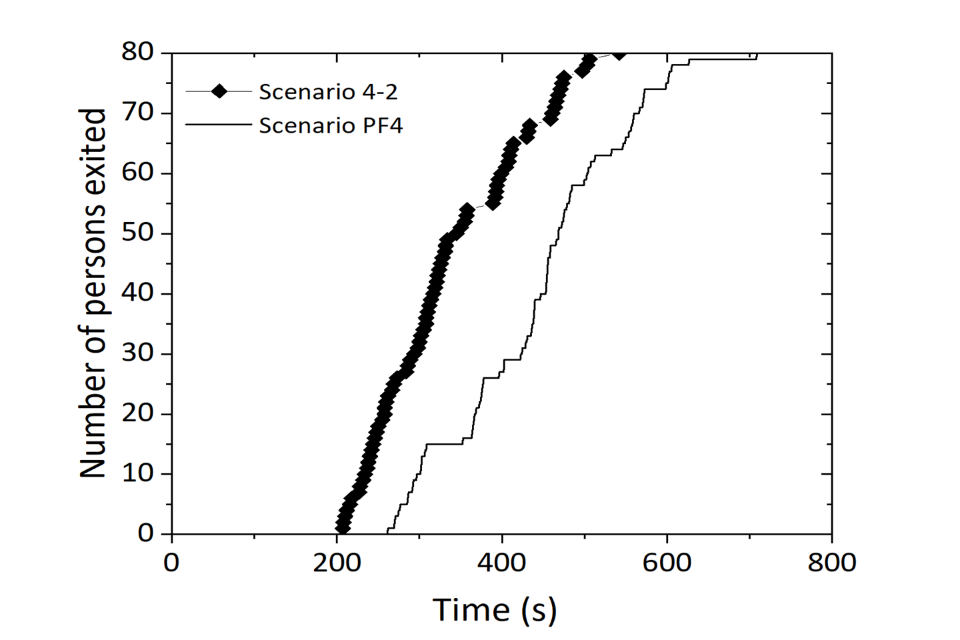
14. Appendix 7: Further assumptions and limitations
Experiment repetition: Each of the 5 live evacuation tests was repeated twice. Only data from Tests 1-1, 2-2, 3A-2, 3B-2 and 4-2 (the most complete dataset from each pair) were used in the analysis. The strategies tested were limited to the different HRRB evacuation strategies identified in the pre-project scoping work. Ideally, additional evacuation trials could have been conducted with different fire scenarios, evacuation routes and fire spread assumption mechanisms.
Experimental announcement: This research followed the announced approach, using non-resident volunteers, as opposed to monitoring unannounced evacuations of genuine residents. Experimental evacuation studies have been criticised for not representing valid human behaviour and evacuation in fires, as perhaps they were not representative of the situation occupants will face in a real fire (Gwynne et al., 1999; Kuligowski, 2003); However, these studies can still capture the data related to movement speed (m/s) and flow rates.
Signalling full evacuation after lifting a ‘stay put’ position: This research focused on the emergency evacuation of a HRRB with a ‘stay put’ position, instigated by FRS when the ‘stay put’ position is becoming unsustainable due to a failing building. Although the incidence of an EAS in HRRBs is relatively low as identified in the project scoping, all but one test assumed an EAS was available, allowing either a truly simultaneous or phased evacuation signal. The research did not evaluate the effectiveness of the EAS system, nor did it investigate alternative evacuation strategies that may be adopted at building design stage.
Pre-movement time in residential buildings (the time between the alarm or evacuation signal being given and occupants starting to evacuate) is widely reported in guidance documents and studies (SFPE, 2016; Gwynne & Boyce (2016); BSI, 2019).
Pre-movement time can be a major component of the total evacuation time; it can vary and be difficult to quantify. This study included participants who started evacuation at the flat entrance doors, were awake and were informed about their expected behaviour and initial response. Gwynne and Boyce (2016) reported that in HRRBs, pre-movement time can range from 0.3 to >20 minutes. This could increase the overall evacuation time if pre-movement time was considered. However, the aim of this research was to conduct a comparative study of evacuation scenarios, not to determine the total evacuation time for the building experiments. Therefore, this study did not investigate pre-movement times in HRRB as the flats within the building used were inaccessible. Future non-announced evacuations could allow for accurate capture of pre-movement time.
Volunteer evacuees were used, therefore the number available varied between tests. Numbers (between 43 and 80 per experiment) were comparable with other evacuation tests in residential buildings (Lovreglio et al., 2019). Scripts (with timeframes) were provided, but the actual actions of volunteers may have differed from the plan.
Building familiarity may assist evacuation speeds for HRRB residents, but in the event of an evacuation, there may be several visitors or new residents who might not be familiar with it (Sime, 1985), (Canter et al., 1980). During the tests, the factor of place affiliation (ibid) was minimised as different volunteers participated each day. Non-announced evacuations would allow consideration of the impact of evacuees’ familiarity with the building. However, it is important to note that 3 live tests were conducted on the Wednesday and Thursday, which means some volunteers may have become increasingly familiar with the building.
Building environment parameters were controlled and matching for each strategy (except Strategy 4, in which dividing doors were opened to allow access to the second staircase). The internal staircase light levels would be the same during night-time as during the daytime experiments, but for other buildings, lighting levels may reduce at night and impact walking speed (Frantzich & Nilsson, 2004).
Firefighting operations were assumed to follow the SOPs and existing LFB Operational Techniques appropriate to this HRRB incident (LFB, 2021; LFB, 2017; NFCC, 2022). During all tests, the SPTs simulated the requirement to deploy breathing apparatus above the bridgehead, which is a safe base from which to commence firefighting operations. Firefighting operations took place within the same single staircase as evacuations in all, apart from Strategy 4, where firefighting operations continued to take place in the same staircase, but the second staircase was utilised for evacuation. Trends in response times and procedures of the first responders were limited to the building tested and data could be different for different geometries and floor heights.
Smoke was not present during the experiments, although smoke curtains were installed on each floor. Smoke reduces visibility, impacts on ability to identify escape routes and reduces movement speed. Jin and Yamada (1989) have shown that both irritant smoke and increased smoke density further reduce movement speed. Smoke is likely to be hot, and this radiant heat can influence evacuees (for example, respiratory tract burns, body surface burns or hyperthermia). Smoke also reduces oxygen concentration, which can impair movement, judgement and even cause loss of consciousness (Stensaas, 1991), depending on the level of oxygen loss.
Fatigue was also not accounted for in the live operational tests. Although some participants were instructed to move slower than the average movement speed, the research does not account for the impact of fatigue on all participants, including those who may need to help others evacuate. Fatigue can impact evacuation time and movement speed and can further complicate the impact of smoke on movement and evacuation time.
The impact of smoke on visibility may reduce movement during fire evacuation. For example, Fridolf et al. (2018) suggested where visibility levels are ≤3m, occupants’ walking speeds reduce by as much as 0.34m/s. The experiments did not evaluate the impact of fire products, such as smoke or heat, on movement speeds or on reaction to the alarm.
Public access/intervention was excluded from the experiment as the experimental building was not publicly accessible and evacuees were gathering into the assembly point after each exercise as instructed during the briefing. Due to this, the live testing did not need to consider any requirements for members of the public.
The number of evacuees was similar for the simultaneous evacuations using EAS – Test 1-1 with single staircase (80 participants) and Test 4-2 with 2 staircases (79 participants). However, evacuee numbers were lower for Test 2-2 full evacuation without EAS (68 participants) and lower still for the pair of phased evacuations, Tests 3A-2 and 3B-2 (with 49 and 43 participants, respectively).
Movement speed depends upon the density of people on the stairs (Kuligowski, et al., 2015; Hoskins & Milke, 2013). Occupied floors had an average of 1.8 to 1.9 people per flat, which is similar to the average (mean) size household of 1.9 people in HRRBs (MHCLG, 2019). Although the number of occupants varied slightly between tests, FRS controlled the movement down the stairs (apart from in simultaneous exits in Test 1-1 and Test 4-2). Further experiments could be carried out with larger samples than the ones used in this study to better understand the dependency of movement speed on density and the impact on firefighting activities.
The location of residents with impairments was on the same 2 floors during all the tests to ensure consistency. Volunteers acted to represent residents with mobility impairments as per scripts provided, and FRS standard training mannequins were placed in evacuation chairs to represent those unable to walk to the ground floor unaided. However, while the location of residents with impairments is unsupported by data from real fires, we can assume that residents may be on any floor within the building.
14.1 Further limitations of the modelling
Various sources of randomness in real incidents were eliminated as each occupant was assigned starting positions and walking speeds within the model. However, further sensitivity analysis could be performed to evaluate the impact of pre-movement time and initial position of the occupants on the efficiency of evacuation. Typical occupants were generated to serve as a template for evacuee profiles and would not follow unexpected evacuation behaviours such as jumping.
Pathfinder simulated the walking speed for each evacuee as a constant value, using average evacuation speeds observed in experiments. However, the experiments have shown that constant speeds were not realistic, as speeds varied on each floor. In addition, evacuees with a visual impairment could not be defined in the model.
The dimensions of the wheelchairs simulated did not directly match the evacuation chairs. Simulations of the evacuation chair times should therefore be further validated.
Simulations could not consider the obstacles on the floor and staircases. Consideration should be given to further evacuation software that can simulate obstructions, such as firefighting hoses and smoke curtains.
15. Appendix 8: References
Boyce, K.E, Shields, T.J. and Silcock, G.W.H. (1999) ‘Toward the Characterization of Building Occupancies for Fire Safety Engineering: Capabilities of Disabled People Moving Horizontally and on an Incline’, Fire Technology, Vol. 35(1), pp. 51-67. Available from: https://doi.org/10.1023/A:1015339216366 [accessed 19/12/2023]
BSI (2019) PD 7974-6:2019 The application of fire safety engineering principles to fire safety design of buildings - Part 6: Human factors: Life safety strategies — Occupant evacuation, behaviour, and condition (Subsystem 6). British Standard Institute, UK.
Canter, D., Breaux, J.J. and Sime, J.D. (1980) ‘Domestic, multiple occupancy and hospital fires’, in D. Canter (ed.) Fires and Human Behaviour: Emerging issues. New York: John Wiley.
Frantzich, H. and Nilsson, D (2004) ‘Evacuation experiments in a smoke-filled tunnel’, in Human Behaviour in Fire – Proceedings of the Third International Symposium, Belfast, UK, pp. 229–238.
Fridolf, K. Nilsson, D. Frantzich, H., Ronchi, E. and Arias, S. (2018) Walking Speed in Smoke: Representation in Life Safety Verifications, WSP Sverige AB, Q2 2018 Issue 10. Available online https://www.sfpe.org/publications/periodicals/sfpeeuropedigital/sfpeeurope10/issue10feature1 [accessed 19/12/2023]
Gwynne, S.M.V. and Boyce, K.E. (2016) ‘Engineering Data’, in SFPE Handbook of Fire Protection Engineering, USA.
Hopkin C., Spearpoint M., Hopkin D. and Wang Y. (2019) ‘Residential occupant density distributions derived from English Housing Survey data’, Fire Safety Journal, Vol. 104, pp.147-158. Available from: Residential occupant density distributions derived from English Housing Survey data - ScienceDirect [accessed 19/12/2023]
Hoskins, B.L. and Milke, J.A (2013) Study of Movement Speeds Down Stairs, Springer, UK. Available from: https://doi.org/10.1007/978-1-4614-3973-8 [accessed 19/12/2023]
Jin, T. and Yamada, T. (1989) ‘Experimental Study of Human Behaviour in Smoke Filled Corridors’, Fire Safety Science - Proceedings of the First International Symposium, NIST, USA, 511-519. Available from: https://web.archive.org/web/20190428235556/http://www.iafss.org/publications/fss/2/511/view/fss_2-511.pdf [accessed 19/12/2023]
Kuligowski, E.D. Peacock, R.D et al. (2015) Movement on Stairs During Building Evacuations, NIST Technical Note 1839, NIST. Available from: Movement on Stairs During Building Evacuations NIST[accessed 19/12/2023]
LFB (2017) Highrise Fire Fighting, Policy Number 633, London Fire Brigade, UK
LFB (2021) Evacuation and Rescue from fires in premises, Policy Number 970, London Fire Brigade, UK
Lovreglio, R., Kuligowski, E., Gwynne, S. and Boyce, K. (2019) ‘A pre-evacuation database for use in egress simulations’, Fire Safety Journal, Vol. 105, pp. 107-128. Available from: https://www.sciencedirect.com/science/article/abs/pii/S0379711218302212?via%3Dihub [accessed 19/12/2023]
MHCLG (2019) English Housing Survey, Households Report, 2017-18, Ministry of Housing, Communities and Local Government, UK
NFCC (2017) NFCC ‘Stay Put’ position statement (online). Available from: Stay Put - NFCC [accessed 12/01/2024]
NFCC (2022) Control measure – Appropriate intervention: Fires in tall buildings, National Fire Chiefs Council (online). Available from: https://nfcc.org.uk/control-measure/control-measure-appropriate-intervention-fires-in-tall-buildings/ [accessed 19/12/2023]
ONS (2021) ‘Disability, England and Wales, Census 2021’. Office for National Statistics. Available from: Disability, England and Wales - Office for National Statistics (ons.gov.uk) [accessed 10/01/24]
Proulx, G. (1995) ‘Evacuation Time and Movement in Apartment Buildings’, Fire Safety Journal, Vol. 24, pp. 229-246. Available from: Evacuation time and movement in apartment buildings - ScienceDirect [accessed 19/12/2023]
Proulx, G. Latour, J.C. MacLaurin, J.W. Pineau, J. Hoffman, L.E. and Laroche, C. (1995) Housing evacuation of mixed abilities occupants in high-rise buildings, NRCC Report 706. National Research Council Canada. Available from: Housing evacuation of mixed abilities occupants in highrise buildings - NRC Publications Archive - Canada.ca [accessed 19/12/2023]
SFPE (2016) SFPE Handbook of Fire Protection Engineering, 5th edition. Society of Fire Protection Engineers, Springer-Verlag New York
SFPE (2019) SFPE Guide to Human Behavior in Fire, 2nd edition. Society of Fire Protection Engineers, Springer International Publishing. Available from: SFPE Guide to Human Behavior in Fire, SpringerLink [accessed 19/12/2023]
Sime, J. D. (1985) ‘Movement toward the Familiar: Person and Place Affiliation in a Fire Entrapment Setting’, Environment and Behavior, Vol. 17(6), pp. 697-724. Available from: Movement toward the Familiar: Person and Place Affiliation in a Fire Entrapment Setting - Jonathan D. Sime, 1985 (sagepub.com) [accessed 19/12/2023]
Stensaas, J. P. (1991) Toxicity, Visibility and heat stress of fire effluents – human tenability limits, Norwegian, Fire Research Laboratory, SINTEF
Williams, J. (2019) High Rise Buildings over 18 Metres – SOP – Service Delivery, Greater Manchester Fire and Rescue Service, UK