European Social Fund and Youth Employment Initiative Leavers Survey Report 2016-2019
Published 2 March 2022
Applies to England

© Crown copyright 2022
This publication is licensed under the terms of the Open Government Licence v3.0 except where otherwise stated. To view this licence, visit nationalarchives.gov.uk/doc/open-government-licence/version/3 or write to the Information Policy Team, The National Archives, Kew, London TW9 4DU, or email: psi@nationalarchives.gov.uk.
Where we have identified any third party copyright information you will need to obtain permission from the copyright holders concerned.
This publication is available at https://www.gov.uk/government/publications/european-social-fund-and-youth-employment-initiative-leavers-survey-report-2016-2019/european-social-fund-and-youth-employment-initiative-leavers-survey-report-2016-2019
European Social Fund and Youth Employment Initiative Leavers Survey Report 2016-2019
Research on behalf of Department for Work and Pensions and European Commission
March 2022
DWP research report no. 1010
A report of research carried out by IFF Research on behalf of the Department for Work and Pensions.
Crown copyright 2022
You may re-use this information (not including logos) free of charge in any format or medium, under the terms of the Open Government Licence
Or write to the:
Information Policy Team
The National Archives
Kew
London
TW9 4DU
Email: psi@nationalarchives.gov.uk
This document/publication is also available on our GOV.UK website
If you would like to know more about DWP research, email socialresearch@dwp.gov.uk
First published March 2022
ISBN 978-1-78659-359-7
Views expressed in this report are not necessarily those of the Department for Work and Pensions or any other government department.
Executive summary
This report provides findings for the England European Social Fund (ESF) and Youth Employment Initiative 2016-2018 Leavers (YEI) survey. The research was commissioned by the Department for Work and Pensions (DWP) to explore the experiences of people in England who had recently left work-related courses/programmes funded through the ESF, including the Youth Employment Initiative (YEI). Specifically, the research sought to collect information about participants’ situation on entry to and six months after they have left ESF provision (to determine long-term outcomes), and participant views on the provision.
The research involved a large-scale quantitative telephone survey with 19,769 participants who had left the ESF provision between December 2015 and December 2018, and YEI provision between December 2015 and May 2019.
Some of the main findings from this research include:
- The ESF programme reached many people who faced labour market disadvantage. For many of those assisted, unemployment was an entrenched position.
- Provision was received very positively and views were consistently positive across Investment Priority and CFO.
- Improvements in soft-skills as a result of receiving ESF provision were widely reported, and participation appears to have greatly increased optimism about finding employment.
- Half of YEI leavers received a job offer in the six months following provision.
- Job outcomes across the ESF programme were quite common, and experienced by a range of leavers.
- The job outcome rate was comparable across all CFOs focussing on employability support (HMPPS, DWP and National Lottery Community Fund) and Direct Providers.
- Nearly all of those who received in-work support were still in employment six months later, a large minority reported progress at six months and nearly all reported improved prospects for the future.
- Positive employment outcomes should decrease welfare claimants, indeed the proportion of DWP participants claiming benefits decreased by a quarter between entry to provision and six months later.
- There was a slightly unexpected shift of some participants from being unemployed at the start of provision to being economically inactive six months after leaving; this happened for a third of participants unemployed on provision entry. Most commonly, these leavers were in education or training, or unable to work because of health at six months.
Acknowledgements
This report was commissioned by the Department for Work and Pensions (DWP). DWP is Managing Authority for the European Social Fund in England. The evaluation was part-funded by European Social Fund (ESF) technical assistance.
We would like to thank Will Farbrother and Nick Campbell in DWP’s ESF Evaluation Team for their guidance and contributions throughout the project, and to the members of the ESF Evaluation Steering Committee for their advice and expertise.
We would also like to thank all the participants that gave up their time to take part in the study. Without them of course, the research would not have been possible.
Authors
A large team of researchers worked on the study and contributed to the report.
Lorna Adams is a Director at IFF, where she has worked for 20 years. She specialises in studies in the employment and benefits field, particularly for the Department for Work and Pensions (DWP).
Mark Winterbotham is a Director at IFF, where he has worked for 25 years specialising in labour market research.
Andrew Skone James is a Director at IFF, where he has worked for 10 years. He specialises in research in the learning and skills field. Christabel Downing is a Senior Research Manager at IFF, where she has worked for six years. Christabel specialises in evaluation, with a particular focus on work, welfare and wellbeing research.
Hamish Evans is a Research Executive and has worked at IFF Research for a year.
Other IFF researchers that have contributed to the project include Sam Selner, Catherine Turner and Libby Eastwood.
Abbreviations
| Acronym | Definition |
|---|---|
| BAME | Black, Asian and Minority Ethnic |
| CFO | Co-financing Organisation |
| CSR | Country Specific Recommendations |
| DWP | Department for Work and Pensions |
| ESF | European Social Fund (unless specified this refers to 2014-2020 ESF programme) |
| ESFA | Education and Skills Funding Agency |
| ESFD | European State Finance Database |
| EU | European Union |
| HMPPS | Her Majesty’s Prison and Probation Service, formerly National Offender Management Service |
| IP | Investment Priority |
| LEPs | Local Enterprise Partnerships |
| MA | Managing Authority |
| MI | Management Information – refers to participant level information collected by ESF providers |
| NEET | Not in Education, Employment or Training |
| NLCF | National Lottery Community Fund |
| YEI | Youth Employment Initiative |
Glossary of terms
| Term | Definition |
|---|---|
| Basic skills | Basic skills are defined as entry level, level 1 or level 2 in English, maths or English for Speakers of Other Languages (ESOL; where English is not the participant’s ‘mother tongue’) |
| Category of region | The categorisation of regions as ‘less developed regions’, ‘transition regions’ or ‘more developed regions’: (a) less developed regions, whose GDP per capita is less than 75% of the average GDP of the EU-27; (b) transition regions, whose GDP per capita is between 75% and 90% of the average GDP of the EU-27; (c) more developed regions, whose GDP per capita is above 90% of the average GDP of the EU-27. The classification of regions under one of the three categories of regions was determined on the basis of how the GDP per capita of each region relates to the average GDP of the EU-27 for the same reference period (2007-2009). |
| Co-financing Organisations (CFOs) | Public bodies which bring together ESF and domestic funding for employment and skills so that ESF complements national programmes. Provision for the 2014-2020 Operational Programme was delivered through 4 Co-financing Organisations, the Education and Skills Funding Agency (ESFA), DWP, National Lottery Community Fund (formerly Big Lottery Fund); Her Majesty’s Prison and Probation Services (HMPPS, replacement of National Offender Management Service or ‘NOMS’), as well as direct providers. |
| Disadvantaged participants | In line with the European Commission definition, these are participants who: * Lived in a ‘jobless household’[footnote 1]; * Were a single adult household with dependent children; * Had no formal qualifications; * Lacked basic skills[footnote 2]; * Were homeless/living in a hostel at start of provision; * Were from an ethnic minority background; or * Had drug or alcohol dependency at start of provision. |
| Disability or long-term health condition | A physical or mental impairment that has a ‘substantial’ and ‘long-term’ negative effect on your ability to do normal daily activities. * ‘substantial’ is more than minor or trivial - e.g. it takes much longer than it usually would to complete a daily task like getting dressed * ‘long-term’ means 12 months or more |
| Economically Inactive | Those not working, and are either not looking for work, or not available for work. It includes the following groups: * participants in full or part-time education; * those not in employment because of sickness or disability; * those looking after the family or home full time; * those caring for an adult family member, relative or friend who has any long-standing illness, disability or infirmity; * those in a voluntary, unpaid role or internship (not a family business); and * those in prison. |
| European Social Fund (ESF) | The European Social Fund (ESF) is the European Union’s main fund for supporting employment in the member states of the European Union as well as promoting economic and social cohesion. |
| ESF provider | Refers to any or all organisations delivering ESF funded provision, including CFOs, opt-in organisations, direct bid providers, and intermediary bodies or organisations contracted by them to offer provision |
| Full-time work | Work for an employer in a paid role 30 hours or more per week. |
| Improved labour market situation | Persons in an improved labour market situation are those who are employed when entering ESF support and who, following the support, transited from precarious to stable employment, and/or from underemployment to full employment, and/or have moved to a job requiring higher competences / skills /qualifications, entailing more responsibilities, and/or received a promotion 6 months after leaving the ESF operation. |
| Jobless household | Jobless households are households where no member is in employment, i.e. all members are either unemployed or inactive. |
| Long-term unemployed | The definition of long-term unemployed varies with age: * Youth long-term unemployed (<25 years of age) = more than 6 months continuous spell of unemployment * Adult long-term unemployed (25 years of age or more) = more than 12 months continuous spell of unemployment |
| Part-time work | Work for an employer in a paid role less than 30 hours per week. |
| Precarious employment | Temporary employment with an employer or a work contract of limited duration. |
| Stable employment | Work for an employer with a permanent or open-ended contract. |
| Underemployed | Where an individual is working part-time but wanting full-time work. |
| Wrap around support | A combination of mentoring and 1:1 support that encourages retention in existing learning opportunities, rather than offer alternative learning pathways with limited progression routes. |
| Youth Employment Initiative (YEI) | The Youth Employment Initiative (YEI) is one of the main EU financial resources to support Youth Guarantee schemes[footnote 3]. The initiative was launched to provide support living in regions where youth unemployment was higher than 25 per cent. It ensures that in parts of Europe where the challenges are most acute, young people can receive targeted support. In England the YEI is aimed at 15-29 year old NEETs (Not in Employment, Education or Training). |
Summary
Introduction
The European Social Fund (ESF) was set up to improve employment opportunities in the European Union (EU) and thereby raise standards of living. The Department for Work and Pensions is the Managing Authority (MA) of ESF funds in England.
The ESF 2014-20 Operational Programme - part of the European Structural and Investment Funds (ESIF) Growth Programme for England - aimed to deliver against priorities to increase labour market participation, promote social inclusion and develop the skills of the potential and existing workforce.
There are five investment priorities (IPs) underpinning the 2014-20 Operational Programme which directly benefit individuals:
- IP 1.1: access to employment for jobseekers and inactive people
- IP 1.2: sustainable integration into the labour market of young people, through ESF funding
- IP 1.3: sustainable integration into the labour market of young people, through Youth Employment Initiative (YEI) funding
- IP 1.4: active inclusion
- IP 2.1: increasing the skills of the current workforce, enhancing equal access to lifelong learning
Provision for the 2014-2020 Operational Programme was delivered through 4 Co-financing Organisations, the Education and Skills Funding Agency (ESFA), DWP, National Lottery Community Fund (NLCF, formerly Big Lottery Fund); Her Majesty’s Prison and Probation Services (HMPPS, replacement of National Offender Management Service or ‘NOMS’), as well as direct providers.
Research aims (Chapter 1)
The DWP commissioned IFF Research to conduct a study exploring the experiences of people in England who had recently left work-related training courses funded through the ESF, including the Youth Employment Initiative (YEI). Specifically, the research sought to collect information about participants’ situation on entry to and six months after they have left ESF provision (to determine long-term outcomes), and participant views on the provision. This information is also needed to meet European Commission requirements to supply Long-Term Results Indicators as set out in the Operational Programme.
The research is part of a wider evaluation programme to provide robust evidence of the impact of the 2014-2020 ESF in England.
Methodology (Chapter 1)
The research involved a large-scale quantitative telephone survey with participants who had left the ESF provision between December 2015 and December 2018, and YEI provision between December 2015 and May 2019. Leavers were contacted at least six months after leaving provision, with all fieldwork across the pilot and nine mainstage waves taking place between February 2017 and January 2020.
In total, 19,769 interviews were completed with ESF and YEI leavers across the pilot and mainstage, with an average response rate of 23 per cent.
Summary of findings
A wide variety of provision types were offered through the range of co-financing organisations (CFOs), from courses designed to reduce the risk of redundancy to those tackling the barriers to work specifically faced by current, or ex-offenders. With the study covering a wide coverage of this provision, any comparisons of outcomes across different types of provision should be made in this context.
Key groups and demographics (Chapter 2)
Approximately 560,000 individuals completed ESF provision between December 2015 and December 2018, and just under 50,000 completed YEI provision between December 2015 and June 2019 (the relevant timeframes for this research).
IPs 1.1 and 2.1 accounted for the greatest proportions of leavers (33 per cent and 28 per cent, respectively). Around one in five leavers (19 per cent) were under IP 1.4, while lower proportions fell under IPs 1.2 (12 per cent) and 1.3 (YEI, 8 per cent).
Each CFO had a corresponding focus by IP(s). HMPPS and National Lottery Community Fund provision both related entirely to IP 1.4, and the vast majority of DWP provision (90 per cent) related to IP 1.1. Direct Provider provision predominantly focused on IP 1.3 (62 per cent) but addressed all IPs, while Skills Funding Agency focused on all IPs except 1.3, with IPs 1.1 and 2.1 most common (34 and 39 per cent, respectively).
This relationship means that many of the findings by CFO are likely to be related to differences by IP and their target audiences.
Labour market status on entry (Chapter 2)
Just over half (56 per cent) of participants were unemployed and looking for work and 15 per cent were economically inactive on entry to the programme. Nearly one-third (29 per cent) were in employment.
The profile of labour market status within IP and CFO aligned with the focus of each priority:
- Most IP 2.1 participants (92 per cent) of were employed on entry, in line with the priority’s objective to address the basic skills and increase the skills levels of individuals in work; this group made up the majority of individuals employed. One in five (20 per cent) participants under IP 1.2 were also employed on entry; employment rates across all other IPs were extremely low.
- Owing to the ESFA having a large proportion of participants under IP 2.1, this was the only CFO with a considerable proportion of participants employed on entry (40 per cent). HMPPS and DWP participants were the most likely to be economically inactive on programme entry (35 per cent and 34 per cent).
More than four-fifths (82 per cent) of participants in work on entry to provision were working for an employer in a paid role. One in ten (10 per cent) were self-employed. Around three-quarters (74 per cent) of all employed participants were working full time, and the vast majority (90 per cent) were “fully employed”, i.e. they were working full time or working part-time and did not want to be working full time.
Most participants working for an employer were in stable employment (65 per cent), i.e. they were on a permanent or open-ended contract. Around one in seven were in temporary employment or that with a work contract of limited duration (also referred to as ‘precarious employment’, 14 per cent) or employment of unknown stability (13 per cent).
Overall, four per cent of participants were in training or education on entry to the programme.
The majority (85 per cent) of participants unemployed on entry cited barriers to work. Lack of recent working experience and/or availability of jobs were the most common prospect-related barriers to work, both cited by nearly half (48 per cent) of all unemployed participants. Concern around lack of recent experience was more common among YEI participants (59 per cent versus 47 per cent ESF only).
Barriers related to personal characteristics were less common overall, with just under half (49 per cent) of unemployed individuals facing no barriers in this regard. Significantly more ESF (31%) than YEI (18%) participants felt that their disability or health problem was making it harder for them to find work.
Programme experience (Chapter 3)
Support needs and assistance
Just over a quarter (27 per cent) of participants had parental/guardianship responsibilities for children under 18. Only four per cent received support/assistance with childcare responsibilities from their provider, the vast majority (91 per cent) were not offered this support.
Eight per cent had caring responsibilities for a family member, relative or friend. As with childcare, only a small minority (six per cent) received support/assistance in this regard; most (88 per cent) were not offered this support.
Around a quarter (26 per cent) had a mental or physical health condition, or illness expected to last 12 months or more. Approaching a third (31 per cent) of these participants received support and a further eight per cent were offered support.
Regardless of the support need and related assistance, the vast majority (at least 90 per cent across the three types) of participants were satisfied and just under three-quarters said they would have had difficulty attending the course without it.
Programme benefits and satisfaction
Views on the provision were broadly positive:
- Around nine in ten were satisfied with:
- Information and guidance they received on what would be delivered through the programme (88 per cent)
- Feedback and guidance they received during the programmes (87 per cent)
- Relevance of the programme to their specific needs (86 per cent).
- More than three-quarters of all leavers thought the difficulty of the course and the amount of time spent on the course was ‘about right’ (78 per cent for both difficulty and duration).
- The majority of participants reported forms of improved confidence and skill development as an outcome (e.g. self-confidence about working, 73 per cent; improvement ability to do things independently, 72 per cent).
- Nine in ten (90 per cent) participants employed at programme entry reported the course has had helped them in their work environment.
- Eight in ten participants (81 per cent) inactive or unemployed at entry reported that the course had helped them find a job or made it more likely they will find work.
- One in five (19 per cent) YEI participants undertook a traineeship as part of the programme. Nine in ten (89 per cent) who did were satisfied with their traineeship experience; 54 per cent were very satisfied.
- Assessing all the support received from the programme and how they may have benefited since, more than eight in ten (82 per cent) expressed satisfaction, with nearly half (46 per cent) saying were very satisfied.
Employment at six months (Chapter 4)
More than half (53 per cent) of individuals were in employment six months after leaving the programme compared to less than three in ten (29 per cent) at entry, representing a 24 percentage point increase in employment. While the proportion of individuals unemployed fell from 56 to 20 per cent, there was also a rise in the proportion economically inactive from 15 to 26 per cent.
Employment among ESF-only participants grew 22 percentage points, from 32 per cent to 54 per cent, while YEI-only participants increased from one per cent to 45 per cent. For both leaver groups, unemployment reduced while economic inactivity grew.
Nine per cent of all leavers were in education or training six months after leaving their provision (falling into the inactive group); this was more than double the proportion in education or training at time of entry (four per cent).
In terms of individual-level transitions, just over a quarter (26 per cent) of leavers had remained in employment, and a similar proportion (27 per cent) had moved into employment (three per cent had become inactive, one per cent were unemployed). More than two-fifths (43 per cent) of all participants remained unemployed or inactive. More than half of YEI participants (55 per cent) remained unemployed or inactive at six months compared to 42 per cent of ESF participants, yet more than two-fifths (44 per cent) under YEI moved into employment. In contrast ESF participants were much more likely to have been employed at the start of the programme, with 28 per cent remaining employed at six month and four per cent moving out of employment (compared to a negligible proportion of YEI). A quarter of ESF participants (26 per cent) moved into employment.
Type of employment
The proportions of leavers working for employer, self-employed or on an apprenticeship were largely unchanged compared to programme entry.
In terms of type of employment at six months versus programme entry, there was a very small rise in part-time employment (from 25 per cent to 28 per cent). Correspondingly, the proportion of participants underemployed rose modestly from nine per cent to 12 per cent.
Precarious employment for an employee – i.e. temporary employment or that with a work contract of limited duration - was more common at six months than on entry; 21 per cent compared to 14 per cent at programme entry were in precarious employment.
In-work outcomes
Among leavers that were employed on entry and at the 6-month point, around two-fifths (39 per cent) of participants reported being given more responsibility, a slightly lower proportion (36 per cent) reported a requirement for higher skills or competencies in their role, and almost a quarter (23 per cent) required a higher level of qualification.
Employed participants reported a range of other benefits or improvements to their job prospects compared to their situation on entering the programme. More than half of leavers had more opportunities for training (65 per cent), more job satisfaction (60 per cent), improved future pay and promotion prospects (57 per cent) and job security (52 per cent). Just under half (45 per cent) said they have received an hourly or annual pay rise over the six month period.
Individuals with improved labour market situations six months after leaving their course were more satisfied with their experience than those without (90 per cent compared to 85 per cent), although the vast majority of individuals without these improvements were still satisfied.
Conclusions (Chapter 5)
Some of the main conclusions that can be drawn from this research are that:
- The ESF programme reached many people who faced labour market disadvantage.
- For many of those assisted, unemployment was an entrenched position.
- Provision was received very positively and views were consistently positive across Investment Priority and CFO.
- Support with childcare or other care was not widespread.
- Improvements in soft-skills as a result of receiving ESF provision were widely reported.
- Participation appears to have greatly increased optimism about finding employment.
- Half of YEI leavers received a job offer in the six months following provision.
- Job outcomes across the ESF programme were quite common and experienced by a range of leavers.
- The job outcome rate was comparable across all CFOs focussing on employability support (HMPPS, DWP and NLCF) and Direct Providers.
- Nearly all of those who received in-work support were still in employment 6 months later, a large minority reported progress at 6 months and nearly all reported improved prospects for the future.
- Most leavers were satisfied with their provision; satisfaction was highest among those who were employed in entry.
- Positive employment outcomes should decrease welfare claimants, indeed the proportion of DWP participants claiming benefits reduced by a quarter between entry to provision and six months later.
- There was a slightly unexpected shift of some participants from being unemployed at the start of provision to being economically inactive 6 months after leaving; this happened for a third of participants unemployed on provision entry. Most commonly, these leavers were in education or training, or unable to work because of health at six months.
It is not possible for this research to definitively state whether these improvements in job situations would have happened without the receipt of provision funded through ESF. However other research is being conducted using administrative datasets to provide a counterfactual and will provide greater understanding of the impact of provision.
1. Introduction
The European Social Fund
The European Social Fund (ESF) was set up to improve employment opportunities in the European Union (EU) and thereby raise standards of living.
The European Social Fund (ESF) 2014-20 Operational Programme is part of the European Structural and Investment Funds (ESIF)[footnote 4] Growth Programme for England in 2014-2020. Its aim is to deliver the programme’s priorities to increase labour market participation, promote social inclusion and develop the skills of the potential and existing workforce, helping individuals fulfil their potential. Through the Youth Employment Initiative (YEI) it also contributes to improving youth employment in areas with higher rates of youth unemployment by providing support for harder to reach NEET (not in employment, education or training) young people.
Objectives of the fund
The ESF is intended to promote the Europe 2020 objectives for smart, sustainable and inclusive growth, with a primary focus on the latter[footnote 5]. Specifically, achievement targets related to employment, education and poverty reduction:
- Employment: 75% of the population aged 20-64 should be in employment. Aiming to raise to 75% the employment rate for women and men aged 20-64, through the greater participation of young people, older workers and low-skilled workers and the better integration of legal migrants.
- Social inclusion: 20 million less people across the EU should be at risk of poverty.
- Education: Improving education levels, in particular by aiming to reduce school drop-out rates to less than 10 per cent and by increasing the share of 30-34 years old having completed tertiary or equivalent education to at least 40%.
It also sought to contribute to the achievement of the relevant parts of the 2017 Country Specific Recommendations (CSRs) which are:
- Address skills mismatches, provide for skills progression, including continuing to strengthen the quality of apprenticeships and providing for other funded “Further Education” progression routes
Investment Priorities
Underpinning the 2014-20 ESF Programme are 3 ‘priority axes’, namely:
- Priority Axis 1: Inclusive Labour Markets, which combines activities to address employment and social inclusion issues
- Priority Axis 2: Skills for Growth
- Priority Axis 3: Technical Assistance \and 2. Priority Axis 1 addresses two ‘thematic objectives’:
- Thematic Objective 8: Promoting sustainable and quality employment and supporting labour mobility
- Thematic Objective 9: Promoting social inclusion, combating poverty and any discrimination
While Priority Axis 2 addresses one thematic objective:
- Thematic Objective 10: Investing in education, training and vocational training for skills and life-long learning
Table 1.1 below provides further detail on the Thematic Objectives and Investment Priorities chosen from the regulations which make up Priority Axis 1 and 2.
Within these priorities, certain audiences were identified for the Operational Programme to focus on; these are groups who face relative disadvantages in the labour market:
- people who were unemployed or economically inactive, especially disadvantaged groups such as people with disabilities, lone parents, older workers and ethnic minorities;
- women returners and other groups of women outside the labour market;
- young unemployed people, and especially those not in education, employment or training (NEET);
- people who lack basic skills, whether unemployed or already in the workforce.
Table 1.1 ESF Priority Axis and Investment Priorities
| Priority Axis | Thematic Objective | Investment Priority |
|---|---|---|
| 1 | 8 | 1.1 (8i): Access to employment for jobseekers and inactive people, including the long term unemployed and people far from the labour market, also through local employment initiatives and support for labour mobility |
| 1 | 8 | 1.2 (8ii ESF): Sustainable integration into the labour market of young people (ESF) in particular those not in employment, education or training (NEET), including young people at risk of social exclusion and young people from marginalised communities, including through the implementation of the Youth Guarantee. |
| 1 | 8 | 1.3 (8ii YEI): Sustainable integration into the labour market of young people (YEI) in particular those not in employment, education or training, including young people at risk of social exclusion and young people from marginalised communities, including through the implementation of the Youth Guarantee. |
| 1 | 9 | 1.4 (9i): Active inclusion, including with a view to promoting equal opportunities and active participation, and improving employability. |
| 2 | 10 | 2.1 (10iii): Enhancing equal access to lifelong learning for all age groups in formal, non-formal and informal settings, upgrading the knowledge, skills and competences of the workforce, and promoting flexible learning pathways including through career guidance and validation of acquired competences. |
Youth Employment Initiative
The Youth Employment Initiative (YEI) is one of the main EU financial resources to support Youth Guarantee schemes[footnote 6]. The initiative was launched to provide support living in regions where youth unemployment was higher than 25 per cent. It ensures that in parts of Europe where the challenges are most acute, young people can receive targeted support.
Participants in YEI provision had to be NEET (not in employment, education or training), aged 15 to 29 and reside in an area eligible for the initiative.
Through England’s ESF Operational Programme (OP), flexibility to deliver YEI support to those aged up to 29 was provided to areas eligible for YEI funding. Eligible areas are determined at the level of Nomenclature of Units for Territorial Statistics (NUTS) areas, NUTS being a standard developed and regulated by the EU in order to reference the sub-division of countries for statistical purposes. There are four NUTS 2 regions in England eligible for YEI funding: Inner London, Merseyside, Tees Valley & Durham, and West Midlands. In addition, the following NUTS3 areas are eligible: Leicester, Nottingham, Kingston upon Hull, and Thurrock.
Typically, YEI support includes access to apprenticeships, traineeships, job placements and further education, amongst other employability assistance combined with wrap around[footnote 7] support for participants.
Co-financing organisations
The DWP has had overall responsibility for ESF funds in England 2007-20, and manages the England ESF programme at a national level.
ESF funds are distributed through ‘co-financing organisations’ (CFOs); public bodies which bring together ESF and domestic funding for employment and skills so that ESF complements national programmes.
Provision for the 2014-2020 Operational Programme was delivered through 4 co-financing organisations, the Education and Skills Funding Agency (ESFA), DWP, National Lottery Community Fund (formerly Big Lottery Fund); Her Majesty’s Prison and Probation Services (HMPPS, replacement of National Offender Management Service or ‘NOMS’), as well as direct providers.
Types of provision
The provision on these courses/training programs can vary considerably. Some participants completed a course or studied towards a certificate in something work-related. Some did courses in English, maths or computer skills or had had training in how to look for work. Others received mentoring, coaching or other personalised support in work-related activities.
Research objectives
As part of the ESF 2014-20 Operational Programme, the DWP (as Managing Authority) was required to monitor and evaluate the programme. As part of meeting this requirement, the DWP commissioned IFF Research to conduct a study exploring the experiences of people in England who had recently left work-related training courses funded through the ESF, including the Youth Employment Initiative (YEI).
The main research aims were to:
1. To collect information about participants’ situation six months after they had left ESF provision; the 6-month point is key because it is on activities at this point that most of the ESF long-term indicators are based[footnote 8].
2. To measure the effectiveness of ESF and YEI for example through hard outcomes, such as employment situation, job progression etc., as well as participants’ perception of their own development (skills learned etc.).
3. To produce data on the experience and effectiveness of ESF and YEI, including participants’ perspectives. This will be used to inform ESF and YEI evaluations on effectiveness, efficiency and impact.
In addition to meeting requirements to evaluate the impact and effectiveness of the current ESF programme, the results will help the UK Government to decide which types of work-related training courses to fund in the future after exit from the European Union, and to improve the services they provide.
The research is part of a wider evaluation programme to provide robust evidence of the impact of the 2014-2020 ESF in England and generate evidence about what works and why, in helping disadvantaged groups and those furthest from the labour market to move closer to it, gain sustainable employment, attain skills and progress in-employment. Other sources of evidence include counterfactual analysis and qualitative case study work, and potential Cost Benefit Analysis
Methodology
The research involved a large-scale quantitative survey with participants who had left the ESF provision between December 2015 and December 2018, and YEI provision between December 2015 and May 2019. Interviews were conducted by computer assisted telephone interviewing (CATI).
The research also involved a follow-up survey among a subset of YEI leavers – individuals who were in employment six months after completing their provision. The purpose of this survey was to explore what individuals were doing 12 months post-provision. Findings for this research element are not explored in this report, but an overview is provided in Appendix B.
This section provides an overview of key sample and methodology information, further detail can be found in the Technical Appendix (Appendix A).
Sampling
All ESF and YEI providers were required to record and routinely share individual participant contact details with the DWP to support monitoring and evaluation. Following a matching process, sample was then transferred from the DWP to IFF Research.
A total of ten sample batches were transferred to IFF covering the pilot stage and 9 subsequent survey waves. Sample was cleaned and records removed if any of the following applied:
- No address (as unsuitable for mailout)
- No phone number
- Repeat leaver (i.e. included in a previous sample batch due to completion of earlier provision) or duplication within the same batch
- Leave date too early or too late
Beyond cleaning, sample selection was only applied to waves 8 and 9; a census approach was used for all other waves due to low sample volumes at these stages. For Wave 8, sample was only selected if it applied to an investment priority in which interview targets had not been met. Wave 9 consisted of YEI leavers only.
Further information on sample transfers and cleaning can be found in the Technical Appendix (Appendix A).
Table 1.2 provides detail on sample volumes received and used for each wave.
Table 1.2 Overview of sample received and starting sample, by wave[footnote 9]
| Wave | Sample supplied | Starting sample | % of sample supplied used |
|---|---|---|---|
| Pilot | 1,143 | 183 | 16 |
| Wave 1 | 1,338 | 505 | 38 |
| Wave 2 | 1,836 | 1,321 | 72 |
| Wave 3 | 2,806 | 1,462 | 52 |
| Wave 4 | 5,819 | 1,982 | 34 |
| Wave 5 | 5,751 | 1,548 | 27 |
| Wave 6 | 6,533 | 1,340 | 21 |
| Wave 7 | 84,865 | 56,696 | 67 |
| Wave 8 | 229,136 | 22,022 | 10 |
| Wave 9* | 705 | 359 | 51 |
| Total | 339,932 | 87,418 | 26 |
*Wave 9 consisted of YEI leavers only
All useable sample was sent an introductory letter two weeks in advance of fieldwork starting to notify them of the research, its objectives, and giving them an opportunity to opt out via email or by leaving a voicemail message.
Questionnaire design
The questionnaire was designed to address the research objectives and collect the necessary indicator data across the priorities. Table 1.2 provides an overview of questionnaire coverage, the full questionnaire is presented in Appendix C.
| Section | Coverage of questions |
|---|---|
| Screener | Introducing the survey and confirming eligibility. |
| Section A: Status when started course | What the main activity of the participant was immediately before starting their provision. Details of employment, unemployment, qualification and skills, and benefits claimed (for DWP provision) were also collected. |
| Section B: Experience of the course | Participant support needs (child and other carer responsibilities, disability) and assistance, work-related skills and support gained, and satisfaction with the provision. For YEI leavers, details of traineeships. |
| Section C: Status six months after completing course | What participants were doing six months after completing their provision; details on employment, unemployment, qualification and skills, and benefits claimed (for DWP provision) were also collected. |
| Section D: YEI leavers | Job offers and opportunities in the six months following provision completion, among YEI leavers only. |
| Section E: Demographics information | Capturing information on living situation, six and gender, age, ethnicity, long-term limiting illness (LTLI), and sexual orientation. |
| Section F: Recontact questions | Whether participants are willing for their responses to be linked to other DWP held administrative records. For YEI leavers in employment at 6-month point, whether they are willing to be to be called back for a 12-month point survey[footnote 10] |
The questionnaire was tested through piloting and cognitive testing between Thursday 16th February 2017 and Tuesday 28th February 2017. Pilot interviews were completing with 24 individuals, and 19 of these participants went on to take part in a cognitive interview to check engagement, relevance and ease of understanding of the survey.
Fieldwork
Mainstage fieldwork took place across nine waves between March 2017 and January 2020. In total, 19,769 interviews were completed with ESF and YEI leavers across the pilot and mainstage, with an average conversion rate of 23 per cent.
Table 1.3 provides breakdown of the fieldwork dates, starting sample, number completes and conversion rates for each wave.
Table 1.4 Fieldwork dates, volumes and conversation rates by wave
| Wave | Fieldwork dates | Starting sample | Number of completes | Conversion rate (%) |
|---|---|---|---|---|
| Pilot | 16/02/17 – 22/02/17 | 183 | 24 | 13 |
| Wave 1 | 28/03/17 – 27/04/17 | 505 | 90 | 18 |
| Wave 2 | 04/07/17 – 27/08/17 | 1,321 | 324 | 25 |
| Wave 3 | 18/10/17 – 07/12/17 | 1,462 | 310 | 21 |
| Wave 4 | 26/01/18 – 27/03/18 | 1,982 | 283 | 14 |
| Wave 5 | 08/05/18 – 09/06/18 | 1,548 | 203 | 13 |
| Wave 6 | 23/07/18 – 17/09/18 | 1,340 | 201 | 15 |
| Wave 7 | 26/11/18 – 01/05/19 | 56,013 | 14,748 | 26 |
| Wave 8 | 15/07/19 – 31/10/19 | 21,051 | 3,479 | 17 |
| Wave 9 | 06/01/20 – 31/01/20 | 359 | 107 | 30 |
| Total | 86,474 | 19,769 | 23 |
Table 1.4 shows the breakdown of sample and interview volumes, conversion rates and proportions of all completes by key subgroups. Due to participant and sample volumes, the vast majority of interviews were with ESF leavers (YEI and ESF leavers had similar response rates).
IP 1.1 accounted for the largest proportion of survey completes, followed by IP 2.1.
By CFO, the ESFA account for nearly three-quarters of sample completes due to participant and sample volumes. Unsurprisingly, HMPPS sample produced the lowest conversion rate; contact information was more likely to be invalid / out of date as many of these individuals had changed address etc. on leaving prison or their subsequent accommodation.
Table 1.5 Sample and interview volumes and response rates, by sample type, IP and CFO
| Subject | Starting sample (n) | Interviews achieved | Conversion rate (%) | % of all completes |
|---|---|---|---|---|
| Sample type (st) YEI leavers | 10,054 | 2,213 | 22 | 11 |
| st ESF leavers | 77,364 | 17,556 | 23 | 89 |
| Investment Priority (IP) 1.1 (8i) | 24,646 | 7,387 | 30 | 37 |
| IP 1.2 (8ii ESF) | 13,024 | 2,177 | 17 | 11 |
| IP 1.3 (8ii YEI) | 10,054 | 2,213 | 22 | 11 |
| IP 1.4 (9i) | 11,241 | 2,048 | 18 | 10 |
| IP 2.1 (10iii) | 28,453 | 5,944 | 21 | 30 |
| CFO HMPPS | 4,160 | 286 | 7 | 1 |
| CFO DWP | 4,097 | 1,712 | 42 | 9 |
| CFO Direct provider | 13,735 | 3,151 | 23 | 16 |
| CFO NLCF | 1,345 | 399 | 30 | 2 |
| CFO ESFA | 64,081 | 14,221 | 22 | 72 |
Structure of the report
The remaining report chapters are structured as follows:
- Chapter 2 introduces the population profile, including the breakdown and interplay between sample type, demographics, investment priority and CFO. It also looks at the status of individuals on entry to provision in terms of demographics, employment, skills level and benefits claimed.
- Chapter 3 looks at experiences of the provision, including assistance for those with support needs, work-related skills gained and support/guidance provided, and overall satisfaction with the provision.
- Chapter 4 looks at what leavers are doing at the 6-point point and how this compares to what they were doing on entry to the programme. It identifies who had an improved labour market situation, as well as details of employment and training/education.
- Chapter 5 explores the job opportunities experienced by YEI leavers since leaving provision, including perceived quality and requirements for job roles offered.
- Chapter 6 provides conclusions.
- Appendix A is the Technical Appendix.
- Appendix B contains an overview (purpose, response rates) of the YEI leaver follow-up survey.
- Appendix C contains the full questionnaire.
- Appendix D contains the list of Direct Providers.
Reporting conventions
Unless otherwise stated, all differences commented on in this report are significant at the 95 per cent confidence level, meaning that we can be 95 per cent confident that a reported difference is a real one, as opposed to one resulting from the fact that we conducted a survey rather than a census of participants.
Data are not presented where unweighted base sizes are less than 50. In particular, this reduces the scope for YEI subgroup comparisons for some questions.
Differences by CFO have been highlighted throughout this report. However, any comparisons made in this way should be considered in the context of the varying nature of the provision delivered by the individual CFOs.
In the tables, the following conventions apply:
- ‘0’ zero
- ‘*’ greater than zero but less than 0.5 per cent
- ‘[x]’ figure to be treated with caution as base size less than 50
2. Demographics and status upon entry to provision
Understanding the population profile of leavers and the interplay between different groups is important when interpreting findings. This chapter explores characteristics of the population, for individuals who left provision in the relevant timeframe for this survey. This includes breakdowns by key groups (investment priority, CFO), demographics, and economic status on entry to the programme.
Chapter summary
ESF leavers (rather than YEI leavers) make up the vast majority of the population.
Leavers were most likely to fall under investment priorities (IPs) 1.1 and 2.1, and the Education & Skills Funding Agency CFO. CFOs focus on a particular IP or IPs; for example, HMPPS and National Lottery Community Lottery Fund are entirely focused on IP 1.4. In turn, there are demographic differences within IP, for example IPS 1.2 and 1.3 target younger people and all leavers were under 30 on entry, while participants from other IPs tended to be over 30. IP 2.1 had a notably lower proportion of disabled and/or disadvantaged leavers compared to other IPs.
Almost all YEI participants were either inactive or unemployed on entry to the programme, while three in ten ESF participants were in employment. As with demographics, there were patterns by IP in relation to economic status on entry, largely in line with the target audiences for each. The vast majority of IP 2.1 participants were employed on entry, in line with the priority’s objective to address the basic skills and increase the skills levels of individuals in work; this group make up the majority of individuals employed.
Disadvantaged individuals and those with a disability or long-term health condition showed lower rates of employment on entry and were more likely to be long-term unemployed than individuals without these characteristics.
The vast majority of participants in work on entry were “fully employed”, i.e. they were working full time or were working part-time and did not want to be working full time. Work tended to be paid and for an employer. Around two-thirds of these individuals working for an employer were in stable employment. Around half of unemployed individuals met the criteria for long-term unemployment.
2016-2018 population
MI showed that approximately 560,000 individuals completed ESF provision between December 2015 and December 2018, and just under 50,000 individuals completed a YEI provision between December 2015 and June 2019[footnote 11], as shown in Table 2.1.
Overall, Investment Priorities (IPs) 1.1 and 2.1 accounted for the greatest proportion of leavers. ESFA is by far the most prominent co-financing organisation (CFO), accounting for nearly three-quarters (72 per cent) of the population.
Table 2.1 Volume of leavers between December 2015 and June 2019, by IP and CFO
| Co-financing organisation | Total number of leavers | Proportion of population (%) |
|---|---|---|
| Total | 609,972 | |
| ESF leavers | 560,208 | 92 |
| YEI leavers | 49,764 | 8 |
| Investment Priority 1.1 | 203,150 | 33 |
| Investment Priority 1.2 | 70,016 | 12 |
| Investment Priority 1.3 (YEI) | 49,764 | 8 |
| Investment Priority 1.4 | 114,417 | 19 |
| Investment Priority 2.1 | 172,625 | 28 |
| HMPPS | 24,046 | 4 |
| DWP | 49,006 | 8 |
| Direct Provider | 80,756 | 13 |
| NLCF | 19,299 | 3 |
| ESFA | 436,865 | 72 |
As shown in Figure 2.1, some CFOs are focused on particular IPs; for example, HMPPS and NLCF are entirely focused on IP 1.4 while the vast majority of DWP leavers fall into IP 1.1.
This means that many of the findings by CFO are likely to be related to differences by IP and their target audiences (demographic breakdowns by IP are explored in the next section of this chapter).
Figure 2.1 Investment Priority breakdown within CFO
| CFO | Base (All leavers) | IP 1.1 – % | IP 1.2 – % | IP 1.3 – % | IP 1.4 – % | IP 2.1 – % |
|---|---|---|---|---|---|---|
| All leavers | 19,769 | 33% | 11% | 8% | 19% | 28% |
| HMPPS | 286 | 0% | 0% | 0% | 100% | 0% |
| DWP | 1,712 | 90% | 0% | 0% | 10% | 0% |
| Direct | 3,151 | 15% | 7% | 62% | 15% | 2% |
| NLCF | 399 | 0% | 0% | 0% | 100% | 0% |
| ESFA | 14,221 | 34% | 15% | 0% | 12% | 39% |
Base: All leavers (as shown)
Participant demographics
Table 2.2 presents the demographic breakdown of participants. Both overall and for ESF only and YEI only, participants were more likely to be male.
The most prominent difference between ESF only and YEI only participants was by age, largely due to age (being under 30) being a qualifying characteristic for YEI funded course/programme. As such, no YEI participants were over 30, while the majority of ESF participants were (60 per cent).
Although the majority for both, there was a slightly higher proportion of white participants among ESF participants (78 per cent compared to 73 per cent).
Table 2.2 Participant demographics, by sample type
| Sample type | All | ESF only | YEI only |
|---|---|---|---|
| Gender | |||
| Male | 58% | 58% | 60% |
| Female | 42% | 42% | 40% |
| Age on entry | |||
| 15 - 17 | 8% | 7% | 18% |
| 18 - 24 | 26% | 22% | 64% |
| 25 - 29 | 12% | 11% | 18% |
| 30-54 | 45% | 49% | 0% |
| 55+ | 10% | 11% | 0% |
| Ethnicity | |||
| White | 78% | 78% | 73% |
| BAME | 22% | 22% | 27% |
| Base | 19,769 | 17,556 | 2,213 |
Around two-thirds of the population (65 per cent) were disadvantaged; this was more common for YEI participants (73 per cent compared to 64 per cent ESF only). Individuals were classified as disadvantaged participants[footnote 12] if they:
- Lived in a ‘jobless household’[footnote 13];
- Were a single adult household with dependent children;
- Had no formal qualifications;
- Lacked basic skills[footnote 14];
- Were homeless/living in a hostel at start of provision;
- Were an ethnic minority; or
- Had drug or alcohol dependency at start of provision.
Two-fifths (37 per cent) had a disability or long-term health condition, although this was slightly less common among YEI participants (33 per cent compared to 37 ESF only).
Demographics by IP
There were some notable demographic differences by IP, most markedly by age, disadvantage and disability. All demographic differences are explored below.
Participants from IP 1.4 were more likely to be male (73 per cent) compared to all other IPs, while IPs 1.1 and 2.1 had the highest proportions of female participants (47 and 48 per cent, respectively).
Figure 2.2 IP by gender
| IP | Base (All leavers) | Male | Female |
|---|---|---|---|
| 1.1 | 7,387 | 53% | 47% |
| 1.2 | 2,177 | 60% | 40% |
| 1.3 | 2,213 | 60% | 40% |
| 1.4 | 2,048 | 73% | 27% |
| 2.1 | 5,944 | 52% | 48% |
In line with their target audiences, leavers in IPs 1.2 and 1.3 were all aged under 30 years old on entry to the programme. The majority of participants in IPs 1.1, 1.4 and 2.1 were over 30 years old.
Figure 2.3 IP by age
| IP | Base (All leavers) | 15-17 | 18-24 | 25-29 | 30-54 | 55+ |
|---|---|---|---|---|---|---|
| 1.1 | 7,387 | 2% | 20% | 12% | 51% | 15% |
| 1.2 | 2,177 | 49% | 51% | 0% | 0% | 0% |
| 1.3 | 2,213 | 18% | 64% | 18% | 0% | 0% |
| 1.4 | 2,048 | 1% | 18% | 13% | 59% | 9% |
| 2.1 | 5,944 | 1% | 16% | 13% | 59% | 11% |
More than a quarter of participants in IPs 1.1-1.3 were BAME, compared to fewer than one in five in IPs 1.4 and 2.1.
Figure 2.4 IP by ethnicity
| IP | Base (All leavers) | White | BME |
|---|---|---|---|
| 1.1 | 7,387 | 74% | 26% |
| 1.2 | 2,177 | 75% | 25% |
| 1.3 | 2,213 | 73% | 27% |
| 1.4 | 2,048 | 81% | 19% |
| 2.1 | 5,944 | 82% | 17% |
Participants in IP 2.1 were less likely than those in all other IPs to have a disability or long-term health condition or be disadvantaged (15 and 41 per cent). Conversely, those in IPs 1.1 and 1.4 had relatively high proportions of both.
Figure 2.5 Disability and disadvantaged within IP
| IP | Base (All leavers) | Disadvantaged | Disability |
|---|---|---|---|
| 1.1 | 7,387 | 79% | 48% |
| 1.2 | 2,177 | 62% | 35% |
| 1.3 | 2,213 | 73% | 33% |
| 1.4 | 2,048 | 72% | 54% |
| 2.1 | 5,944 | 41% | 15% |
Labour market characteristics
Just over half (56 per cent) of participants were unemployed and looking for work and 15 per cent were economically inactive on entry to the programme. Nearly one-third (29 per cent) were in employment.
In line with the provision’s focus on NEET individuals, a higher proportion of YEI participants – just over one-fifth (21 per cent) – were inactive on entry to their course/programme, and almost all others[footnote 15] were unemployed (78 per cent).
Entry status varied across IP and CFO, which one might expect given the different target audiences, themes and intended support provided under each.
The vast majority (92 per cent) of IP 2.1 participants were employed on entry, in line with the priority’s objective to address the basic skills and increase the skills levels of individuals in work; this group made up the majority of individuals employed. One in five (20 per cent) of participants under IP 1.2 were also employed on entry; employment rates across all other IPs were extremely low.
Owing to the CFO spanning all investment priorities and having a large proportion of participants under IP 2.1, the ESFA was the only CFO with a considerable proportion of participants employed on entry (40 per cent). HMPPS and DWP participants were the most likely to be economically inactive on programme entry (35 per cent and 34 per cent).
Figure 2.6 Employment status on programme entry, by sample type, Investment Priority and CFO
| Subject | Base (All leavers) | Inactive | Unemployed | In employment |
|---|---|---|---|---|
| Sample type (st) YEI only | 2,213 | 21% | 78% | 1% |
| st ESF only | 17,556 | 14% | 54% | 32% |
| Investment Priority (IP) 1.1 | 7,387 | 15% | 84% | 2% |
| IP 1.2 | 2,177 | 26% | 54% | 20% |
| IP 1.3 | 2,213 | 21% | 78% | 1% |
| IP 1.4 | 2,048 | 23% | 76% | 1% |
| OIP 2.1 | 5,944 | 3% | 6% | 92% |
| CFO HMPPS | 286 | 35% | 64% | 1% |
| CFO DWP | 1,712 | 34% | 65% | 1% |
| CFO Direct | 3,151 | 26% | 70% | 4% |
| CFO NLCF | 399 | 28% | 71% | 1% |
| CFO ESFA | 14,221 | 9% | 51% | 40% |
| All leavers | 19,769 | 15% | 56% | 29% |
There were some entry status differences by key demographics:
- Gender: Men were more likely than women to be unemployed (60 per cent compared to 51 per cent), with a higher proportion of women in employment (33 per cent versus 26 per cent).
- Age: As might be expected, 15-17 year-olds were more likely than all other age groups to be inactive (42 per cent).
- Category of Region[footnote 16] The proportion of participants from less developed regions in employment was more than double that of participants from transitional or more developed regions (64 per cent versus 31 and 28 per cent).
- Disadvantaged: Disadvantaged participants were far less likely to be employed on entry (18 per cent versus 50 per cent not disadvantaged).
- Disability: One in nine participants (11 per cent) with a disability or long-term health condition were employed on entry, compared to two-fifths (40 per cent) of participants without.
- Ethnicity: White participants were more likely to be employed than their BAME counterparts (31 per cent compared to 22 per cent).
Overall, four per cent of participants were in training or education on entry to the programme. Most of these individuals were in college (56 per cent), typically full time (45 per cent of all in education). Just under one-third (31 per cent) were in school.
Employed on entry[footnote 17]
More than four-fifths (82 per cent) of participants who were employed on entry were working for an employer in a paid role. One in ten (10 per cent) were self-employed.
A small minority – six per cent – were employed as an apprentice; this increased to half (50 per cent) among participants aged 15-17.
Around three-quarters (74 per cent) of all employed participants were working full time. Men were more likely to be working full time (84 per cent compared to 63 per cent of women). The vast majority (90 per cent) of participants in work on entry were “fully employed”, i.e. they were working full time or working part-time and did not want to be working full time.
As shown in Figure 2.7, nearly two-thirds (65 per cent) of individuals working for an employer were doing so in ‘stable employment’, i.e. they were on a permanent or open-ended contract. Around one in five (21%) were in precarious employment and 13 per cent were in employment of unknown stability. Likelihood of being in stable employment increased with age, from 51 per cent among 15-17 to 80 per cent for 55+.
Figure 2.7 Hours worked, type of employment and employment contracts – this figure is made up of 3 charts
Type of employment contract
| Type | Percentage |
|---|---|
| Stable employment | 65% |
| Precarious employment | 21% |
| Unknown stability | 13% |
Base (All in employment except self-employed on entry) – 9,671
Type of employment
| Type | Percentage |
|---|---|
| Self-employed | 9% |
| Employer in paid role | 86% |
| Apprenticeship | 5% |
Base (All in employment at six months) – 10,595
Hours working
| Hours | Percentage |
|---|---|
| Full-time | 72% |
| Part-time | 28% |
| Unknown | 1% |
Base (All in employment at six months) – 10,595
Unemployed but looking for work on entry
Around half of unemployed participants (53 per cent) had been out of paid employment and looking for work for at least six months when they started the programme, with two-fifths (39 per cent) looking for at least a year. Eight per cent had never had a job.
Overall, just over half (52 per cent) of unemployed individuals were long-term unemployed, meaning they were either under the age of 25 and had been looking for work for at least 6 months or over the age of 25 and had been looking for work for 12 months. Long-term unemployment was slightly less common among YEI only participants (50 per cent).
Among those unemployed, women were slightly more likely to have been long-term unemployed on entry (55 per cent compared to 50 per cent of men).
As well as showing lower rates of employment overall, among those unemployed disadvantaged individuals and those with a disability or long-term health condition were more likely to be long-term unemployed than individuals without these characteristics (55 versus 44 per cent and 61 versus 45 per cent, respectively), demonstrating the difficulties these participants face gaining employment.
Barriers to work
The majority (85 per cent) of participants unemployed on entry cited a prospect- or logistic-related barrier to work. As shown in Figure 2.8, lack of recent working experience and/or availability of jobs were the most common prospect-related barriers to work, both cited by nearly half (48 per cent) of all unemployed participants. Concern around lack of recent experience was more common among YEI participants (59 per cent versus 47 per cent ESF only).
Figure 2.8 Prospect – and logistical barriers to work for the unemployed
| Barriers | YEI only | ESF only | All |
|---|---|---|---|
| Issues with citizenship/visa status | 1% | 2% | 2% |
| Alcohol/drugs dependency | 2% | 4% | 3% |
| Criminal convictions | 4% | 9% | 9% |
| Caring responsibilities | 14% | 18% | 18% |
| Problems with transport or the cost of transport | 32% | 31% | 31% |
| Didn’t have right qualifications or skills | 40% | 40% | 40% |
| Few jobs available where you lived | 49% | 47% | 48% |
| Lack of recent experience of working | 59% | 47% | 48% |
| None of the above | 12% | 15% | 14% |
Base: All unemployed: YEI only – 1,706, ESF only – 9,374, All – 11,080
Barriers related to personal characteristics were less common overall, with just under half (49 per cent) of unemployed individuals facing no barriers in this regard. This proportion was higher among YEI participants (64 per cent). Reasons such as disability/problems with health or age were far more prominent among ESF participants, as shown in Figure 2.9.
Figure 2.9 Personal characteristic barriers to work for the unemployed
| Barrier | YEI only | ESF only | All |
|---|---|---|---|
| Your gender (including gender reassignment) counted against you | 1% | 2% | 2% |
| Your religion or belief counted against you | 1% | 2% | 2% |
| Your sexual orientation counted against you | 1% | 1% | 1% |
| Your ethnicity or race counted against you | 2% | 4% | 3% |
| You were pregnant or had a young baby | 5% | 4% | 4% |
| Your age counted against you | 15% | 24% | 23% |
| You had a disability or problems with your health | 18% | 31% | 30% |
| None of the above | 64% | 49% | 51% |
Base: All unemployed: YEI only – 1,706, ESF only – 9,374, All – 11,080
Benefits claimed on entry
Just over four-fifths (83 per cent) participants on DWP CFO provision were on state benefits on entry. This proportion was higher among:
- IP 1.4 (92 per cent compared to 82 per cent in IP 1.2);
- Disadvantaged participants (85 per cent compared to 76 per cent not);
- Individuals with a long-term health condition or disability (85 per cent compared to 76 per cent without)
Most commonly, DWP participants were claiming Jobseeker’s Allowance (50 per cent of all entering DWP provision). Employment Support Allowance and Universal Credit were also relatively common (15 and 12 per cent, respectively).
Figure 2.10 Benefits claimed on entry, among DWP leavers
| Benefits | At entry |
|---|---|
| Don’t know | 2% |
| Other | 0% |
| Council Tax Benefit | 0% |
| Carers Allowance | 0% |
| Child Benefit | 1% |
| Housing Benefit | 2% |
| Incapacity Benefit | 2% |
| Tax Credit | 2% |
| Personal Independence Payment (PIP) | 3% |
| Income Support | 4% |
| Disability Living Allowance (DLA) | 4% |
| Universal Credit | 12% |
| Employment and Support Allowance (ESA) | 15% |
| Jobseeker’s Allowance | 50% |
Base (All DWP leavers) 1,712
3. Course/programme experience
This chapter presents findings on how leavers found the course/programme they attended. It explores views on provision guidance and relevance, and its impact on work-related skills. It also presents findings for individuals with specific support needs, i.e. leavers who had childcare or other caring responsibilities, and those with a long-term health condition; whether these needs were supported and experience in this regard. The chapter concludes with a focus on the traineeship experiences among YEI leavers.
Chapter summary
Views on the provision were generally very positive. Most leavers were satisfied with the information provided about and as part of their provision, and felt the provision was relevant to their specific needs. More than three-quarters of leavers felt courses/programmes were pitched at the right level of difficulty and were about the right length.
Leavers tended to report positive impacts of the provision on job prospects. The vast majority of participants who were employed on entry to the provision felt it had helped them in the work environment, while a similar proportion of unemployed participants felt it had helped move them into or nearer to employment.
BAME, disadvantaged leavers and leavers with a long-term health condition were more likely to receive job search advice/guidance, but BAME leavers were the only group among these to be more likely to cite related benefits (such as improved self-confidence and communication skills) as a result.
Younger participants were also more likely to have received job search advice/support through the provision and report work-related benefits. IPs focused on younger participants (IP 2.1 and IP 1.3) showed similar patterns.
Participants with caring responsibilities (for a child or otherwise) were rarely offered support or assistance in this regard through their provider. Offers and uptake of support was more common among participants with a long-term health condition or disability. Regardless of support need, the vast majority of individuals who received assistance were satisfied with the support, and around three-quarters felt they would have faced difficulties attending the provision without it.
Views on the programme
Course/programme design
Guidance and relevance
Programme leavers were broadly satisfied with guidance for and relevance of their provision. Specifically, around nine in ten were satisfied with the information and guidance they received on what would be delivered through the programme (88 per cent), the feedback and guidance they received during the programmes (87 per cent), and the relevance of the programme to their specific needs (86 per cent).
Except for YEI leavers being slightly more satisfied with the relevance of the programme (88 per cent compared to 85 per cent of ESF leavers), satisfaction was broadly aligned between these two groups (see Figure 3.1).
As shown in Figure 3.1, leavers in IP 2.1 were more likely to be satisfied with all guidance and relevance, while those in IP 1.1 and 1.4 showed lower satisfaction than average. By CFO, DWP participants showed lower levels of satisfaction for all three questions relating to guidance and support.
Figure 3.1 Proportion satisfied with programme aspects by sample type, IP and CFO
| Subject | All leavers | Satisfied with relevance of support | Satisfied with feedback/guidance during programme | Satisfied with guidance/info on what will be delivered |
|---|---|---|---|---|
| Sample type (st) YEI only | 2,213 | 88% | 87% | 89% |
| st ESF only | 17,556 | 85% | 87% | 88% |
| st All leavers | 19,769 | 86% | 87% | 88% |
| Investment Priority (IP) 1.1 | 7,387 | 82% | 84% | 86% |
| IP 1.2 | 2,177 | 88% | 89% | 89% |
| IP 1.3 | 2,213 | 88% | 87% | 89% |
| IP 1.4 | 2,048 | 81% | 84% | 86% |
| IP 2.1 | 5,944 | 91% | 91% | 92% |
| CFO HMPPS | 286 | 81% | 82% | 86% |
| CFO DWP | 1,712 | 79% | 81% | 84% |
| CFO Direct | 3,151 | 86% | 86% | 88% |
| CFO NLCF | 399 | 85% | 88% | 89% |
| CFO ESFA | 14,221 | 87% | 88% | 89% |
Leavers from less developed regions were generally more satisfied than average: 94 per cent expressing satisfaction for the guidance on what would be delivered and the relevance of the provision, and 95 per cent were satisfied with the feedback and guidance given during the course/programme.
Overall, seven per cent of leavers were dissatisfied with all three elements of the provision. Leavers with slightly higher dissatisfaction levels included:
- Those disadvantaged (eight per cent versus five per cent non-disadvantaged)
- BAME (eight per cent versus six per cent among white people)
- Disabled participants (nine per cent compared to five per cent among those without a disability or long-term health condition)
Course/ programme difficulty
More than three-quarters of all leavers (78 per cent) thought the difficulty of the provision was ‘about right’. Six per cent thought it was ‘too difficult’ and 13 per cent ‘too easy’. Results were similar for the amount of time spent on the course/programme and the amount of support received; 78 per cent said this was ‘about right’, nine per cent ‘too much’ and 11 per cent ‘too little’.
Figure 3.2 Participant views on level of difficulty and amount of time on programme – this figure is made up of 2 charts
Level of difficulty of programme
| Level | Percentage |
|---|---|
| About right | 78% |
| Too difficult | 6% |
| Too easy | 13% |
| Don’t know | 3% |
Base (All leavers) 19,769
Amount of time on programme or support received
| Level | Percentage |
|---|---|
| About right | 78% |
| Too much | 9% |
| Too little | 11% |
| Don’t know | 2% |
Base (All leavers) 19,769
ESF participants were slightly more likely than YEI participants to find the provision too difficult (six per cent versus four per cent). By CFO, DWP and National Lottery Community Fund (NLCF) participants were the most likely to find it too difficult (both eight per cent). Among IPs this measure was highest for 1.1 (eight per cent) and 1.4 (seven per cent).
The proportion of participants that found the course/programme too difficult rose with age, from two per cent of 15-17 year olds to nine per cent among 55+ year olds.
Generally, satisfaction with time and support on the programme was consistent across different leaver groups. The groups most likely to report they received too little time and support included HMPPS (18 per cent) and NLCF (16 per cent) participants, and those under IP 1.4 (14 per cent).
Participants living with a disability or a long-term health condition were more likely than those without to say they received insufficient time/support (14 per cent compared to nine per cent). Similarly, BAME participants were slightly more likely than white participants to report the same (13 per cent versus 10 per cent), as were disadvantaged participants compared to non-disadvantaged (12 per cent versus nine per cent).
Participants with support needs
A significant minority of participants entered the programme with additional responsibilities outside of work or were living with a long-term health condition. Just over a quarter (27 per cent) had parental/guardianship responsibilities for children under 18. A similar proportion (26 per cent) had a mental or physical health condition, or illness expected to last 12 months or more. A slightly smaller proportion (eight per cent) had caring responsibilities for a family member, relative or friend.
As could be expected given the focus of YEI on young people, participants under this programme were far less likely than those under ESF to have parental responsibilities at programme entry (14 per cent versus 29 per cent). As shown in Figure 3.3, they were also slightly less likely to be living with a long-term health condition (23 per cent versus 27 per cent).
Participants under IP 1.2 (four per cent) and 1.3 (14 per cent) were less likely than average to be parents, whereas two-fifths (40 per cent) of 2.1 participants were parents or guardians.
By CFO a slightly smaller proportion of DWP (19 per cent) and Direct Provider (17 per cent) participants were parents compared to 30 per cent of ESFA participants.
Participants under IP 1.1 and 1.4 were more likely to be carers (10 and 11 per cent, respectively) and/or have a disability or long-term condition (35 and 42 per cent, respectively).
Approaching two-thirds of DWP participants (63 per cent) had a long-term health condition at programme entry, far higher than any other CFO, although this was also the case for significant minorities under HMPPS (44 per cent) and the NLCF (41 per cent).
Figure 3.3 Proportion of participants with responsibilities outside work or a long-term health condition by CFO and IP – this figure is made up of 3 charts
Sample type
| Sample type | Base (All leavers) | Long-term health condition | Caring responsibilities | Childcare responsibilities |
|---|---|---|---|---|
| YEI only | 2,213 | 23% | 6% | 14% |
| ESF only | 17,556 | 27% | 8% | 29% |
| All leavers | 19,769 | 26% | 8% | 27% |
Investment Priority
| Investment Priority | Base (All leavers) | Long-term health condition | Caring responsibilities | Childcare responsibilities |
|---|---|---|---|---|
| 1.1 | 7,387 | 35% | 10% | 28% |
| 1.2 | 2,177 | 19% | 5% | 4% |
| 1.3 | 2,213 | 23% | 6% | 14% |
| 1.4 | 2,048 | 42% | 11% | 27% |
| 2.1 | 5,944 | 9% | 6% | 40% |
Co-financing Organisation (CFO)
| CFO | Base (All leavers) | Long-term health condition | Caring responsibilities | Childcare responsibilities |
|---|---|---|---|---|
| HMPPS | 286 | 44% | 9% | 25% |
| DWP | 1,712 | 63% | 9% | 19% |
| Direct | 3,151 | 31% | 7% | 17% |
| NLCF | 399 | 41% | 13% | 24% |
| ESFA | 14,221 | 20% | 8% | 30% |
As shown in Figure 3.4, there was much variation in responsibilities by demographic, and in terms of long-term health condition or illness. More than a third of women (37 per cent) had parental responsibilities at programme entry compared to one in five men (21 per cent). They were also slightly more likely to have caring responsibilities (10 per cent versus seven per cent). As could perhaps be expected, the older the participant the more likely they were to have a long-term health condition or illness; around one in six (16 per cent) 15-17 year olds had one rising to more than a third (35 per cent) among 55+ year olds.
Figure 3.4 Proportion of participants with responsibilities outside work or a long-term health condition by age and gender
| Gender/age | Base (All leavers) | Long-term health condition | Caring responsibilities | Childcare responsibilities |
|---|---|---|---|---|
| All | 19,769 | 26% | 8% | 27% |
| Males | 10,977 | 27% | 7% | 21% |
| Females | 8,783 | 26% | 10% | 37% |
| 15-17 | 1,649 | 16% | 4% | 2% |
| 18-24 | 5,254 | 22% | 6% | 9% |
| 25-29 | 2,317 | 24% | 7% | 32% |
| 30-54 | 8,325 | 29% | 10% | 46% |
| 55+ | 2,224 | 35% | 10% | 8% |
BAME participants were slightly more likely than white participants to have parental responsibilities (35 per cent versus 25 per cent), slightly more likely to be carers (nine per cent versus eight per cent) but less likely to be living with a long-term condition (18 per cent versus 29 per cent).
Support provided
Most participants (91 per cent) with childcare responsibilities were not offered support or assistance from their provider in relation to these responsibilities. Four per cent received support and a further three per cent were offered support but did not take it up[footnote 18].
Of those that received support, nine in ten (90 per cent) were satisfied with the support they received, with just five per cent not satisfied. Almost three-quarters (73 per cent) said that they would have faced difficulties attending the provision or support programme without the support they received for childcare. This is summarised in Figure 3.5.
Figure 3.5 Experience of childcare support on programme – this figure is made up of 3 charts
Childcare support
| Base (All with childcare responsibilities at entry) | Refused to say | Not offered support | Was offered support | Received support |
|---|---|---|---|---|
| 5,391 | 1% | 91% | 3% | 4% |
Satisfaction with support for childcare responsibilities
| Satisfaction | Percentage |
|---|---|
| Satisfied | 90% |
| Not satisfied | 5% |
| Don’t know | 4% |
| Refused | 0% |
Base (All who received childcare support) 221
Difficulties attending without childcare support
| Difficulties | Percentage |
|---|---|
| Yes | 73% |
| No | 24% |
| Don’t know | 2% |
| Refused | 0% |
Base (All who received childcare support) 221
Participants on a YEI programme were most likely to receive childcare support (12 per cent) or to have been offered support (10 per cent). This compared to three per cent receiving support and three per cent being offered under ESF.
Similar to childcare, most participants with caring responsibilities (88 per cent) were not offered support or assistance from their provider. Six per cent received support while five per cent were offered support but didn’t use it. Only a very small number of participants (89) were asked about their satisfaction with this support, but indicative results suggest the vast majority were satisfied (97 per cent) and they would have had difficulty attending without it (73 per cent).
Figure 3.6 Experience of carer support on programme – this figure is made up of 3 charts
Carer support
| Carer support | Percentage |
|---|---|
| Refused to say | 1% |
| Not offered support | 88% |
| Was offered support | 5% |
| Received support | 6% |
Base (All with caring responsibilities at entry) 5,391
Satisfaction with support for caring responsibilities
| Satisfaction | Percentage |
|---|---|
| Satisfied | 97% |
| Not satisfied | 3% |
Base (All who received caring support - note small base size) 89
Difficulties attending without caring support
| Difficulties | Percentage |
|---|---|
| Yes | 73% |
| No | 24% |
| Don’t know | 3% |
Base (All who received caring support - note small base size) 89
Like childcare, YEI participants were slightly more likely to be offered caring support; 13 per cent were offered it but didn’t use it, and five per cent received the support. This compares to four per cent offered and six per cent receiving it through ESF.
Participants with a long-term health condition or illness were more likely to be offered specific support by their provider compared to parents and carers; approaching a third (31 per cent) received support with a further eight per cent offered support. Of those who received it, satisfaction was high (93 per cent, with five per cent dissatisfied). Seven in ten (71 per cent) were likely to face difficulties attending without it.
Figure 3.7 Experience of support for long-term health condition or illness on programme – this figure is made up of 3 charts
Health/Illness Support
| Support | Refused to say | Had no specific needs | Not offered support | Was offered support | Received support |
|---|---|---|---|---|---|
| Health/illness support | 2% | 18% | 41% | 8% | 31% |
Base (All with long-term health condition or illness responsibilities at entry) 5,035
Satisfaction with health support
| Satisfaction | Percentage |
|---|---|
| Satisfied | 93% |
| Not satisfied | 5% |
| Don’t know | 2% |
Base (All who received health support) 1,565
Difficulty attending without health support
| Difficulty | Percentage |
|---|---|
| Yes | 71% |
| No | 26% |
| Don’t know | 4% |
Base (All who received health support) 1,565
YEI participants were more likely than ESF participants to receive support for a health condition or illness (40 per cent compared to 31 per cent). Significant portions of DWP (47 per cent) and Direct Provider participants (41 per cent) received such support. By IP, participants on 1.3 were the most likely to receive this support (40 per cent) with those on 2.1 by far the least likely (14 per cent). White participants (32 per cent) were slightly more likely than their BAME counterparts (25 per cent) to receive health support.
Impact on work-related skills
Job search skills and support
Leavers received a range of job search related advice and support while on their programme. As shown in Figure 3.8 the most common form of support received was advice or guidance on the sort of work a participant could do (72 per cent). This is closely followed by general advice about the world of work (69 per cent) and training or advice on how to look for work (64 per cent).
One in seven (14 per cent) reported not receiving any of these forms of support or didn’t know.
Figure 3.8 Advice and support provided on programme
| Advice/support | All |
|---|---|
| No to all of forms of support or don’t know | 14% |
| Work experience or work placement | 34% |
| Contacts who could help you look for a job | 50% |
| Information on vaccancies you could try for | 54% |
| Training/advice on looking for work | 64% |
| General advice on world of work | 69% |
| Advice/guidance on sort of work you could do | 72% |
Base (All leavers) 19,769
Men were more likely to report receiving each form of advice and support than women; the differences are relatively small, but they are consistent across all measures. For example, 74 per cent of men received advice or guidance on work or training they could potentially try for whereas only 69 per cent of women reported receiving this.
Support received correlated closely with age, with 15-17 year olds and 18-24 year olds reporting the most advice and guidance, and 55+ the least. For example, three-quarters (75 per cent) of 15-17 year olds and 18-24 year olds received training and advice on how to look for work, compared to 57 per cent of 30-54 year olds and 54 per cent of 55+ year olds. Around two-thirds of 15-17 year olds (63 per cent) and 18-24 year olds (66 per cent) received information on vacancies compared to less than half of 30-54 year olds (47 per cent) and 55+ (44 per cent). The youngest two age groups (49 per cent of 15-17 year olds, 46 per cent of 18-24 year olds) were twice as likely to receive work experience or a work placement, than the oldest (22 per cent of 55+).
Reflecting the advice and support given more frequently to the younger leavers, programmes focused on, or more heavily dominated by, young people – specifically YEI, IPs 1.2 and 1.3 and through Direct Providers - were more likely to have provided job related advice and support. Participants under IP 2.1 or through the ESFA were the least likely to have received such support.
There were significant differences in support received by other key demographics:
Disadvantaged: Disadvantaged participants were slightly more likely to report receiving all forms of work-related advice than non-disadvantaged, with the biggest discrepancies being:
- Training and advice in how to look for work (69 per cent disadvantaged versus 54 per cent non-disadvantaged)
- Information about vacancies participants could try to go for (59 per cent versus 45 per cent)
- Contacts to help participants look for a job (55 per cent versus. 42 per cent)
Category of Region: With the exception of advice on the sort of work participants could do, those living in less developed regions were slightly less likely to report receiving all other forms of support. This is likely to be a result of the increased likelihood of these participants receiving in-work support.
Disability: Participants living with a disability or a long-term illness were more likely than non-disabled participants to report receiving several forms of support:
- General advice about the world of work (71 per cent versus 67 per cent)
- Training and advice in how to look for work (70 per cent versus 60 per cent)
- Information about vacancies participants could try to go for (60 per cent versus 51 per cent)
- Contacts to help participants look for a job (56 per cent versus 47 per cent)
- Work experience of a work placement (36 per cent versus 33 per cent)
Ethnicity: BAME participants were slightly more likely than white participants to report receiving most forms of support:
- General advice about the world of work (71 per cent versus 68 per cent)
- Training and advice in how to look for work (69 per cent versus 63 per cent)
- Information about vacancies participants could try to go for (60 per cent versus 52 per cent)
- Contacts to help participants look for a job (54 per cent versus 49 per cent)
- Work experience of a work placement (40 per cent versus 32 per cent)
Soft work-related skills
Participation in the programme resulted in the majority of participants reporting multiple forms of improved confidence and skill development as an outcome.
Around seven in ten reported:
- Improved self-confidence about working (73 per cent)
- Improvement in their ability to do things independently (72 per cent)
- Improvement in their communication skills (71 per cent)
- Improvement in their ability to work in a team (71 per cent)
- Improvement in their motivation to do more training (70 per cent)
Two-thirds reported improvement in their problem-solving skills (66 per cent) and improvement in their motivation to find a job or promotion (66 per cent).
Around one in nine (11 per cent) did not report any of these improvements of didn’t know.
Despite men being more likely to report that they had received work-related advice, women were slightly more likely to report developing soft work-related skills. There was only one measure where there was no difference between genders; improved motivation to job hunt or seek promotion (66 per cent for both men and women).
The older a participant was, the less likely they were to report a benefit from work-related advice. Typically eight in ten 15-17 year olds and 18-24 year olds reported improvement in confidence and motivation. This fell to around two-thirds for 30-54 year olds and six in ten among 55+ for most measures.
As with job search skills and support, programmes that focused on, or skew towards, young people were more likely to have participants reporting an increase in confidence or motivation; YEI, IPs 1.2, 1.3 and those under Direct Providers were the most likely to report benefits – on all measures the proportion of respondents reporting a benefit ranged from 68 per cent to 82 per cent.
HMPPS leavers were the least likely to report improvement in confidence, skills and motivations, with only 56 per cent reporting an improved ability to work in teams, or problem solving skills. Only 60 per cent of HMPPS participants felt their motivation to find a job or seek a promotion had improved. DWP participants were also slightly less likely to report improvement across all measures except improved motivation to seek a job or promotion (67 per cent agreed, similar to the overall average of 66 per cent). Moreover, more than one in five (22 per cent) HMPPS participants reported no to all the benefits tested (or didn’t know). For DWP participants the proportion was 15 per cent, still higher than the survey average (11 per cent).
There were differences in benefits from work advice reported by key demographics:
Disability: Despite participants with a disability being more likely to report receiving work advice, they were less likely than non-disabled to report improvements in all the forms of skills and confidence tested. For example, 70 per cent reported improved self-confidence about working compared to 76 per cent of non-disabled. Similarly 13 per cent did not feel they experienced any of the improvements or benefits tested compared to 10 per cent among non-disabled.
Ethnicity: BAME participants were more likely to report receiving most forms of work advice and report improvements as a result. One in eight (79 per cent) reported improved self-confidence compared to 72 per cent of white participants. More than three-quarters (77 per cent) reported improvement in acting independently and in their communications skills compared to 70 per cent of white participants. Only eight per cent reported no improvements versus 12 per cent of white participants.
Nine in ten (90 per cent) participants employed at programme entry reported the course/programme has had helped them in their work environment; 54 per cent said it had helped them ‘a lot’, and 36 per cent said it had helped them ‘a little’. One in 11 (nine per cent) said that the programme had ‘not helped at all’. Although the proportion reporting positive help was consistent between men (90 per cent) and women (91 per cent), women were more likely to report it had helped them a lot (58 per cent compared to 51 per cent of men).
Eight in ten participants (81 per cent) inactive or unemployed at entry reported that the course/programme had helped them find a job or made it more likely they will find work. Just under half (47 per cent) said it had helped them a lot while a third (34 per cent) said it had helped them a little. Around one in six (17 per cent) said the programme had not helped at all.
Figure 3.9 Extent programme helped participants in work environment or to find work – this figure is made up of 2 charts
Extent course / support programme helped in the work environment
| Extent helped | Percentage |
|---|---|
| Don’t know | 1% |
| Not helped at all | 9% |
| Helped a little | 36% |
| Helped a lot | 54% |
| Total helped | 90% |
Base (All participants in employment at entry) 5,876
| Extent helped | Percentage |
|---|---|
| Don’t know | 1% |
| Not helped at all | 17% |
| Helped a little | 34% |
| Helped a lot | 47% |
| Total helped | 81% |
Base (All participants unemployed or inactive on entry) 13,893
The proportion of unemployed at entry reporting they have been helped (or not) was generally consistent across participant types and programmes. An exception was age; older participants were more likely than younger participants to say the programme had not helped them; more than a quarter of those aged 55+ (27 per cent) and one in five aged 30-54 (20 per cent) said this compared to 12 per cent among 15-17, 11 per cent among 18-24 and 15 per cent among 25-29.
Reflecting more positive feedback from younger participants, those engaged through YEI were more likely than those under ESF to say they had been helped (87 per cent versus 81 per cent). By CFO, HMPPS participants were the most likely to say participation had not helped them (23 per cent) followed by DWP participants (20 per cent). By IP this proportion was highest for 2.1 (21 per cent), 1.1 (19 per cent) and 1.4 (19 per cent), and lowest for 1.2 (11 per cent) and 1.3 (12 per cent).
Overall satisfaction with provision
Assessing all the support received from the programme and how they may have benefited since, more than eight in ten (82 per cent) expressed satisfaction; nearly half (46 per cent) were very satisfied and more than a third (36 per cent) were fairly satisfied.
A minority were dissatisfied (eight per cent); three per cent fairly dissatisfied, four per cent very dissatisfied.
Figure 3.10 Participant satisfaction with programme – this figure is made up of 3 charts
Sample type
| Sample type | Base (All leavers) | Don’t know | Very dissatisfied | Fairly dissatisfied | Neither satisfied / dissatisfied | Fairly satisfied | Very satisfied |
|---|---|---|---|---|---|---|---|
| YEI only | 2,213 | 1% | 3% | 3% | 8% | 38% | 47% |
| ESF only | 17,556 | 1% | 4% | 3% | 10% | 36% | 46% |
| All leavers | 19,769 | 1% | 4% | 3% | 9% | 36% | 46% |
Investment Priority (IP)
| IP | Base (All leavers) | Don’t know | Very dissatisfied | Fairly dissatisfied | Neither satisfied / dissatisfied | Fairly satisfied | Very satisfied |
|---|---|---|---|---|---|---|---|
| 1.1 | 7,387 | 1% | 6% | 4% | 10% | 34% | 45% |
| 1.2 | 2,177 | 1% | 3% | 3% | 10% | 43% | 40% |
| 1.3 | 2,213 | 1% | 3% | 3% | 8% | 38% | 47% |
| 1.4 | 2,048 | 1% | 6% | 4% | 11% | 33% | 45% |
| 2.1 | 5,944 | 1% | 3% | 2% | 8% | 36% | 50% |
Co-financing Organisation (CFO)
| CFO | Base (All leavers) | Don’t know | Very dissatisfied | Fairly dissatisfied | Neither satisfied / dissatisfied | Fairly satisfied | Very satisfied |
|---|---|---|---|---|---|---|---|
| HMPPS | 286 | 1% | 9% | 3% | 10% | 30% | 48% |
| DWP | 1,712 | 1% | 8% | 4% | 10% | 32% | 45% |
| Direct | 3,151 | 1% | 4% | 3% | 8% | 36% | 48% |
| NLCF | 399 | 1% | 4% | 5% | 9% | 33% | 49% |
| ESFA | 14,221 | 1% | 4% | 3% | 10% | 37% | 45% |
Generally satisfaction was high and consistent across most programme and participant types.
YEI leavers were slightly, albeit significantly more likely to be satisfied than ESF leavers (85 per cent compared to 82 per cent). This may be driven by younger participants having a greater proportion of satisfied leavers; 84 per cent of 15-17 and 18-24 year olds were satisfied compared to 81 per cent of older leavers. That said, 15-17 year olds were the least likely of all age groups to be very satisfied (38 per cent compared to 46 per cent average).
In line with age findings, leavers in IPs 1.2 and 1.3, targeted at younger participants, showed relatively high satisfaction (84 and 85 per cent), although IP 2.1 had the highest proportion satisfied (86 per cent). IP 1.4 had the lowest proportion satisfied (78 per cent), although this was still a good majority.
By CFO, HMPPS and DWP leavers had the lowest total satisfaction, at 77 per cent, and the higher proportions of very dissatisfied leavers (13 and 12 per cent) compared to all other CFOs. Direct Provider, NLCF, and ESFA leaver satisfaction was broadly in line.
Demographics groups with greater likelihood of satisfaction include:
- Women (83 versus 81 per cent satisfied among men); the difference is more prominent in the proportions very satisfied (50 per cent for women, 43 per cent for men).
- Non-disabled leavers (84 versus 78 per cent among disabled participants)
- Non-disadvantaged leavers (84 versus 81 per cent among disadvantaged)
Traineeships
One in five (19 per cent) YEI participants undertook a traineeship as part of the programme[footnote 19]. Nine in ten who did were satisfied with their traineeship experience; 54 per cent very satisfied, 35 per cent fairly satisfied. Only seven per cent expressed dissatisfaction, as shown in Figure 3.10.
Figure 3.11 Proportion of participants undertaking traineeship on programme and level of satisfaction – this figure is made up of 2 charts
Proportion receiving a traineeship as part of programme
| Traineeship | Percentage |
| Don’t know | 4% |
| No | 77% |
| Yes | 19% |
Base (All YEI leavers) 2,213
Satisfaction with traineeship
| Satisfaction | Percentage |
|---|---|
| Don’t know | 0% |
| Very dissatisfied | 5% |
| Fairly dissatisfied | 3% |
| Neither satisfied / dissatisfied | 3% |
| Fairly satisfied | 35% |
| Very satisfied | 54% |
| Total satisfied | 89% |
| Total dis-satisfied | 7% |
Base (All YEI leavers that did traineeship as part of programme) 411
Seven in ten (73 per cent) YEI leavers who undertook a traineeship (henceforth “trainees”) felt their working conditions while on the traineeship were equal to other members of staff at their place of work. One in five (20 per cent) reported conditions were better for them and only six per cent felt their conditions were worse. The vast majority of trainees (82 per cent) said the time spent on their placement was about right, with ten per cent reporting it was too short and seven per cent too long.
Nine in ten (89 per cent) believed the traineeship had improved their chances of finding a job (53 per cent to a ‘large extent’).
4. Status six months after course completion
This chapter presents the employment status of leavers six months after completing their course. It explores which groups are more or less likely to have an improved economic status (from moving into employment or progression within employment).
Chapter summary
More than half of individuals were in employment six months after leaving the provision compared to less than three in ten at entry. While the proportion of individuals unemployed fell, there was a small rise in the proportion economically inactive.
In terms of individual transition between provision entry and six months after leaving, just over a quarter remained in employment, and a similar proportion had moved into employment. More than two-fifths of all participants remained unemployed or inactive, and a very small minority had moved out of employment into these groups.
Around three in ten ESF participants had remained in employment at six months, very small minorities had moved out of employment. While around a quarter of ESF leavers have moved into employment. A higher proportion, more than two-fifths, on YEI moved into employment. More than half of YEI participants remained unemployed or inactive at six months compared to two-fifths of ESF participants.
Although there is a greater proportion in employment, individuals who had moved into employment were more likely than those who remain in employment to be in “precarious employment”. More than a quarter of leaver’s who began their programme in precarious employment, had progressed to stable employment after six months.
More than a third of participants employed on entry and six months after leaving provision reported a requirement for higher skills or competencies in their role after six months. A slightly higher proportion said that they had reported being given more responsibility over the same period and almost a quarter required a higher level of qualification. Just under half said they have received an hourly or annual pay rise over the six month period.
Individuals with improved labour market situations six months after leaving their course were more satisfied with their experience than those without.
Employment status at six months
More than half (53 per cent) of individuals were in employment six months after leaving the programme compared to less than three in ten (29 per cent) at entry. This represents a 24 percentage point increase in employment. While the proportion of individuals unemployed fell from over half (56 per cent) to one in five (20 per cent), there was also a small rise in the proportion economically inactive from 15 per cent to 26 per cent, as shown in Figure 4.1.
Employment among ESF-only participants grew 22 percentage points, from 32 per cent to 54 per cent. Just under half (45 per cent) of YEI-only participants were employed after six months compared to 1 per cent at entry. For both leaver groups, unemployment reduced while economic inactivity grew. Most commonly, growth in inactivity was due to individuals moving into education or training, or not working because of poor health; other reasons included take up of a voluntary role and caring for a household or relative.
Figure 4.1 Employment status at programme entry and six months by sample type
| Sample type | Base (All leavers) | Inactive | Unemployed | In employment | Employment growth (percentage points) |
|---|---|---|---|---|---|
| All leavers - Entry | 19,769 | 15% | 56% | 29% | |
| All leavers - Six Months | 19,769 | 26% | 20% | 54% | +25 |
| ESF only - Entry | 17,556 | 14% | 54% | 32% | |
| ESF only - Six Months | 17,556 | 26% | 20% | 54% | +22 |
| YEI only - Entry | 2,213 | 21% | 78% | 1% | |
| YEI only - Six Months | 2,213 | 30% | 25% | 45% | +44 |
Only participants in IP 2.1 were more likely than not to be employed at entry (92 per cent). After six months this was the only IP to record a fall in employment (to 86 per cent). IPs 1.1, 1.3 and 1.4 all saw employment rise from negligible proportions to around two in five after six months. IP 1.2 also achieved this level of employment, albeit starting from a higher employment base at entry (20 per cent).
All IPs recorded a reduction in unemployment, yet also growth in economic inactivity after six months. The biggest proportion of inactive individuals at six months was seen in IP 1.2 (41 per cent), with nearly a third (31 per cent) in education or training at this point.
Figure 4.2 Employment status at programme entry and six months by Investment priority
| Investment priority | Base (All leavers) | Inactive | Unemployed | In employment | Employment growth (percentage points) |
|---|---|---|---|---|---|
| 1.1 - Start | 7,387 | 15% | 84% | 2% | +37 |
| 1.1 - Six Months | 7,387 | 30% | 31% | 39% | +25 |
| 1.2 (ESF) - Start | 2,177 | 26% | 54% | 20% | |
| 1.2 (ESF) - Six Months | 2,177 | 41% | 17% | 43% | +23 |
| 1.3 (YEI) - Start | 2,213 | 21% | 78% | 1% | |
| 1.3 (YEI) - Six Months | 2,213 | 30% | 25% | 45% | +44 |
| 1.4 - Start | 2,048 | 23% | 76% | 1% | |
| 1.4 - Six Months | 2,048 | 34% | 28% | 38% | +37 |
| 2.1 - Start | 5,944 | 3% | 6% | 92% | |
| 2.1 - Six Months | 5,944 | 10% | 4% | 86% | -6 |
Employment rates were significantly different for the ESFA compared to other CFOs. Unsurprisingly given its focus on skills in work, the ESFA was the only CFO with a majority of participants (58 per cent) in employment at six months, whereas the other CFOs ranged from 36 per cent (DWP) to 45 per cent (HMPPS). Similarly the ESFA had the lowest proportion unemployed; 18 per cent compared to between 24 per cent (HMPPS) and 32 per cent (DWP) for the other CFOs. There was an 18 percentage point increase in employment of ESFA participants after six months. Other CFOs achieved far higher employment increases (all 36 percentage points or higher) as a result of starting from extremely low employment rates at programme entry.
Figure 4.3 Employment status at programme entry and six months by CFO
| Employment status | Base (All leavers) | Inactive | Unemployed | In employment | Employment growth (percentage points) |
|---|---|---|---|---|---|
| All leavers - Entry | 19,769 | 15% | 56% | 29% | |
| All leavers - Six Months | 19,769 | 26% | 20% | 53% | +24 |
| HMPPS - Entry | 286 | 35% | 64% | 1% | |
| HMPPS - Six Months | 286 | 31% | 24% | 45% | +44 |
| DWP - Entry | 1,712 | 34% | 65% | 1% | |
| DWP - Six Months | 1,712 | 31% | 32% | 36% | +35 |
| Direct - Entry | 3,151 | 26% | 70% | 4% | |
| Direct - Six Months | 3,151 | 31% | 26% | 43% | +39 |
| NLCF - Entry | 399 | 28% | 71% | 1% | |
| NLCF - Six Months | 399 | 32% | 27% | 42% | +41 |
| ESFA - Entry | 14,221 | 9% | 51% | 40% | |
| ESFA - Six Months | 14,221 | 25% | 18% | 58% | +18 |
There were significant differences in employment status at six months by key demographics:
Gender: Whereas at entry there was a higher proportion of women in employment than men, at six months there was no longer a difference between genders; just over half of women were employed (54 per cent) with a similar proportion for men (53 per cent). Both outcomes represent significant change from employment at entry (31 per cent for women, 26 per cent for men). Men remained more likely to be unemployed at six months than women (23 per cent versus 16 per cent), while women were more likely to be economically inactive than men (30 per cent versus 24 per cent).
Figure 4.4 Employment status at programme entry and six months by gender
| Employment status | Base (All leavers) | Inactive | Unemployed | In employment | Employment growth (percentage points) |
|---|---|---|---|---|---|
| All leavers - Entry | 19,769 | 15% | 56% | 29% | |
| All leavers - Six Months | 19,769 | 26% | 20% | 53% | +24 |
| Males - Entry | 10,977 | 14% | 60% | 26% | |
| Males - Six Months | 10,977 | 24% | 23% | 53% | +27 |
| Females - Entry | 8,783 | 16% | 51% | 33% | |
| Females - Six Months | 8,783 | 30% | 16% | 54% | +21 |
Age: As could be expected, participants aged 15-17 remained the least likely to be employed at six months (33 per cent) and the most likely to be economically inactive (53 per cent). However, the proportion of 15-17 year olds employed represented a doubling compared to the proportion at entry (from 17 per cent to 33 per cent).
Across all age groups there was improvement in the proportion employed at six months, with the largest percentage point increase for 18-24 year olds (33 percentage points); among these leavers the proportion employed grew from one in five (21 per cent) to more than half (54 per cent).
Figure 4.5 Employment status at programme entry and six months by age
| Employment status | Base (All leavers) | Inactive | Unemployed | In employment | Employment growth (percentage points) |
|---|---|---|---|---|---|
| All leavers - Entry | 19,769 | 15% | 56% | 29% | |
| All leavers - Six Months | 19,769 | 26% | 20% | 53% | +24 |
| 15-17 - Entry | 1,649 | 42% | 42% | 17% | |
| 15-17 - Six Months | 1,649 | 53% | 14% | 33% | +16 |
| 18-24 - Entry | 5,254 | 12% | 67% | 21% | |
| 18-24 - Six Months | 5,254 | 25% | 22% | 54% | +33 |
| 25-29 - Entry | 2,317 | 11% | 58% | 31% | |
| 25-29 - Six Months | 2,317 | 21% | 21% | 57% | +26 |
| 30-54 - Entry | 8,325 | 12% | 52% | 36% | |
| 30-54 - Six Months | 8,325 | 23% | 20% | 57% | +21 |
| 55+ - Entry | 2,224 | 15% | 56% | 29% | |
| 55+ - Six Months | 2,224 | 28% | 25% | 48% | +19 |
- Category of Region: Increases in employment six months after programme completion were remarkably consistent across region categories, although the starting rate in each region varied significantly. The proportion in employment in less developed locations grew from 64 per cent to 70 per cent, in transitional locations it grew from 31 per cent to 57 per cent, while in more developed locations it grew from 28 per cent to 51 per cent.
- Disadvantaged: The programmes appeared to have a greater impact on increasing employment for people categorised as disadvantaged compared to those who were not. The proportion of disadvantaged in employment at six months increased 26 percentage points from 18 per cent to 44 per cent. In contrast, those not categorised as disadvantaged experienced an increase of 20 percentage points, rising from 50 per cent to 70 per cent.
- Disability: Participants categorised as disabled or living with a long-term health condition experienced similar percentage point increases in employment compared to non-disabled participants (25 and 23 percentage points).
- Ethnicity: Both white and BAME leavers experienced a growth in employment at six months, although the improvement was slightly higher for BAME participants at (rising 24 percentage points from 22 per cent at entry to 46 per cent) than it was for white participants (rising 24 percentage points from 31 per cent at entry to 55 per cent).
Employed at six months
Among those employed six months after leaving their course/programme, 86 per cent were employed in a paid role for an employer, a 5 per cent increase from the proportion at programme entry (82 per cent). One in eleven (9 per cent) were self-employed while one in twenty (5 per cent) were on an apprenticeship – both proportions largely unchanged compared to programme entry.
Figure 4.6 Type of Employment at programme entry and at six months
| Programme entry | Base (All in employment) | Other | Apprenticeship | Family business (unpaid) | Employer in paid role | Self-employed |
|---|---|---|---|---|---|---|
| On Entry | 5,876 | 1% | 6% | 1% | 82% | 10% |
| After Six Months | 10,595 | 0% | 5% | 0% | 86% | 9% |
Women were more likely to be in paid employment than men (90 per cent versus 82 per cent), while men were more likely to be self-employed (11 per cent compared to 6 per cent among women).
ESF participants were slightly more likely than YEI to be in paid employment (86 per cent versus 82 per cent) or self-employed (nine per cent versus four per cent), while YEI participants were more likely than ESF to be working in an apprenticeship (13 per cent versus four per cent).
HMPPS Participants were the most likely to be self-employed at six months (25 per cent) but the least likely to be in paid employment (71 per cent). Participants of IP 1.2 were the least likely of any IP at six months to be in paid employment (76 per cent) but the most likely to be on an apprenticeship (21 per cent). Participants in less developed locations were similarly less likely than average to be in paid employment at six months (79 per cent) but more likely than other regions to be self-employed (18 per cent).
In terms of type of employment at six months versus programme entry, there was a very small rise in part-time employment (from 25 per cent to 28 per cent). Women were twice as likely to report they are in part-time employment (39 per cent) than men (19 per cent). Conversely eight in ten employed men (80 per cent) were working full-time compared to six in ten women (60 per cent).
Precarious employment – i.e. temporary employment or that with a work contract of limited duration - was more common at six months than on entry; 21 per cent compared to 14 per cent at programme entry were in precarious employment (see Figure 4.7). Correspondingly the proportion in stable employment fell from almost three-quarters (73 per cent) at programme start to two-thirds (65 per cent) at six months. Leavers who were employed at six months but unemployed/inactive at entry were far less likely to be in stable employment at six months (51 and 53 per cent compared to 81 per cent of participants employed on entry). More than a quarter of leavers (28%) who began their programme in precarious employment, had progressed to stable employment by programme end. A very small minority of those in stable employment on entry to the programme had moved into precarious employment (3%).
The proportion working in employment of unknown stability remained unchanged after six months at 13 per cent. As seen at programme entry, the likelihood of being in stable employment increased with age, from 50 per cent among 15-17 year olds to 71 per cent for 55+ year olds (although the latter figure represents a decline compared to the 80 per cent recorded at programme entry).
Figure 4.7 Type of employment contract at programme entry and six months – this figure is made up of 2 charts
On entry
| Type of employment | Percentage |
|---|---|
| Stable employment | 73% |
| Precarious employment | 14% |
| Unknown stability | 13% |
Base: All in employment, except self-employed, on entry (5,235)
Six months after leaving
| Type of employment | Percentage |
|---|---|
| Stable employment | 65% |
| Precarious employment | 21% |
| Unknown stability | 13% |
Base: All in employment, except self-employed, six months after leaving(9,671)
The proportion of participants underemployed (i.e. working part-time but wanting full-time work) rose modestly from nine per cent to 12 per cent. Correspondingly the proportion fully employed declined slightly from 90 per cent to 88 per cent. Although these changes were small they were statistically significant.
YEI participants were slightly more likely than their ESF counterparts to be underemployed (15 per cent compared to 11 per cent). The following groups were more likely to be underemployed than others:
- Participants from HMPPS (21 per cent) and DWP (20 per cent) programmes
- IP 1.4 participants (19 per cent)
- BAME participants (17 per cent)
- Those with a disability or long-term health condition (16 per cent)
Education status at six months
Six months after leaving the programme, 26 per cent of participants were economically inactive. A subset of this group were in education or training (nine per cent of all leavers); this was more than double the proportion in education or training at time of entry (four per cent).
Six in ten (61 per cent) in education or training were in college, a slight increase from programme entry (56 per cent). This growth was mainly driven by an increase in part-time studying at college (from 11 per cent to 19 per cent) rather than full-time enrolment. The proportion in school decreased from one in three (31 per cent) to just one in 20 (5 per cent). Conversely the proportions in university (14 per cent), on a course/programme whilst in work (6 per cent) and on a traineeship (5 per cent) all increased.
Figure 4.8 Education or training status at programme entry and at six months
| Education/training status | All in education or training - Entry | All in education or training - Six Months |
|---|---|---|
| Don’t know | 1% | 1% |
| Other | 5% | 8% |
| Online course | 0% | 1% |
| On a traineeship | 2% | 5% |
| On a course whilst in work | 2% | 6% |
| In university | 3% | 14% |
| In school | 31% | 5% |
| NET: In college | 56% | 61% |
| In college - part-time | 11% | 19% |
| In college - full-time | 45% | 42% |
Base (All in education or training at entry) 922
Base (All in education or training at six months) 1,915
At six months ESF participants were more likely to be in university (15 per cent versus nine per cent) or still at school (six per cent versus one per cent).
Among those in education or training there were significant status differences by key demographics:
- Gender: Women were more likely to be in college than men (63 per cent compared to 58 per cent) driven largely by a higher proportion studying part-time (23 per cent versus 15 per cent).
- Age: As might be expected, education enrolment correlates closely with age. More than seven in ten (72 per cent) 15-17 year olds were studying full-time at college. This fell to a third (33 per cent) of 18-24 year olds, fewer than one in five (18 per cent) 25-29 year olds, nine per cent of 30-54 year olds, before rising again to 16 per cent among 55+. In contrast, part-time study at college peaked for 30-54 year olds (41 per cent), and also accounted for around a third of 25-29 year olds (31 per cent) and 55+ (35 per cent). University accounted for 29 per cent of 18-24 year olds, 21 per cent of 25-29 year olds and 16 per cent of 30-54 year olds.
- Disadvantaged: Disadvantaged participants were less likely to be at university (13 per cent compared to 20 per cent not disadvantaged) but more likely to be at college part-time (20 per cent versus 14 per cent).
- Disability: Participants with a disability or long-term health condition were more likely than those without to be at college part-time (23 per cent versus 16 per cent) yet less likely to be at college full-time (39 per cent versus 44 per cent) or at university (10 per cent versus 16 per cent).
- Ethnicity: BAME participants were slightly more likely than white participants to be at college part-time (21 per cent compared to 17 per cent), or at university (17 per cent versus 13 per cent), yet less likely to be on a traineeship (3 per cent versus 6 per cent).
Benefit status at six months
At programme entry more than eight in ten (83 per cent) participants who received DWP provision were claiming benefits. After six months that proportion had reduced to six in ten (61 per cent).
Figure 4.9 Benefits status for DWP participants at programme entry and six months – this figure is made up of 2 charts
DWP participants on entry
| Benefit status | Percentage |
|---|---|
| Receiving any benefits | 83% |
| Not receiving any benefits | 12% |
| Don’t know | 5% |
DWP leavers at six months
| Benefit status | Percentage |
|---|---|
| Receiving any benefits | 61% |
| Not receiving any benefits | 31% |
| Don’t know | 7% |
Base (All DWP leavers) 1,712
The age group most likely to be claiming benefits at six months were 30-54 year olds (64 per cent). Approaching two-thirds (63 per cent) of disadvantaged participants were claiming benefits compared to half of non-disadvantaged (49 per cent). There was also a slightly greater claiming of benefits among those with a disability or a long-term health condition (62 per cent versus 56 per cent non-disabled) and among BAME participants (67 per cent compared to 60 per cent of white participants).
At six months the benefit DWP participants were most likely to be claiming remained Jobseekers Allowance, although the proportion of all DWP participants claiming had halved (from 50 per cent to 25 per cent). The proportion claiming other benefits was largely unchanged.
Figure 4.10 Benefits claimed by DWP participants at programme entry and six months
| Benefits claimed | At entry | At six months |
|---|---|---|
| Don’t know | 2% | 2% |
| Other | 0% | 1% |
| Council Tax Benefit | 0% | 0% |
| Carers Allowance | 0% | 1% |
| Child Benefit | 1% | 1% |
| Housing Benefit | 2% | 2% |
| Incapacity Benefit | 2% | 1% |
| Tax Credit | 2% | 4% |
| Personal Independence Payment (PIP) | 3% | 5% |
| Income Support | 4% | 2% |
| Disability Living Allowance (DLA) | 4% | 3% |
| Universal Credit | 12% | 11% |
| Employment and Support Allowance (ESA) | 15% | 11% |
| Jobseeker’s Allowance | 50% | 25% |
Base (All DWP leavers) 1,712
Transition from entry to six-month status
This section explores leavers’ transition in employment status between starting their provision and six months after leaving it. Figure 4.11 provides an overview of individual movements over this period.
Figure 4.11 Overview of movements in employment status between entry and six months
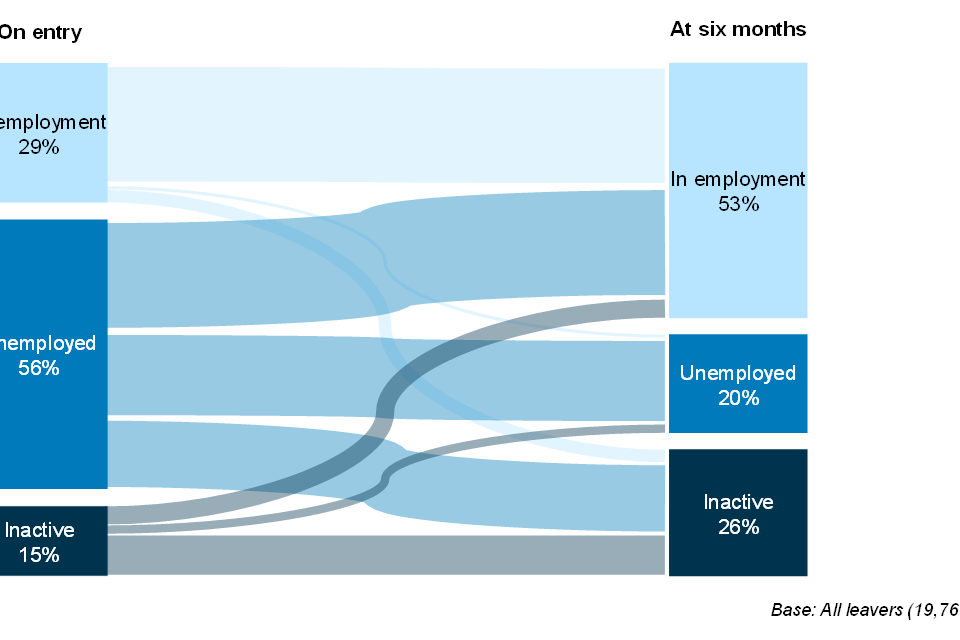
Overview of movements in employment status between entry and 6 months
Six months after leaving the programme, just over a quarter (26 per cent) had remained in employment, and a similar proportion (27 per cent) had moved into employment (three per cent had become inactive, one per cent were unemployed). More than two-fifths (43 per cent) of all participants remained unemployed or inactive.
More than half of YEI participants (55 per cent) remained unemployed or inactive at six months compared to 42 per cent of ESF participants, yet more than two-fifths (44 per cent) under YEI moved into employment. In contrast ESF participants were much more likely to have been employed at the start of the programme, with 28 per cent remaining employed at six month and four per cent moving out of employment (compared to a negligible proportion of YEI). A quarter of ESF participants (26 per cent) moved into employment.
Reflecting its focus on skills levels of individuals in work IP 2,1 was an outlier on this measure with 82 per cent of its participants still in employment at six months, and ten per cent moving out of employment; both figures were higher than was recorded for other IPs. The IP that recorded the greatest proportion moving into employment was 1.3 with 44 per cent, followed by 1.1 (38 per cent) and 1.4 (37 per cent). Around a quarter of 1.2 participants (27 per cent) made the same transition.
By CFO the ESFA was the outlier with more than a third (35 per cent) remaining in employment, a quarter (23 per cent) moving into employment and one in twenty (5 per cent) moving out of employment. Results for other CFOs were generally consistent with around two-fifths moving into employment and a slight majority remaining unemployed or inactive.
Figure 4.12 Employment Transition at six months by IP and CFO – this figure is made up of 3 charts
Sample type
| Sample type | Base (All leavers) | Moved out of employment | Remained unemployed/inactive | Moved into employment | Remained employed |
|---|---|---|---|---|---|
| YEI only | 2,213 | 0% | 55% | 44% | 1% |
| ESF only | 17,556 | 4% | 42% | 26% | 28% |
| All leavers | 19,769 | 4% | 43% | 27% | 26% |
Investment Priority (IP)
| IP | Base (All leavers) | Moved out of employment | Remained unemployed/inactive | Moved into employment | Remained employed |
|---|---|---|---|---|---|
| 1.1 | 7,387 | 0% | 60% | 38% | 1% |
| 1.2 | 2,177 | 5% | 53% | 27% | 15% |
| 1.3 | 2,213 | 0% | 55% | 44% | 1% |
| 1.4 | 2,048 | 0% | 62% | 37% | 1% |
| 2.1 | 5,944 | 10% | 4% | 4% | 82% |
CFO
| CFO | Base (All leavers) | Moved out of employment | Remained unemployed/inactive | Moved into employment | Remained employed |
|---|---|---|---|---|---|
| HMPPS | 286 | 1% | 54% | 44% | 1% |
| DWP | 1,712 | 0% | 63% | 36% | 1% |
| Direct | 3,151 | 1% | 56% | 40% | 3% |
| NLCF | 399 | 0% | 58% | 41% | 1% |
| ESFA | 14,221 | 5% | 37% | 23% | 35% |
Men were slightly more likely than women to move into employment after six months (30 per cent versus 25 per cent), while a slightly greater proportion of women than men remained in employment (29 per cent versus 23 per cent); these findings largely reflect the higher employment rate in women on entry.
As could perhaps be expected 15-17 year olds were most likely to remain unemployed (62 per cent) and the least likely to have moved into employment (21 per cent) or remain employed (12 per cent). The biggest transition was for 18-24 year olds with more than a third (37 per cent) moving into employment. The proportion making this transition reduced as age increased, with only one in five (22 per cent) of 55+ transitioning into work and half (49 per cent) remaining unemployed or inactive. The age group with the biggest proportion remaining employed was 30-54 year olds (33 per cent).
Figure 4.13 Employment Transition at six months by gender and age
| Gender and age | Base (All leavers) | Moved out of employment | Remained unemployed/inactive | Moved into employment | Remained employed |
|---|---|---|---|---|---|
| All leavers | 19,769 | 4% | 43% | 27% | 26% |
| Males | 10,977 | 3% | 44% | 30% | 23% |
| Females | 8,783 | 4% | 42% | 25% | 29% |
| 15-17 | 1,649 | 5% | 62% | 21% | 12% |
| 18-24 | 5,264 | 4% | 42% | 37% | 17% |
| 25-29 | 2,317 | 3% | 40% | 29% | 28% |
| 30-55 | 8,325 | 3% | 40% | 24% | 33% |
| 55+ | 2,224 | 4% | 49% | 22% | 26% |
Category of Region: Fewer than one in eight (12 per cent) participants from less developed regions made the transition into employment after six months. This compared to more than a quarter of those living in transitional (29 per cent) or more developed regions (27 per cent). This finding can be explained by a greater proportion of those in less developed areas starting the programme in employment; more than half (58 per cent) remaining employed at six months in these regions compared to 28 per cent in transitional and 24 per cent in more developed regions. Correspondingly, the proportion in less developed areas remaining unemployed or inactive was a quarter (24 per cent) compared to more than two-fifths in the other regions (40 per cent in transitional and 45 per cent in more developed).
Disadvantaged: Disadvantaged participants were much less likely than non-disadvantaged to be employed at programme entry, so only 15 per cent remained employed at six months compared to 45 per cent of non-disadvantaged. More than half of those disadvantaged (53 per cent) remained unemployed or inactive compared to a quarter (25 per cent) of non-disadvantaged. The proportion in both moving into employment was similar, although slightly higher for non-disadvantaged (29 per cent versus 27 per cent).
Disability: The proportion of participants living with a disability or long-term health condition making a transition into employment (27 per cent) was very similar to those without a disability (28 per cent). Yet disabled participants were far more likely to remain unemployed or inactive (62 per cent versus 32 per cent), with non-disabled participants much more likely to have started the programme in employment and retained that status (35 per cent compared to 9 per cent of those with a disability).
Ethnicity: Similar to disability, there was no difference between the proportion of BAME participants transitioning into work (28 per cent) and the proportion of white participants recording the same movement (27 per cent). Yet white participants were more likely to have begun the programme in work and maintained that role (28 per cent compared to 18 per cent of BAME), and less likely to have remained unemployed or inactive (42 per cent compared to 50 per cent).
In-work outcomes
Due to the relative proportions in employment on entry to provision, leavers from ESFA provision accounted for the vast majority (98 per cent) of individuals who remained in work.
More than a third (36 per cent) of participants employed throughout the duration of the programme reported a requirement for higher skills or competencies in their role after six months. Two-fifths (39 per cent) reported being given more responsibility over the same period and almost a quarter (23 per cent) required a higher level of qualification. Seven in ten (70 per cent) said the qualification level for their role remained unchanged, with six in ten reporting unchanged requirements in skills (59 per cent) and responsibilities (56 per cent)[footnote 20].
Figure 4.14 Change in skills, qualifications and responsibilities required in role six months after the operation
| Abilities | Base (All in employment on entry and at six months) | Don’t know | Lower level | About the same level | Higher level |
|---|---|---|---|---|---|
| Skills | 5,195 | 2% | 3% | 59% | 36% |
| Qualifications | 5,193 | 3% | 4% | 70% | 23% |
| Responsibilities | 5,193 | 1% | 4% | 56% | 39% |
Men were slightly more likely than women to have required higher skills (38 per cent versus 34 per cent), higher qualifications (25 per cent versus 21 per cent) and to have been given more responsibility (41 per cent versus 37 per cent).
The likelihood of higher requirements over the six month period correlated strongly with age. Six in ten (62 per cent) 15-17 year olds ended their six month period with more responsibility compared to around half (53 per cent) of 18-24 year olds. This declined to 44 per cent of 25-29 year olds, 35 per cent of 30-54 year olds and 23 per cent of 55+.
Similar trends were seen with skills and qualifications, with approaching half of 15-17 year olds (46 per cent) required to have higher skills or competencies compared to just 28 per cent among 55+. One in three (31 per cent) 15-17 year olds required a higher level of qualification compared to 18 per cent of those aged 55+.
Figure 4.15 Change in skills, qualifications and responsibilities required in role six months after the operation by age and gender
| Gender and age | Base (All in employment on entry and at six months) | More responsibility | Higher qualification | Higher skills / competencies |
|---|---|---|---|---|
| All | 5,193 | 39% | 23% | 36% |
| Males | 2,600 | 41% | 25% | 38% |
| Females | 2,593 | 37% | 21% | 34% |
| 15-17 | 144 | 62% | 31% | 46% |
| 18-24 | 818 | 53% | 28% | 44% |
| 25-29 | 663 | 44% | 23% | 39% |
| 30-54 | 2,972 | 35% | 22% | 34% |
| 55+ | 595 | 23% | 18% | 28% |
Employed participants reported a range of benefits or improvements to their job prospects compared to their situation on entering the programme. These participants were most likely to report receiving opportunities for training (65 per cent), increased job satisfaction (60 per cent) or improvement to their future pay and promotion prospects (57 per cent). Around half (52 per cent) reported better job security while just under half (45 per cent) said they have received an hourly or annual pay rise over the six month period. Less than one in six (17 per cent) received a promotion over the same time period.
Figure 4.16 Improvements in job prospects at six months compared to programme entry
| Improvements in job prospects at six months compared to programme entry | Percentage |
|---|---|
| More opportunities for training in your job | 65% |
| More job satisfaction | 60% |
| Future pay and promotion prospects improved | 57% |
| Better job security | 52% |
| Hourly pay rate or annual salary increased | 45% |
| Had a promotion | 17% |
| No to all of these improvements or don’t know | 14% |
Base: all in employment on entry and at six months (5,199).
Women were slightly more likely than men to experience more opportunities for training (67 per cent versus 64 per cent) and increased job satisfaction (62 per cent versus 59 per cent) over the six month period. Conversely men were slightly more likely to report improvement in future pay or promotion prospects (61 per cent versus 53 per cent), improved job security (54 per cent versus 49 per cent) or an increase in pay (47 per cent versus 43 per cent).
Younger participants were more likely to report benefits or improved job prospects as a result the programme over the six month period. For example, eight in ten (80 per cent) 15-17 year olds and seven in ten (73 per cent) 18-24 year olds experienced more opportunities for training. This compared to 56 per cent of the least likely leavers by age to experience this; the 55+ year olds. The biggest disparity by age was for improved job security – reported by 72 per cent of 15-17 year olds and 66 per cent of 18-24 year olds, compared to just 37 per cent among 55+ year olds. Similarly most of the younger leavers (71 per cent of 15-17 year olds and 61 per cent of 18-24 year olds) received a pay increase compared to less than a third (31 per cent) of 55+ year olds. The only measure to counter these trends is for promotions which was broadly consistent for those aged 15-17 (22 per cent), 18-24 (25 per cent), 25-29 (25 per cent), and lower for 30-54 year olds (14 per cent) and 55+ year olds (6 per cent).
One in five (20 per cent) participants aged 55+ reported none of the benefits or improvements tested. This compared to 16 per cent of 30-54 year olds, 12 per cent of 25-29 year olds, 8 per cent of 18-24 year olds and 7 per cent of 15-17 year olds.
There were some significant variations in job benefits and prospects across other demographic measures.
- Category of Region: Participants in transitional regions were the least likely to report improved job satisfaction (57 per cent), improved prospects for future pay or promotion (53 per cent), had a pay increase (42 per cent) or had a promotion (17 per cent). They were also more likely to report no benefits (or don’t know) -17 per cent
- disadvantaged: Participants with disadvantaged status were slightly more likely to report increased job satisfaction (62 per cent versus 59 per cent for non-disadvantaged) and improved job security (57 per cent versus 49 per cent). Conversely they were slightly less likely to report receiving a pay increase (42 per cent versus 46 per cent)
- ethnicity: BAME participants were more likely than white participants to cite the following improvements: opportunities for training (71 per cent versus 64 per cent), job satisfaction (67 per cent versus 59 per cent) and better job security (61 per cent versus 50 per cent). BAME participants were also slightly less likely to report no improvements (or answer ‘don’t know’): 10 per cent compared to 15 per cent among white participants.
Among all participants who were in employment at entry, approaching a third (31 per cent) left with an improved labour market situation at six months either because:
- they moved from precarious to stable employment (28 per cent)
- they moved from underemployment to full employment (four per cent)
- their job required higher skills, competencies, qualifications or entailed more responsibility (25 per cent)
- they received a promotion (19 per cent)
One in seven (69 per cent) therefore did not experience one of these improvements at six months. There were no significant differences by gender, disadvantaged or disability status. Participants under 30 were more than twice as likely to have experienced one improvement compared to those aged 55+ (40-42 per cent for those under 30 compared to 16 per cent for 55+ and 28 per cent for 30-54 year olds).
There was also some variation by category of region; 28 per cent of participants in transitional areas experienced at least one improvement compared to 32 per cent in less developed areas and 33 per cent in more developed.
Impact of job outcomes on satisfaction
Individuals with improved labour market situations six months after leaving their course/programme were more satisfied with their experience than those without (90 per cent compared to 85 per cent), although the vast majority of individuals without these improvements were still satisfied.
In line with 2.1 leavers being most likely to express satisfaction with the provision, individuals with an outcome of remaining in work were the most satisfied (87 per cent), implying that in-work skills and support provided through the course/programme were particularly valued. This was followed by individuals who had moved into employment (84 per cent). Nevertheless, around four-fifths of leavers who had moved out of employment (81 per cent) or remained unemployed/inactive (78 per cent) were satisfied.
5. YEI leaver job opportunities
This chapter focuses on job opportunities for YEI leavers; specifically, it explores job offers received during the six months post-programme, and the quality and uptake of these offers. To understand why some YEI leavers who had received job offers were not in work at six months, the characteristics of these job offers is explored. Exploration of job quality also meets specific European Commission requirements for YEI provision outcomes. Due to low bases sizes for some questions, subgroup analysis in this chapter was not always appropriate.
Chapter summary
More than half of YEI leavers received a job offer in the six months following provision. These jobs were usually considered good quality, and the vast majority offered a job went onto accept.
Around a quarter of leavers offered a job were not in employment at six months. Among individuals who had accepted and subsequently left employment, this was most commonly because it was a short term or temporary contract.
Younger YEI leavers - aged 15-17 years old - were the least likely to be offered a job and consider jobs offered to be ‘good’.
Disadvantaged and disabled leavers were less likely to receive a job offer in the six months after leaving provision but offers, when received, were as likely to be considered good quality as job offers received by others.
Job Offers
Around three in five YEI leavers (58 per cent) had received at least one job offer within six months of leaving provision. In keeping with the likelihood of being in employment at six months, the following groups were also less likely to have been offered a job since leaving:
- leavers aged 15-17 on entry (44 per cent);
- disadvantaged leavers (54 versus 68 per cent non-disadvantaged); and
- leavers with a disability or long-term health condition (49 versus 62 per cent without)
As shown in Figure 5.1, around two-fifths (42 per cent) of YEI leavers who had received a job offer within six months of leaving received one offer, half this proportion (21 per cent) received two, and 30 per cent received three or more.
Figure 5.1 Proportion of YEI Leavers with job offers six months after leaving
58% received a job offer in the six months after leaving their course
Base: all YEI leavers (2,213)
| Number of job offers | Percentage |
|---|---|
| Don’t know | 7% |
| 1 | 42% |
| 2 | 21% |
| 3+ | 30% |
| Quality of role | Percentage |
|---|---|
| Very poor | 2% |
| Poor | 5% |
| Reasonable | 26% |
| Good | 35% |
| Very good | 27% |
| Acceptance of offer | Percentage |
|---|---|
| All | 7% |
| Some | 35% |
| None | 57% |
Base: all YEI leavers who received their job offers (1,283)
| Employment status after 6 months | Percentage |
|---|---|
| Inactive | 10% |
| Unemployed | 10% |
| In employment | 80% |
Base: all YEI leavers who accepted a job offer (1,181)
Quality of Job Offers
Around two-thirds (62 per cent) of YEI leavers who were offered job(s) felt the quality of job(s) offered were ‘good’ or ‘very good’, with over a quarter (27 per cent) stating they were ‘very good’. Eight per cent described the quality of job(s) offered as ‘poor’ or ‘very poor’. Older leavers – aged 25-29 - were more likely to describe the job offer(s) as ‘very good’; over a third did (34 per cent) compared to 19 and 26 per cent of 15-17 and 18-24 year olds, respectively. YEI leavers in transitional regions were also significantly more likely than those in more developed regions to describe the job offer(s) as either ‘good’ or ‘very good’ (66 per cent). Despite differing in the likelihood of receiving a job offer at all, there were no significant differences between the proportion of disadvantaged and non-disadvantaged leavers describing the offer(s) as ‘good’ (62 vs 63 percent respectively).
Accepting and leaving jobs
The vast majority (92 per cent) of YEI leavers who received job offers accepted an offer; only seven per cent accepted none.
Leavers who had accepted a job offer but were not in employment six months after leaving their course/programme were asked why this was the case. Most commonly, the individual had been on a short term or temporary contract (25 per cent). Other reasons included it being difficult to travel to (seven per cent); the pay being too low (five per cent), being dismissed and medical reasons (all five per cent).
Table 5.1 Reasons for leaving employment
| Base | 235 |
|---|---|
| % | |
| It was a short term / temporary contract | 25 |
| It was difficult to travel to | 7 |
| The pay was too low | 5 |
| I was dismissed | 5 |
| Medical reasons | 5 |
| It was a part time job but I was looking for a full time job | 4 |
| To pursue further education | 3 |
| I didn’t get on with the other staff | 2 |
| The work I was required to do required a lower level of qualification than I had | 2 |
| There was insufficient training given | 1 |
| Did not get on with employer | 1 |
Nature of Job Offers among the unemployed/inactive
Overall, 24 per cent of YEI leavers who had received at least one job offer were not in employment six months after leaving. To better understand why this was the case, these individuals were asked about:
- type of employment offered (contract type, hours)
- qualifications required, relative to qualifications held
- experience required, relative to experience held
- views on pay
- views on training opportunities
As shown in Figure 5.2, of those YEI Leavers not in employment six months after the end of the course/programme, but who had received at least one job offer, just under a third had been offered a position with stable employment (31 per cent); for over two fifths (43 per cent), some form of precarious employment was offered, almost a fifth with a fixed-term contract (19 per cent). Of those YEI leavers not in employment at the six-month point but who had received job offers, half had received an offer for a full-time position (53 per cent), and 43 per cent for a part-time position. For all YEI leavers offered a part-time position, just under half of them wanted to be working on a full-time basis (48 per cent), and a slightly higher proportion (51 per cent) did not want to be working on a full-time basis.
Figure 5.2 Job offers: type of employment contract and hours
| Type of employment contract | Percentage |
|---|---|
| Precarious employment | 43% |
| Unknown | 26% |
| Stable employment | 31% |
| Job hours | Percentage |
|---|---|
| Full time | 53% |
| Unknown | 4% |
| Part time | 43% |
Base: All YEI leavers who received job offers but unemployed after six months (309)
For most of the YEI leavers not in employment at the 6-month point but who had received a job offer, the job on offer required about the same level of qualification as they then had (53 per cent). A quarter of these YEI leavers said that the job required a lower level of qualification (25 per cent) than what they then had, while 18 per cent said that it required a higher level. In regard to the level of professional experience required, half of YEI leavers said that the job on offer required about the same level of professional experience as what they then had (50 per cent); a third said it required more professional experience (33 per cent); and 15 percent said it required less professional experience.
Figure 5.3 Job offers: qualification and experience level required
| Qualification and experience level | Higher | Lower | The same |
|---|---|---|---|
| Qualification level | 18% | 25% | 53% |
| Experience level required | 33% | 15% | 50% |
Base: all YEI leavers who received job offers but unemployed after six months (309)
Over three quarters of unemployed YEI leavers said they were satisfied with the pay of the job offered (77 per cent) while a fifth (21 per cent) were not satisfied. A similar proportion of leavers (74 per cent) said they were satisfied with the availability of training and skills development possibilities in the job(s) offered, and just over a fifth of respondents said they were not satisfied with this (22 per cent).
6. Conclusions
The ESF programme reached many people who faced labour market disadvantage. A high proportion of those who received assistance through the ESF programme had characteristics typically associated with disadvantage in the labour market (65 per cent were in a jobless household, were a single parent, had no formal qualifications, lacked basic skills, were homeless, were from an ethnic minority or had drug or alcohol dependency). Two-fifths had a disability or long-term health condition.
For many of those assisted, unemployment was an entrenched position. Over half of those who were unemployed were long-term unemployed (aged under 25 and had been looking for work for at least 6 months or 25+ and looking for work for at least 12 months).
Provision was received very positively and views were consistently positive across Investment Priority and CFO. More than eight in ten (82 per cent) were satisfied with their provision and half (46 per cent) were very satisfied. Support with childcare or other care was not widespread. Although a quarter of participants had childcare responsibilities, most were not offered support or assistance with childcare responsibilities (91 per cent). Only a small proportion of participants overall received childcare assistance (four per cent). Eight per cent of participants had caring responsibilities and again most were not offered support with this (88 per cent). However, where it was received, satisfaction was very high.
Improvements in soft-skills were widely reported. Around seven in ten reported improved self-confidence about working, improvement in ability to do things independently, improvement in communication skills and improvement in ability to work in a team.
Participation appears to have greatly increased optimism about finding employment. Eight in ten participants (81 per cent) who were inactive or unemployed at entry reported that the course/programme helped them find a job or make it more likely that they would find work. Just under half said it had helped them a lot.
Half of YEI leavers received a job offer in the six months following provision. These jobs were usually considered good quality, and the vast majority offered a job went onto accept.
Job outcomes were quite common and experienced by a range of leavers. Across the programme as a whole, the proportion of participants in employment increased from 29 per cent on entry to 54 per cent 6 months after leaving (a 25 percentage point increase). For YEI participants this was an increase from 1 per cent on entry to 45 per cent 6 months after leaving.
The job outcome rate was comparable across all CFOs focussing on employability support. The increases seen for HMPPS, DWP and NLCF CFOs and Direct Providers were at around 40 percentage points. The increase was smaller for the ESFA largely because some of their participants were in employment on entry.
Nearly all of those who received in-work support were still in employment 6 months later, a large minority reported progress at 6 months and nearly all reported improved prospects for the future. A third (31 per cent) either moved from precarious to stable employment, moved from underemployment to full-employment, were in a job requiring higher skills, competencies, qualifications or more responsibility or received a promotion. Just under half (45 per cent) of leavers who remained in work experienced a pay increase.
Positive employment outcomes should decrease welfare claimants. Of those on DWP ESF provision, almost all (83%) were in receipt of benefits at the point of entry onto ESF provision. However this proportion fell to 61 per cent at the 6-month point.
There was a slightly unexpected shift of participants from being unemployed at the start of provision to being economically inactive 6 months after leaving. 15 per cent were economically inactive (i.e. in education or training, not working due to health or caring responsibilities, etc.) on entry but this proportion increased to 26 per cent at the 6-month point).
It is not possible for this research to definitively state whether these improvements in job situations would have happened without the receipt of provision funded through ESF. However other research is being conducted as part of the wider ESF evaluation using administrative datasets to provide a counterfactual (i.e. comparing the outcomes of ESF or YEI participants with similarly matched people who did not receive ESF or YEI support) and will provide greater understanding of the impact of provision.
7. Annexes
Appendix A: Technical Appendix
Wider evaluation
The requirement for monitoring and evaluation was stipulated by the European Commission (EC) with the relevant guidance outlining that MAs should ensure that evaluations, including evaluations to assess effectiveness, efficiency and impact, were carried out for each ESF programme.[footnote 21]
The ESF and YEI Leavers Survey provided quantitative metrics required for EC reporting on a range of different outcome measures. The research adds to the body of evidence collected/due to be collected about the operation of the ESF Programme across a number of other strands:
- scoping study for impact evaluation, undertaken to outline the best possible approach to assessing impact
- impact evaluation:
- counterfactual Impact Evaluation using secondary data to quantify the impacts that the Programme has achieved – both at an overall level and at the level of different types of provision and for different sub-groups of participants
- qualitative case study work to provide insight into ‘how’ and ‘why’ outcomes are achieved and also allow some exploration of outcomes that can be harder to pick up through quantitative analysis e.g. where they are ‘softer’ outcomes that represent steps on a journey towards employment or higher-level employment. This part of the project will take the theory-based approach outlined in the scoping study for the impact evaluation. As far as possible this qualitative work will also explore issues relating to the efficiency of delivery and therefore value for money
- Potential Cost Benefit Analysis to supplement qualitative assessment of value for money
Sampling
Sample source
The ESF and YEI Leavers survey sought to speak to individuals who had completed and left provision at least six months prior, and since the start of 2016.
All ESF and YEI providers (or Grant Recipients) were required to record and routinely share individual participant contact details with the DWP to support the monitoring and evaluation. Grant Recipients were asked to supply the following information for each participant:
i. Participant unique identifier
ii. Title
iii. Forename
iv. Surname
v. Address
vi. Postcode
vii. Home phone number
viii. Mobile number
ix. Email address
x. Project ID - Unique project identifier provided by the ESF Managing Authority
xi. Project Title - As defined by the applicant (to help them identify which provision is being referred to)
xii. Project delivery location - LEP area the project is delivered in
xiii. Project delivery partner name - Partner organisation involved in the project
xiv. Date participant leaves provision
All Grant Recipients / providers were asked to quality assure and validate all data prior to sharing with the DWP.[footnote 22] Grant Recipients / providers are expected to supply all the details required, however, if the data is not available for a particular field, the field was left blank.
Grant Recipients were asked to submit the participant contact details - via PGP encrypted email - to the DWP quarterly, including contact details data for all participants who had left provision in the preceding quarter.[footnote 23]
Once received by DWP:
- a representative sample of participant records was drawn from the ESF Eclaims Management Information database and matched to the participant contact detail records submitted to DWP by all Grant Recipients
- PDS MI data was matched the to the contact details separately using the participant unique ID
- participant contact details and matched fields were shared with IFF Research for the purposes of the survey
Sample cleaning and counts
A total of ten sample batches were transferred to IFF Research, covering the pilot stage and 9 subsequent survey waves.
Sample was cleaned and records removed if any of the following applied:
- no address (as unsuitable for mailout)
- ‘unsuitable’ addresses, such as prisons, temporary accommodation, Jobcentre Plus
- no / invalid phone number – where this was the case, their postal address would be used to look up the correct number using a telephone matching service. Where this did not produce a match (i.e. if a record still had no phone number) the record was removed
- the same phone number was provided for more than two records (these were likely to be a school, college, Jobcentre Plus, etc.)
- repeat leaver from previous batch (i.e. included in a previous sample batch due to completion of earlier provision) – this was to avoid respondent fatigue
- repeated leaver within the same batch
- leave date too early (pre-2016) or too late (i.e. they had not reached their six-month point)
Table A.1 shows the overall proportions of sample supplied that were lost through cleaning for each wave. Sample volumes supplied fluctuated each wave due to patterns of sample delivery from providers to DWP. For example, ESFA submits their sample in bulk, causing a big increase in sample volume for Wave 7.
Useable sample does not equate to starting sample for Wave 8 due to sample selection (outlined in the next section) and pre-fieldwork opt outs across all waves. Wave 9 sample was restricted to YEI only prior to cleaning processes; non-YEI sample is excluded from the below table for wave 9.
Table A.1: Proportion of sample lost through cleaning each wave
| Wave | Sample supplied | Useable sample | % lost through cleaning |
|---|---|---|---|
| Pilot | 1,143 | 184 | 84 |
| Wave 1 | 1,338 | 550 | 59 |
| Wave 2 | 1,836 | 1,407 | 23 |
| Wave 3 | 2,806 | 1,598 | 43 |
| Wave 4 | 5,819 | 2,237 | 62 |
| Wave 5 | 5,751 | 1,626 | 72 |
| Wave 6 | 6,533 | 1,519 | 77 |
| Wave 7 | 84,865 | 60,065 | 29 |
| Wave 8 | 229,136 | 125,229 | 45 |
| Wave 9 | 705 | 387 | 45 |
| Total | 339,932 | 194,802 | 43 |
Sample draw
The European Commission laid out clear guidance in terms of how targets for the ESF leavers survey are to be calculated. Targets were set within Investment Priority for each of 48 separate groups which are defined through combinations of the following variables:
- whether or not they meet a disadvantaged definition (two categories – labelled as D and ND)
- whether they are over or under 54 (two categories – labelled as A and U)
- region (3 categories – less developed, more developed and transition – labelled as LR, MR and TR)
- gender (2 categories – labelled as M and F)
- employment status (2 categories – employed and not in employment – labelled as E and NE)
The following sample grid for target-setting has 240 cells (although not all these cells are populated as some groups are not relevant for some IPs, as marked with an X).
This sample grid shows the cells used for target setting based on the sampling criteria described. Starting from the left, the columns show the sampling criteria: Category of Region (3 variables Less Developed, Transition and More Developed); Gender (2 variables Male or Female); Age (3 variables Under 25, 25-54, 55+); Employment Status (3 variables Inactive, Unemployed, Employed) and Disadvantage (2 variables Disadvantaged, Not Disadvantaged). The remaining columns show each of the 6 Investment Priorities covered in the survey (1.1, 1.2, 1.3, 1.4, 1.5 and 2.1), though to note there were no participant records available for 1.5 (Community Led Local Development projects).
Figure A.1: Sample grid for target setting
Region: Less developed
| Gender and age | Employment status (at point of starting provision) | Meet disadvantage criteria | IP 8i: Access to employment | IP 8ii: Sustainable integration of young people | IP 9i: Active inclusion | IP 9vi: Community - led | IP 10iii: Access to Lifelong Learning |
|---|---|---|---|---|---|---|---|
| Male: under 25 | Inactive | Y | |||||
| Male: under 25 | Inactive | N | |||||
| Male: under 25 | Unemployed | Y | |||||
| Male: under 25 | Unemployed | N | |||||
| Male: under 25 | Employed | Y | X | ||||
| Male: under 25 | Employed | N | X | ||||
| Male: 25 to 54 | Inactive | Y | X | ||||
| Male: 25 to 54 | Inactive | N | X | ||||
| Male: 25 to 54 | Unemployed | Y | X | ||||
| Male: 25 to 54 | Unemployed | N | X | ||||
| Male: 25 to 54 | Employed | Y | X | X | |||
| Male: 25 to 54 | Employed | N | X | X | |||
| Male: 55+ | Inactive | Y | X | ||||
| Male: 55+ | Inactive | N | X | ||||
| Male: 55+ | Unemployed | Y | X | ||||
| Male: 55+ | Unemployed | N | X | ||||
| Male: 55+ | Employed | Y | X | X | |||
| Male: 55+ | Employed | N | X | X | |||
| Female: under 25 | Inactive | Y | |||||
| Female: under 25 | Inactive | N | |||||
| Female: under 25 | Unemployed | Y | |||||
| Female: under 25 | Unemployed | N | |||||
| Female: under 25 | Employed | Y | X | ||||
| Female: under 25 | Employed | N | X | ||||
| Female: 25 to 54 | Inactive | Y | X | ||||
| Female: 25 to 54 | Inactive | N | X | ||||
| Female: 25 to 54 | Unemployed | Y | X | ||||
| Female: 25 to 54 | Unemployed | N | X | ||||
| Female: 25 to 54 | Employed | Y | X | X | |||
| Female: 25 to 54 | Employed | N | X | X | |||
| Female: 55+ | Inactive | Y | X | ||||
| Female: 55+ | Inactive | N | X | ||||
| Female: 55+ | Unemployed | Y | X | ||||
| Female: 55+ | Unemployed | N | X | ||||
| Female: 55+ | Employed | Y | X | X | |||
| Female: 55+ | Employed | N | X | X |
Region: Transition
| Gender and age | Employment status (at point of starting provision) | Meet disadvantage criteria | IP 8i: Access to employment | IP 8ii: Sustainable integration of young people | IP 9i: Active inclusion | IP 9vi: Community - led | IP 10iii: Access to Lifelong Learning |
|---|---|---|---|---|---|---|---|
| Male: under 25 | Inactive | Y | |||||
| Male: under 25 | Inactive | N | |||||
| Male: under 25 | Unemployed | Y | |||||
| Male: under 25 | Unemployed | N | |||||
| Male: under 25 | Employed | Y | X | ||||
| Male: under 25 | Employed | N | X | ||||
| Male: 25 to 54 | Inactive | Y | X | ||||
| Male: 25 to 54 | Inactive | N | X | ||||
| Male: 25 to 54 | Unemployed | Y | X | ||||
| Male: 25 to 54 | Unemployed | N | X | ||||
| Male: 25 to 54 | Employed | Y | X | X | |||
| Male: 25 to 54 | Employed | N | X | X | |||
| Male: 55+ | Inactive | Y | X | ||||
| Male: 55+ | Inactive | N | X | ||||
| Male: 55+ | Unemployed | Y | X | ||||
| Male: 55+ | Unemployed | N | X | ||||
| Male: 55+ | Employed | Y | X | X | |||
| Male: 55+ | Employed | N | X | X | |||
| Female: under 25 | Inactive | Y | |||||
| Female: under 25 | Inactive | N | |||||
| Female: under 25 | Unemployed | Y | |||||
| Female: under 25 | Unemployed | N | |||||
| Female: under 25 | Employed | Y | X | ||||
| Female: under 25 | Employed | N | X | ||||
| Female: 25 to 54 | Inactive | Y | X | ||||
| Female: 25 to 54 | Inactive | N | X | ||||
| Female: 25 to 54 | Unemployed | Y | X | ||||
| Female: 25 to 54 | Unemployed | N | X | ||||
| Female: 25 to 54 | Employed | Y | X | X | |||
| Female: 25 to 54 | Employed | N | X | X | |||
| Female: 55+ | Inactive | Y | X | ||||
| Female: 55+ | Inactive | N | X | ||||
| Female: 55+ | Unemployed | Y | X | ||||
| Female: 55+ | Unemployed | N | X | ||||
| Female: 55+ | Employed | Y | X | X | |||
| Female: 55+ | Employed | N | X | X |
Region: More developed
| Gender and age | Employment status (at point of starting provision) | Meet disadvantage criteria | IP 8i: Access to employment | IP 8ii: Sustainable integration of young people | IP 9i: Active inclusion | IP 9vi: Community - led | IP 10iii: Access to Lifelong Learning |
|---|---|---|---|---|---|---|---|
| Male: under 25 | Inactive | Y | |||||
| Male: under 25 | Inactive | N | |||||
| Male: under 25 | Unemployed | Y | |||||
| Male: under 25 | Unemployed | N | |||||
| Male: under 25 | Employed | Y | X | ||||
| Male: under 25 | Employed | N | X | ||||
| Male: 25 to 54 | Inactive | Y | X | ||||
| Male: 25 to 54 | Inactive | N | X | ||||
| Male: 25 to 54 | Unemployed | Y | X | ||||
| Male: 25 to 54 | Unemployed | N | X | ||||
| Male: 25 to 54 | Employed | Y | X | X | |||
| Male: 25 to 54 | Employed | N | X | X | |||
| Male: 55+ | Inactive | Y | X | ||||
| Male: 55+ | Inactive | N | X | ||||
| Male: 55+ | Unemployed | Y | X | ||||
| Male: 55+ | Unemployed | N | X | ||||
| Male: 55+ | Employed | Y | X | X | |||
| Male: 55+ | Employed | N | X | X | |||
| Female: under 25 | Inactive | Y | |||||
| Female: under 25 | Inactive | N | |||||
| Female: under 25 | Unemployed | Y | |||||
| Female: under 25 | Unemployed | N | |||||
| Female: under 25 | Employed | Y | X | ||||
| Female: under 25 | Employed | N | X | ||||
| Female: 25 to 54 | Inactive | Y | X | ||||
| Female: 25 to 54 | Inactive | N | X | ||||
| Female: 25 to 54 | Unemployed | Y | X | ||||
| Female: 25 to 54 | Unemployed | N | X | ||||
| Female: 25 to 54 | Employed | Y | X | X | |||
| Female: 25 to 54 | Employed | N | X | X | |||
| Female: 55+ | Inactive | Y | X | ||||
| Female: 55+ | Inactive | N | X | ||||
| Female: 55+ | Unemployed | Y | X | ||||
| Female: 55+ | Unemployed | N | X | ||||
| Female: 55+ | Employed | Y | X | X | |||
| Female: 55+ | Employed | N | X | X |
In broad terms, the intended approach to sampling was:
- Agree ideal targets for each IP to be achieved over the life of the survey;
- Divide this into quarterly targets on an even basis (so initially dividing by 10 quarters);
- Using these ‘starting targets’ to estimate the proportion of interviews for each IP which are likely to be accounted for by each delivery strand (the 4 main CFOs and the directly funded operations).
- Exploring the delivery patterns anticipated for each CFO and the directly funded operations and adjusting the quarterly pattern of interviewing to account for any delivery strands that will only run for part of the delivery period (or where sample will only be available in infrequent ‘batches’).
- Review the likely distribution of the IP targets by each cell of the full sampling matrix and calculate any necessary adjustments that need to be made to ensure that the targets for demographic sub-groups are met.
- At the point of sampling for each quarter, reviewing the targets for that quarter against the available sample (to highlight any targets that will not be achievable) and adjusting targets for following quarters accordingly;
- At the end of the interviewing period for each quarter, revisiting the targets against achieved interviews and further adjusting the targets for the following quarters if necessary.
However, due to the sample volumes available for the pilot through to wave 7, relative to targets, a census approach was taken for these waves.
The sample draw approach was applied to wave 8, with sample only selected if it applied to an investment priority in which interview targets had not been met. Wave 9 consisted of YEI leavers only and all useable sample available for this IP was drawn.
Opt out process
All useable sample was sent an introductory letter two weeks in advance of fieldwork starting to notify them of the research, its objectives, and giving them an opportunity to opt out via email or by leaving a voicemail message. In total, six per cent of individuals who were contacted opted out of the research before fieldwork started. Table A.2 shows opt outs broken down by wave.
Table A.2: Proportion of sample lost through cleaning each wave
| Wave | Useable / selected sample | Opt outs | % opted out | Starting sample |
|---|---|---|---|---|
| Pilot | 184 | 1 | <1 | 183 |
| Wave 1 | 550 | 45 | 8 | 505 |
| Wave 2 | 1,407 | 86 | 6 | 1,321 |
| Wave 3 | 1,598 | 136 | 8 | 1,462 |
| Wave 4 | 2,237 | 255 | 11 | 1,982 |
| Wave 5 | 1,627 | 79 | 5 | 1,548 |
| Wave 6 | 1,519 | 179 | 12 | 1,340 |
| Wave 7 | 60,065 | 3,369 | 6 | 56,696 |
| Wave 8 | 23,334 | 1,312 | 6 | 22,022 |
| Wave 9 | 387 | 28 | 7 | 359 |
| Total | 92,908 | 5,490 | 6 | 87,418 |
Questionnaire coverage
The questionnaire was designed to address the research objectives and collect the necessary indicator data across the priorities. Table A.3 provides an overview of questionnaire coverage, the full questionnaire is presented in Appendix C.
Table A3: Questionnaire coverage by section
| Section | Coverage of questions |
|---|---|
| Screener | Introducing the survey and confirming eligibility. |
| Section A: Status when started course | What the main activity of the participant was immediately before starting their provision. Details of employment, unemployment, qualification and skills, and benefits claimed (for DWP provision) were also collected. |
| Section B: Experience of the course | Participant support needs (child and other carer responsibilities, disability) and assistance, work-related skills and support gained, and satisfaction with the provision. For YEI leavers, details of traineeships. |
| Section C: Status six months after completing course | What participants were doing six months after completing their provision; details on employment, unemployment, qualification and skills, and benefits claimed (for DWP provision) were also collected. |
| Section D: YEI leavers | Job offers and opportunities in the six months following provision completion, among YEI leavers only. |
| Section E: Demographics information | Capturing information on living situation, six and gender, age, ethnicity, long-term limiting illness (LTLI), and sexual orientation. |
| Section F: Re-contact questions | Whether participants are willing for their responses to be linked to other DWP held administrative records. For YEI leavers in employment at 6-month point, whether they are willing to be to be called back for a 12-month point survey.[footnote 24] |
The questionnaire was tested through piloting and cognitive testing between Thursday 16 February 2017 and Tuesday 28 February 2017. Pilot interviews were completed with 24 individuals, and 19 of these participants went on to take part in a cognitive interview to check engagement, relevance and ease of understanding of the survey.
Status on entry to provision was provided in the sample and checked in the survey. Most survey respondents agreed with their MI status (92 per cent).
Fieldwork
Mainstage fieldwork took place across nine waves between March 2017 and January 2020. The average survey length was 16 minutes.
In total, 19,769 interviews were completed with ESF and YEI leavers across the pilot and mainstage, with an average conversion rate of 23 per cent.
Table A.4 provides breakdown of the fieldwork dates, starting sample, number completes and conversion rates for each wave, while Tables A.5 and A.6 show this broken down by CFO and IP.
Table A.4: Fieldwork dates and conversion rates for each wave
| Wave | Fieldwork dates | Starting sample | Number of completes | Conversion rate (%) |
|---|---|---|---|---|
| Pilot | 16/02/17 – 22/02/17 | 183 | 24 | 13 |
| Wave 1 | 28/03/17 – 27/04/17 | 505 | 90 | 18 |
| Wave 2 | 04/07/17 – 27/08/17 | 1,321 | 324 | 25 |
| Wave 3 | 18/10/17 – 07/12/17 | 1,462 | 310 | 21 |
| Wave 4 | 26/01/18 – 27/03/18 | 1,982 | 283 | 14 |
| Wave 5 | 08/05/18 – 09/06/18 | 1,548 | 203 | 13 |
| Wave 6 | 23/07/18 – 17/09/18 | 1,340 | 201 | 15 |
| Wave 7 | 26/11/18 – 01/05/19 | 56,696 | 14,748 | 26 |
| Wave 8 | 15/07/19 – 31/10/19 | 22,022 | 3,479 | 16 |
| Wave 9 | 06/01/20 – 31/01/20 | 359 | 107 | 30 |
| Total | 87,418 | 19,769 | 23 |
Table A.5: Responses rates each wave, by Investment Priority
| HMPPS: Starting sample | HMPPS: Completed Interviews | HMPPS: Conversion Rate (%) | DWP: Starting sample | DWP: Completed Interviews | DWP: Conversion Rate (%) | Direct provider: Starting sample | Direct provider: Completed Interviews | Direct provider: Conversion Rate (%) | ESFA: Starting sample | ESFA: Completed Interviews | ESFA: Conversion Rate (%) | NLC: Starting sample | NLC: Completed Interviews | NLC: Conversion Rate (%) | |
|---|---|---|---|---|---|---|---|---|---|---|---|---|---|---|---|
| Pilot | 138 | 10 | 7 | - | - | - | 45 | 14 | 31 | - | - | - | - | - | - |
| Wave 1 | 161 | 12 | 7 | - | - | - | 344 | 78 | 23 | - | - | - | - | - | - |
| Wave 2 | 155 | 13 | 8 | - | - | - | 1,166 | 311 | 27 | - | - | - | - | - | - |
| Wave 3 | 368 | 21 | 6 | - | - | - | 1,094 | 289 | 26 | - | - | - | - | - | - |
| Wave 4 | 592 | 21 | 4 | - | - | - | 1,167 | 203 | 17 | - | - | - | 223 | 59 | 26 |
| Wave 5 | 745 | 12 | 2 | - | - | - | 803 | 191 | 24 | - | - | - | - | - | - |
| Wave 6 | 495 | 11 | 2 | - | - | - | 804 | 172 | 21 | 28 | 13 | 46 | 13 | 5 | 38 |
| Wave 7 | 386 | 30 | 8 | 3,707 | 1,593 | 43 | 4,689 | 1,207 | 26 | 46,812 | 11,583 | 25 | 1,109 | 335 | 30 |
| Wave 8 | 1,127 | 156 | 14 | 390 | 119 | 31 | 3,264 | 579 | 18 | 17,241 | 2,625 | 15 | - | - | - |
| Wave 9 | - | - | - | - | - | - | 359 | 107 | 30 | - | - | - | - | - | - |
| Total | 4,160 | 286 | 7 | 4,097 | 1,712 | 42 | 13,735 | 3,151 | 23 | 64,081 | 14,221 | 22 | 1,345 | 399 | 30 |
Table A.6: Responses rates each wave, by Investment Priority
| 1.1: Starting sample | 1.1: Completed Interviews | 1.1: Conversion Rate (%) | 1.2: Starting sample | 1.2: Completed Interviews | 1.2: Conversion Rate (%) | 1.3: Starting sample | 1.3: Completed Interviews | 1.3: Conversion Rate (%) | 1.4: Starting sample | 1.4: Completed Interviews | 1.4: Conversion Rate (%) | 2.1: Starting sample | 2.1: Completed Interviews | 2.1: Conversion Rate (%) | |
|---|---|---|---|---|---|---|---|---|---|---|---|---|---|---|---|
| Pilot | 41 | 12 | 29 | 1 | 0 | 0 | 2 | 2 | 100 | 139 | 10 | 7 | - | - | - |
| Wave 1 | 112 | 35 | 31 | 14 | 0 | 0 | 218 | 43 | 20 | 161 | 12 | 7 | - | - | - |
| Wave 2 | 210 | 62 | 30 | 189 | 65 | 34 | 737 | 181 | 25 | 155 | 13 | 8 | 30 | 3 | 10 |
| Wave 3 | 445 | 127 | 29 | 38 | 13 | 34 | 611 | 149 | 24 | 368 | 21 | 6 | - | - | - |
| Wave 4 | 276 | 45 | 16 | - | - | - | 876 | 153 | 17 | 815 | 80 | 10 | 15 | 5 | 33 |
| Wave 5 | 347 | 59 | 17 | 35 | 11 | 31 | 252 | 69 | 27 | 914 | 64 | 7 | - | - | - |
| Wave 6 | 55 | 17 | 31 | 48 | 13 | 27 | 667 | 142 | 21 | 551 | 26 | 5 | 19 | 3 | 16 |
| Wave 7 | 18,888 | 6,143 | 33 | 7,846 | 1,450 | 18 | 3,269 | 837 | 26 | 4,529 | 1,258 | 28 | 22,781 | 5,060 | 23 |
| Wave 8 | 4,272 | 887 | 21 | 4,853 | 625 | 13 | 3,063 | 530 | 17 | 3,609 | 564 | 16 | 5,608 | 873 | 16 |
| Wave 9 | - | - | - | - | - | - | 359 | 107 | 30 | - | - | - | - | - | - |
| Total | 24,646 | 7,387 | 30 | 13,024 | 2,177 | 17 | 10,054 | 2,213 | 22 | 11,241 | 2,048 | 18 | 28,453 | 5,944 | 22 |
Weighting
Weighting was determined by comparing completes to population counts across the 240 strata cells (as displayed in Figure A.1). YEI sample was further stratified by age, into under 25s and 25 or older. Population was determined by MI data provided for the provision windows aligned with the pilot through to wave 9 (excluding non-YEI populations for wave 9).
“Unassignable” records, i.e. those were strata could not be determined (n=10) were not included in population targets and given a weight of 1 in the data. There were some cells where no interviews were achieved but there was a population; this meant the final weighted total was lower than the overall target population count. Table A.7 shows the final weighting targets and proportions by investment priority.
Table A.7: Proportion of sample lost through cleaning by CFO
| IP | MI population | % of total MI population |
|---|---|---|
| 1.1 | 203,244 | 33.3 |
| 1.2 | 70,054 | 11.5 |
| 1.3 (YEI) | 49,755 | 8.2 |
| 1.4 | 114,570 | 18.8 |
| 2.1 | 172,669 | 28.3 |
| Total | 610,292 | 100.0 |
Appendix B: YEI leavers follow-up survey
To meet European Commission requirements YEI leavers were interviewed twice: firstly six months after leaving the programme (as reported in the main body of this report), and a second, follow-up interview 12 months after leaving programme.
Criteria for inclusion for the 12-month follow-up was:
- YEI leavers who were employed at their six-month point; and
- permission for re-contact at 12 months, given at the end of the six-month survey
The purpose of the survey was to find out what YEI leavers who were in employment at the 6-month point were doing 12 months after leaving their course, primarily to measure the sustainability of their employment outcomes.
Questionnaire coverage
The questionnaire broadly covered the following areas:
- employment status as 12 months
- benefits claimed
- details of employment (contract type, full- versus part-time)
- job satisfaction
- changes in-work (for example, pay, promotion, opportunities)
- reasons for being self-employed, if relevant
- if unemployed, what happened since the six-month survey (for example, details on any education and training)
- overall reflections on the course
Sampling
Of the 2,213 YEI leavers who completed the six-month survey, 1,035 were eligible for the 12-month survey (i.e. were in employment at six-months). 71 per cent of eligible YEI leavers agreed to re-contact for the follow-up (equating to 740 individuals). On agreeing to re-contact, IFF recorded both landline and mobile numbers to use in the follow-up survey, to maximise chances of being able to get hold of individuals.
Fieldwork
A total of 387 follow-up interviews were completed between 31st July 2017 and 6th April 2020. On average, interviews took 11 minutes to complete.
Key findings
The vast majority (85 per cent) of YEI leavers who were employed at six months were still in employment at 12 months; just over three-quarters (77 per cent) were working in the same job role. Most leavers still working (91 per cent) were satisfied with their employment overall.
Nine per cent of YEI leavers previously employed were unemployed at 12 months and six per cent were inactive. Across the unemployed and inactive groups, 11 per cent were not in employment, education or training (NEET). Just under a fifth (18 per cent) of leavers were claiming a benefit at 12 months.
More than four-fifths (83 per cent) of leavers were satisfied with what they had achieved since they were interviewed for the six-month survey.
Appendix C: Questionnaire
This version of the questionnaire has been adapted for publication and excludes screener questions, information provided to the participant about consent and data protection, and questions about re-contact.
Survey respondents will not answer all listed questions as routing is used to remove questions that are not relevant to that participant, for example some questions are only asked to YEI participants. Similarly, any answer categories that are not relevant will not be read out by the interviewer.
Where COURSE is used in a question, the interviewer will refer to the specific ESF or YEI funded support or project that the participant has received or been on.
Section A: Status when starting the course
A1: According to our records, you were employed/ unemployed and actively looking for work / neither working nor actively looking for work. This may have included being in prison, in education or training, or not being able to work through illness or looking after the home, etc]. Is that correct?
- yes, that’s correct
- no, that doesn’t sound right
- not sure
A2: Can you tell me what your main activity was immediately prior to starting the COURSE? If you were doing more than one activity, please just tell me about the activity you consider to have been your main activity. Were you…
- employed, including by a family member
- unemployed and looking for work
- in education or training
- not in employment because of sickness or disability
- working in a voluntary, unpaid role or internship
- looking after the home or family full time
- caring for an adult family member, relative or friend who has any long standing illness, disability or infirmity
- retired and/or claiming a pension / pension credit
- in prison (only read out if the participant is in receipt of HMPPS provision)
- DO NOT READ OUT: Other, please specify
A3: Were you receiving any benefits immediately before starting the COURSE?
- yes
- no
- don’t know
A4: Which type of benefits were you receiving immediately before starting the COURSE. Were you receiving…?
- Universal Credit
- Jobseeker’s Allowance
- Employment and Support Allowance (ESA)
- Incapacity Benefit
- Income Support
- other (write in)
- don’t know
A4a: Were you receiving any benefits immediately before starting the COURSE?
- yes
- no
- don’t know
A4b: Which type of benefits were you receiving immediately before starting the COURSE. Were you receiving…?
- Universal Credit
- Jobseeker’s Allowance
- Employment and Support Allowance (ESA)
- Incapacity Benefit
- Income Support
- other (write in)
- don’t know
A5: Which type of Universal Credit were you receiving immediately before starting the COURSE. Were you receiving…?
- Universal Credit - no work-related requirements group
- Universal Credit - work-focused interview group
- Universal Credit- work preparation group
- Universal Credit - all work-related requirements group
- don’t know
A6: Which of the following types of education or training were you doing immediately before starting the COURSE? Were you…
- in school
- in college full time – 16 hours or more a week
- in college part time – less than 16 hours a week
- on a course whilst in work
- on a traineeship
- (DO NOT READ OUT) In university
- oher (please specify)
- (DO NOT READ OUT) Don’t know
A7: At the time immediately before you started on the COURSE, did you want a regular paid job either full-time or part-time?
- yes
- no
- don’t know
- I already had a job
A8: Which of the following types of employment were you in immediately before starting the COURSE? Were you…
- working for an employer (including family employer) in a paid role
- working in a family business without being paid
- self employed
- on an apprenticeship
- other, please specify
- don’t know
A9: Thinking about this job, was it…
- on a permanent or open-ended contract
- on a fixed-term contract lasting 12 months or longer
- on a fixed-term contract lasting less than 12 months
- on a temporary or casual basis
- a zero hours’ contract
- (DON’T READ OUT) On an open ended contract but of limited duration (i.e. covering the absence of a colleague or covering completion of a fixed task)
- on some other basis (PLEASE SPECIFY)
- (DON’T READ OUT) Don’t know
- (DON’T READ OUT) Refused
A10: And did you consider yourself to be working…
- full time
- or part time
- DO NOT READ OUT: Don’t Know
- DO NOT READ OUT: Refused
A11: How many hours on average did you work per week in this job? Did you work…
- less than 16 hours a week
- between 16 and 39 hours a week
- or 40 or more hours a week
- DO NOT READ OUT: Don’t Know
- DO NOT READ OUT: Refused
A12: You said you were working part-time immediately before you started on the COURSE. At that time, did you want to be working on a full-time basis?
- yes
- no
- don’t know
A13: At the time you started the COURSE, how long had you been out of paid employment and looking for work?
- less than 3 months
- between 3 and less than 6 months
- between 6 and less than 12 months
- between 12 months and less than 2 years
- 2 years or more
- never had a job
- IF DWP: Not applicable
- don’t know
A14: In the period immediately before you started the COURSE, would you say that any of the following problems were making it difficult for you to find work?
- you did not have the right qualifications or skills
- there were few jobs available where you lived
- you had a lack of recent experience of working
- you could not find suitable or affordable childcare
- you had problems with transport or the cost of transport
- you needed to take care of an elderly, ill or disabled friend or relative
- there were issues with your citizenship/visa status
- any criminal convictions
- alcohol dependency
- drugs dependency
- (DO NOT READ OUT) Not applicable
- (DO NOT READ OUT) None of the above
- (DO NOT READ OUT) Don’t know / Refused
A15: It is important for the Department for Work and Pensions to capture equal opportunities information. I am now going to read out a list but please bear in mind that not all, if any, will apply to you. In the period immediately before you started the COURSE, would you say that any of the following problems were making it difficult for you to find work?
- your age counted against you
- you had a disability or problems with your health
- your gender (including gender reassignment) counted against you
- your sexual orientation counted against you
- IF FEMALE: You were pregnant or had a young baby
- your ethnicity or race counted against you
- your religion or belief counted against you
- (DO NOT READ OUT) Not applicable
- (DO NOT READ OUT) None of the above
- (DO NOT READ OUT) Don’t know / Refused
Section B: Experience of the course
B1: At the time you started the COURSE, were you the parent or guardian of any children aged under 18?
- yes
- no
- don’t know
- refused
B2: Thinking about the children aged under 18 for whom you were the parent or guardian, which of the following apply?
- you received childcare support or assistance from PROVIDER NAME?
- you were offered childcare support from PROVIDER NAME but decided not to take this up
- none of the above
- DO NOT READ OUT: Refused
B3: Do you think that without the support you received with your childcare from PROVNAME, you would have faced difficulties attending the COURSE?
- yes
- no
- don’t know
- refused
B4: Overall, were you satisfied with the support provided for childcare responsibilities while you were attending the COURSE (for example, crèche, financial)?
- yes
- no
- don’t know
- refused
B5: [Apart from your children] at the time you started the COURSE did you have any caring responsibilities for either a member of your family, a close relative or a friend suffering from any long term illness, health problem or disability which limited YOUR daily activities or the work YOU could do?
- yes
- no
- don’t know
- refused
B6: Thinking about these caring responsibilities, which of the following apply?
- you received support or assistance for your caring responsibilities from PROVIDER NAME?
- you were offered support for your caring responsibilities from PROVIDER NAME but decided not to take this up
- none of the above
- DO NOT READ OUT: Refused
B7: Do you think that without the support you received with your caring responsibilities from PROVIDER NAME, you would have faced difficulties attending the COURSE?
- yes
- no
- don’t know
- refused
B8: Overall, were you satisfied with the support provided for caring responsibilities while you were attending the COURSE?
- yes
- no
- don’t know
- refused
B9: And still thinking about your situation immediately before starting the COURSE, did you have any physical or mental health conditions or illnesses lasting or expected to last for 12 months or more?
- yes
- no
- don’t know
- refused
B10: Thinking about these health conditions and illnesses, which of the following best reflects your experience on the COURSE?
- you received support or assistance from PROVIDER NAME to help with these needs?
- you were offered support or assistance from PROVIDER NAME to help with these needs but decided not to take this up
- you did not have any specific needs
- none of the above
- DO NOT READ OUT: Refused
B11: Do you think that without the support you received for these needs from PROVIDER NAME, you would have faced difficulties attending the COURSE?
- yes
- no
- don’t know
- refused
B12: Overall, were you satisfied with the support provided for these needs while you were attending the COURSE?
- yes
- no
- don’t know
- refused
B13: I’d now like to move onto some other questions about your experience of the COURSE. First of all, on the whole were you satisfied with the following aspects of the COURSE?
- yes
- no
- don’t know
B14: Regarding the level of difficulty of the COURSE, did you generally find it too easy, too difficult or about right?
- too easy
- too difficult
- about right
- don’t know
B15: Do you think the amount of time you spent on the COURSE was…? / [if HMPPS] Do you think the amount of support you received was…?
- too much
- too little
- or about right
- DO NOT READ OUT: Don’t know
B16: Did the COURSE provide any of the following?
- work experience or a work placement
- general advice about the world of work
- advice or guidance about what sorts of work or training you could do
- training and advice in how to look for work
- contacts to help you look for a job
- information about vacancies that you could try to go for
B17: Has the COURSE helped you improve any of the following…?
Response: YES, NO or Don’t know for each
- your self-confidence about working
- your communication skills
- your ability to work with other people in a team
- your problem solving skills
- your motivation to find a job or seek a promotion
- your motivation to do more training
- your ability to do things independently
B18: Thinking both about the training or support you received and how you may have benefited from it since, overall, how satisfied are you with the COURSE?
- very satisfied
- fairly satisfied
- neither satisfied nor dissatisfied
- fairly dissatisfied
- very dissatisfied
- [DO NOT READ OUT] Don’t know
B19: Would you say that what you learnt on the COURSE has helped you in the work environment? Would you say it…?
- helped a lot
- helped a little
- not helped at all
- (DO NOT READ OUT) Don’t know
B20: Would you say that what you learnt on the COURSE has helped you to get a job or made it more likely you will get a job in the future? Would you say it…?
- helped a lot
- helped a little
- not helped at all
- (DO NOT READ OUT) Don’t know
B21: As part of the COURSE did you do a traineeship? [Asked to YEI participants only]
- yes
- no
- don’t know
B22: I’d like to consider the working conditions you experienced on your traineeship. So this includes things like equipment, working hours, workload and general treatment as a member of staff.
Would you say that, in comparison to other members of staff at your place of work, your working conditions were better, worse, or about the same?
- better
- worse
- about the same
- DO NOT READ OUT: Don’t know
B23: Did you think that the time you spent on the traineeship was too short, too long or was it about right?
- too short
- too long
- about right
- DO NOT READ OUT: Don’t know
B24: To what extent do you feel that the traineeship improved your chances of finding a job?
- to a large extent
- a little extent
- not at all
- DO NOT READ OUT: Don’t know
B25: Thinking both about the work experience you gained on your traineeship as part of your COURSE, and how you have benefited from it since, overall, how satisfied were you with the traineeship?
- very satisfied
- fairly satisfied
- neither satisfied nor dissatisfied
- fairly dissatisfied
- very dissatisfied
- DO NOT READ OUT: Don’t know
Section C: Status 6 months after completing the course
C1: What was your main activity on (INSERT EXACT DATE SIX MONTHS AFTER LEAVING)? If you were doing more than one activity, please just tell me about the activity you consider to have been your main activity. Were you…
- employed, including by a family member
- unemployed and looking for work
- in education or training
- not in employment because of sickness or disability
- working in a voluntary, unpaid role or internship
- looking after the home or family full time
- caring for an adult family member, relative or friend who has any long standing illness, disability or infirmity
- retired and/or claiming a pension / pension credit
- DO NOT READ OUT: In prison
- DO NOT READ OUT: Other, please specify
- DO NOT READ OUT: Don’t know
- DO NOT READ OUT: Can’t remember my activity on that particular date
C2: [ASK THOSE WHO CAN’T RECALL OR ARE UNSURE] Are you able to tell me what your main activity was during (INSERT MONTH SIX MONTHS AFTER LEAVING)? If you were doing more than one activity, please just tell me about the activity you consider to have been your main activity. Were you…
- employed, including by a family member
- unemployed and looking for work
- in education or training
- not in employment because of sickness or disability
- working in a voluntary, unpaid role or internship
- looking after the home or family full time
- caring for an adult family member, relative or friend who has any long standing illness, disability or infirmity
- retired and/or claiming a pension / pension credit
- DO NOT READ OUT: In prison
- DO NOT READ OUT: Other, please specify
- DO NOT READ OUT: Don’t know
C3: Were you receiving any benefits at this point in time?
- yes
- no
- don’t know
C4: Which type of benefits were you receiving?
- Universal Credit
- Jobseeker’s Allowance
- Employment and Support Allowance (ESA)
- Incapacity Benefit
- Income Support
- other (write in)
- don’t know
C5: Which type of Universal Credit were you receiving?
- Universal Credit - no work-related requirements group
- Universal Credit - work-focused interview group
- Universal Credit- work preparation group
- Universal Credit - all work-related requirements group
- don’t know
C6: In which of the following types of employment were you at this point in time?
- working for an employer (including family employer) in a paid role
- working in a family business without being paid
- self employed
- on an apprenticeship
- other (please specify)
- DO NOT READ OUT Don’t know
C7: Which of the following types of education or training were you doing at this point in time?
- in college full time – 16 hours or more a week
- in college part time – less than 16 hours a week
- on a course whilst in work
- on a traineeship
- regular employment
- DO NOT READ OUT: In university
- in school
- other (please specify)
- DO NOT READ OUT: Don’t know
C8: And thinking about the education or training you were doing, is or was it intended to lead to a nationally recognised qualification? [Ask to YEI participants only]
- yes
- no
- don’t know
C9: Thinking about your employment immediately before starting the COURSE compared to six months after, have you changed job role?
- yes
- no
- don’t know
C10: Thinking about your employment immediately before starting the COURSE compared to six months after, have you changed employer?
- yes
- no
- don’t know
C11: Thinking about this job that you had at the six month point, was it…
- on a permanent or open-ended contract
- on a fixed-term contract lasting 12 months or longer
- on a fixed-term contract lasting less than 12 months
- on a temporary or casual basis
- on a zero hours’ contract
- (DON’T READ OUT) On an open ended contract but of limited duration (i.e. covering the absence of a colleague or covering completion of a fixed task)
- on some other basis (PLEASE SPECIFY)
- (DON’T READ OUT) Don’t know
- (DON’T READ OUT) Refused
C12: Thinking about this job that you had at the six month point did you consider yourself to be working…
- full time
- or part time
- DO NOT READ OUT: Don’t Know
- DO NOT READ OUT: Refused
C13: How many hours on average did you work per week in this job? Did you work…
- less than 16 hours a week
- between 16 and 39 hours a week
- or 40 or more hours a week
- DO NOT READ OUT: Don’t Know
- DO NOT READ OUT: Refused
C14: You said you were working part-time at this point in time. At that time, did you want to be working on a full-time basis?
- yes
- no
-
don’t know C15: Thinking about the day to day tasks that you were expected to carry out / carrying out at this point in time compared to what you were expected to do / were doing immediately before starting the COURSE, did they require…
- higher level skills or competencies
- about the same level of skill or competencies
- fewer skills or competencies
- (DO NOT READ OUT) Don’t know
C16: Thinking about the day to day tasks that you were expected to carry out / carrying out six months after completing the COURSE compared to what you were expected to do / were doing immediately before starting the COURSE, did they require…
- a higher level of qualification
- about the same level of qualification
- or a lower level of qualification
- (DO NOT READ OUT) Don’t know
C16a: [IF EMPLOYED BOTH BEFORE AND AFTER THE COURSE] Thinking about the day to day tasks that you were expected to carry out / carrying out six months after you completed the COURSE, compared to what you were expected to do / were doing immediately before starting the COURSE, did you have…
- more responsibility
- about the same level of responsibility
- less responsibility
- don’t know
C17: Compared with the work you were doing immediately before the COURSE, did any of the following apply regarding the work you were doing six months after completing the COURSE?
Response: YES, NO or Don’t know for each
- had you had a promotion?
- had your hourly pay rate or annual salary increased? ADD IF NECESSARY: Please think about how, if at all, your hourly rate has changed
- were you getting more job satisfaction?
- did you have better job security?
- had your future pay and promotion prospects improved?
- did you have more opportunities for training in your job?
Section D: YEI (Youth Employment Initiative) leavers
This section is asked to YEI participants only.
D1: The next set of questions ask about the traineeship you had. I’d like to consider the working conditions you experienced on your traineeship. So this includes things like equipment, working hours, workload and general treatment as a member of staff.
Would you say that, in comparison to other members of staff at your place of work, your working conditions were very similar, fairly similar, fairly different or very different?
- very similar
- fairly similar
- fairly different
- very different
- don’t know
D2: Did you think that the time you spent on the traineeship was…
- too short
- too long
- about right
- (DO NOT READ OUT) Don’t know
D3: To what extent do you feel that the traineeship improved your chances of finding a job?
- to a large extent
- a little extent
- not at all
- DO NOT READ OUT: Don’t know
D4: Thinking both about the work experience you gained on your traineeship, and how you may have benefited from it since, overall, how satisfied are you with the traineeship?
- very satisfied
- fairly satisfied
- neither satisfied nor dissatisfied
- fairly dissatisfied
- very dissatisfied
- DO NOT READ OUT: Don’t know
D5: Did you receive any job offers between starting the COURSE and six months after completing it?
- yes
- no
- don’t know
D6: Including the job offer you would have received for the employment you were in six months after leaving the COURSE, how many job offers did you receive between starting the COURSE and 6 months after?
- 1
- 2
- 3 or more
- don’t know
D7: How would you rate the job offer(s) you received in terms of the quality of that job / those jobs?
- very good
- good
- reasonable
- poor
- very poor
- DO NOT READ OUT: Varied
- DO NOT READ OUT: Don’t know
D8: Including the job offer you would have received for the employment you were in six months after leaving the COURSE, did you accept all or just some of the job offers you received?
- all
- some
- none
- don’t know
D9: Did you accept that job offer / any job offers?
- yes
- no
- don’t know
D10: Why did you leave the last job you had prior to the six month point?
- it was a short term / temporary contract
- it was a part time job but I was looking for a full time job
- the work I was required to do required a lower level of qualification than I had
- there was insufficient training given
- the pay was too low
- it was difficult to travel to
- I didn’t get on with the other staff
- I was dismissed
- medical reasons
- to pursue further education
- other, please specify
- don’t know
D11: Thinking about that job offer you received / this job / (the best job offer out of those you received, was it for a position with…
- a permanent or open-ended contract
- a fixed-term contract lasting 12 months or longer
- a fixed-term contract lasting less than 12 months
- a temporary or casual basis
- a zero hours’ contract
- on some other basis (PLEASE SPECIFY)
- (DON’T READ OUT) Don’t know
- (DON’T READ OUT) Refused
D12: And was it for a …
- full time position
- or a part time position
- DO NOT READ OUT: Don’t Know
- DO NOT READ OUT: Refused
D13: At that time, did you want to be working on a full-time basis?
- yes
- no
- don’t know
D14: Still thinking about that job offer you received, would it have required… / Still thinking about this job, did it require… / Still thinking about the best job offer out of those you received, would it have required…
- a higher level of qualification than you had
- about the same level of qualification
- or a lower level of qualification than you had
- (DO NOT READ OUT) Don’t know
D15: And would it have required… / And did it require…?
- more professional experience than you had
- about the same level of professional experience
- or less professional experience than you had
- (DO NOT READ OUT) Don’t know
D16: Still thinking about that job offer you received / this job / the best job offer out of those you received}, were you satisfied with…
- the pay
- the availability of training/skills development possibilities
Section E: Demographic information
E1: What was your housing situation immediately before starting the COURSE?
- renting privately
- social tenant
- living in own home
- staying with friends or family
- homeless
- in prison
- living in a hostel
- other, please specify
- refused
E2: And did you consider this to be your permanent home or was it temporary accommodation while you completed your studies?
- permanent home
- temporary accommodation
- don’t know
- refused
E3: When you started the COURSE, how many people living in your household were aged 18 and over?
- enter number if given
- don’t know
- refused
E4: And when you started the COURSE, was anybody living in your household…?
- yes
- no
- don’t know
- refused
E5: And before starting the COURSE, was anybody else living in your household employed at that time?
- yes
- no
- refused
E6: Which of the following best describes your legal marital or same-sex civil partnership status immediately before starting the COURSE?
- single
- married
- separated, but still legally married
- divorced
- widowed
- in a registered same-sex civil partnership
- DO NOT READ OUT: Other
- DO NOT READ OUT: Refused
E7: At the time of starting the COURSE, did you have…?
- ALL EXCEPT THOSE IN PRISON & PROBATION SERVICE PROVISION: Any criminal convictions
- alcohol dependency
- drugs dependency
- (DO NOT READ OUT) None of the above
- (DO NOT READ OUT) Don’t know / Refused
E8: Which of the following best describes your ethnic background?
- WHITE English/Welsh/Scottish/Northern Irish/British
- WHITE Irish
- WHITE Gypsy, Irish Traveller or Roma
- WHITE Other background, please specify
- MIXED White and Black Caribbean
- MIXED White and Black African
- MIXED White and Asian
- MIXED Other mixed background, please specify
- BLACK/ AFRICAN/ CARIBBEAN OR BLACK BRITISH Caribbean
- BLACK/ AFRICAN/ CARIBBEAN OR BLACK BRITISH African
- BLACK/ AFRICAN/ CARIBBEAN OR BLACK BRITISH Other background, please specify
- ASIAN OR ASIAN BRITISH Indian
- ASIAN OR ASIAN BRITISH Pakistani
- ASIAN OR ASIAN BRITISH Bangladeshi
- ASIAN OR ASIAN BRITISH Chinese
- ASIAN OR ASIAN BRITISH Other background, please specify
- OTHER ETHNIC BACKGROUND Arab
- OTHER ETHNIC BACKGROUND Other background, please specify
- DO NOT READ OUT: Don’t know / Refused
E9: What is your religion or belief?
- no religion or belief
- Christian (including Church of England, Catholic, Protestant and all other Christian denominations)
- Buddhist
- Hindu
- Jewish
- Muslim
- Sikh
- any other religion or belief, please describe
- refused
E10: At birth were you described as…?
- maale
- female
- intersex
- prefer not to say
E11: And immediately before starting the COURSE which of the following describes how you thought of yourself?
- male
- female
- in another way (Please specify)
- prefer not to say
E12: At any stage during the time on your COURSE were you pregnant or on maternity leave?
- yes
- no
- prefer not to say
E13: I will now read out a list of terms people sometimes use to describe how they think of themselves. Which of the following best describes you?
- Heterosexual or Straight
- Gay or Lesbian
- Bisexual
- other
- don’t know
- refused
Appendix D: Direct Provider provision
The following is a list of all Direct Providers of ESF provision:
- Action West London
- Activate Learning
- Active Humber
- Activfirst
- Adult Education Service
- Advance Personnal Management
- Advance Personnel Management
- Adviza
- Alt Valley
- Ashram Moseley
- Aspire IGEN Bradford College
- Athena Aspire
- ATN
- Autism Hampshire
- AutismTogether
- Beechwood
- Belong
- Bestwood Partnership
- BETA Pathways
- Better Pathways
- Big Help
- Birmingham Careers Service
- Birmingham Youth Service
- Bodster Equine
- Bridges Community Trust
- Business in the Community
- Calderdale College
- Castle Cavendish Foundation
- Catch 22
- Catcote Academy
- Centrepoint
- Cert
- CITC
- Citizens Advice
- City College Nottingham
- CLEAR
- Cleveland Fire Authority
- Community Campus 88
- Community Recording Studio
- Commutual
- Construction Works
- Core Assets
- Cornwall College
- Cornwall Neighbourhoods for Change (CN4C)
- Coventry & Warwickshire Chamber of Commerce Training (CWCCT)
- CPO Media
- Crawford House
- CRIS
- Crosby Training
- Dame Kelly Holmes Trust
- Darlington Borough Council
- Darlington Citizens Advice Bureau
- Derby Business College Limited
- Dinton Pastures - Elevate Wokingham
- Direct Project
- DISC
- Double T Development Ltd
- Dudley
- Durhamworks
- East Riding of Yorkshire Council
- EDT
- Elevate
- Ellingham
- Empleo Community Interest Company
- Employment Solutions
- Empower
- EmpSol
- Equivision Limited
- Everton ITC
- Five Lamps
- Foresight
- FROG
- Fusion Paddock Partnership
- Get Set
- Giroscope
- Goodwin Development Trust
- Greenbank
- Groundwork
- Halton Borough Council
- Hartlepool Borough Council
- Hartlepool NDC Trust
- HBC
- Hull Business Training
- Hull City Council Springboard
- Hull College
- Hull Training
- Humber Sports Partnership
- HYA Training
- ITEC North East
- JobCentre Plus (Southampton)
- Kirklees College
- Knowsley Mbc
- Knowsley Metropolitan Borough Council
- Learn By Design
- Learning Links
- Leeds City College
- Leeds College Of Building
- Leicester Employment Hub
- Life
- Liverpool City Council
- Liverpool Mutual Homes
- LMH
- LocalSolutions
- London Training & Employment Network
- LYST
- Meadows Partnership Trust
- Mencap
- Merseyside Youth Association
- MFC Foundation
- Middlesbrough College
- Middlesbrough Community Learning (MCLS)
- Midland Group Training Services
- Motiv 9
- MPH Training
- MyGo
- National Safety Training Services
- NEET Prevention
- Neighbourhood Services Company
- New Challenge
- Newground
- Newquay Orchard
- NG7 Training Employment Advice
- NH Motor Trades GTA
- NHS
- NLRCO
- NNYS Futures
- North East Lincs Council
- North Lincs Council
- North Liverpool Regeneration Company (NLRCO)
- Northumberland County Council
- Nottingham and Nottinghamshire Refugee Forum
- Nottingham City Council
- Nottingham Gets to Work
- Nottinghamshire Healthcare
- NSC
- NSCATW
- OFCA
- Ongo Communities
- Open Sight
- Optalis
- Paddington Development Trust
- PBIC
- People Plus
- PET-XI
- Phoenix
- PIP
- Pluss
- Portsmouth City Council (City Deal)
- Princes Trust
- Probe (Hull)
- Prospects
- Queen Alexandra College
- Radian
- Raise
- Redbridge CVS
- Redcar & Cleveland Borough Council
- Redcar College
- Resources North East
- Right Track Social Enterprise Ltd
- Roberts Centre
- Rotunda
- SAFE
- Saints Foundation
- Sandwell
- Sefton Council
- Sefton EBP
- Sefton Metropolitan Borough Council
- SeftonEBP
- Skills 4 Communities
- Skills 4 Growth Project Management Function
- Skills 4 Growth Project Procurement
- Solent Local Enterprise
- Solent Youth Action
- Solihull Metropolitan Borough Council
- Southampton City Council
- SOVA
- Springboard
- St Helens Chamber
- St Helens Metropolitan Borough Council
- St. Basils
- Standguide
- Starfish
- Status Employment
- Stockton Borough Council
- Stockton Riverside College Group
- Successful Mums
- Switch Up CIC
- Talent Match
- Tees Valley Sport
- The Citizens Trust
- The Junction
- The Pioneer Group
- The Prince`s Trust
- The Warren
- The Women`s Organisation
- Together Housing Group
- Tomorrow`s People
- Train2Work
- Transformation Cornwall
- Trident
- University Hospital Birmingham
- Urban Partnership Group (UPG)
- Vectis Housing Association
- VNC
- Vulcan Learning Centre
- Wakefield College
- Walsall
- Ways into Work
- West Berkshire Training Consortium
- Wheatsheaf Trust
- Wirral Metropolitan Borough Council
- WM Morrison Trust
- Wolverhampton
- Work Works Training Solutions
- Worksafe Health & Safety Training
- York College
- YOU Trust
- Youth Federation
- Youth Options
- YPC
-
See glossary for definition of ‘jobless household’ ↩
-
See glossary for definition of ‘basic skills’ ↩
-
Under the Youth Guarantee, Member States should put in place measures to ensure that young people up to the age of 25 receive a good quality offer of employment, continued education, an apprenticeship or a traineeship within four months of leaving school or becoming unemployed. ↩
-
The European Structural and Investment Funds (ESIFs) are the European Union’s main funding programmes for supporting growth and jobs across EU member states. ↩
-
European Social Fund England Operational Programme 2014-2020 ↩
-
Under the Youth Guarantee, Member States should put in place measures to ensure that young people up to the age of 25 receive a good quality offer of employment, continued education, an apprenticeship or a traineeship within four months of leaving school or becoming unemployed. ↩
-
See glossary for the definition of ‘wrap around support’.. ↩
-
These long-term indicators are a European Commission requirement. ↩
-
Sample volumes supplied fluctuated each wave due to patterns of sample delivery from providers to DWP. For example, ESFA did not submit the bulk of their sample to DWP until XXX, causing a big increase in sample volume for Wave 7. ↩
-
Further details on this YEI leaver follow-up survey can be found in Appendix B. ↩
-
The leaving dates for YEI participants included in the survey were extended to increase survey volumes. ↩
-
See European Commission, Output and result indicator definitions guidance for the European Social Fund ↩
-
See glossary for definition of ‘jobless household’ ↩
-
See glossary for definition of ‘basic skills’ ↩
-
One per cent of YEI leavers stated that they were employed on provision entry. As unemployment was a criteria for YEI provision, this could indicate either individuals providing inaccurate information on entry to provision, finding work between referral and the start of provision, or human error within the survey. ↩
-
See glossary for the definitions of each ‘category of region’ ↩
-
Note that the volume of YEI only participants in employment was too low to report on this audience in isolation (n=25). As unemployment was a criteria for YEI provision, this could indicate either individuals providing inaccurate information on entry to provision, finding work between referral and the start of provision, or human error within the survey. ↩
-
One per cent refused at this question ↩
-
This and subsequent traineeship questions were only asked to YEI leavers. ↩
-
As the proportion of YEI participants in employment throughout the programme is very small, subgroup analysis is not possible ↩
-
Data quality is the responsibility of Grant Recipients. ↩
-
That is those participants who have a ‘leave date’ in the MI participant data schema (PDS) data submitted for that quarter. We do not require contact details for all participants on provision every quarter. ↩
-
Further details on this YEI leaver follow-up survey can be found in Appendix B. ↩