Ethnicity pay gap report: 1 April 2024 to 31 March 2025
Published 30 March 2026

© Crown copyright 2026
This publication is licensed under the terms of the Open Government Licence v3.0 except where otherwise stated. To view this licence, visit nationalarchives.gov.uk/doc/open-government-licence/version/3 or write to the Information Policy Team, The National Archives, Kew, London TW9 4DU, or email: psi@nationalarchives.gov.uk.
Where we have identified any third party copyright information you will need to obtain permission from the copyright holders concerned.
This publication is available at https://www.gov.uk/government/publications/ethnicity-pay-gap-report-2024-to-2025/ethnicity-pay-gap-report-1-april-2024-to-31-march-2025
Executive summary
The CMA began voluntarily reporting on its ethnicity pay gaps (EPG) in March 2021, covering the period of 1 April 2019 to 31 March 2020. Since 2021, the CMA has reported on EPG using guidance set out by the by the Department for Business and Trade (DBT) and the Commission on Race and Ethnic Disparities (CRED). This report sets out the Competition and Market Authority’s (CMA) EPG for the period 1 April 2024 to 31 March 2025 (2024 to 2025).
For 2024 to 2025, a common methodology for EPG reporting has been implemented across all Civil Service departments. The CMA report for this year has therefore changed to align with the common methodology for EPG. The main difference is a move away from a single comparative measure for EPG for example, where all ethnic minority groups are combined and compared to White employees. This change has meant that the CMA cannot make like for like comparisons between some of the figures provided in this 2024 to 2025 EPG report and those provided in the 2023 to 2024 EPG report, notably in providing single overall EPG figures.
Earnings pay gap
The ethnicity earnings pay gap (previously referred to as the ordinary pay gap) compares the average (mean or median) hourly earnings of one ethnic minority group against another. As all ethnic groups are no longer combined, a single overall figure is no longer provided, but the median and mean earnings pay gap for each ethnic group against White employees are summarised below.
Median earning gap
| Ethnic group | 2024 to 2025 | 2023 to 2024 | 2022 to 2023 |
|---|---|---|---|
| Asian | 21.1% | 25.8% | 32.5% |
| Black | 29.7% | 36.3% | 32.7% |
| Mixed | 5.0% | 19.4% | 28.2% |
| Other | N/A | -15.4% | -26.7% |
Mean earnings gap
| Ethnic group | 2024 to 2025 | 2023 to 2024 | 2022 to 2023 |
|---|---|---|---|
| Asian | 21.2% | 23.6% | 25.9% |
| Black | 31.1% | 32.6% | 33.4% |
| Mixed | 15.5% | 19.8% | 27.1% |
| Other | N/A | -2.3% | -14.7% |
Positively, all groups have seen a reduction in both the mean and median earnings pay gap to last year’s report, noting that the 2024 to 2025 pay gaps for Other have been supressed as the total number of employees in this ethnic group is less than 30. It is noted though that the gaps remain high, for which the main contributing factor is the lack of ethnic minority representation at the senior grades.
Bonus pay gap
The ethnicity bonus pay gap compares the average (mean or median) bonus of one ethnic minority group against another. Once again, as all ethnic groups are no longer combined, it is not possible to provide an overall figure, but the median and mean bonus pay gap for each ethnic group compared to White employees is summarised below.
Median bonus gap
| Ethnic group | 2024 to 2025 | 2023 to 2024 | 2022 to 2023 |
|---|---|---|---|
| Asian | 0% | 0% | 10.0% |
| Black | 0% | 0% | 5.0% |
| Mixed | 0% | 0% | 5.0% |
| Other | N/A | 0% | 5.0% |
Mean bonus gap
| Ethnic group | 2024 to 2025 | 2023 to 2024 | 2022 to 2023 |
|---|---|---|---|
| Asian | 36.6% | 34.0% | 43.1% |
| Black | 42.6% | 49.5% | 47.3% |
| Mixed | 40.8% | 43.9% | 48.8% |
| Other | N/A | -28.5% | 42.9% |
Positively, the median bonus pay gap for each minority ethnicity group has remained at zero and we have seen a reduction in the mean bonus pay gaps for our Black and Mixed ethnic groups. However, the mean bonus gap has increased for our Asian ethnic group, compared to last year’s report. Once again, the main contributing factor to the mean bonus gaps is the lack of ethnic minority representation at the more senior grades given the bonus arrangement for more senior employees.
Targeted action (contributing to the 2025 figures)
We continued to deliver against the final year of our 2020 – 2024 EDI Strategy, which as per the actions set out in the CMA 2023 to 2024 EPG report focused on strengthening our representation, ensuring more inclusive hiring, and supporting progression and retention – all considered to be key drivers in reducing our ethnicity pay gap. In particular, we note that at 31 March 2025 we had exceeded our ambition of 15.8% of all colleagues being from an ethnic minority background, and had improved SCS representation. We recognise though that we still remain under-represented overall at the G6 and SCS level.
Introduction
EPG are a measure of the difference between ethnic groups’ average earnings across an organisation (or the labour market) over a period of time, regardless of role or seniority. Whilst there is currently no statutory requirement to publish EPG, the CMA has voluntarily published since 2021, initially covering the period of 1 April 2019 to 31 March 2020. This report sets out the Competition and Market Authority’s (CMA) EPG for the period 1 April 2024 to 31 March 2025 (2024 to 2025).
Since 2021, the CMA has reported on EPG using guidance set out by the by the Department for Business and Trade (DBT) and the Commission on Race and Ethnic Disparities (CRED). However, for 2024 to 2025, a common methodology for EPG reporting has been implemented across all Civil Service departments. The methodology provides departments with a more detailed way of viewing the ethnicity pay and bonus gaps, whereby figures are based on comparing a ‘Focal group’ with a ‘Comparator group’, showing how each ethnic group compares to each other, rather than grouping all ethnic groups and comparing these as a whole against the ‘White’ group.
This change has meant that the CMA cannot make like for like comparisons between some of the figures provided in this 2024 to 2025 EPG report and those provided in the 2023 to 2024 EPG report.
The ethnicity pay gap is different to equal pay. Equal pay deals with the pay differences between ethnic groups who carry out the same jobs, similar jobs or work of equal value. It is unlawful to pay people unequally because of their ethnicity.
The CMA supports the fair treatment and reward of all employees irrespective of ethnicity.
Organisational context
The CMA is an independent non-ministerial UK Government department and is the UK’s primary competition and consumer protection authority, with a clear purpose to promote competition and protect consumers with a clear end goal – to drive economic growth and improve household prosperity.
Our Equality, Diversity and Inclusion Strategy 2020 to 2024 describes how equality, diversity and inclusion are essential to the way that we operate, both as the UK’s competition authority and as an employer. To deliver our strategy, we developed a series of action plans. Our final action plan (2022 to 2024) focussed on 5 key themes:
- recruitment and ‘growing our own’
- career progression and development
- improving senior representation
- pay and reward
- promoting a culture of inclusivity
We have published reviews of our progress against our strategy, objectives and action plans in April 2021, September 2022 and October 2024 and in July 2025 (in our 2024 to 2025 Annual Report).
The highlights of what have been delivered through these action plans, and how they supported reducing our pay gaps for the reporting period, can be found in the action planning section of this report.
Organisational structure
The number of full-time equivalent (FTE) people employed by the CMA at 31 March 2025 was 1,108.8. For the purpose of the ethnicity pay report though:
-
1,118 employees have been established to be in scope for calculation to determine the mean and median earnings pay gaps, for example, in receipt of full pay on 31 March 2025
-
1,155 employees have been established to be in scope for the calculation to determine the ethnicity mean and median bonus gaps, covering the 12-month period between 1 April 2024 and 31 March 2025
Of the 1,118 employees in scope for the earnings pay gaps, 34 employees were based in Belfast, 35 in Cardiff, 21 in Darlington, 105 in Edinburgh, 849 in London and 74 in Manchester.
The breakdown of grades at 31 March 2025 and the percentage of each ethnic group are shown in the table below (Figure 1).
Figure 1: Break down of percentage of employees in each ethnicity category for each grade
| Civil Service grade | Total | Asian | Black | Mixed | Other | White | Not reported |
|---|---|---|---|---|---|---|---|
| AO | 31 | 32.6% | 16.1% | 6.6% | 0.0% | 38.9% | 5.8% |
| EO | 77 | 26.0% | 13.2% | 3.9% | 0.0% | 51.7% | 5.2% |
| HEO | 205 | 17.5% | 7.2% | 4.2% | 1.5% | 63.0% | 6.6% |
| SEO | 110 | 10.8% | 8.9% | 5.0% | 1.0% | 72.3% | 1.9% |
| Grade 7 | 303 | 15.6% | 4.7% | 4.4% | 1.7% | 70.1% | 3.5% |
| Grade 6 | 254 | 6.4% | 1.6% | 4.4% | 2.3% | 77.0% | 8.4% |
| SCS PB1 | 103 | 8.0% | 0.0% | 1.1% | 0.0% | 84.6% | 6.3% |
| SCS PB2 and PB3 | 35 | 3.2% | 0.0% | 0.0% | 0.0% | 91.8% | 5.0% |
| Total | 1118 | 13.6% | 5.3% | 4.0% | 1.4% | 70.2% | 5.5% |
The tables below show the joiners (Figure 2) and leavers (Figure 3) in the reporting period.
Figure 2: Joiners profile by ethnicity and grade between 1 April 2024 and 31 March 2025
| Civil Service grade | Total | Asian | Black | Mixed | Other | White | Not reported |
|---|---|---|---|---|---|---|---|
| AO | 21 | 42.9% | 4.8% | 9.5% | 4.8% | 38.1% | 0.0% |
| EO | 19 | 15.8% | 21.1% | 0.0% | 0.0% | 57.9% | 5.3% |
| HEO | 40 | 10.0% | 5.0% | 0.0% | 5.0% | 75.0% | 5.0% |
| SEO | 21 | 14.3% | 9.5% | 0.0% | 0.0% | 66.7% | 9.5% |
| Grade 7 | 60 | 15.0% | 10.0% | 5.0% | 0.0% | 68.3% | 1.7% |
| Grade 6 | 28 | 3.6% | 0.0% | 10.7% | 0.0% | 82.1% | 3.6% |
| SCS PB1 | 5 | 20.0% | 0.0% | 0.0% | 0.0% | 80.0% | 0.0% |
| SCS PB2 and PB3 | 7 | 14.3% | 0.0% | 0.0% | 0.0% | 85.7% | 0.0% |
| Total | 201 | 15.4% | 7.5% | 4.0% | 1.5% | 68.2% | 3.5% |
Figure 3: Leavers Profile by ethnicity and grade between 1 April 2024 and 31 March 2025
| Civil Service grade | Total | Asian | Black | Mixed | Other | White | Not reported |
|---|---|---|---|---|---|---|---|
| AO | 22 | 54.5% | 0.0% | 4.5% | 4.5% | 36.4% | 0.0% |
| EO | 4 | 0.0% | 50.0% | 0.0% | 0.0% | 50.0% | 0.0% |
| HEO | 16 | 18.8% | 25.0% | 0.0% | 0.0% | 50.0% | 6.3% |
| SEO | 5 | 20.0% | 0.0% | 0.0% | 0.0% | 80.0% | 0.0% |
| Grade 7 | 44 | 15.9% | 6.8% | 2.3% | 0.0% | 68.2% | 6.8% |
| Grade 6 | 22 | 9.1% | 0.0% | 4.5% | 0.0% | 81.8% | 4.5% |
| SCS PB1 | 16 | 18.8% | 0.0% | 0.0% | 6.3% | 62.5% | 12.5% |
| SCS PB2 and PB3 | 5 | 0.0% | 0.0% | 0.0% | 0.0% | 100.0% | 0.0% |
| Total | 134 | 20.9% | 6.7% | 2.2% | 1.5% | 63.4% | 5.2% |
Ethnicity pay gap report
The measures contained in this report are:
- earnings pay gaps
- bonus pay gaps
- the proportion of each ethnic group who received a bonus; and
- a breakdown of the representation of ethnic groups across the CMA by pay quartile
The pay gap statistics presented in this report use the five ethnic groups aligned with the Government Statistical Service Harmonised Standards for Ethnicity as follows:
- Asian (including Indian, Pakistani, Bangladeshi, Chinese, and other Asian background)
- Black (including Caribbean, African and any other Black background)
- Mixed (White and Black Caribbean, White and Black African, White and Asian, Any other Mixed / Multiple ethnic background)
- White (English, Welsh, Scottish, Northern Irish or British, Irish, Gypsy or Irish Traveller, any other White background)
- Other (Arab or any other ethnic group)
If the headcount for a group is less than 30, all statistics referring to that particular group are suppressed according to Cabinet Office rules which are intended to protect confidentiality and ensure robust reporting. For the 2024 to 2025 report, this applies to our Other ethnic group.
The pay gaps for the ethnic groups are now presented in a pay gap grid, where a ‘focal group’ is compared to a ‘comparator group’. Depending upon which of the groups is selected as the ‘focal group’ and which as the ‘comparator group’, this will result in two different pay gaps for each pair unless the gap is 0%.
- a positive pay gap (% more than zero) indicates that the ‘focal group’ earnings are lower than the ‘comparator group’
- a negative pay gap (% less than zero) indicates that the ‘focal group’ earnings are higher than the ‘comparator group’
Earnings pay gap
The ethnicity earnings pay gap compares the average (mean or median) hourly earnings of one ethnic minority group (a focal group) against another (a comparator group).
The mean pay gap represents the difference between the average hourly pay of each ethnic minority group, whilst the median pay gap represents the difference between the midpoint hourly pay. The median is often considered the most reliable measure, as it is less influenced by very high or very low salaries.
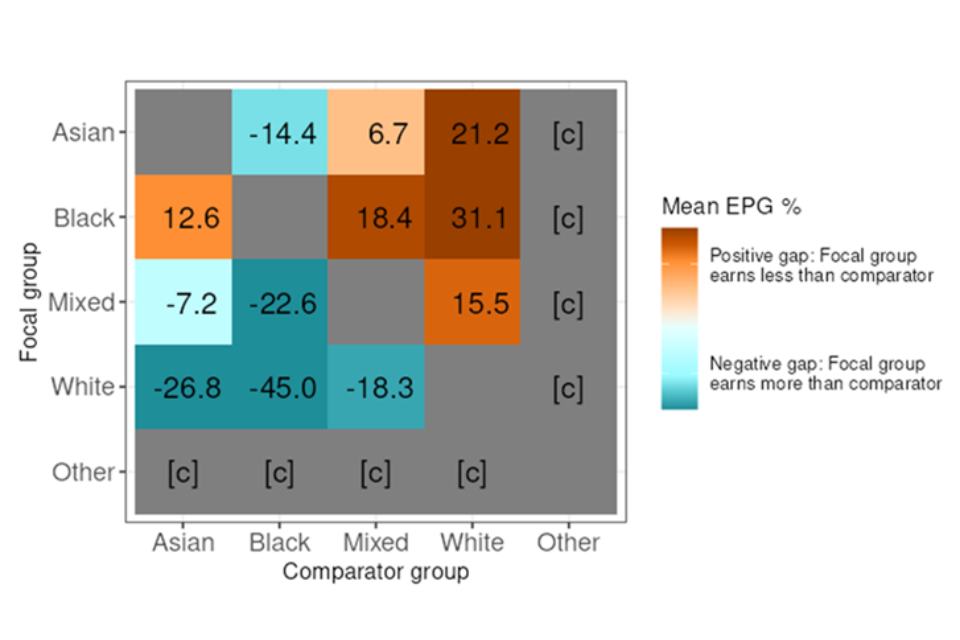
The grids below show the 2024 to 205 median EPG (Figure 4) and mean EPG (Figure 5) in the CMA, which overall show that those who identify as White earn more than any other ethnic group and that those who identify as Black earn less than any other comparator group.
Figure 4: Median Earnings Gap for 2024 to 2025 reporting period
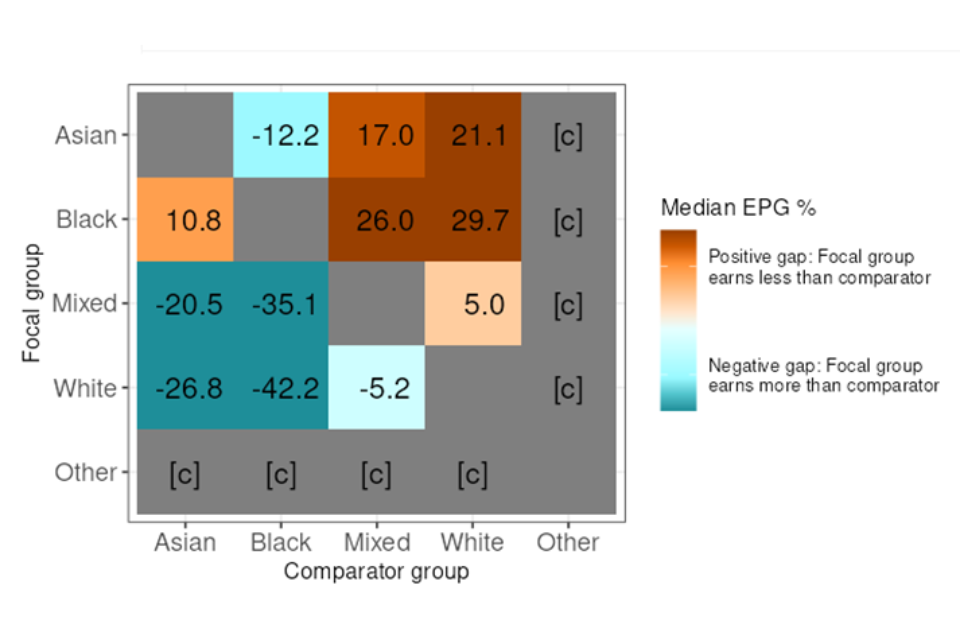
Figure 5: Mean Earnings Gap for 2024 to 2025 reporting period
Previous EPG reports published by the CMA only presented the mean and median EPG for each ethnic minority groups in the CMA against the White comparator group. This comparison is therefore provided in the tables below (Figure 6). The figure for Other is not provided for 2024 to 2025 due to data suppression rules.
Figure 6: Median and mean earnings pay gap for the last 3 reporting periods
Median earnings gap
| Ethnic group | 2024 to 2025 | 2023 to 2024 | 2022 to 2023 |
|---|---|---|---|
| Asian | 21.1% | 25.8% | 32.5% |
| Black | 29.7% | 36.3% | 32.7% |
| Mixed | 5.0% | 19.4% | 28.2% |
| Other | N/A | -15.4% | -26.7% |
Mean earnings gap
| Ethnic group | 2024 to 2025 | 2023 to 2024 | 2022 to 2023 |
|---|---|---|---|
| Asian | 21.2% | 23.6% | 25.9% |
| Black | 31.1% | 32.6% | 33.4% |
| Mixed | 15.5% | 19.8% | 27.1% |
| Other | N/A | -2.3% | -14.7% |
The ethnicity earnings pay gap (previously referred to as the ordinary pay gap) compares the average (mean or median) hourly earnings of one ethnic minority group against another. All ethnic groups are no longer combined so it is not possible to provide an overall figure.
Positively, all groups have seen a reduction in both the mean and median earnings pay gap to last year’s report, noting that the 2024 to 2025 pay gaps for Other have been supressed. It is noted though that the gaps remain high, particularly when compared to the wider Civil Service, which reports median ethnicity earning pay gaps for Asian and Black employees across the Civil Service are at 4.5%, when White is used as the comparator group. The main contributing factor to these gaps in the CMA is the lack of ethnic minority representation at the more senior grades.
Bonus pay gap
Bonus pay, which is also calculated as mean and median, is based on bonus payments paid to employees throughout the 2024 to 2025 financial year.
This calculation may include employees who are not ‘full pay relevant’ but will not include employees who left the CMA before 31 March 2025.
At the CMA, usually bonus pay includes any performance related pay (PRP). These are payments based on performance management outcomes for the previous financial year. In the case of employees in grades AO to Grade 6, these payments are negotiated annually with our recognised trade unions and agreed by the CMA Executive Committee.
For the 2024 to 2025 pay award year, there continued to be no link between individual performance and pay. Instead, in recognition of the continuing high performance across the CMA in that period, we paid a flat non-consolidated payment of £982 to all eligible employees in the December 2024 payroll. To be eligible for the £982 payment, individuals needed to have been in post between 1 January and 31 March 2024 and received a CMA 2023 to 2024 performance rating. In addition, we agreed to make a quarter payment of £245.50 to employees who started between 1 January and 31 March 2024 and were still employed by the CMA on 1 December 2024. This award was included in the bonus payments made during the 2024 to 2025 financial year and is therefore included in the bonus gap calculations.
For SCS employees, there are separate arrangements which are centrally set by government each year. SCS bonuses are included in the bonus calculations and remain the biggest contributor to changes in the bonus gap each year and the mean bonus gap data.
Bonus pay gap
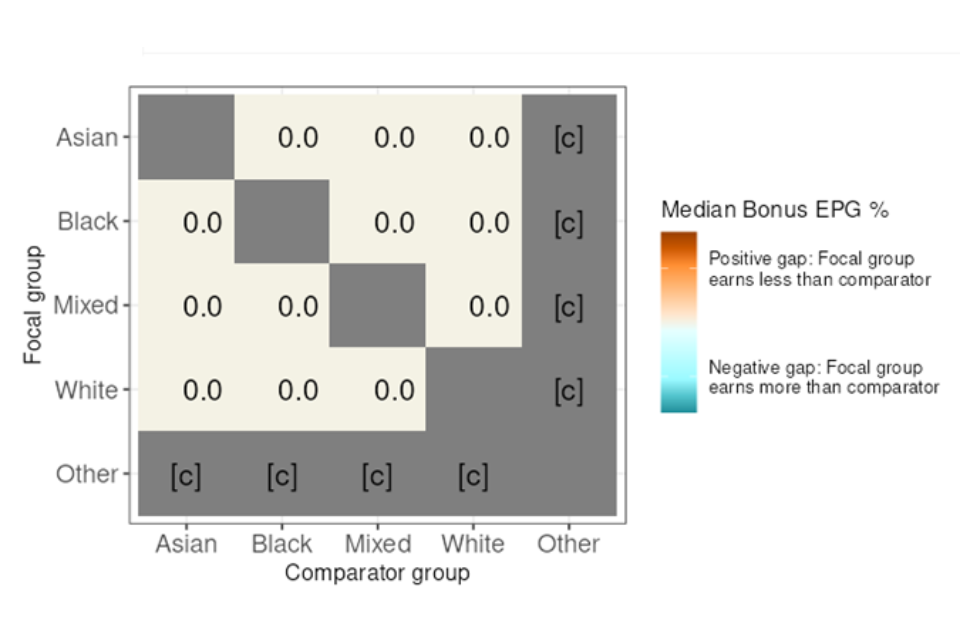
The grid below (Figure 7) shows the 2024 to 2025 median bonus gap. When considering the bonus ethnicity pay gap through this lens, we see that there is a zero difference between each ethnicity group. This is because the majority of our workforce received the same non-consolidated award, which was not differentiated by grade or working hours for junior employees (AO to Grade 6). It is within this cohort where the ‘median’ position is placed. Once again, the median and mean bonus pay gaps for our Other group category has not been provided due to data suppression rules.
Figure 7: Median Bonus Pay Gap for each ethnic group for the 2024 to 2025 reporting period
The grid below (Figure 8) shows the 2024 to 2025 mean bonus gap. When considering the bonus pay gap through this lens, we see a significant difference to that of our median bonus pay gap. However, we see a similar trend to our mean earnings pay gap whereby White employees earn more than employees from each of the minority ethnic groups.
Figure 8: Mean Bonus Pay Gap for each ethnic group for the 2024 to 2025 reporting period
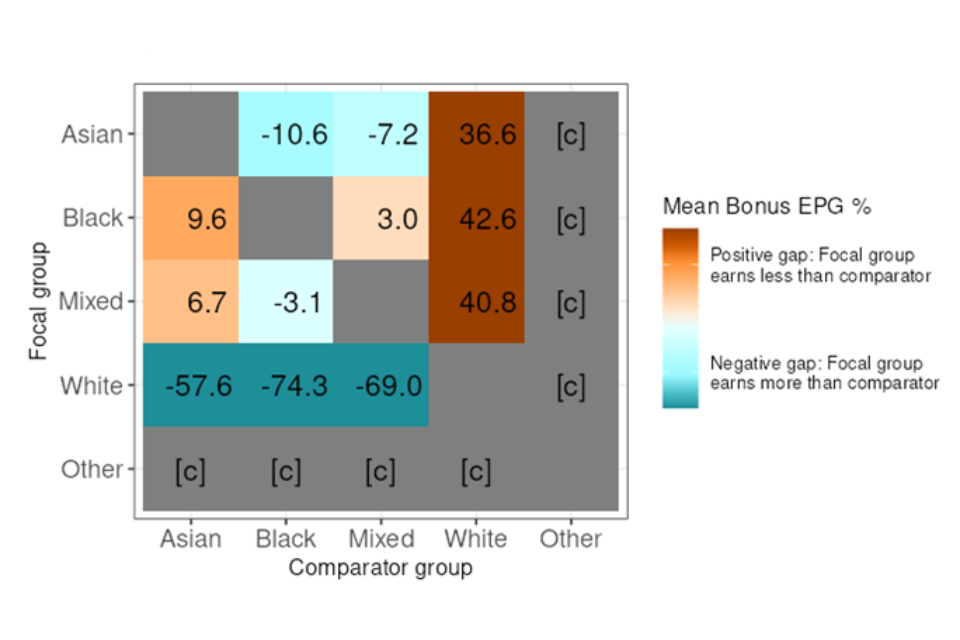
The main contributing factor to the mean bonus gaps is the lack of ethnic minority representation at the more senior grades given the bonus arrangement for more senior employees.
The mean and median bonus pay gap for each ethnic minority groups in the CMA against the White comparator group is provided in the tables below (Figure 9). The figure for Other is not provided for 2024 to 2025 due to data suppression rules.
Positively, the median bonus pay gap for each minority ethnicity group has remained at zero and we have seen a reduction in the mean bonus pay gaps for our Black and Mixed ethnic groups. However, the mean bonus gap has increased for our Asian group, compared to last year’s report. Once again, the main contributing factor to the mean bonus gaps is the lack of ethnic minority representation at the more senior grades given the bonus arrangement for more senior employees.
Figure 9: Median and mean bonus pay gap for the last 3 reporting periods
Median bonus pay gap
| Ethnic group | 2024 to 2025 | 2023 to 2024 | 2022 to 2023 |
|---|---|---|---|
| Asian | 0% | 0% | 10.0% |
| Black | 0% | 0% | 5.0% |
| Mixed | 0% | 0% | 5.0% |
| Other | N/A | 0% | N/A |
Mean bonus pay gap
| Ethnic group | 2024 to 2025 | 2023 to 2024 | 2022 to 2023 |
|---|---|---|---|
| Asian | 36.6% | 34.0% | 43.1% |
| Black | 42.6% | 49.5% | 47.3% |
| Mixed | 40.8% | 43.9% | 48.8% |
| Other | N/A | -28.5% | 42.9% |
Percentage of all ethnic groups receiving a bonus
Overall, 78.5% of all employees received a bonus. The chart below (Figure 10) provides the proportion of each ethnic group that received a bonus.
Figure 10: Proportion of employees in receipt of bonuses
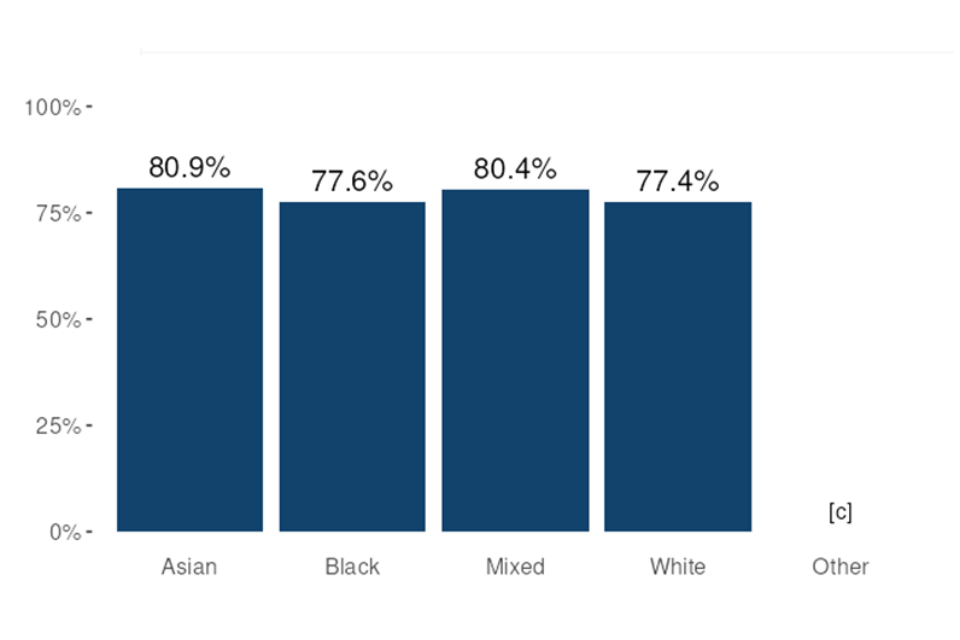
As outlined, 80.9% of Asian employees received a bonus, which was the highest proportion of all ethnic groups. This is closely followed by 80.4% of Mixed employees. 77.6% of Black employees received a bonus. This is closely followed by 77.4% of White employees to receive a bonus, which was the lowest proportion of all ethnic groups. No figure is provided for the Other group category due to data suppression. Whilst the proportions among the ethnic groups do not vary considerably, there are more white employees, particularly at senior grades receiving higher bonuses hence the gaps.
Pay quartiles
The Pay quartiles are the proportion of ethnic minority groups across each of the defined pay quartiles. Quartiles are calculated through ranking all salaries from the highest to the lowest paid and dividing the list into quarters. The chart below (Figure 11) shows the proportions of each ethnic group within each quartile.
Figure 11: Quartile distribution of ethnic minority groups
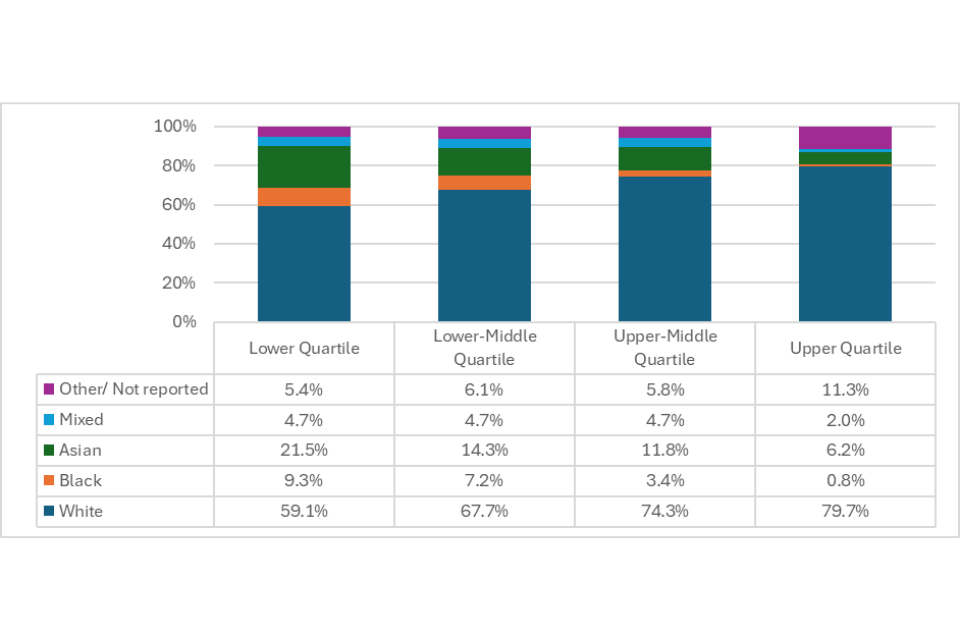
The proportion of White employees within each quartile increases as the quartiles increase, meaning the lowest proportion are within the lower quartile (59.1%) and the highest proportion are within the upper quartile (79.7%).
Conversely, the proportion of Black employees within each quartile reduces as the quartiles increase, meaning the highest proportion are within the lower quartile (9.3%) and the lowest proportion in the upper quartile (0.8%).
We see the same trend for Asian employees, though the proportions are larger within each quartile. The highest proportion are within the lower quartile (21.5%) and the lowest proportion in the upper quartile (6.2%).
Mixed ethnicity employees are evenly distributed (4.7%) within the lower quartile, lower-middle quartile and upper-middle quartile. The lowest proportion is within the upper quartile (2%).
The proportional distribution of Other and Not Reported categories have been combined as the CMA has too few employees (less than 30) within the Other ethnic group for publication. We note that within this combined group, the highest proportion is at upper quartiles (11.3%), while relatively even across the other quartiles.
Ideally, we would like to see the quartile distributions of our ethnic groups more aligned with our overall organisational ethnicity breakdown for example, the totals we see in Figure 1.
Earnings pay gap analysis
In 2024 to 2025 we have seen a reduction compared to 2023 to 2024 in the mean and median pay gaps for all ethnic minority groups when White is used as the comparator group, as shown in the table below (Figure 12).
Figure 12: Earnings pay gap for 2024 to 2025 compared to Ordinary pay gap 2023 to 2024
| Ethnic group | 2024 to 2025 median pay gap | 2024 to 2025 mean pay gap | 2023 to 2024 median pay gap | 2023 to 2024 mean pay gap |
|---|---|---|---|---|
| Asian | 21.1% | 21.2% | 25.8% | 23.6% |
| Black | 29.7% | 31.0% | 36.3% | 32.6% |
| Mixed | 5.0% | 15.5% | 19.4% | 19.8% |
| Other* | 2.8% | N/A | -15.4% | N/A |
*The 2024 to 2025 mean and median pay gap figures are not provided for the Other group category due to data suppression.
The largest decrease in median pay gap is in our Mixed ethnic group (-14.4pp). This is likely due to an increase in representation at G6 and G7 for example, more starters than leavers at these grades. We have seen smaller, but positive decreases in the median pay gap for our Asian (-4.7pp) and Black (-6.6pp) ethnic groups.
The mean pay gap decreases are smaller overall, with the largest decrease seen in the Mixed ethnic group (-4.3pp).
Whilst we have reduced our pay gaps overall, these remain large with the most significant contributing factor being the lack of ethnic minority representation at senior levels.
Ethnic minority representation
Our overall ethnic minority representation at SCS has increased from 5% in 2023 to 2024, to 7.2% in 2024 to 2025 which has supported a reduction in the pay gaps. However, overall, at the SCS level, 86.2% of employees are White, 6.5% are Asian, 0.7% are Mixed, 6.5% are Not Reported, and there is there is no Black or Other representation at the SCS grades. Therefore, whilst we have higher representation of employees from ethnic minority backgrounds at the junior grades, we note that there is still work to be done at improving representation at senior grades.
Earnings pay gap by grade
The median (Figure 13) and mean (Figure 14) pay gaps by grade are shown in the tables below. A direct comparison with the 2023 to 2024 figures cannot be provided due to the change in methodology implemented from 2024 to 2025 detailed in ‘Section 2’. The figures provided use ‘White’ as the comparator ethnic group. No figure is provided for the Other group category due to data suppression.
When considering the mean and median pay gap figures through a grade lens, we see that the differences are generally much smaller than the overall 2024 to 2025 pay gap figures (often less than 2%). For a number of ethnic groups, we have negative pay gaps at many or our grades meaning that the earnings pay for an ethnic minority group is higher than the White comparator group. However, at SCS, we see the lack of ethnic minority representation result in a N/A pay gap at both the Black and Mixed ethnic groups. This imbalance in representation is the key cause of our overall pay gaps.
Figure 13: Median earnings pay gap by Grade (‘White’ as the comparator ethnic group)
| Civil Service grade | Black | Asian | Mixed | Other | Not reported |
|---|---|---|---|---|---|
| AO | 0.0% | 1.4% | 2.7% | N/A* | -5.0% |
| EO | 0.4% | -1.7% | -4.3% | N/A* | 0.4% |
| HEO | -0.1% | -0.1% | -0.1% | N/A* | -3.4% |
| SEO | -3.1% | -0.3% | -4.1% | N/A* | -1.1% |
| Grade 7 | 0.0% | 0.0% | 0.0% | N/A* | -1.5% |
| Grade 6 | -0.7% | -1.8% | 0.0% | N/A* | -6.0% |
| SCS PB1 | N/A* | 4.7% | 12.7% | N/A* | -2.0% |
| SCS PB2 and PB3 | N/A* | -2.5% | N/A* | N/A* | -24.0% |
| Overall | 29.7% | 21.1% | 5.0% | N/A* | -14.3% |
*Where N/A is provided, this is because there is no ethnic group population within the grade, or in the case of Other, we have less than a total of 30 employees overall.
Figure 14: Mean earnings pay gap by Grade (‘White’ as the comparator ethnic group)
| Civil Service grade | Black | Asian | Mixed | Other | Not reported |
|---|---|---|---|---|---|
| AO | -0.4% | -0.1% | 1.8% | N/A* | -6.0% |
| EO | 1.9% | 0.5% | -3.6% | N/A* | 1.9% |
| HEO | -2.6% | -1.2% | -0.1% | N/A* | -3.7% |
| SEO | -0.8% | 0.3% | -2.1% | N/A* | 1.0% |
| Grade 7 | 0.3% | 0.1% | 0.3% | N/A* | -0.7% |
| Grade 6 | -1.3% | 1.4% | 1.6% | N/A* | -3.9% |
| SCS PB1 | N/A* | 4.6% | 11.4% | N/A* | 0.4% |
| SCS PB2 and PB3 | N/A* | -1.4% | N/A* | N/A* | -22.7% |
| Overall | 31.0% | 21.2% | 15.5% | N/A* | -3.6% |
*Where N/A is provided, this is because there is no ethnic group population within the grade, or in the case of Other, we have less than a total of 30 employees overall.
Bonus pay gap analysis
In 2024 to 2025, the median bonus pay gap for each minority ethnicity group has remained at zero. Also positively, we have seen a reduction in the mean bonus pay gaps for our Black (-6.9pp) and Mixed (-3.1pp) ethnic groups. However, the mean bonus gap has increased for our Asian group (+2.6pp). These changes are likely to have been impacted by the application of our SCS bonus pay, for which we differentiated the award values based on grade this year, which was not the case in 2023 to 2024.
The table below (Figure 15) compares the pay gaps for 2023 to 2024 and 2024 to 2025, using White as the comparator group to align with our 2023 to 2024 pay gap analysis.
Figure 15: Bonus pay gap for 2024 to 2025 compared to 2023 to 2024
| Ethnic group | 2024 to 2025 median bonus pay gap | 2024 to 2025 mean bonus pay gap | 2023 to 2024 median bonus pay gap | 2023 to 2024 mean bonus pay gap |
|---|---|---|---|---|
| Asian | 0.0% | 36.6% | 0.0% | 34.0% |
| Black | 0.0% | 42.6% | 0.0% | 49.5% |
| Mixed | 0.0% | 40.8% | 0.0% | 43.9% |
| Other* | N/A | N/A | N/A | N/A |
*The 2024 to 2025 mean and median pay gap figures are not provided for Other category due to data suppression.
Bonus gaps by grade
The median (Figure 16) and mean (Figure 17) bonus pay gaps by grade are shown in the tables below. The figures provided use ‘White’ as the comparator ethnic group. No figure is provided for the Other group category due to data suppression. A direct comparison with the 2023 to 2024 figures cannot be provided due to the change in methodology implemented from 2024 to 2025 detailed in ‘Section 2’
Figure 16: Median bonus pay gap by grade
| Civil service grade | Black | Asian | Mixed | Other | Not reported |
|---|---|---|---|---|---|
| AO | 0.0% | 0.0% | N/A* | N/A* | 0.0% |
| EO | 0.0% | 0.0% | 0.0% | N/A* | 0.0% |
| HEO | 0.0% | 0.0% | 0.0% | N/A* | 0.0% |
| SEO | 0.0% | 0.0% | 0.0% | N/A* | N/A* |
| Grade 7 | 0.0% | 0.0% | 0.0% | N/A* | 0.0% |
| Grade 6 | 0.0% | 0.0% | 0.0% | N/A* | 0.0% |
| SCS PB1 | N/A* | 86.8% | 86.8% | N/A* | 0.0% |
| SCS PB2 and PB3 | N/A* | N/A* | N/A* | N/A* | -24.1% |
| Overall | 0.0% | 0.0% | 0.0% | N/A* | 0.0% |
*Where N/A is provided, this is because there is no ethnic group population within the grade, or in the case of Other, we have less than a total of 30 employees overall.
Figure 17: Mean bonus pay gap by grade
| Civil service grade | Black | Asian | Mixed | Other | Not reported |
|---|---|---|---|---|---|
| AO | 10.3% | 10.3% | N/A* | N/A* | -10.3% |
| EO | -2.5% | -2.5% | -2.5% | N/A* | 23.1% |
| HEO | 4.6% | -3.1% | -7.9% | N/A* | -1.1% |
| SEO | -12.8% | -12.8% | -12.8% | N/A* | N/A |
| Grade 7 | -2.8% | 2.7% | 4.9% | N/A* | 4.2% |
| Grade 6 | -1.3% | 3.2% | -1.6% | N/A* | -1.3% |
| SCS PB1 | N/A* | 42.4% | 85.3% | N/A* | 27.2% |
| SCS PB2 and PB3 | N/A* | N/A* | N/A* | N/A* | -27.3% |
| Overall | 42.6% | 36.6% | 40.8% | N/A* | 4.8% |
*Where N/A is provided, this is because there is no ethnic group population within the grade, or in the case of Other, we have less than a total of 30 employees overall.
When considering the bonus pay gap figures through a grade lens, the differences we see within the AO to G6 grades are largely influenced by headcount of the grade cohort and the proportion of employees, within each ethnic group, who received a ‘quarter payment’ of £245.50 instead of a full non-consolidated performance award of £982.
At the SCS grades, the main influence on the bonus pay gaps is the low representation of ethnic minorities. We also have employees within this cohort who were not eligible for an SCS performance award but did receive the £982 performance award due to temp promotion arrangements. This organisational award is significantly lower than the mean bonus figure of £7,950.37 for all SCS.
Targeted action
In 2023 to 2024 we set out a number of actions that would help us to reduce our pay gaps across 2024 to 2025, which were:
Committing to being a diverse and inclusive organisation
2023 to 2024 action: We will communicate to the organisation our ambitions for diversity representation, across women, ethnic minorities, black, disability and our Lesbian, Gay, Bisexual, Other (LGBO) community, for grades AO to G6 and SCS. The ambitions have been centrally set using the UK Census (2021) and we will track progress quarterly.
In 2024 to 2025, we shared our ambitions, with the organisation and we use our diversity dashboard to measure and report quarterly on our representation, including ethnic minorities for grades AO to G6 and SCS. Our ambitions are internal goals to build stronger representation particularly in our SCS and G6 to G7 pipelines.
In particular, we note that at 31 March 2025 we had exceeded our ambition of 15.8% of our colleagues being from an ethnic minority at grades AO to G7, and improved SCS representation, recognising that we still remained under-represented overall at the G6 and SCS level.
Reviewing our end-to-end recruitment process
2023 to 2024 action: It is important to us that we ensure our recruitment process is inclusive and therefore we will commission an external review of all our recruitment processes.
In 2024 to 2025, we commissioned an Inclusivity Diagnostic on the impact of our hiring processes through 9 candidate diversity lenses. The review included qualitative analysis, user feedback and candidate impact research, and provided a set of actionable recommendations based on best practice from industry and academic research.
In response to the feedback, we have developed new interactive candidate packs which share more information on the CMA, the role being recruited to, and the benefits of working in our organisation. Other improvements include refreshing our LinkedIn Life pages and spotlighting areas of our work.
Retaining our employees
2023 to 2024 action: This is critical in maintaining our representation, and continuing to reduce our pay gaps, therefore we will continue to deliver our existing development programmes as well as review where we have any gaps to enable us to achieve our ambitions, and to improve representation, particularly in SCS roles.
In 2024 to 2025, our career development programme focussed on building leadership capability and supporting colleague progression through a range of targeted initiatives. We continued to offer career development programmes such as Aspire and Crossing Thresholds which support confidence, career planning and overcoming barriers to progression, with 1:1 coaching provided to all participants.
Leadership development was further supported through Whitehall & Industry Group programmes, including the Women’s Leadership programme and the Civil Service Future Leaders programme, which offers tailored modules for employees from protected backgrounds. In addition coaching and mentoring remained available to support employees to develop skills, navigate challenges and progress their careers.
We regularly monitor and review performance outcomes across all ethnicities and where there are disparities, we work to address the root causes, to ensure equitable outcomes.
Details of the full plan and the work that was delivered in 2023 to 2024 can be found in the EDI strategy 2020 to 2024.
Our future plans
In April 2025, we published our EDI and Wellbeing priorities for 2025 to 2026. Our work aligned to our Equality objectives and our success measures as outlined below.
Equality objectives
- strategic objective 1 – building a Diverse and Inclusive Workforce that reflects and understands the public we serve
- strategic objective 2 – ensuring all employees are valued and can contribute to our success
- strategic objective 3 – empowering and enabling all our employees to thrive and prosper
Success measures
-
a more representative workforce. We are clear on where we are under-represented in the organisation, particularly at a senior level. This work will contribute towards us meeting our representation ambitions, helping us:
-
maintain the improvement and/or further reduce our gender pay gaps. We are clear that improving our representation of ethnic minorities in senior roles is a significant contributing factor to us reducing our pay gaps
-
continuing to reduce inequality in performance and development
-
improving our Inclusion and Wellbeing indexes
-
Our next EPG report will be published by March 2027, for the period of 1 April 2025 to 31 March 2026, and we will report further on the progress that we have made in that period.
We will publish our progress in our annual report, which will be published in July 2026.
Declaration
We confirm that data reported by the CMA is accurate and has been calculated according to the methodology provided by the Cabinet Office and mirrors the requirements of gender pay gap reporting as set out in the Equality Act 2010 (Specific Duties and Public Authorities) Regulations 2017.