Entertainment Licensing Statistics - 2014
Published 18 December 2014

© Crown copyright 2014
This publication is licensed under the terms of the Open Government Licence v3.0 except where otherwise stated. To view this licence, visit nationalarchives.gov.uk/doc/open-government-licence/version/3 or write to the Information Policy Team, The National Archives, Kew, London TW9 4DU, or email: psi@nationalarchives.gov.uk.
Where we have identified any third party copyright information you will need to obtain permission from the copyright holders concerned.
This publication is available at https://www.gov.uk/government/statistics/entertainment-licensing-2014/entertainment-licensing-statistics-2014
| Prior to 2012, Alcohol, entertainment and late night refreshment licensing statistics were produced by DCMS and designated as National Statistics under subsection 12(8) of the Statistics and Registration Service Act 2007. These entertainment licensing statistics (a subset of the previous statistics) have been produced and published by DCMS as a result of a machinery of government change. They have been produced to the same standard, and continue to be designated as National Statistics. |
The United Kingdom Statistics Authority has designated these statistics as National Statistics, in accordance with the Statistics and Registration Service Act 2007 and signifying compliance with the Code of Practice for Official Statistics.
Designation can be broadly interpreted to mean that the statistics:
- meet identified user needs;
- are well explained and readily accessible;
- are produced according to sound methods; and
- are managed impartially and objectively in the public interest.
Once statistics have been designated as National Statistics it is a statutory requirement that the Code of Practice shall continue to be observed.
1. Introduction and key findings
This release presents statistics on the number of premises licences and club premises certificates authorising regulated entertainment in England and Wales in force on 31 March 2014. All figures consist of a combination of actual returns and modelled estimates for non-response.
Subject to any conditions, definitions and exemptions that may apply, the types of regulated entertainment which may require a licence under the Licensing Act 2003 are as follows:
- A performance of a play
- An exhibition of a film
- An indoor sporting event
- Boxing or wrestling entertainment (both indoors and outdoors)
- A performance of live music
- Any playing of recorded music
- A performance of dance
The Licensing Act 2003[footnote 1] may require that some form of authorisation is obtained before one or more of these entertainment activities can lawfully be carried out - such as a premises licence or club premises certificate.
Premises may have a licence covering several forms of entertainment. This licence may also cover alcohol and late night refreshment.
1.1 Key findings
Premises Licences
-
There were 119,300 premises licences authorising regulated entertainment in force in England and Wales on 31 March 2014, a 1.3 per cent increase compared to 117,800 licences on 31 March 2013.
-
Premises licences accounted for 91.0 per cent of the total number of licences in force which authorised regulated entertainment on 31st March 2014. Club premises certificates accounted for the other 9.0 per cent.
Figure 1
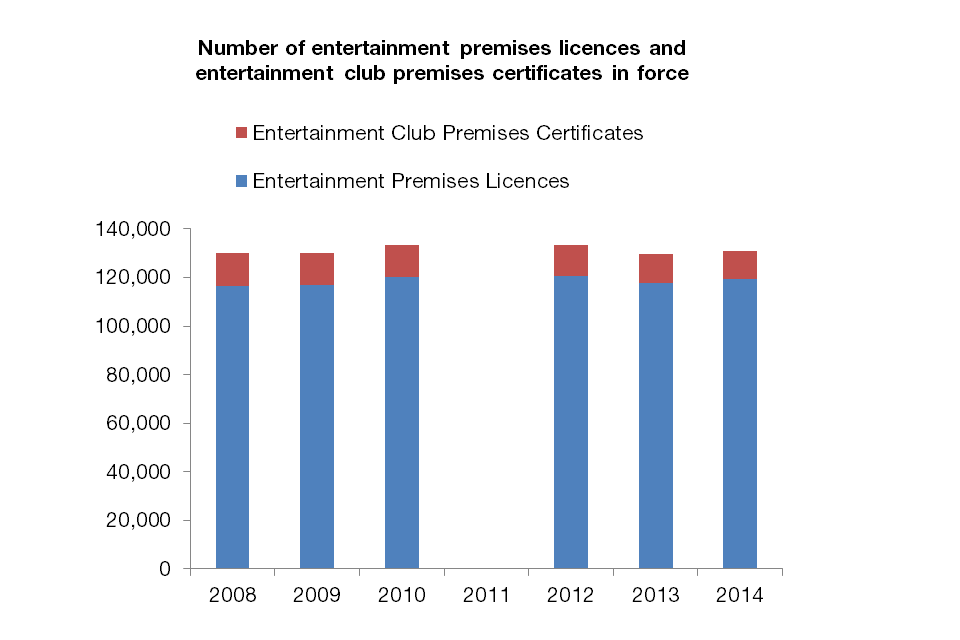
A chart showing the number of entertainment premises licences and entertainment club premises certificates in force
- The largest percentage increases in premises licences between March 2013 and March 2014 were for those covering Indoor sporting events (1.6%) and plays (1.1%). To note, art engagement figures over this time period, from the Taking Part Survey, showed a slight decrease from 78.4% in 2012/13 to 77.5% in 2013/14. This covers adults engaging in the arts through attendance of plays or dramas, but also participation in the arts, such as painting.
Club Premises Certificates
-
There were 11,800 club premises certificates authorising regulated entertainment in England and Wales on 31 March 2014, a 0.8 per cent decrease compared to 11,900 such licences on 31 March 2013. There has been a gradual but steady decrease in the number of these club premises certificates in force since 2008.
-
There has been a decrease in the number of entertainment club premises certificates across all types of entertainment. The biggest percentage decrease was for the number of club premises certificates for plays, which decreased by 10.1 per cent between 31 March 2013 and 2014. Although this was the only entertainment type for which the number of club premises certificates increased in the previous year, a 2.0 per cent increase between March 2012 and March 2013.
The number of entertainment premises licences and entertainment club premises certificates in force do not provide a measure of the regulated entertainment which actually takes place. This is because a premises or club being authorised for a certain type of regulated entertainment does not mean that they necessarily provide it.
To note
-
As context, Taking Part data shows the actual attendance rates for some of these types of regulated entertainment.
-
Premises licences can be used for the sale or supply of alcohol, the provision of regulated entertainment or the provision of late night refreshment.
-
Club premises certificates allow a qualifying club to carry out activities specified under the Licensing Act 2003.
1.2 Introduction
The main purpose of this collection is to monitor the impact of the Licensing Act 2003. It provides information to help licensing authorities benchmark their position and provide an understanding in the context of the national picture.
These statistics are used by DCMS to provide a measure of the changing number of premises or club premises licensed to provide entertainment across its key policy areas. They are also used to inform deregulation proposals regarding the forms of entertainment which may require licences in the future.
Accompanying excel tables for the number of premises licences and club premises certificates authorising regulated entertainment are available here.
Excel tables which show the number of premises licences and club premises certificates authorising entertainment by individual Licensing Authority have been published and are available here.
These data consist of the actual returns received from responding Licensing Authorities (87.7% and 86.0% of all licensing authorities for premises licences and club premises certificates authorising entertainment respectively) and have therefore not been modelled. Therefore, non-responding licensing authorities have been omitted from the main table but are listed within the same spreadsheet for information. The sum of the licences shown in these tables will be substantially less than the aggregated totals for England and Wales since the aggregated figures incorporate estimates for non-response.
It is important to note that the licensing authority tables do not, on their own, provide an insight into areas where particular forms of entertainment are most popular as they largely reflect the size of the population in each authority. Also, as with the aggregated national figures, a licence to provide a certain type of entertainment does not necessarily mean it is actually taking place. Figures on the number of entertainment premises licences and entertainment club premises certificates per 100,000 population are available here.
These allow for comparisons to be made between regions on a comparable basis but still do not provide an indication of the regulated entertainment which has actually taken place, rather an indication of the number of licences available for regulated entertainment per head of population.
Definitions
Premises licences can be used for the sale or supply of alcohol, the provision of regulated entertainment or the provision of late night refreshment.
Club premises certificates allow a qualifying club to carry out activities specified under the Licensing Act 2003.
Please note that this release deals only with premises licences or club premises certificates which authorise the provision of regulated entertainment. It also does not include data for regulated entertainment authorised by a Temporary Event Notice. Data for Temporary Event Notices as a whole is published by the Home Office in their publication Alcohol and Late Night Refreshment Licensing England and Wales 2013/14.
Figures in this publication (unless otherwise stated) relate to the number of premises licences or club premises certificates authorising entertainment in force on 31 March 2014 in England and Wales. There are no corresponding figures for Scotland[footnote 3] or Northern Ireland. Scottish liquor licensing statistics are available but these do not distinguish the provision of regulated entertainment.
The number of entertainment premises licences and entertainment club premises certificates in force do not provide a measure of the regulated entertainment which actually takes place. This is because a premises or club being authorised for a certain type of regulated entertainment does not mean that they necessarily provide it. For example a premises may have previously provided a form of regulated entertainment which it has now ceased to, but not had it removed from its licence.
Figures on participation in various entertainment types are available from the Taking Part Survey. Where relevant these figures have been referred to in this release.
Complementing this release, data on licences authorising alcohol and late night refreshments are published by the Home Office in their publication Alcohol and Late Night Refreshment Licensing England and Wales 2013/14 available here.
The Home Office publication includes figures for the total number of premises licences and club premises certificates in force, not just those authorising the provision of regulated entertainment as in this release.
Data response
All of the licensing authorities in England and Wales responded to the questionnaire. Of these 89.0 and 86.4 per cent provided the number of entertainment premises licences and entertainment club premises certificates in force respectively. Throughout this publication modelled estimates have been used to account for these missing data. Full information on response rates and the modelling procedure can be found in Annex A. Further information on interpreting the modelled data can be found in Annex B.
Revisions
Figures from 2008, 2009, 2010, 2012 and 2013 referred to in this report have not been revised from previous publications.
Additional information
The Licensing Act 2003 defines the provision of regulated entertainment as a licensable activity. The Act brought together 6 existing licensing regimes including public entertainment, cinemas and theatres. Once granted, the licence is valid until surrendered, subject to the payment of any annual licence fee due and any premises which held an old scheme licence was eligible to apply for it to be converted. The statistics presented in this report enable the Government to track the uptake of such licences throughout England and Wales and to gauge what impact the legislation has had and continues to have on the number of clubs or premises able to provide different entertainment types.
The Live Music Act 2012 came into force on 1 October 2012. The data reported on in this publication refer to licences in force on 31st March 2014 so this Act may have had an impact on these statistics.
The 2012 Act amends the Licensing Act 2003 (“the 2003 Act”) by partially deregulating the performance of live music and removing regulation about the provision of entertainment facilities. It may therefore be expected that licences authorising live music performances may decrease, as may applications for new licences. However as the Live Music Act only partially deregulated live music in defined circumstances, the live music category is likely to remain in place on most pre-existing licences. These statistics do not provide an indication of whether the Act has increased the provision of live music itself. Full information on this Act is available here.
The Government is also committed to further deregulatory reforms to entertainment licensing. This is being implemented in phases. The first phase, by secondary legislation removed the requirement for a licence between 8:00-23:00 for performance of plays and exhibitions of dance (up to an audience limit of 500) and indoor sport up to audience limit of 1000 people. It also clarified the position on combined fighting sports such as Mixed Martial Arts, so that it is clear in law that such activities remain licensable as boxing or wrestling activities. This came into force on 27th June 2013. For more information see here.
A second phase that will remove the licensing requirement between 08.00 -23.00 for certain activities in defined circumstances will come into force on 6 April 2015, see here.
There was no data collection in 2011 as a result of the Machinery of Government change which reallocated policy responsibilities under the Licensing Act 2003 between the Home Office and the Department for Culture, Media and Sport. It was decided to keep the frequency of collection under review, with a plan to repeat the exercise following any forthcoming legislative changes. As such, the first collection following the Machinery of Government change was in 2011/12. To reduce the administrative burden on local authorities, there will not be a statistical collection exercise for year ending March 2015. The data collection will be resumed for the year ending March 2016.
2. Premises Licences for regulated entertainment
There were 119,300 premises licences authorising some form of regulated entertainment in England and Wales on 31 March 2014, a 1.3 per cent increase compared to 117,800 premises licences on 31 March 2013.
Over the same period, the largest percentage increases have been in the number of premises licences authorising indoor sporting events (1.6%) and plays (1.1%). The number of premises licences authorising films and the performance of dance have also increased (both by 0.7%).
There have been decreases in the number of premises licences authorising entertainment similar to live music, recorded music or dance (-1.7%), live music (-1.5%), boxing or wrestling (-1.2%) and recorded music (-0.9%).
The statistics presented in this chapter relate to the number of premises licences authorising the provision of regulated entertainment issued by the licensing authorities in England and Wales that were in force on 31 March 2014.
All figures consist of a combination of actual returns and modelled estimates for non-response.
Entertainment premises licences by entertainment type
There are 8 categories of regulated entertainment which premises licences can cover, a particular premises licence can cover multiple entertainment types.
The categories of entertainment are:
- Plays
- Films
- Indoor sporting events
- Boxing or Wrestling
- Live Music
- Recorded music
- Performance of dance
- Entertainment similar to live music, recorded music or dance (referred to as ‘similar to live music, recorded music or dance’ in figure 2 and 4)
Prior to the Live Music Act 2012 a licence was also required for the following.
- Facilities for making music
- Facilities for dancing
- Facilities for entertainment similar to making music or dancing
These types of entertainment are no longer licensable and this is the second t publication not to report on licences for these facilities for providing entertainment as a result of the Live Music Act 2012 being implemented.
Information on exactly what constitutes each activity and what requires a licence as set out in The Licensing Act 2003 can be found here.
Guidance to Licensing Authorities can be found here.
Figure 2 shows the number of premises holding licences for each licensable entertainment type.
-
The most commonly authorised form of regulated entertainment was recorded music which was licensed in 99,800 premises. There has been a 0.9 per cent decrease since 2013 (100,600). Over four out of five (83.6%) of all premises licences for entertainment covered recorded music.
-
There have also been decreases in the number of premises licences covering entertainment similar to live music, recorded music or dance, live music and boxing or wrestling, which fell by 1.7, 1.5 and 1.2 per cent respectively between data collections for March 2013 and March 2014.
-
The largest percentage increases between March 2013 and 2014 have been in the number of premise licences authorising indoor sporting events (1.6%) and plays (1.1%). The number of premises licences authorising films and the performance of dance have also increased (both by 0.7%).
Figure 2: The number of entertainment premises licences in force in England and Wales on 31 March 2013 and 2014 by entertainment type.
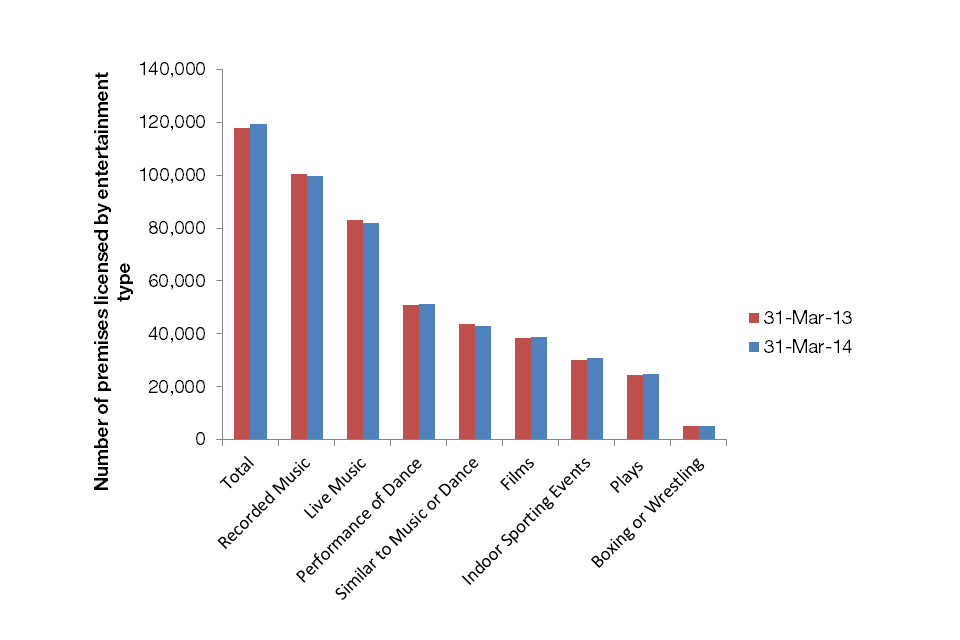
A chart showing the number of entertainment premises licences in force in England and Wales on 31 March 2013 and 2014 by entertainment type.
Notes
1) The sum of the number of licences covering each entertainment type will not equal the total number of entertainment premises licences in force since more than one form of entertainment can be covered by each licence.
2) Figures consist of a combination of actual responses and modelled estimates to account for non-response.
Excel tables for the number of entertainment premises licences in force can be found here.
Figure 3 shows that London, South East and the North West had the greatest number of entertainment premises licences (over 15,000 licences each). Conversely the region with the least entertainment premises licences was the North East with fewer than 5,000.
Figure 3: The number of entertainment premises licences in force on 31 March 2014 by region
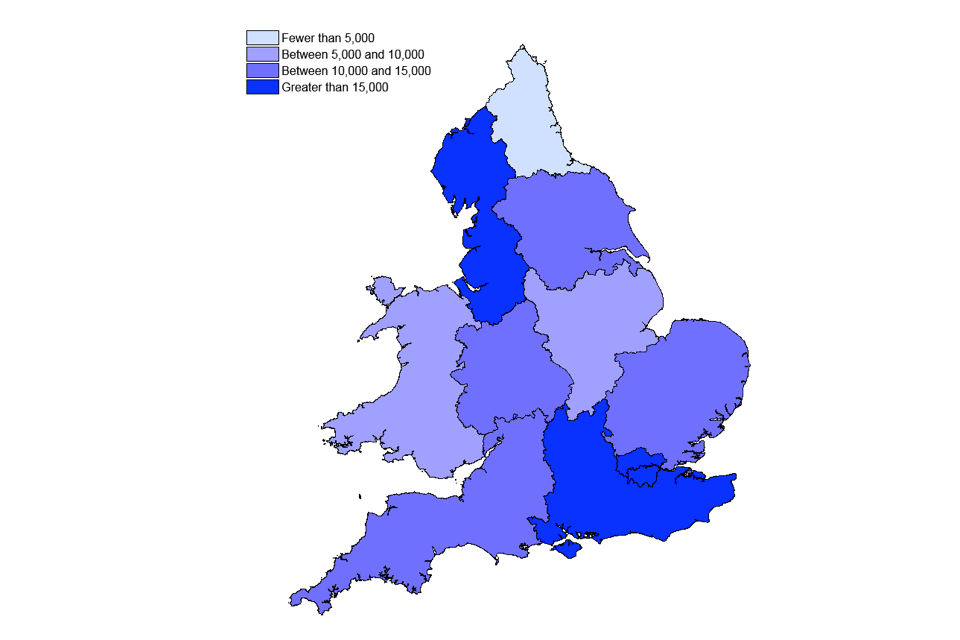
A map showing the number of entertainment premises licences in force on 31 March 2014 by region
Notes
1) Figures consist of a combination of actual responses and estimates to account for non-response
Excel tables for the number of entertainment premises licences in force by region can be found here.
Figure 4: The number of entertainment premises licences in force on 31 March 2014 by region, per 1,000 population.
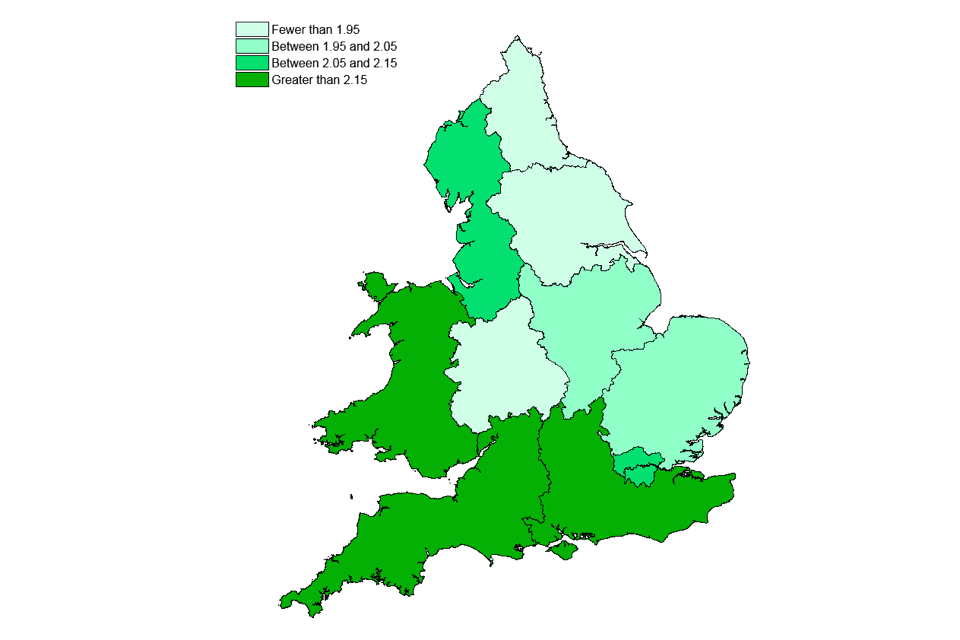
A map showing the number of entertainment premises licences in force on 31 March 2014 by region, per 1,000 population.
The regions with the most entertainment premises licences per head of population are different from the regions which have the greatest absolute number of these licences. For instance in figure 4, Wales is amongst the areas with the greatest entertainment premises licences per head of population, whilst figure 3 shows Wales to be amongst the areas with one of the lower absolute number of such licences.
Excel tables for the number of entertainment premises licences per head of population are available here.
3. Club Premises Certificates for regulated entertainment
There were 11,800 club premises certificates authorising regulated entertainment in England and Wales on 31 March 2014, a 0.8 per cent decrease compared to 11,900 club premises certificates on 31 March 2013.
There has been a decrease in the number of entertainment club premises certificates across all types of entertainment.
The biggest percentage decrease was for the number of club premises certificates for plays, which decreased by 10.1 per cent between 31 March 2013 and 2014.
The statistics presented in this chapter relate to the number of club premises certificates covering regulated entertainment issued by the licensing authorities in England and Wales that were in force on 31 March 2014. All figures consist of a combination of actual returns and modelled estimates for non-response.
A club premises certificate allows a qualifying club to carry out activities specified under the Licensing Act 2003.
The categories of regulated entertainment which can be covered by club premises certificates are the same as those detailed in [chapter 2]{#premises-licences-for-regulated-entertainment} for premises licences. There are 8 categories of regulated entertainment and one particular club premises certificate can cover multiple entertainment types.
Figure 5 shows the number of entertainment club premises certificates in force on 31 March 2013 and 2014.
- The most commonly authorised form of regulated entertainment by club premises certificates was recorded music, with 9,900 club premises certificates in force. There has been a 6.3 per cent decrease from 2013 (10,600). 84.2% of all club premises certificates for entertainment covered recorded music.
- There has been a decrease in the number of entertainment club premises certificates across all types. The largest percentage decrease between March 2013 and 2014 have been in the number of premise certificates for plays (-10.1%) and entertainment similar to live music, recorded music or dance (-8.6%).
- The least commonly authorised form of regulated entertainment by club premises certificates has been for boxing and wrestling, with just 600 such certificates in force on 31 March 2014. This represents a 6.4 per cent decrease from 2013.
Figure 5: The number of entertainment club premises certificates in force in England and Wales on 31 March 2013 and 2014.
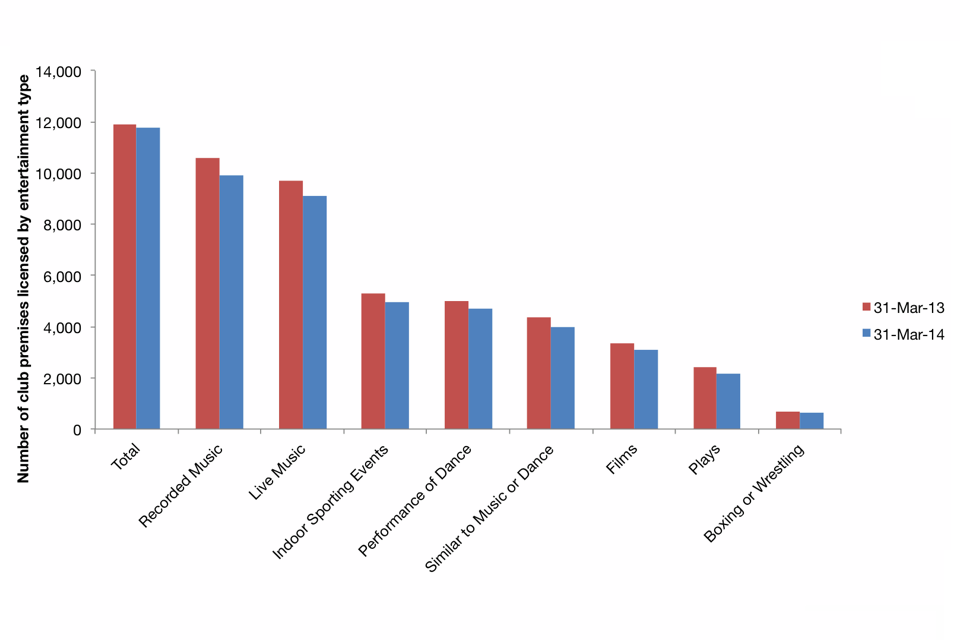
A chart showing the number of entertainment club premises certificates in force in England and Wales on 31 March 2013 and 2014.
Notes
1) The sum of the number of club premises certificates covering each entertainment type will not equal the total number of entertainment club premises certificates in force since more than one form of entertainment can be covered by each such certificate.
2) Figures consist of a combination of actual responses and modelled estimates to account for non-response.
Excel tables for the number of entertainment club premises certificates in force can be found here.
Figure 6 shows that only three regions had over 1,250 entertainment club premises certificates in force on 31 March 2014 (South East, Yorkshire and The Humber and North West). Only one region had less than 750 entertainment club premises certificates in force on 31 March 2014 (North East).
Figure 6: The number of entertainment club premises certificates in force on 31 March 2014 by region
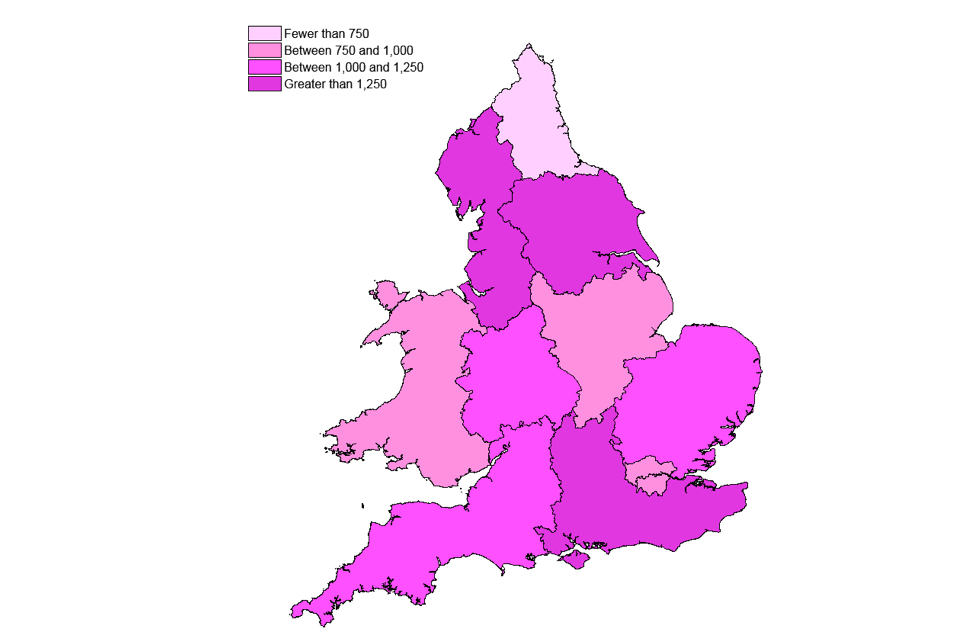
A map showing the number of entertainment club premises certificates in force on 31 March 2014 by region
Notes
1) Figures consist of a combination of actual responses and estimates to account for non-response.
Excel tables for the number of entertainment club premises certificates in force by region can be found here.
Figure 7: The number of entertainment club premises certificates in force on 31 March 2014 by region, per 1,000 population.
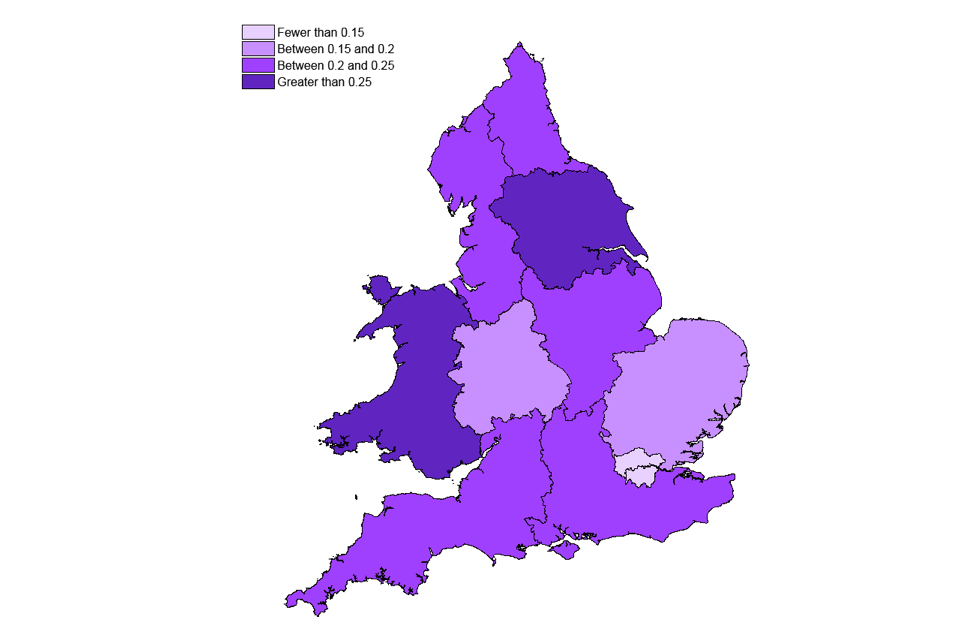
A map showing the number of entertainment club premises certificates in force on 31 March 2014 by region, per 1,000 population.
Figure 7 shows that the Wales is amongst the regions with the greatest club premises certificates in force per head of population in contrast with figure 6 which shows that the Wales is among the regions with a lower absolute number of club premises certificates.
Excel tables for the number of entertainment club premises certificates per head of population are available here.
4. Annex A: Background notes
-
The Entertainment licensing data collection is commissioned by the Home Office on behalf of the Department for Culture, Media and Sport, as part of their data collection for the Alcohol, entertainment and late night refreshment licensing statistics. See here for full details of The Licensing Act 2003. Note that the Act has been partially amended by the Live Music Act 2012 and the “2013 order”.
-
Entertainment licensing statistics 2014 is a National Statistic and has been produced to the high professional standards set out in the Code of Practice for Official Statistics. National Statistics undergo regular quality assurance reviews to ensure they meet customer needs and are produced free from any political interference. For more information, see the Code of Practice.
-
The latest results presented here are on the number of premises licences or club premises certificates authorising the provision of regulated entertainment in force in England and Wales on 31 March 2014.
-
The questionnaire covers all licensing authorities in England and Wales (350 licensing authorities).
-
Prior to 2012, these figures were reported on as part of the DCMS publication: Alcohol, Entertainment and Late Night Refreshment Licensing. This release fromv2009/10 can be found here. There was no entertainment licensing data collection in 2011 and it is not feasible to retrospectively collect this data reliably.
-
The total compliance cost of licensing authorities responding to the questionnaire (not just the regulated entertainment section) is estimated at £10,400.
-
Of the 350 Licensing Authorities in England and Wales, all of them (100%) responded to the questionnaire. Of these 301 (87.7%) and 307 (86.0%) provided the total number of premises licences and club premises certificates respectively authorising regulated entertainment in force in their authority on 31 March 2014. See table 1 for a full breakdown of response rates for each entertainment type.
-
Estimates have been made for non-response (Non-response refers to a licensing authority either not returning a questionnaire or leaving a specific question in the questionnaire blank).
In cases where data were not provided for a category from the 2014 collection but were provided in the 2013 collection, an estimate was made by applying an adjustment to the 2013 figure for that licensing authority. This adjustment was the average percentage change from 2013 to 2014 for the relevant category of Department for Culture, Media and Sport Entertainment Licensing Statistics 2014 – Statistical Release 19 licensing authority (These are: District, London Borough, Metropolitan District, Unitary Authority, Welsh Unitary Authority or left unspecified).
If a figure had not been given in 2014 or 2013, the same procedure was followed using the 2012 entry.
However, if there was no figure for a particular licensing authority in 2014, 2013, or 2012 then an average figure for the relevant type of licensing authority was used. Excel sheets of modelled estimates can be found here. -
Estimating for non-response allows changes to be compared on a comparable basis between years. There are some limitations to the estimation process, but the data are sufficiently robust for their intended use. These are discussed in Annex B. Data tables based only on actual returns for individual licensing authorities are also available.
-
We can also provide documents to meet the specific requirements of people with disabilities. Please call 020 7211 6000 or email evidence@culture.gsi.gov.uk.
-
The responsible statistician for this release is Richard Boorman. For enquiries on this release, please contact Richard Boorman on 0207 211 6126.
-
For general enquiries telephone: 0207 211 6200
Department for Culture Media and Sport
100 Parliament Street
London
SW1A 2BQ
evidence@culture.gsi.gov.uk.Consultation
-
Information on the number of Premises Licences and Club Premises Certificates in force which cover regulated entertainment in England and Wales is collected by the Home Office on behalf of the Department for Culture, Media and Sport (DCMS).
-
To reduce the administrative burden both on LAs and the DCMS and Home Office statistics teams, DCMS does not intend to publish entertainment licensing collection data for the year ending March 2015. The main use of the collection is to monitor the impact of new and amended legislation and the intention is to collect when needed. The Home Office (who collect these data on behalf of DCMS) will be resuming the collection for year ending March 2016 and we intend to publish these data in Autumn 2016.
-
DCMS is seeking feedback from stakeholders and users of this data. We would be grateful if you could take the time to complete this short questionnaire which should take no longer than 5 minutes to help inform DCMS’ decision making.
-
All information provided will be treated in confidence and not shared with anyone outside of DCMS. If you have any questions in relation to this survey or require assistance, please contact us at evidence@culture.gsi.gov.uk. The consultation questionnaire can be found here.
Table 1: The percentage of licensing authorities which provided the number of premises licences and club premises certificates authorising the provision of each regulated entertainment type
| Total | a | b | c | d | e | f | g | h | ||
|---|---|---|---|---|---|---|---|---|---|---|
| Response rate as a percentage of licensing authorities that responded to the questionnaire (2) | Premises licences authorising provision of entertainment type | 97.8% | 83.4% | 83.1% | 83.4% | 83.4% | 83.4% | 83.4% | 83.4% | 82.2% |
| Club premises certificates authorising provision of entertainment type | 95.9% | 81.5% | 81.5% | 81.5% | 81.5% | 81.5% | 81.5% | 81.5% | 80.9% | |
| Response rate as a percentage of all licensing authorities in England and Wales (3) | Premises licences authorising provision of entertainment type | 87.7% | 74.9% | 74.6% | 74.9% | 74.9% | 74.9% | 74.9% | 74.9% | 73.7% |
| Club premises certificates authorising provision of entertainment type | 86.0% | 73.1% | 73.1% | 73.1% | 73.1% | 73.1% | 73.1% | 73.1% | 72.6% |
Notes
a) Plays
b) Films
c) Indoor sporting events
d) Boxing or wrestling
e) Live music
f) Recorded music
g) Performance or dance
h) Entertainment similar to live music, recorded music or dance<
Notes
1) The sum of the number of premises licences and club premises certificates covering each entertainment type will not equal the total
number in force since more than one form of entertainment can be covered by each such licence or certificate.
2) Response rates as a percentage of licensing authorities that responded to the questionnaire, refers to the percentage of Licensing Authorities which responded to that specific question, out of the 314 responding Licensing Authorities who submitted a return at all.
3) Response rates as a percentage of all licensing authorities in England and Wales, refers to the percentage of all 350 licensing authorities which answered each specific question.
5. Annex B: Interpretation of modelled estimates
As noted throughout the report, modelled estimates have been used where Licensing Authorities did not respond or provided incomplete returns. The method of calculating these estimates is described in Annex A.
There were no discernible trends as to which Licensing Authorities did not respond or provided incomplete returns. They were not for instance, mainly small Authorities likely to have few licences in force, nor were they mainly large authorities with a greater number of licences in force.
Modelled estimates are imperfect by nature; as such there is always a degree of error in the calculated estimates for individual Licensing Authorities. For this reason data for individual Licensing Authorities have only been published for those that provided actual returns. This represents 88.0% and 85.4% of all Licensing Authorities in England and Wales for premises licences and club premises certificates authorising entertainment respectively.
We model for Licensing Authorities which do not provide complete responses despite this error in the modelling. Implementing it reduces the extent of error that would have existed had it not been done. For most Licensing Authorities (97% and 97% for premises licences and club premises certificates authorising entertainment respectively) either, modelling was not required, or modelled estimates were based on returns that the Licensing Authority provided in previous years so are likely to accurately reflect the actual number of licences in force.
In the few cases where authorities which did not respond in 2013 and did not respond in any previous year of data collection since 2010, an average for the authority type has been used. This makes an assumption that similar authority types (e.g. London Boroughs) have a similar number of licences in force. This subset of modelled estimates is therefore likely to be less accurate, but given they are only used for less than 4% of all Licensing Authorities, we believe this introduces little bias and that the national estimates are still robust. As such this modelling should not influence the way that these statistics are interpreted.