Segmenting private landlord compliance
Published 26 May 2022
Applies to England

© Crown copyright 2022
This publication is licensed under the terms of the Open Government Licence v3.0 except where otherwise stated. To view this licence, visit nationalarchives.gov.uk/doc/open-government-licence/version/3 or write to the Information Policy Team, The National Archives, Kew, London TW9 4DU, or email: psi@nationalarchives.gov.uk.
Where we have identified any third party copyright information you will need to obtain permission from the copyright holders concerned.
This publication is available at https://www.gov.uk/government/publications/english-private-landlord-survey-segmenting-private-landlord-compliance/segmenting-private-landlord-compliance
Introduction and main findings
1. The private rented sector is the second largest tenure in England and is home to a fifth of all households[footnote 1]. It is a sector characterised by diversity, serving a wide range of different types of households across all incomes, including an increasing number of families. In 2018-19, 37% of households in the private rented sector included dependent children (1.7 million households, up 84% from 913,000 a decade ago in 2008-09). There are high rates of turnover in the private rented sector, with the number of home moves significantly higher than in the owner occupied and social rented sectors, both within the sector and between it and the other sectors. At the same time, indicators of quality are lowest in private rented sector stock: 25% are non-decent, and 12% have a category 1 hazard.
2. The 2018 English Private Landlord Survey (EPLS) is a national survey of landlords and letting agents who own and/or manage privately rented properties in England. The aim of the EPLS is to inform government about the characteristics and experiences of landlords and how they acquire, let, manage and maintain privately rented accommodation. The main report provides an overview of the private landlord population in England, including their characteristics, properties, attitudes and future plans[footnote 2].
3. The EPLS also includes questions on private landlords’ compliance with activities landlords and agents are legally required to undertake when letting a property in England, as well as indicators of good practice[footnote 3]. The EPLS asked landlords and agents a series of questions about activities they undertook with respect to their most recent letting, along with awareness about recent or upcoming legislative changes. These questions are the basis for the analysis in this report.
4. Using a statistical method called latent class analysis (LCA), EPLS data were analysed to determine whether landlords could be segmented into distinct clusters of people with similar profiles of compliance, based on their responses to questions in the EPLS. This analysis will group landlords based on their latent patterns of compliance, though actual compliance may vary within groups. If clusters were identified, the second stage of the analysis used demographic, socio-economic and letting practice characteristics, as well as responses to some attitudinal questions, to produce a descriptive profile for each cluster. Additional multiple logistic regression analysis was also undertaken to check the robustness of the clusters and determine which characteristics were most important in determining to which cluster respondents were assigned. Full details of the methods for this analysis are in the technical notes at the end of this report.
5. The research was commissioned to help us better target policies and communications, to help improve standards in the private rented sector by determining whether particular landlord ‘types’ were more likely to be disengaged or non-compliant with multiple legislative requirements and/or good practice indicators. If groups of landlords had distinct patterns of compliance with legislation and good practice, and if there were common characteristics within these groups, then we could more effectively and efficiently design policies and campaigns to improve levels of compliance overall.
6. Given the sample of the EPLS is those landlords who registered a deposit for a tenancy, and it is a legal requirement to register a deposit, we could assume the sample is, by definition, more compliant than the broader landlord population. However, there are several reasons a landlord might not have registered a deposit (a landlord might not have taken a deposit in the first place). As such, it is not possible to draw conclusions about the compliance of landlords not included in this segmentation[footnote 4].
7. Overall, this project aims to understand more about landlords’ patterns of compliance with legislation and good practice, and how government might engage with these landlords to improve standards in the private rented sector.
8. The first chapter provides a brief summary of the legal requirements and good practice indicators. The second chapter summarises the landlord clusters and provides an overview of landlord profiles.
Main findings
Four distinct groups of landlords with different patterns of compliance were identified.
-
Two of these groups tended to be compliant with a greater proportion of legislation. Those groups we call: ‘demonstrating good practice’ and ‘meeting legal requirements’. Landlords in these clusters tended to have higher degrees of compliance with legislation and, with respect to the former group, a great deal of compliance with good practice.
-
Two further groups have patterns of compliance that suggests more limited awareness with or engagement with legislation and good practice. We call these groups: ‘mixed compliance’ and those with ‘lower compliance and awareness’.
Nearly one-third of landlords were in the ‘demonstrating good practice’ cluster. This group was most likely to comply with all legal requirements, and most likely to adhere to good practice indicators.
- 30% of landlords fell into the ‘demonstrating good practice’ cluster. This group was most likely to conduct Right to Rent checks, issue the How to Rent guide, provide the EPC and conduct electrical installation checks.
- Of all the landlords, they were the most knowledgeable about their most recent let, most likely to be aware of changing EPC regulations and most likely to know the EPC ratings of their properties.
Landlords in the ‘demonstrating good practice’ cluster tended to be more professionalised in their practice, owning multiple properties and sourcing information from landlord associations. They also had good awareness of tax and legislative changes.
- Landlords in this cluster were more likely to say they were self-employed as a landlord and were likely to belong to and get information from landlord associations. They were most aware of recent and proposed tax changes and tended to report being concerned about legislative changes.
- They tended to have multiple properties in their portfolios, including HMOs and were most likely to let to students.
Nearly one-quarter of landlords fell into the ‘meeting legal requirements cluster. This group was less likely than ‘demonstrating good practice’ landlords to have undertaken all legal requirements and tended not to have completed good practice indicators.
- While still having complied with most legal requirements, the ‘meeting legal requirements’ cluster was less likely than those ‘demonstrating good practice’ to have conducted Right to Rent checks and issued the How to Rent Guide.
- They were also less likely to adhere to good practice indications such as conducting electrical installation checks or to be aware of upcoming changes, such as new EPC requirements.
Landlords in the ‘meeting legal requirements’ group were more likely than ‘demonstrating good practice’ landlords to source information from letting agents, increasing their likelihood of compliance.
- Despite a similar portfolio size and employment status to ‘demonstrating good practice’, these landlords were less likely to get information from professional associations and more likely to get it from agents.
More than a third of landlords were in the ‘mixed compliance’ cluster. This group had conducted some but not all legal requirements, though many had implemented non-mandatory good practice activities.
- This group of landlords had a much lower likelihood of checking tenants’ ‘Right to Rent’ or providing a ‘How to Rent’ guide. They tended to have limited awareness of EPC ratings, or changes in EPC requirements
- However, they were more likely to complete electrical installation, appliance and visual checks, which are non-mandatory.
Those in the ‘mixed compliance’ cluster were most likely to be retired, outright owners of just one property they did not buy with the intention of letting.
- In line with their likelihood of being retired, they were most likely to be 65 or older.
- ‘Mixed compliance’ landlords were likely to have a relatively low income from rent, and unlikely to have any borrowing.
One in ten landlords fell into the ‘lower compliance and awareness’ cluster, who displayed patterns of limited compliance across the range of legal requirements and good practice indicators.
- The ‘lower compliance and awareness’ landlords were least likely to have conducted Right to Rent checks, issued How to Rent guides or provided tenants with the EPC.
- They tended to not have conducted either electrical installation or appliance checks.
Landlords in the ‘lower compliance’ cluster were most informal in their practice. They were also more likely to have let their last property before 2015, before some legal requirements took effect.
- ‘Lower compliance’ landlords were least likely to be members of a landlord association, and were more likely to report family and friends as sources of information.
- They were also most likely to have let properties before 2015, prior to requirements surrounding the How to Rent guide and Right to Rent coming into effect.
Overall, compliance appeared to be unrelated to years of experience as a landlord. Landlords with patterns of higher compliance were more likely to have 5 or more properties than landlords with lower compliance, while landlords with lower compliance were more likely to have just 1 property.
- Those with 1 property were most likely to be in one of the less compliant, less professional clusters: those with ‘mixed compliance’ or those with ‘lower compliance and awareness’.
- There was no significant difference in compliance between landlords with 2 to 4 properties. Landlords with 5 or more properties were most likely to be in the more compliant, more professionalised clusters; ‘demonstrating good practice’ and ‘meeting legal requirements’.
Acknowledgements and further queries
9. The authors would like to thank the landlords who gave their time to complete the survey. We are also indebted to colleagues from the 3 government-backed TDP schemes, without whom the survey would not have been possible.
10. This additional analysis was conducted by Sarah Frankenburg and Klaudia Lubian of NatCen Social Research, in collaboration with colleagues at DLUHC.
11. The responsible analyst for this report is: Chauncey Glass, Housing and Planning Analysis Division, DLUHC, who can be contacted via EPLS@levellingup.gov.uk.
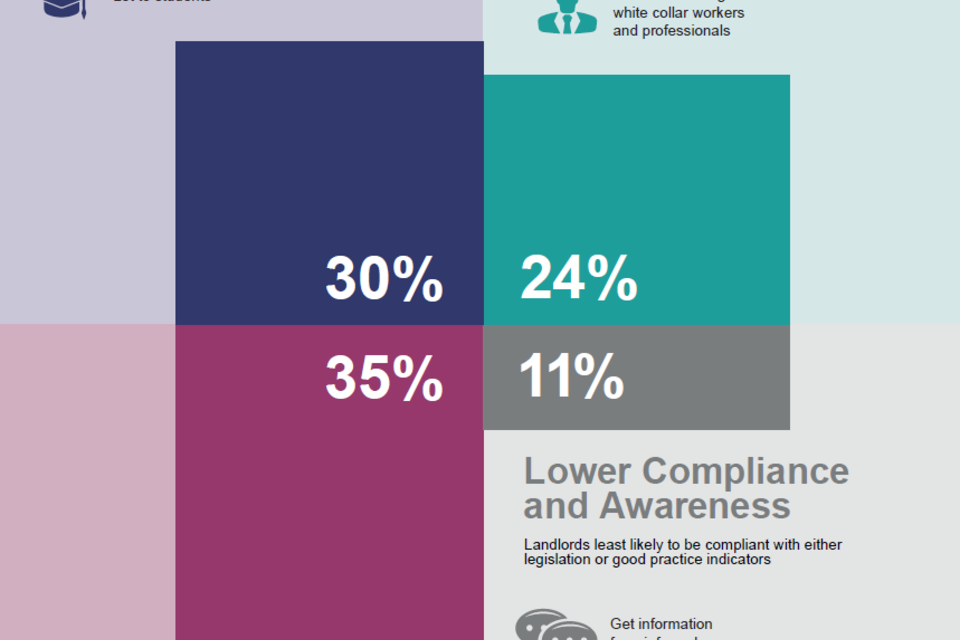
Accessible version of infographic
Demonstrating good practice - 30%
Landlords most likely to be compliant with both legislation and good practice indicators.
- Most likely to get information from a landlord organisation
- Larger portfolios of properties including HMOs
- Let to students
- Bought with intention of letting
- Most likely to have buy to let mortgage
Meeting legal requirements - 24%
Landlords likely to be compliant with most legislation, though less likely to be compliant with good practice indicators.
- Get information from GOV.UK, online forums and other websites
- Larger portfolio of properties
- Let to a range of tenants including white collar workers and professionals
- See properties as investment for rental income
- More likely to be in work and separate from letting practice
Mixed compliance - 35%
Landlords likely to report mixed compliance with legislation for last let, though many comply with good practice indicators.
- Get information from online sources and their letting agents
- Likely to have 1 or 2 properties only
- More likely to have rental income under £10,000 p/a
- More likely to be retired
- Unlikely to have a loan or borrowing
Lower compliance and awareness - 11%
Landlords least likely to be compliant with either legislation or good practice indicators.
- Get information from informal sources
- Likely to have 1 or 2 properties only
- Most likely to be concerned with tenant behaviour
- Bought first property to live in themselves
- In work separate to landlord practice
1. Legal requirements and good practice
1.1 This section provides an overview of the questions and responses on legal requirements and good practice indicators collected as part of the EPLS.
1.2 Results from the EPLS for each question included in the segmentation (detailed in the next chapter) are presented in this chapter. As the cluster analysis described in this report includes responses from landlords only (rather than agents responding on behalf of landlords) the figures presented here are for landlords only.
1.3 Throughout this report, the term ‘compliance’ is used to describe adherence both to legal requirements and good practice indicators.
1.4 Underlying data for this chapter are presented in Annex Table 1.1.
Legal requirements
1.5 The EPLS asked a series of questions about compliance with requirements that, at the time of the survey, landlords were legally obligated to carry out. This section will detail these questions and describe reported levels of compliance.
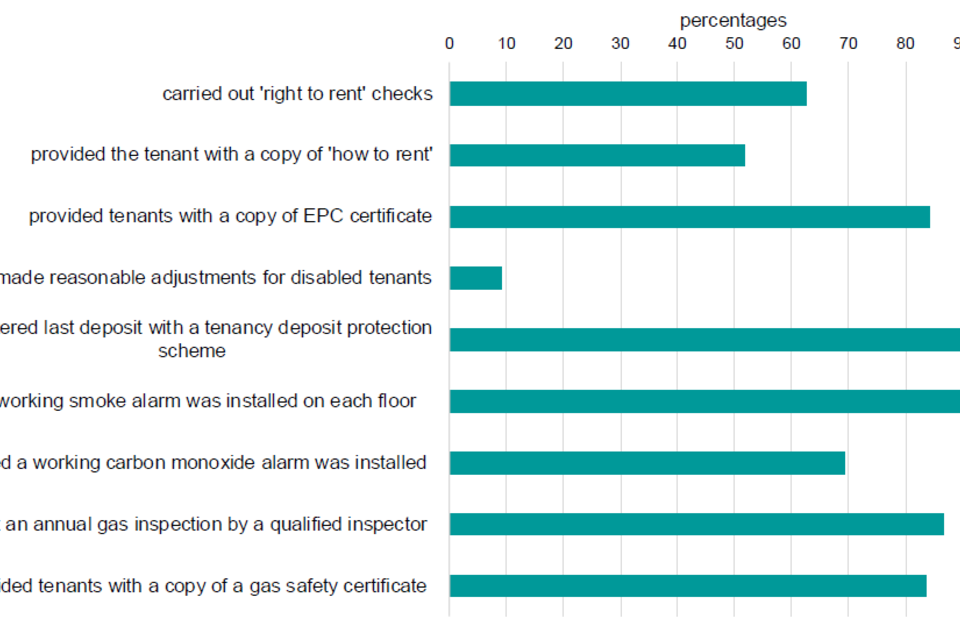
1.6 Since February 2016, all landlords and agents letting a property in England were legally required to undertake ‘Right to Rent’ checks. These checks are intended to confirm whether prospective tenants have the legal right to reside, and therefore rent a property, in the UK. The EPLS asked landlords whether they had undertaken these checks for their last letting. Almost two-thirds of landlords (63%) had performed Right to Rent checks for their most recent tenancy.
1.7 Since 2015, landlords are required to issue the ‘How to rent: a checklist for renting in England’[footnote 5] guide to all tenants. Giving their tenant this document is mandatory if a landlord would like to access the ‘no fault’ eviction process under section 21 of the Housing Act 1988. Half (52%) of landlords reported doing this for their most recent letting.
1.8 Landlords are also required to provide tenants with a copy of the Energy Performance Certificate (EPC)[footnote 6] and ensure all properties have a minimum ‘E’ rating on the EPC (the highest energy efficiency rating is A and the lowest is G). Overall, 84% of landlords say they provided a copy of the EPC related to their rental property or properties.
1.9 Because the EPLS uses the 3 government-approved tenancy deposit schemes as a sample frame for the survey, all landlords in the sample will have registered a deposit with a TDP scheme for at least one of their properties. However, they may not have done so for their most recent letting. The EPLS asks landlords whether this is the case, and this analysis includes answers to this question as part of compliance with legislation. Most (96%) of landlords said they had registered the deposit for their most recent letting.
1.10 Landlords and agents also have to comply with legal requirements related to the management and maintenance of their rental property. One of these measures includes ensuring a working smoke alarm is installed on each floor of the property. Compliance with this legal requirement is generally high. Overall, 98% landlords report they ensured a working smoke alarm was fitted in their last letting.
1.11 Since October 2015, if a property has a solid fuel appliance, it must also be fitted with a carbon monoxide detector. Over two-thirds (69%) of landlords said they ensured a carbon monoxide detector in their last letting[footnote 7].
1.12 Where gas is installed in a property, there is a requirement to undertake an annual gas safety inspection and provide a gas safety certificate to tenants[footnote 8]. The EPLS shows that 87% of landlords carried out an annual gas safety inspection with respect to their most recent letting.
1.13 Where asked to do so by tenants, landlords and agents are required, under the Equality Act 2010, to make reasonable adjustments for disabled people when undertaking a letting. Nearly 1 in 10 landlords (9%) report making these adjustments with their last letting, though more than two-thirds (68%) said that they either did not know or this was not applicable to their last letting.
Figure 1.1: Compliance with legal requirements in the EPLS
Base: all landlords; weight: registrant weight
Notes: (1) underlying data are presented in Annex Table 1.1; (2) ‘Yes’ responses to multi code variables presented together.
Source: English Private Landlord Survey 2018
Good practice indicators
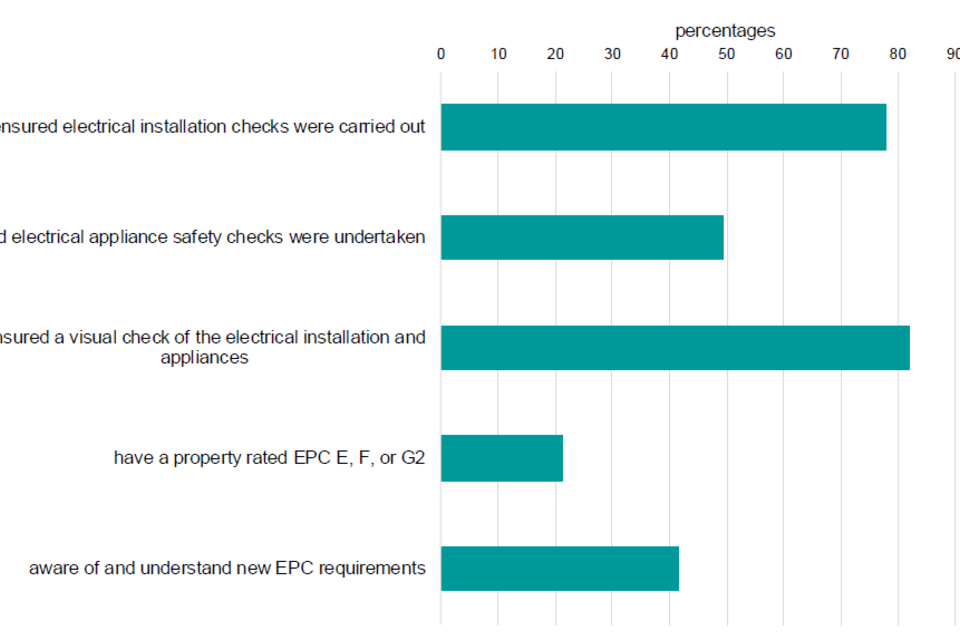
1.14 In addition to compliance with legal requirements, the EPLS also asks about compliance with good practice indicators, and about awareness of forthcoming policy changes. While not mandatory for all landlords, responses to these questions can indicate a level of engagement with their role as a landlord that is relevant to this analysis.
1.15 The EPLS asks landlords whether they carried out electrical installation checks on their most recent letting. The checks need to be carried out by a suitably qualified person who will provide a certificate as evidence of the checks. In the EPLS, 78% of landlords reported carrying this out. For HMOs, electrical installation checks are a mandatory requirement[footnote 9] at least every 5 years but this was not the case for all privately rented properties. As such, for the purposes of this report, these checks are categorised as good practice.
1.16 Like electrical installation checks, electrical appliance safety checks are legally required for landlords who let houses of multiple occupation (HMOs) but considered good practice for other types of property[footnote 10]. In the EPLS, 49% of landlords reported carrying out these checks.
1.17 There are some other indicators we have included as good practice, though they were not part of the series of questions that asked about steps taken for a landlord’s last letting. For example, the EPLS asked landlords whether they had any properties with an EPC rating of E, F, or G. With respect to the rating of properties, three-fifths (61%) of landlords reported that none of their rental properties had an EPC rating at E or below. Nearly one-quarter (21%) said they had properties with a rating of E or lower. A further 16% did not know the EPC rating of their property.
1.18 Related to this, we asked landlords if they were aware of new requirements concerning minimum EPC standards. As of 1 April, 2018, properties that are rented out in the private rented sector have to have a minimum EPC rating of ‘E’. More than two-fifth of landlords (42%) said they were aware of these requirements and understood them, with a further two-fifths (42%) saying they were not aware of these new requirements. Less than one-fifth (17%) said they were aware of but did not fully understand the requirements.
Figure 1.2: Compliance with good practice in the EPLS
Base: all landlords; weight: registrant weight
Notes: (1) underlying data are presented in Annex Table 1.1; (2) ‘Yes’ responses to multi code variables presented together.
Source: English Private Landlord Survey 2018
2. Segmentation
2.1 This chapter outlines the results of the segmentation using latent class analysis (LCA). Landlords were assigned to a cluster based on their answers to questions about their compliance with and awareness of legislation and good practice indicators. Demographic and other variables were also included in the second stage analysis but did not contribute to the initial categorisation of landlords.
2.2 This method enables us to describe the overall characteristics of each cluster while segmenting purely based on patterns of compliance with legal requirements and good practice indicators. Landlords are assigned a cluster based on similarities in their patterns of compliance, though actual compliance may vary within the clusters.
2.3 This chapter begins by describing the proportion of landlords represented by each cluster. However, the balance of the figures described in this report are not proportions, but conditional probabilities. These give the likelihood that a landlord classified to a cluster would give a specific answer to a question. These figures will not be the same as the proportion in each cluster who gave a particular answer.
2.4 The LCA identified 4 distinct groups in the landlord population covered by the EPLS. These 4 segments each show a different pattern of compliance across legal requirements and good practice indicators. Follow up analysis was then carried out to identify further distinguishing characteristics of the groups.
2.5 Below, we describe the 4 clusters identified, and their distinguishing patterns of compliance with legislation and good practice on which the segmentation of the groups was based. We later go on to describe other characteristics of landlords within the cluster that, while not the basis of the segmentation, were nonetheless significantly distinctive.
2.6 Underlying data are presented in the annex tables that accompany this report. Compliance variables, or ‘active’ covariants, are described in Annex Table 2.1. All inactive covariants are presented in tables 2.2 through 2.5, in tables corresponding to their subject headings.
Figure 2.1: Prevalence of clusters within the landlord population
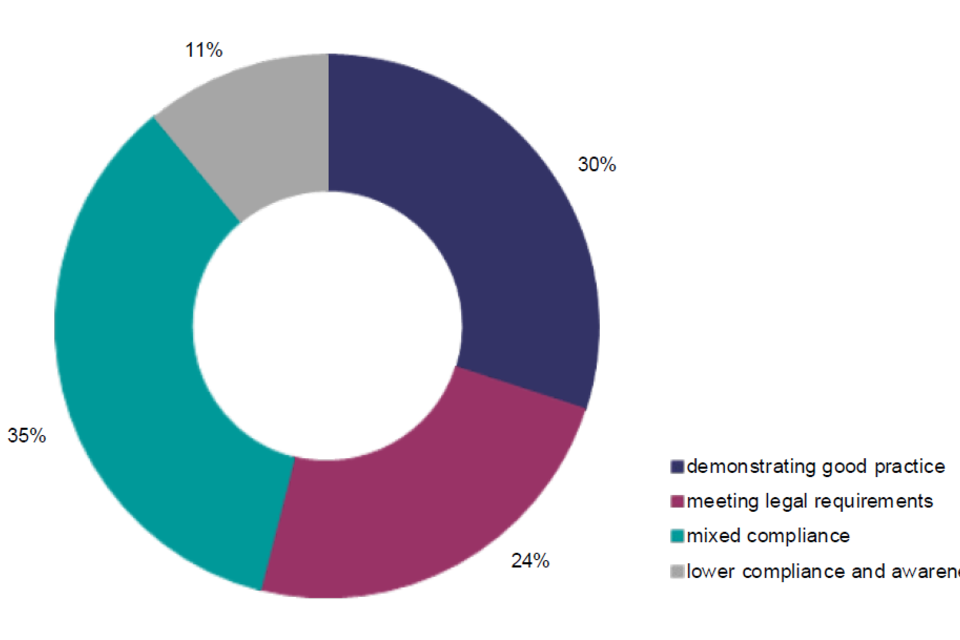
Cluster one: demonstrating good practice
2.7 This cluster was the second largest, accounting for 30% of the landlord population. Landlords in this cluster were likely to have been compliant with all requirements for their last let as well as to have undertaken good practice indicators.
2.8 Landlords in this cluster were most likely to have carried out Right to Rent checks – they had a 94% likelihood of having done this for their last let. This cluster of landlords had a similarly high probability of having issued the How to Rent guide to their tenants, an 89% likelihood.
2.9 Similarly, in terms of safety and energy efficiency, they were most likely to have provided tenants with a copy of the EPC certificate. They were among the most likely to have carried out electrical installation tests. For both of these requirements, landlords allocated to cluster one had a 99% likelihood of saying they did this.
Good practice indicators
2.10 In terms of good practice indicators, landlords in cluster one were likely to have shared results from electrical inspections with tenants. Landlords in this cluster had an 81% likelihood of saying they had done this. They were also more likely to say they were aware of upcoming regulation changes with regard to EPC standards – they had a 59% likelihood of answering they were aware of these regulation changes.
2.11 Landlords in this cluster were the most knowledgeable about their most recent let: they were consistently less likely to have answered don’t know or not applicable[footnote 11] at each of the legal requirements and were very likely to know the EPC ratings of their properties. However, they also tended to have poorer EPC ratings within their portfolio – landlords in this cluster were most likely to say their portfolio included at least 1 property rated E, F or G – they had a 28% likelihood of giving this answer[footnote 12].
Cluster two: meeting legal requirements
Legal requirements
2.12 This segment was the third largest, at just under a quarter of the population (24%). Landlords in this cluster were still more likely than not to say they carried out most of the legal requirements for their last let, though not as likely as those in cluster one.
2.13 Landlords in cluster two were less likely than those in cluster one to say they’d carried out Right to Rent checks for their most recent let – they had a 75% likelihood of saying they had done this, while those in cluster one had a 94% likelihood of saying they had done so.
2.14 Similarly, those in cluster two were less likely than those in cluster one to report having issued the How to Rent guide to their tenants – they had a 65% likelihood of reporting that they had done this.
2.15 Landlords in cluster two had similar probabilities of having installed working smoke alarms to those in cluster one. The probability that a landlord had complied with this legal requirement was relatively high across all landlord groups.
Good practice indicators
2.16 Landlords in this cluster were less likely to have undertaken certain good practice measures with their last let, such as carrying out electrical inspections and sharing the outcome of this with tenants. Landlords in this cluster had a 26% likelihood of saying they shared the outcome of all electrical inspections with their tenants.
2.17 Landlords in cluster two were also less likely than those in cluster one to report having carried out electrical installation checks (39% likelihood) or electrical appliance checks (18% likelihood).
2.18 Landlords in cluster two appeared less informed than those in cluster one about policy and regulatory changes. They were less likely to say they knew about the upcoming EPC regulation changes (they had a 47% likelihood of saying they were aware of and understood these requirements, compared to 59% likelihood among cluster one, and 29% among cluster three).
Cluster three: mixed compliance
2.19 This cluster was the largest of the 4, at 35% of the landlord population. The compliance and good practice picture among this cluster was more mixed than clusters one and two. Generally, landlords in cluster three seemed less likely than those in clusters one and two to say they had carried out the legal requirements for their last let. However, in terms of demonstrating good practice the picture was more mixed, with landlords in this cluster more likely than those in clusters one and two to have fulfilled particular good practice indicators[footnote 13].
Legal requirements
2.20 Landlords in cluster three were less likely to report they had provided tenants with How to Rent guides or had carried out Right to Rent checks. Landlords in this cluster had a 19% and 37% likelihood of saying they had done these, respectively.
2.21 Similarly, landlords in this cluster seemed less likely than those in clusters one or two to say they had provided their tenants with copies of EPC certificates; they had a 75% likelihood of giving this answer, compared to a 95% likelihood in cluster two, and 99% in cluster one.
2.22 They had a similar – very high – likelihood of having installed smoke alarms compared to landlords in both clusters one and two.
Good practice
2.23 Landlords in this cluster were more likely than those in clusters one or two to report they did not know the EPC rating of their properties – they had a 19% likelihood of giving this answer. Similarly, landlords in this cluster seemed less likely to say they knew about changing EPC requirements (55% likelihood).
2.24 Landlords in this cluster were less likely than clusters one or two to say they had properties with poor EPC ratings among their portfolio – they had a 16% likelihood of giving this answer, compared to 26% and 28% for clusters one and two.
2.25 Landlords in cluster three fared well in terms of electrical safety good practice and seemed more similar to cluster one in this respect. For example, they were very likely to say they had completed electrical installation checks (100% likelihood of giving this answer), electrical appliance checks (67% likelihood) and electrical appliance visual checks (93% likelihood).
2.26 Landlords in this cluster were also likely to say they provided tenants with the outcome of electrical inspections – they had a 74% chance of saying they had done so. Also, there was only a 7% likelihood that a cluster three landlord had not undertaken formal electrical inspections.
Cluster four: lower compliance and awareness
Legal requirements
2.27 This was the smallest cluster at 11% of the landlord population. Landlords in this cluster were the least likely to be compliant with all regulations included in the model and were also the least likely to know whether particular requirements had been carried out.
2.28 Landlords in this cluster were least likely to say that they carried out Right to Rent checks. They had a 21% likelihood of saying that they had done this. Similarly, they were least likely to report having issued tenants with How to Rent guides – they had a 9% likelihood of saying they had done so.
2.29 Cluster four landlords had similar responses with respect to practices regarding EPCs. They were least likely to say that they had done this and were most likely to say either that they had not, or that they did not know/it was not applicable.
2.30 Although overall likelihood of installing a smoke alarm was very high across all clusters, landlords in cluster four were least likely to say that they had done this. They had a 90% likelihood of saying they had done this, compared with clusters one to three, for whom this answer was near-certain.
Good practice
2.31 Landlords in this cluster were most likely to say they did not know the EPC rating of their properties and that they did not know about upcoming EPC requirement changes. They had a 36% and 71% likelihood of giving these answers, respectively. Landlords in cluster four were the least likely to say they had a property with a poor EPC rating (7% likelihood of giving this answer); however, this could partly be driven by the lack of knowledge about their properties, or the number of properties in their portfolios.
2.32 Landlords in cluster four were also least likely to demonstrate good practice with regard to electrical checks. They had a 42% likelihood of reporting they carried out visual inspections of electrical appliances, dropping to a 34% likelihood of saying they had carried out installation checks, and 11% for appliance checks.
2.33 Landlords in cluster four were similarly likely to those in cluster two of having carried out some electrical safety good practice indicators. Landlords in cluster four had a 45% likelihood of saying they had not carried out any formal inspections, and a 26% likelihood of saying they had shared the outcome of electrical inspections.
2.34 Landlords in cluster four were much more likely, across all variables, to have answered ‘don’t know’ / ‘not applicable’ than those in other clusters. It is not possible to distinguish between these two answer options, though they have different implications for interpreting the compliance profile of the cluster. This is further explored in the next section.
Cluster characteristics
Characteristics of cluster one: those ‘demonstrating good practice’
- Landlord A bought their first property with the intention of letting it out. Since then, their portfolio grew. They now let out a number of properties, including purpose-built flats and HMOs, and to a wide range of tenant types including students and unrelated adult sharers.
- They are a member of a landlord association and use this to get information about issues such as tax, regulation changes and law.
- In addition, they use of GOV.UK and other websites to gather information and are generally aware of the changing legislative landscape and their responsibilities as a landlord. This is reflected in their practice; they carried out all relevant legal requirements and good practice activities for their most recent let.
- Their property is a significant part of their professional and financial plan; they might view their role as a full or part time business and are engaged and knowledgeable about the quality of their portfolio.
- They feel concerned about future legislative changes that might affect their letting practice.
2.35 The characteristics of this cluster suggest these landlords were more likely to be semi-professionalised in their practice.
2.36 Landlords in this cluster were less likely to say they were in full or part time work than those in other clusters and, along with cluster two, were more likely than clusters three and four to report that they were self-employed as a landlord.
2.37 Landlords in this cluster were also more likely to report being part of a landlord association, such as the National Landlord Association (NLA) or Residential Landlord Association (RLA). Landlords in this cluster were least likely to say they did not belong to any landlord association or organisation.
2.38 Correspondingly, landlords in cluster one tended to report they received their information about issues such as tax, regulation and the law from their landlord organisations and were more likely to do so than those in the other clusters. Other likely sources of information among this cluster were online government resources and other online media, including newspapers.
2.39 Landlords in this cluster were likely to say that they returned their last deposit in full to the tenants but were also likely (with cluster two) to report having at least one tenant in arrears at the time of completing the survey. This may reflect the fact they were also more likely to have multiple properties, increasing the odds that at least one of their tenants might have fallen into arrears.
2.40 Landlords in cluster one, similar to cluster two, were less likely to say their whole portfolio was managed by an agent than those in clusters three or four.
Property portfolio
2.41 Landlords in cluster one were more likely to say they let to students than those in other clusters, which may suggest that some of these landlords are specialist or commercial student let providers. Otherwise, the landlords in this cluster tended to be fairly diverse in who they let to.
2.42 Perhaps consistent with their increased likelihood of letting to students, landlords in this cluster (similar to cluster two) also tended to have more than one property in their portfolio and were more likely to have let their last property recently, compared with clusters three or four. They were comparatively unlikely to say that they had let their most recent before 2015.
2.43 Landlords in this cluster – similar to those in cluster two – tended to answer that they had bought property with the intention of letting it out, and relatedly tended to report having buy to let mortgages. This suggests these two clusters were more likely to have become landlords intentionally, as part of a business or financial plan.
2.44 The reported market values of landlords’ property portfolios in cluster one, again similar to cluster two, tended to be higher than those in clusters three and four. For example, they were more likely to report a total market value of a million pounds or more compared to those in clusters three or four.
Policy awareness and concerns
2.45 Landlords in this cluster tended to report being more aware of upcoming proposed and actual tax changes. For example, similar to cluster two, landlords in cluster one were likely to report knowing about the proposed increase in stamp duty for the purchase of second and additional residential property. They were more likely to report that they had a good understanding of proposed or actual changes.
2.46 Landlords in cluster one were more likely to say they were aware of some forthcoming changes than those in cluster two, such as the proposed reduction in Capital Gains Tax for non-property investments and the increase in the minimum rent to mortgage ratio a lender will allow on a buy-to-let (re)mortgage. Otherwise the two clusters were similar in their reported awareness of proposed changes, and both clusters were considerably more likely than clusters three and four to say they were aware of these.
2.47 Perhaps related to their greater likelihood of engaging with relevant policy and legislation changes, landlords in this cluster tended to be report they were worried about legislative changes, more so than those in clusters three and four. They were more likely to report being worried about legislative changes than financial concerns or tenant behaviour.
Characteristics of cluster two: those ‘meeting legal requirements’
- Landlord B bought their first property with the intention of letting it out and have since grown their property portfolio, letting to a range of tenants including white collar workers and professionals.
- They tend to get information about their responsibilities as a landlord from GOV.UK, online forums and other websites, as well as their letting agent.
- They are generally engaged in their responsibilities as a landlord and tend to ensure they carry out all the legal requirements for their last let, especially those relating to EPCs and safety. They don’t tend to carry out electrical inspections and checks but are knowledgeable about their portfolio.
- They view their role as a landlord as an investment for rental income, alongside other economic activities.
- They are aware of some of the upcoming changes that might affect their letting practice and may have some concerns about legislative changes.
Profile and letting practices
2.48 Compared to those in cluster one, landlords in cluster two were less likely to report being a member of a professional landlord association, though still more likely to report being a member of a landlord association than those in clusters three or four.
2.49 Relatedly, landlords in cluster two were less likely than those in cluster one to report getting their information about regulation, tax and the law from a landlord association. However, they had a similar likelihood of reporting getting information on these issues from other sources, including online media, including newspapers and online government resources.
2.50 Landlords in cluster two had a similar likelihood as those in cluster one of saying they bought their first property to let it out and, relatedly, to report having a Buy to Let mortgage. Landlords in this cluster tended to consider their lets as an investment for rental income, more so than all other clusters.
2.51 This suggests that while cluster two tends to be more professionalised in their practice than those in clusters three and four, is still not professionalised to the degree of cluster one, and is more likely to also include landlords letting property alongside other economic activities.
Property portfolio
2.52 Differences between clusters one and two were very slight in terms of their typical property portfolios and, as such, it is difficult to clearly distinguish between them.
2.53 However, landlords in cluster two seemed less likely than those in cluster one to report letting to students and unrelated adults (sharers) and were more likely to say they let to lone parents.
2.54 Although the profile of property types was very similar between clusters one and two, landlords in cluster two seemed less likely to report having houses in multiple occupation (HMOs) in their portfolio compared to cluster one. This agrees with the reported tenant profile of cluster one being more likely to include adult sharers, and the suggestion that cluster one might include more commercial or specialist landlords.
Policy awareness and concerns
2.55 With some exceptions, landlords in cluster two were less likely to say they were aware of upcoming changes to tax legislation than those in cluster one, though were more aware of these than those in clusters three and four.
2.56 For example, landlords in this cluster were less likely to say they were aware of the ban on letting fees, reduction in Capital Gains Tax for non-property investments and the change in the approach to wear and tear allowance than those in cluster one.
2.57 In terms of their concerns as landlords, cluster two had a similar profile to cluster one and were generally more likely to say they felt concerned about financial issues and legislative changes than clusters three and four.
Characteristics of cluster three: landlords with ‘mixed compliance’
- Landlord C bought their first rental property to live in themselves and are now retired. They don’t tend to view their landlord practice as a professional endeavour but see it as a long-term investment for rental income and to contribute to their pension.
- They aren’t a member of a landlord association, and rely on GOV.UK, other online media and their letting agents to get information relating to tax and regulations affecting their practice.
- As they have just 1 or 2 properties, their current tenant base is not very diverse and is generally made up of couples, and single people living alone.
- They may have some awareness of upcoming tax and regulation changes, but generally don’t feel as though they have a good understanding of these.
- They are a bit more hands-off with their lets and may not know all of the details. However, although they may not have carried out all of the document regulations, they have ensured safety measures are in place and have carried out electrical checks and assurances.
Profile and letting practices
2.58 Landlords in cluster three were more likely to say they were retired than those in clusters one and two. They were less likely to say they were self-employed as a landlord. In line with their likelihood of being retired, landlords in this cluster were more likely to be over 65 than those in other clusters.
2.59 Landlords in this cluster were less likely than those in clusters one or two to say they were a member of a landlord organisation such as the NLA, or RLA, and were likely to report not being a member of any landlord association.
2.60 In line with this, they were less likely than clusters one or two to report getting their information about issues such as tax, regulation and the law from a landlord association. They were also less likely to report getting information from online landlord forums or online government resources.
2.61 Landlords in this cluster were less likely than those in one or two to say they had bought a property with the intention of letting it out and relatedly were less likely to say they had a Buy to Let mortgage.
Property portfolio
2.62 Landlords in cluster three were more likely to say they had just one property than those in clusters one and two. Landlords in this cluster were also more likely to have let out their most recently let property longer ago – pre-2015 – than those in clusters one and two. For some landlords in this cluster, it may be the case that some of the legal requirements with which they had not complied did not apply at the time of their most recent let.
2.63 Landlords in cluster three were more likely to be landlords who let out property on a smaller scale and as a means of capitalising on their personal circumstances. They were more likely to say they had one additional property, not originally bought with the intention of letting, and for which they do not have a mortgage.
2.64 In line with the likelihood of smaller portfolios of landlords in this cluster, they were also more likely to report having a lower market value than those in clusters one and two. For example, they were more likely to have a total market value of less than £200,000 than those in clusters one or two.
2.65 Cluster three landlords tended not to report getting new tenants from a letting agent website, compared to those in clusters one and two. This may reflect the comparatively lower turnover of tenants in their portfolios.
2.66 Perhaps reflecting the smaller portfolios of this cluster, those in cluster three were less likely to say they let to a broad range of tenant types than the larger portfolio landlords. Landlords in this cluster were more likely to let to couples without dependent children.
Policy awareness and concerns
2.67 Landlords in cluster three were less likely than those in clusters one and two to be aware of upcoming tax regulation changes and to report having a good understanding of these.
2.68 More than other changes, landlords in this cluster reported being aware of the increase in stamp duty for the purchase of second and additional properties. However, they were still less likely to report being aware of this than those in cluster one or cluster two.
2.69 Landlords in this cluster were also less likely than those in one and two to report having a good understanding of the details of most upcoming tax regulations changes, including changes to the wear and tear allowance approach. They were, however, more likely to report understanding this than those in cluster four.
2.70 Possibly reflecting their stated lack of knowledge about upcoming legislative changes, landlords in this cluster tended to be less likely to report feeling concerned about legislative changes compared to clusters one and two.
Characteristics of cluster four: landlords with ‘lower compliance and awareness’
- Landlord D bought their first rental property to live in themselves, and last let it out a few years ago. They have a small portfolio of just 1 or 2 properties.
- They are in work separate to their letting practice and are generally very hands-off as a landlord, often not knowing whether particular measures are in place, though some of these came into effect after their property was most recently let.
- They aren’t a member of a landlord association and rely on online sources, as well as media and family and friends, to get information about tax and regulation changes that may affect their practice.
- They have limited awareness of a range of upcoming tax or regulation changes and are not confident in their knowledge of those which they are aware. They have some concerns about these legislative changes.
- Being a bit more detached from their property is reflected in their practice; they tend to have not carried out the various legal requirements or good practice indicators for their last let. They are also less likely to know about whether these have happened, though some may have come into effect after they most recently let.
Profile and letting practices
2.71 Landlords in cluster four were similar to those in cluster three in many ways, with some relevant differences.
2.72 Similar to cluster three, landlords in cluster four were less likely to say they were a member of a landlord association such as the NLA or RLA. Landlords in cluster four were also more likely than those in cluster three to say they were not a member of any landlord association.
2.73 Landlords in cluster four were also more likely to report being in other full-time employment than those in cluster three, who were more likely to be retired. They had a similar likelihood to those in cluster three of saying they were self-employed as a landlord, less so than in clusters one or two.
2.74 In terms of sources of information about issues such as tax, regulation and the law, landlords in cluster four tended to give similar answers to those in cluster three. However, they were less likely than cluster three to report getting their information from a landlord association and were more likely to report getting information from family and friends.
2.75 Landlords in cluster four were more likely than those in all other clusters to have bought their rental property to live in it themselves. However, they were still more likely than those in cluster three to say they have a Buy to Let mortgage.
Property portfolio
2.76 Landlords in cluster four were similar to cluster three in terms of portfolio size and tended to have just one property. They were more likely still than cluster three to say they had let their last property pre-2015. As above, this may mean that some of regulations are not applicable to the lets represented by this cluster.
2.77 Similar to cluster three, cluster four generally reported a lower portfolio market value than clusters one and two. However, their properties were more likely than cluster three’s to have a slightly higher market value, of between £200,000 and £499,999.
2.78 Related again to portfolio size, landlords in clusters four and three generally had lower rental incomes from their properties than those in clusters one and two. Landlords in cluster four, for example, were more likely than those in one and two to say they had an annual rental income of up to £14,999. In contrast, landlords in cluster one were likely to report having an income of £35,000 or higher.
2.79 Together with cluster three, those in cluster four were more likely than those in one or two to say that their whole portfolio was managed by an agent, compared to clusters one and two.
2.80 Length of time as a landlord did not seem to have particularly different profiles across all four clusters.
Policy awareness and concerns
2.81 As might be expected, landlords in cluster four were least likely to report being aware of most upcoming tax changes and were generally less likely to be aware than cluster three, with the exception of some proposed changes.
2.82 Similar to cluster three, landlords in cluster four were more likely than those in one or two to say they were not aware of any of the listed tax regulation changes. They were also less likely to have heard of individual changes, such as the banning of letting fees, reduction in capital gains tax and changes in the wear and tear allowance approach.
2.83 Despite landlords in cluster four tending not to be aware of upcoming legislative changes, they were slightly more likely than those in three to report concern about legislative changes, though were less likely than clusters one and two to report this.
Technical notes
1. The aim of this analysis was to explore the extent to which landlords could be classified into distinct clusters on the basis of their reported compliance with the various regulations and good practice indicators, based on their responses to the EPLS questionnaire.
2. A typology of landlord compliance was derived using latent class analysis (LCA), a statistical method for finding subtypes of related cases (latent classes) from multivariate data. The technique can be used to assign individual respondents to discrete, non-overlapping clusters on the basis of patterns of responses to certain survey questions.
3. There are however, certain limitations to LCA, notably that the selection of the model (that is, the decision about which variables to include, and the number of groups that best fits the data) is inevitably subjective.
4. The data for this analysis were modelled using the package Latent GOLD. A typical analysis involves fitting several models to the data with different numbers of classes. This chapter outlines the methodology used to produce the clusters described in this report.
The EPLS sample
5. Since the 6 April 2007, in England, when a deposit is provided by a tenant to a landlord for an assured shorthold tenancy, all landlords (or their agents on their behalf) are legally required to register that deposit with a Tenancy Deposit Protection (TDP) scheme.
6. The EPLS sample was drawn from the TDP scheme administrative data. The survey was carried out online by 7,823 landlords and agents registered with 1 of the 3 government-backed TDP schemes[footnote 14].
7. It is worth noting that, as the sample frame for the main survey was the TDP data, the survey necessarily does not cover those landlords who did not take a deposit, or who did not register the deposit with 1 of the 3 TDP schemes.
8. For eligible tenancies, registering a deposit with 1 of the 3 government backed TDP schemes is a legal requirement. It could therefore be assumed that the sample for this segmentation is by definition more likely to be compliant than those not included. However, it is not possible to draw any conclusions about landlords not included in this sample, as we do not have the data to do so.
Creating a dataset for segmentation
9. This segmentation is of landlords only, as individual landlord behaviour is of particular interest. In addition, excluding agents was necessitated by the dataset as many of the relevant questions were asked only of landlords.
10. The first stage of preparing the dataset was to remove all agents, and to remove questions only asked only of agents, resulting in a more manageable dataset including only those cases and variables relevant to the modelling.
11. Some variables were renamed and labelled to help with the analysis, for example by improving interpretability when viewing in Latent GOLD output. This was the case for the core set of compliance variables, which were renamed in order to include the behaviour in the variable name rather than a numeric value. For example, ‘LetReq02’ in the EPLS dataset was renamed to LRHowrent in the LCA dataset.
12. Some other modifications to the dataset were made. We found a high proportion of ‘other’ on the EPLS question asking about sources of information about issues such as tax, regulations and the law. Investigating respondents’ open text answers to specify we found that many of these cited an accountant as a source of information, and this was considered relevant for the purposes of our follow-up analysis. We therefore created an additional category and back coded mentions of ‘accountant’ into this for the purposes of the LCA.
13. Where very few variables included categories with low counts, Latent GOLD grouped these in the modelling. In addition, we prepared the data for modelling by grouping small categories to ensure groupings were interpretable. In some instances, we set categories that were not relevant to the models to missing.
Latent class analysis
Exploring correlation and selecting variables
14. As a first stage, we explored the correlation between the various compliance variables, to identify the most efficient list of variables to include in the segmentation. For instance, if two variables were so closely correlated that one conveyed the same information about the other then we considered dropping one of these variables from the segmentation model[footnote 15]. We excluded five variables from the segmentation model for this reason. Here, when we say a variable was ‘excluded’, this means it was excluded from the list of active covariants that made up the segmentation model. These variables are, in some instances, included in the analysis, but will not be used as the basis for the segmentation.
15. We excluded the variable that described whether a landlord had registered a deposit with a TDP from the list of active covariants. This was excluded because the sample frame for the EPLS was the TDP dataset and so this variable was unlikely to be sufficiently distinctive.
16. We excluded the variable that reported whether the landlord had made adaptations for tenants with a disability from the list of active covariants. This was excluded as it had an extremely high proportion of don’t know/not applicable. As this requirement is only when requested by tenants we determined that the majority of these would be truly non-applicable, and therefore the results of segmenting on the basis of this might be misleading.
17. Three questions relating to gas safety were excluded for similar reasons, as these are only applicable in homes with gas. There were high proportions of don’t know/ not applicable answers at these questions, which we determined was likely as these properties did not have gas installed.
18. The above 5 variables were instead included as inactive, so we could determine the likely cluster allocation across each of these without them influencing the segmentation.
19. Explanatory value was balanced against DLUHC’s requirements for certain variables to be included in the model. For instance, the overwhelming majority of landlords answered that they had installed smoke alarms in their last let, so including this variable did not contribute to our ability to allocate landlords to clusters. However, as this is an important measure to DLUHC it was included in the model. Conversely, in the case of registering with a TDP scheme, which had a similar pattern of response (unsurprising given the sample frame for the survey was TDP data), we decided to remove this variable from the active covariants in the segmentation model.
20. Whether the landlord had installed working smoke alarms on each floor of the property was considered for exclusion on the basis that the overwhelming majority – almost all – landlords had answered ‘yes’ to this. However, as this is such an important requirement, it was kept in the model. The results did in fact show that while the majority of landlords were very likely to have done this, those in cluster four had a lower likelihood of having done so than the rest.
21. We selected 10 variables for use in the segmentation, including a set of questions about activities carried out for a landlord’s most recently let property, questions asking about portfolio condition, and individual questions about their letting practice. These formed our active covariates – the variables on which the segmentation would be based.
Inactive covariates
22. We also selected a longer list of inactive covariates – these were variables included in the model but not the segmentation. These meant that landlords were allocated to clusters on the basis of their answers to the questions relating to compliance and good practice, but we could also describe the likely cluster allocation across a series of other variables, such as landlord characteristics, portfolio size and quality, length of time as a landlord and use of agent. The inactive variables help us to characterise landlords with different patterns of compliance and good practice.
Segmentation
23. Once the final list of active and inactive variables was decided, we produced a series of models, using Latent GOLD, assuming a different number of clusters in each (from 2 to 5). The models were then compared using several criteria – including statistical properties and interpretability in order to select a model which best suited the interpretability requirements of DLUHC, while being statistically robust. Based on both interpretability and statistical criteria we decided to assume four clusters in our final model.
24. The two-cluster model was determined to be too few on the basis of interpretability. The table below summarises the parameters of the 3 – 5 cluster models.
A.T. 4.1 Model parameters, 3-5 clusters
| LL | BIC(LL) | Npar | L² | df | Class.Err. | Reduction in errors | ||
|---|---|---|---|---|---|---|---|---|
| Model1 | 3-Cluster | -2478331.19 | 4957209 | 43 | 775827.4 | 78688 | 13% | 0.78 |
| Model2 | 4-Cluster | -2452243.42 | 4905173 | 54 | 723651.9 | 78677 | 16% | 0.76 |
| Model3 | 5-Cluster | -2435671.72 | 4872169 | 65 | 690508.5 | 78666 | 15% | 0.80 |
25. Reduction in Errors is a pseudo R-squared statistic indicating how well one can predict class memberships based on the observed variables – the closer it is to 1 the better the predictions. The model with the lowest classification error is preferred.
26. Across our 3 models, the range in both classification error and reduction in errors was small and within acceptable bounds. We therefore looked to interpretability of the active covariates to help select our model.
27. Of 6,695 landlords who participated in the EPLS, 564 had missing data on at least one of the active variables and were therefore excluded from the model. Our base size for modelling was therefore 6,131.
28. Table 4.2 below shows the final list of 10 variables, with 6,131 responding to all ten. Table 4.2 shows that all variables contribute significantly to the model, with R² values indicating the extent to which the variance of each indicator is explained by the model. A significant p-value associated with the Wald statistic means that the indicator discriminates between the clusters in a statistically significant way.
A.T. 4.2 Variables included in the 4-cluster model
| Wald | p-value | R² | |
|---|---|---|---|
| EPCEFG | 10894.353 | 1.7e-2364 | 0.064 |
| EPCE | 21703.1017 | 2.0e-4711 | 0.1119 |
| ElcOut | 46670.0471 | 9.2e-10133 | 0.3258 |
| LRRightrent | 22539.0656 | 6.1e-4893 | 0.3299 |
| LRHowrent | 21092.2882 | 8.5e-4579 | 0.434 |
| LREPCcert | 12484.1448 | 1.1e-2709 | 0.1971 |
| LRSmoke | 3475.4281 | 9.8e-754 | 0.0612 |
| LRElecinstal | 8350.6522 | 3.5e-1812 | 0.4426 |
| LRElecappTest | 39317.1057 | 4.0e-8536 | 0.3131 |
| LRElecappVCh | 16859.3564 | 1.1e-3659 | 0.2474 |
29. The 4-cluster model was the best fit in terms of interpretability, with no groups that could not be logically interpreted, distinct differences across the clusters, and all clusters of a reasonable size (none based on too few respondents).
30. We then ran a -2LL bootstrap test comparing the 4-cluster model to the 3-cluster model, which showed that the former was a better fit for the data.
Logistic regression
31. Because clusters are not perfectly homogenous, and some of the clusters in our model had a similar distribution of active and inactive covariates, it can be difficult to understand the distinction between clusters using just LCA coefficients. Therefore, we conducted logistic regression analysis to help identify which variables predict membership to which cluster. In particular, we ran models comparing clusters 1 and 2 and clusters 3 and 4, as the distribution of active and inactive covariates was similar between these pairs.
32. The dependent variable of the model comes from the modal assignment of the cases into clusters (LCA), which means that landlords were classified to the cluster for which they have the highest membership probability. As explained above, the reduction in errors indicates how well one can predict class membership based on the observed variables (the closer to 1 the better).
33. For our 4-cluster model the reduction in errors measure was estimated at 76%, which means the model based on active covariates does not allow us to perfectly predict the classification of respondents into clusters. However, it is high enough to claim that clusters are well differentiated (different from each other with regards to active covariates).
34. Potential predictors of the class membership were entered in blocks in logistic regression: First active covariates – because they were used to build the segmentation model and will naturally explain most of the difference between the clusters. Then, inactive covariates (forward and backward stepwise method) inclusion of which allowed us to test whether we can improve the prediction of the classification using variables that were not used in building the segmentation model.
Distinguishing between clusters one and two
35. Nearly all active covariates but three were found to significantly predict the allocation to cluster 1 or 2. Whether they have a property with an EPC rated EFG rating was not found to significantly differentiate between the two clusters – neither was whether a landlord had installed smoke alarms and whether they had carried out electrical installation checks. The latter two variables were likely insignificant due to redundancy in the data.
Inactive variables
36. As above, we investigated whether additional differences between the two clusters could be explained by the inactive variables. We found that likelihood of letting to white collar, clerical or professional workers, and getting information about tax, regulations and the law from a letting agent was significant in determining whether a landlord was allocated to cluster one or cluster two.
37. Also, landlords who received their information about issues such as tax, regulations and the law from their letting agent were 1.8 times more likely to be allocated to cluster two (as opposed to one).
38. This variable was also found to be related to some of the compliance measures. For example, landlords who received information of this kind from their letting agent were also more likely to have had their electrical appliances tested. It appears that receiving information from a letting agent may increase the chances of landlords being compliant with certain measures.
Distinguishing between clusters three and four
39. In terms of the active variables (the compliance questions included in the segmentation), we found that all[footnote 16] were significant in predicting membership to either cluster three or four, i.e. the effects of all variables separately explain the allocation to clusters. The model explains a large proportion of the variance in the data, which is not surprising given the segmentation was based on these variables. This corresponds to the observations based on descriptive statistics described above, that all active variables have different distribution across the two clusters.
40. For all variables entered in the model, selecting a category other than the first one ‘yes, I have done this’, or equivalent[footnote 17] significantly increases the chances of being classified to segment four (compared to three). In particular, choosing ‘don’t know/not applicable’ on two questions about testing electrical appliances increases chances of being classified to cluster four considerably.
41. Non-applicability of questions does not explain all of the difference between clusters three and four, however, given that landlords who do not know EPC rating of their properties or who have not carried out any formal electrical inspection have also been found to be more likely to be allocated to cluster four.
Inactive variables
42. We found that two inactive covariates were significant and substantive – proportion of portfolio managed by an agent and year of last let. This means that these two variables help to explain further differences between clusters three and four, on top of what the active covariates already explain.
Limitations
Questionnaire
43. We were restricted to the questions asked in the EPLS survey, which did not include attitudinal questions around compliance, legislation or good practice. As such, our analysis was not be able to suggest reasons for non-compliance/compliance on any individual measure. For example, we cannot answer questions such as whether certain requirements were not complied with due to a lack of knowledge, or as a consequence of an active decision not to comply.
44. Another limitation of this research was the answer options presented for the compliance questions. In particular, ‘don’t know’ and ‘not applicable’ were presented as a single option. For this reason, we were unable to disentangle whether respondents giving this answer did not know whether the requirement had been carried out (which may for example be the case if they operate at an arm’s length from their property, managed by an agent), or if it was not applicable (perhaps because the tenancy predates the legislation). We carried out additional analysis to try to understand this group better, as outlined above.
EPLS sample frame
45. One of the legal requirements that landlords are asked to comply with is registering tenancy deposits with 1 of the 3 government-backed tenancy deposit schemes (TDPs). The sample frame for the EPLS was the population of landlords in the TDP dataset. Therefore by definition the EPLS population is at least in one measure compliant, and this project was not to include the perhaps more extreme end of non-compliant landlords. However, it equally cannot be assumed that because a landlord has not registered a deposit with a TDP that they are non-compliant overall.
46. Despite this, the EPLS data shows evidence of difference in compliance with other legislative requirements and good practice indicators within this group of TDP registered landlords.
-
A detailed account of landlord and agent compliance is provided in Chapter 3 of the EPLS main report. ↩
-
There are various reasons why households in the PRS might not have a deposit registered with a TDP scheme. For example, the landlord may not have taken a deposit, or the tenancy agreement may have been in place before the TDP schemes became mandatory in 2007. While some landlords will be operating outside of the law, it is not possible to say how many. ↩
-
See the most recent How to rent guide. ↩
-
Since October 2008, there has been a legal duty on landlords and agents to provide new and prospective tenants with a copy of the Energy Performance Certificate (EPC) for the property. ↩
-
We are not able to tell whether some landlords whose last let property did not have solid fuel appliance responded ‘no’ rather than ‘not applicable’. ↩
-
For properties where gas is installed, landlords have since 1998 been legally required to carry out an annual gas inspection by a qualified inspector and to provide the gas safety certificate to the tenant. ↩
-
This requirement was put in place by the Management of Houses in Multiple Occupation (England) Regulations 2006. ↩
-
Electrical safety checks are not legally required for all lettings, except HMOs where five yearly electrical installation checks are a mandatory requirement. ↩
-
Unfortunately, analysis is limited by the fact that don’t know/ not applicable are not distinguishable from one another in the data. ↩
-
As we will see in the section that describes the characteristics of these landlord groups, this increased instance of EPC E, F, or G rated properties could be driven by the fact landlords in this group are more likely to have a larger portfolio of properties. ↩
-
As with cluster four, this might be partly driven by landlords in this cluster being more likely to have properties that predate some of the legal requirements (suggested by high proportions of don’t know/ not applicable). ↩
-
In 2017-18, about three-quarters (76%) of private renters had paid a deposit when they moved into their current accommodation; about three-quarters (73%) of deposits were registered with a government-backed TDP scheme; 20% said that they did not know if their deposit was protected. The proportion of private renting households covered by a TDP scheme is therefore estimated at between 56% and 71%. ↩
-
Often, removing unnecessary variables and parameters (those that do not discriminate between the clusters) can improve classification performance and the precision of parameter estimates. ↩
-
LRElecinstal1 – whether they had carried out electrical installation checks – needed to be excluded due to data redundancy. Inclusion of variables which are too highly correlated with each other leads to collinearity and computation problems in logistic regression. ↩
-
With the exception of the question asking whether they have an EPC rating of E,F, or G, where selecting one, yes, is a negative indicator. ↩