Statistical commentary: end of life care profiles, February 2019 update
Published 5 February 2019

© Crown copyright 2019
This publication is licensed under the terms of the Open Government Licence v3.0 except where otherwise stated. To view this licence, visit nationalarchives.gov.uk/doc/open-government-licence/version/3 or write to the Information Policy Team, The National Archives, Kew, London TW9 4DU, or email: psi@nationalarchives.gov.uk.
Where we have identified any third party copyright information you will need to obtain permission from the copyright holders concerned.
This publication is available at https://www.gov.uk/government/statistics/end-of-life-care-profiles-february-2019-data-update/statistical-commentary-end-of-life-care-profiles-february-2019-update
New in this update
Updated care home and nursing home bed rates per 100 population aged 75 years and older for 2018 have been added to the End of Life Care Profiles, Care Home Use at the End of Life domain. The update includes data for local authorities, Clinical Commissioning Groups (CCGs), Sustainability and Transformation Partnership areas (STPs), Strategic Clinical Network areas (SCNs) and Government Office regions (GORs) and England. The following indicators were updated:
- care home bed rate per population aged 75 years and older in 2018 (all beds nursing and residential)
- nursing home bed rate per population aged 75 years and older in 2018 (nursing home beds only)
Main findings
This update shows:
-
in 2018 in England there were 10.1 care home beds for every 100 people aged 75 years and older - the trend over the last 5 years is decreasing
-
in 2018 in England there were 4.9 nursing home beds for every 100 people aged 75 years and older - the trend over the last 5 years is decreasing
-
in 2018 there were 459,385 beds in care homes of which 220,033 were in nursing home beds
Summary
National trends
In 2018, there were 10.1 care home beds for every 100 people aged 75 years and older and 4.9 nursing home beds for every 100 people aged 75 years and older.
The trends in care home bed rate and nursing home bed rate are shown in Figure 1. Both measures are decreasing.
Figure 1: Trends in care home and nursing home bed rate per 100 population aged 75 years and older, England, 2012 to 2018

Line chart showing the trends in care home and nursing home bed rate per 100 population aged 75 years and older for district and local authorities in England in 2012 to 2018
In 2018 there were 459,385 beds in care home of which 220,033 were in nursing homes. In 2012 there were 466,317 beds in care homes of which 216,726 were in nursing homes. Between 2012 and 2018 the population aged 75 years and older increased by 397,834 to 4,535,330.
Variation between local authorities
By district and unitary authorities the care home bed rate in 2018 ranged from 2.7 to 19.3 beds per 100 population aged 75 years and older. Figure 2 shows the spread in local care home bed rate between 2012 and 2018, and shows the median value was highest in 2012 (11.1) and lowest in 2018 (9.9).
By district and unitary authorities the nursing home bed rate in 2018 ranged from 0.3 to 14.2 beds per 100 population aged 75 years and older. Figure 3 shows the spread in local care home bed rate between 2012 and 2018, and shows the median value was highest in 2014 (5.1) and lowest in 2018 (4.8).
Figure 2: Variation in care home bed rate per 100 population aged 75 years and older for district and local authorities, England, 2012 to 2018
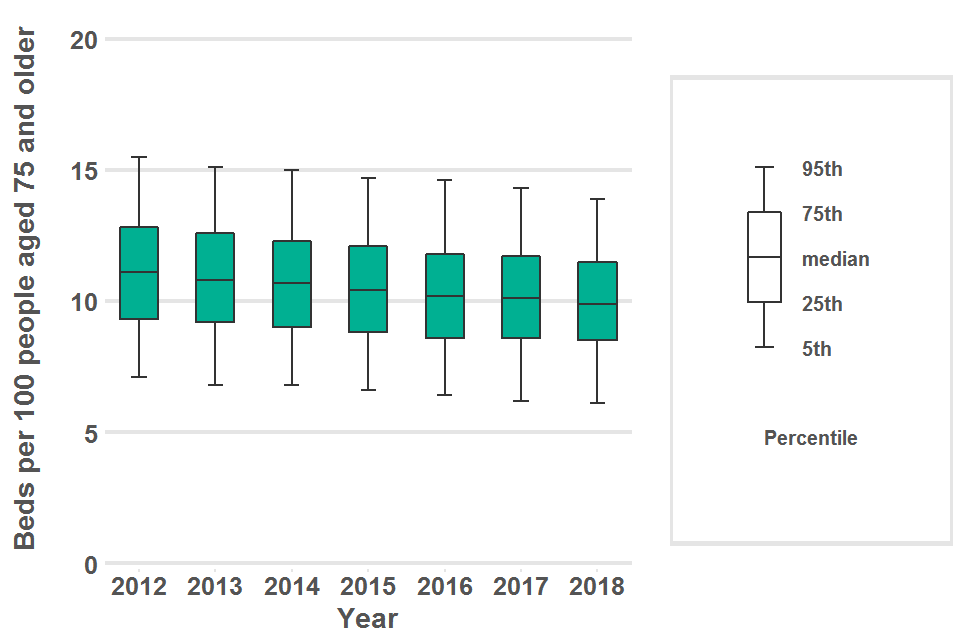
Boxplot showing the variation in care home bed rate per 100 population aged 75 years and older for district and local authorities in England in 2012 to 2018
Figure 3: Variation in nursing home bed rate per 100 population aged 75 years and older for district and local authorities, England, 2012 to 2018
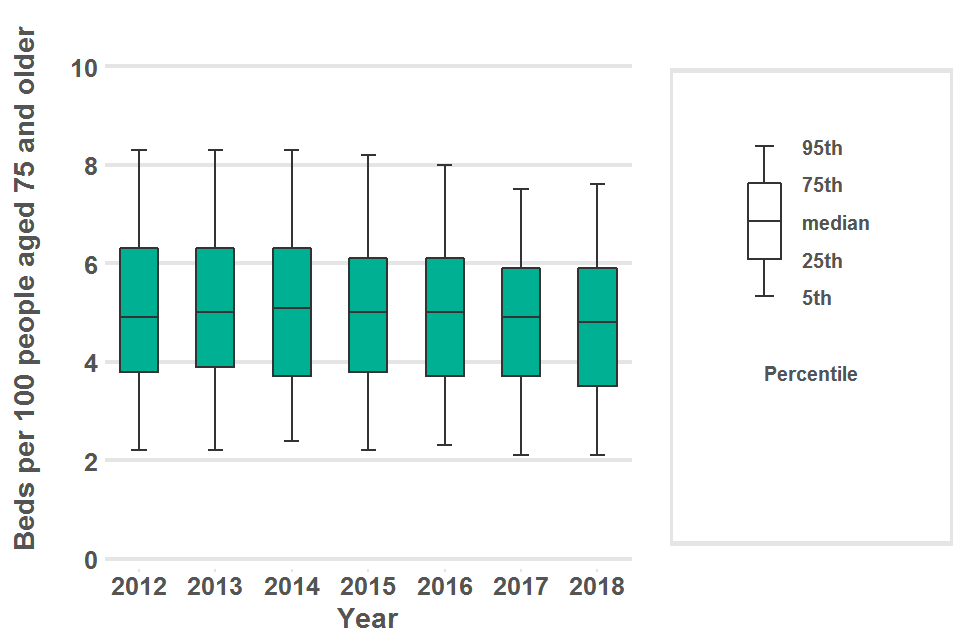
Boxplot showing the variation in nursing home bed rate per 100 population aged 75 years and older for district and local authorities in England in 2012 to 2018
Background information
The importance of care homes
It has been estimated that the increasing population of older people may increase demand for residential care and nursing home beds by as much as 71,000 by 2025 [footnote 1].
The NHS Long Term Plan (2019) identifies the need to upgrade the NHS support to all care home residents.
Methodology
The care home and nursing bed rates use the bed capacity of registered residential and nursing homes (referred together as care homes) reported by the Care Quality Commission (CQC). The rates describe the availability of residential and nursing home beds in comparison with the size of the population aged 75 years and older (as published by the Office for National Statistics). The ratio of beds to older population is a crude measure of care home bed availability.
The number of care home beds available is affected by many factors, among them the health and preferences of the population. Other factors include local policies which in recent years have seen some localities place emphasis on providing care in people’s own homes. There are also complex economic and staffing dynamics which affect the relationship between residential and nursing home beds.
End of life care profiles
The End of life care profiles aim to improve the availability and accessibility of information around end of life care. They show current values and trends in a number of measures for various geographies in England. They are intended to help local government and health services improve care at the end of life.
Data is presented in seven domains which together present indicators describing place and cause of death, specific measures of care homes, people with dementia and other related measures.
The profile contains data for England at various geographies: regions, counties, district and unitary authorities, strategic clinical networks (SCNs), sustainability and transformation partnerships (STPs) and clinical commissioning groups (CCGs).
Providing care at the end of life often involves the interaction of many different care agencies. The profiles help commissioners and providers to get a clearer picture of the end of life care needs of their local populations. This will help with the planning and delivery of services and support local drives towards improving end of life care.
View the End of Life Care Profiles
Further information
For more publicly available information from Public Health England relating to end of life care data see the 2018 Atlas of variation for palliative and end of life care in England.
Responsible statistician, product lead: Andy Pring, Julia Verne
For queries relating to this publication, please contact: neolcin@phe.gov.uk
-
Care Quality Commission (CQC) (2017) The state of adult social care services 2014 to 2017. ↩