Emergency admissions in the 3 months before death
Published 3 March 2020

© Crown copyright 2020
This publication is licensed under the terms of the Open Government Licence v3.0 except where otherwise stated. To view this licence, visit nationalarchives.gov.uk/doc/open-government-licence/version/3 or write to the Information Policy Team, The National Archives, Kew, London TW9 4DU, or email: psi@nationalarchives.gov.uk.
Where we have identified any third party copyright information you will need to obtain permission from the copyright holders concerned.
This publication is available at https://www.gov.uk/government/publications/emergency-admissions-in-the-3-months-before-death/emergency-admissions-in-the-3-months-before-death
1. Introduction
Every year in England about half a millon people die. The NHS has adopted the key performance indicator ‘The percentage of deaths with 3 or more emergency admissions in the last 3 months of life’ in its Oversight Framework for 2019 to 2020 along with the CCG Improvement and Assessment to encourage improvement in the quality of end of life care in the following ways:
- co-ordinated and timely anticipatory planning and end of life care
- important information about the person’s condition, needs and preferences being shared across the local health and care system
- local community services should be configured so they can be responsive to patient’s urgent end of life care needs
Intended as a measure of end of life care services, this is not a direct measure of the quality of care at the individual level. It is actively monitored by Sustainable Transformation Partnerships (STPs) and Clinical Commissioning Groups (CCGs) that are encouraged to investigate when this measure is high, which could indicate:
- poor identification of people at risk of death
- poor planning and availability of services
- poor communication, co-ordination and information sharing
This indicator will be affected by many factors. This report identifies how this measure can vary for different groups of patients by their sex, age at death, cause of death and where they live (region, social deprivation and rurality). It focuses on people with 3 or more emergency hospital admissions in the last 3 months (90 days) of life, presenting:
- 10-year trends to 2018
- variations by age, sex, cause of death, area of residence, deprivation, rurality and ethnicity in the 5 years from 2014 to 2018
- time spent in hospital through emergency admission
2. Main findings
The percentage of people with 3 or more emergency admissions in the last 3 months of life was:
- highest for people with an underlying cause of death of liver disease, COPD and cancer
- highest in the London NHS region
- higher in urban areas than rural areas
- higher for males than females
- lower for White British than all other ethnic groups
- higher in females than males for those aged under 70
- higher in males than females for those aged 70 and older
Of the people with 3 or more emergency admissions in the last 3 months of life:
- more than a quarter had cancer as the underlying cause of death
- three-quarters spent at least 13 days in hospital
- most were aged 70 and older
3. Overview
The number of deaths per year has increased from 457,115 in 2009 to 504,094 in 2018. The percentage of people with 3 or more emergency admissions in the 3 months before they died increased from 5.6% to 7.5% (25,746 to 37,749 deaths) over this period – an increase of 33.9%. For comparison, the percentage of people with 3 or more emergency admissions during the year before they died increased from 20.8% to 25.4% (95,106 to 127,919 deaths) – a smaller increase of 22.1% (Figure 1).
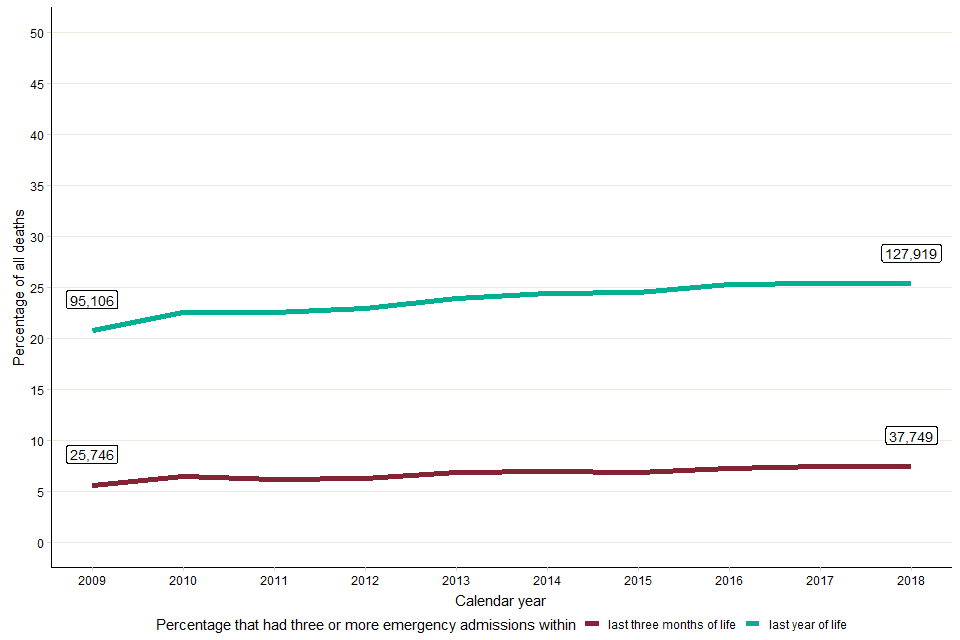
Figure 1: The percentage of all deaths in England that were preceded by 3 or more emergency admissions in the last 3 months of life and the last year of life, 2009 to 2018. Labels denote the number of 3 or more emergency admission deaths for 2009 and 2018.
4. Age and sex
Between 2014 and 2018, the people with 3 or more emergency admissions in the last 3 months of life were:
- mostly male (54.4%), compared to female (45.6%)
- mostly older, with 69.6% (24,589) aged 70 or older, compared to 30.4% (10,723) under 70
The percentage of people with 3 or more emergency admissions in the last 3 months of life (Figure 2):
- was 6.4% for females (16,090 in 249,999)
- was 8.0% for males (19,222 in 240,131)
- ranged from 3.8% to 17.1% for males by 5-year age groups
- ranged from 1.9% to 13.5% for females by 5-year age groups
- highest in 5- to 9-year-olds and lowest in 100-year-olds and older
- higher in females than males from 15 to 70, particularly between 25 to 29 where the percentage for females is twice as high as that for males, though the numbers are small
- higher in males than females over 70. Overall the ratio of the percentage for females to the percentage for male ranges for 5-year age bands from 0.5% to 2.1%
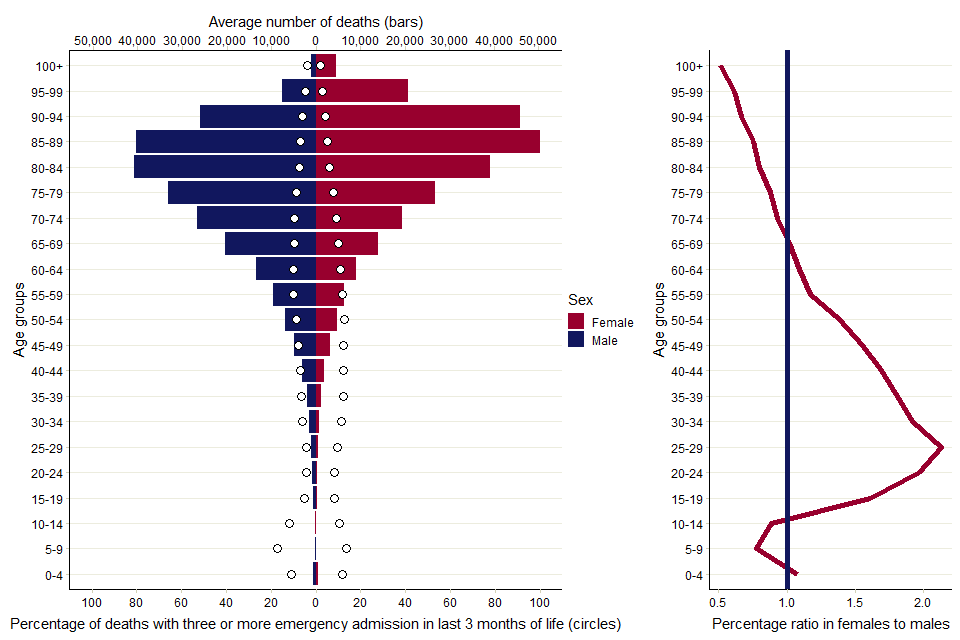
Figure 2: (Left) The average number of all deaths (bars) and the percentage (circles) with 3 or more emergency admissions in the last 3 months of life, by age group and sex. (Right) The percentage ratio of 3 or more admissions female to male by age; aggregated data of 5 years (2014 to 2018).
5. Geographic variation
CCGs are clinically-led statutory NHS bodies responsible for the planning and commissioning of healthcare services for their local area. Across all 191 CCGs in England, the percentage of people with 3 or more emergency admissions in the last 3 months of life:
- ranged from 4.1% (South Eastern Hampshire) to 12.3% (Newham), with a median of 7.5%
- was lowest in the South West with a CCG median of 5.4% and highest in London with a CCG median of 8.7%
- had the greatest range in North East and Yorkshire CCGs (4.6% to 12.2%)
- had the smallest range in South West CCGs (4.9% to 7.0%)
- had the greatest overall variation in the South East, with an interquartile range (IQR) of 1.93, and smallest in the East of England with an IQR of 1.28 (Figure 3)
The length of the ‘whiskers’ on the box plots below in Figure 3 extends to the lowest or highest value of no more than 1.5 times the IQR. Outlier CCGs fall outside of these ranges. This graph shows that, across England, CCGs typically have a higher percentage of people with 3 or more emergency admissions in the last 3 months of life in the northern regions than the southern regions, except for London.
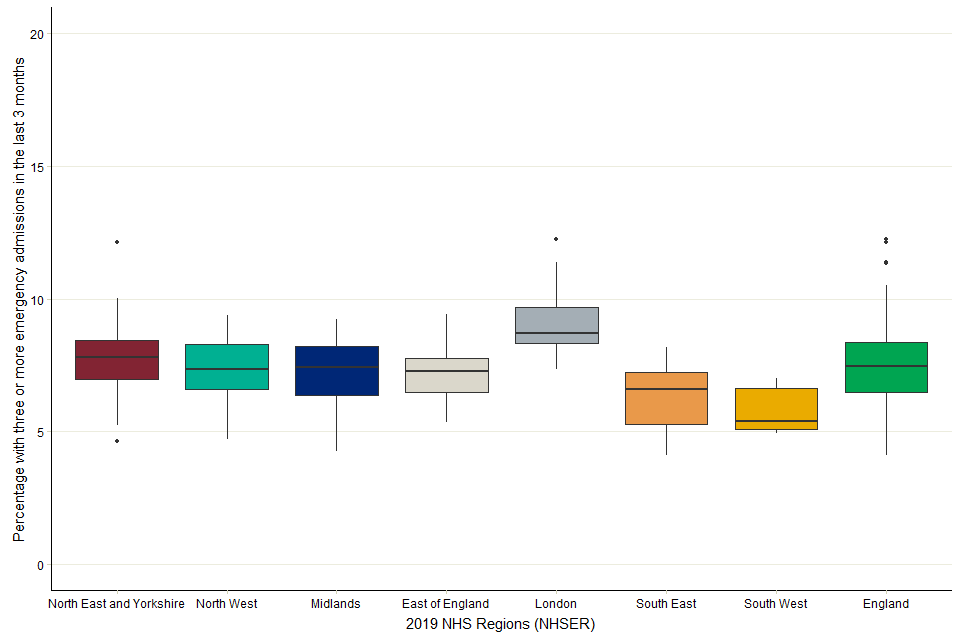
Figure 3: Variation in the percentage of deaths with 3 or more emergency admissions in the last 3 months of life across 2019 CCGs and NHS England Regions; aggregated data of 5 years (2014 to 2018).
6. Ethnicity, rurality and socio-economic deprivation
Ethnicity, rurality and socio-economic deprivation have all been shown to affect health outcomes and patterns of end of life care. The percentage of people with 3 or more emergency admissions in the last 3 months of life varied for each of these characteristics (Table 1).
The percentage of people with 3 or more emergency admissions in the last 3 months of life:
- was higher in urban areas (7.5%) than rural ones (6.2%)
- was lower in White British (7.5%) than all other ethnic groups (10.2%)
- ranged from 6.6% in the least deprived quintile (5th) to 8.2% in the most deprived (1st)
Table 1: Summary of average number of total deaths and average number of 3 or more emergency admission deaths in the last 3 months by ethnicity, rurality; aggregated data (2014 to 2018).
| Category | Group | Average number of deaths | Average number of people with 3 or more emergency admissions in the last 3 months of life | % people with 3 or more emergency admissions in the last 3 months of life |
|---|---|---|---|---|
| Ethnicity | White British | 394,324 | 29,749 | 7.5 |
| All other ethnic groups | 49,005 | 5,005 | 10.2 | |
| Rurality | Rural | 95,826 | 5,903 | 6.2 |
| Urban | 394,304 | 29,409 | 7.5 | |
| Deprivation | 1st quintile (most deprived) | 99,666 | 8,182 | 8.2 |
| 2nd quintile | 98,137 | 7,503 | 7.6 | |
| 3rd quintile | 102,794 | 7,123 | 6.9 | |
| 4th quintile | 99,510 | 6,589 | 6.6 | |
| 5th quintile (least deprived) | 90,024 | 5,915 | 6.6 |
7. Underlying cause of death
Cancer was the most common underlying cause of death, accounting for 27.8% of all deaths in the 5-year period. The percentage of people with 3 or more emergency admissions in the last 3 months of life was:
- highest for those who died of liver disease (11.6%)
- lowest for those who died of dementia (3.5%)
- highest for those who died of liver disease, COPD and cancer (all over 10.6%)
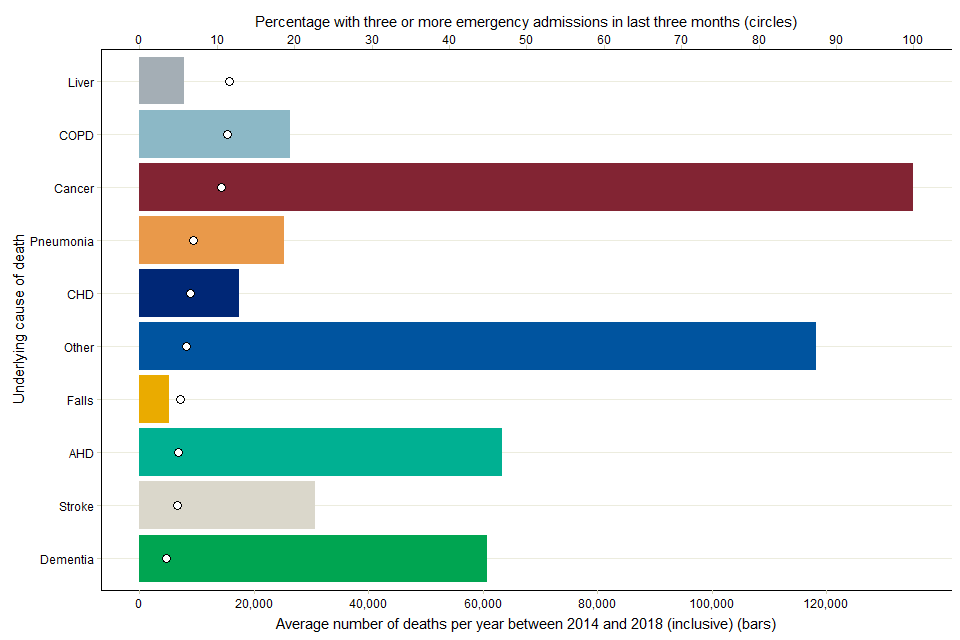
Figure 4: The average number of all deaths (bars) and the proportion (circles) preceded by 3 or more emergency admissions in the last 3 months of life, by cause of death group (underlying); aggregated data of 5 years (2014 to 2018).
8. Emergency days spent in hospital
People with 3 or more emergency admissions in the last 3 months of life:
- had a greater median total hospital stay (22 days) than those with 1 or 2 emergency admissions in the last 3 months (11 days)
- three-quarters spent at least 13 days of their last 3 months in hospital, those with 1 or 2 emergency admissions in the last 3 months, where three-quarters of those spent only 3 or more days in hospital
- half spent at least 22 days in hospital in their last 3 months of life
There were 1,484,358 people with no emergency admissions in the last 3 months of life. Figure 5 below displays the distribution of the number of days spent in hospital for these 2 groups.
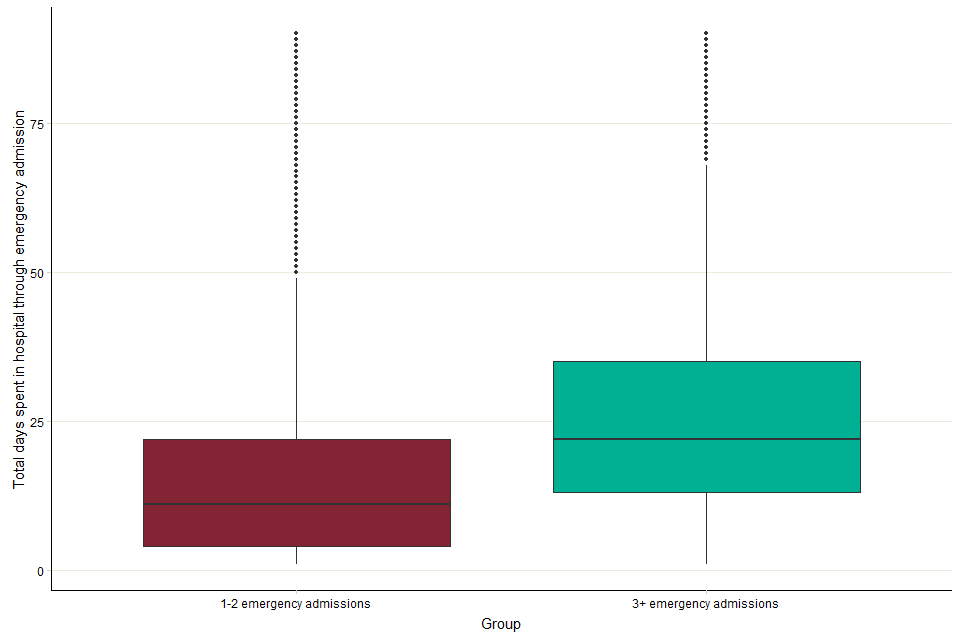
Figure 5: Within the last 3 months of life, the frequency distribution of the total days spent in hospital through emergency admission in those with at least one emergency admission; aggregated data of 5 years (2014 to 2018).
9. Methods
The data was produced by Public Health England from:
- Hospital Episode Statistics (HES), NHS Digital. Copyright © 2020. Re-used with the permission of NHS Digital. All rights reserved
- Linked HES-ONS Mortality extract, Office for National Statistics (ONS) © Crown copyright 2020, NHS Digital © Copyright 2020. Re-used with the permission of NHS Digital. All rights reserved
- Office for National Statistics: Public Health England Annual Births and Mortality Extracts
The methodology behind the indicator is described in detail in the Palliative and end of life care profiles. For the fields within HES data the emergency admissions contributing to this report meet the following conditions:
- classpat equal to 1, 2 or 5
- epista equal to 3
- admimeth starts with a 2
- age at death equal to 29 days or older
- the difference between the date of death and the date of admission less than or equal to 90 days
- the analysis excluded any deaths for which the linked mortality data quality marker suggesting the matched HES data includes activity after the date of death
Denominator total numbers of deaths exclude those of neonates (28 days or younger). The reporting year for each death is the year in which that death was registered. The analysis includes the deaths of people resident in England registered 2014 to 2018. The 5-year span included a greater number of deaths to be considered than would be available from a single year – making possible a clear analysis of smaller sub-groups.
International Classification of Diseases (ICD) is the foundation for the identification of health trends and statistics globally, and the international standard for reporting diseases and health conditions.
These are the specific ICD-10 categories used to classify the following cause of death for this analysis:
- cancer: C00-C97 (excluding C44)
- dementia: F00-F04, G30-G31
- acute heart disease (AHD): I20-I25, I39, I40-I41, I46-I49, I51
- chronic obstructive pulmonary disease (COPD): J40-J44
- pneumonia: J12-J18
- stroke: I60-I69
- chronic heart disease (CHD): I05-I11, I13, I31, I34-I36, I38, I42, I50, I70, I95
- liver disease: B15-19, K70-77
- falls: W00-19
Geographic classification of people was applied using the place of residence as recorded in mortality data. The dataset includes the local super output area (LSOA11) associated with the postcode of residence, and this was used to infer the CCG of residence and categories of rurality and socio-economic deprivation. The ONS 2011 rural or urban classification methodology was used to classify rurality, and the English indices of deprivation 2015 was used to categorise socio-economic deprivation.
The ethnic classification of people was derived from HES, using data from the most recent episode where ethnicity was recorded. For this part of the analysis only, the ONS mortality data, based on death registrations, was not used to calculate denominators. The ethnicity of the whole death population was derived using HES data, because ethnicity is not available from death registration (ONS) data. Consequently, the denominators used in the analysis by ethnicity are an underestimation as there is a small proportion of people who died having had no recorded hospital admissions. Ethnicities were analysed using the following conditions:
- missing, unknown or not stated ethnicities removed (181,710 in 2,398,365; 7.6%)
- White British classified where ethnos is equal to A
- all other ethnic groups classified where ethnos does not equal A
Days spent in hospital were derived by calculating the duration of all spells in hospital. The length of each spell is the difference between the date of discharge and the date of admission. Any spells that started and finished on the same day contribute zero days.
10. Other resources
Local data describing the percentage of deaths with 3 or more emergency admissions in the last 3 months of life is available on Public Health England’s Palliative and end of life care profiles. Three indicators in the hospital care domain describe the measure for people of all ages, 75 and older and under 75 by CCGs, STPs and NHS regions.
PHE’s National End of Life Care Intelligence Network has published previous reports in this Palliative and end of life care report series:
- Older people’s hospital admissions in the last year of life
- Older people who died in hospital: England 2017
- Palliative and end of life care: hospital deaths 2006 to 2017
- Death in people aged 75 years and older in England in 2017
PHE’s Atlas of variation for palliative and end of life care allows users to explore local variations in death and end of life care, and is available either as a report, via the Atlas of Variation page on PHE Fingertips (available under the “Themed Atlases” subsection, published in 2018), or as an interactive Instant Atlas on NHS RightCare.
Authors: Ashley Makwana, Andy Pring, Nicola Bowtell, Julia Verne
For more information, please contact: neolcin@phe.gov.uk