DWP benefits statistical summary, February 2020
Published 18 February 2020

© Crown copyright 2020
This publication is licensed under the terms of the Open Government Licence v3.0 except where otherwise stated. To view this licence, visit nationalarchives.gov.uk/doc/open-government-licence/version/3 or write to the Information Policy Team, The National Archives, Kew, London TW9 4DU, or email: psi@nationalarchives.gov.uk.
Where we have identified any third party copyright information you will need to obtain permission from the copyright holders concerned.
This publication is available at https://www.gov.uk/government/statistics/dwp-benefits-statistics-february-2020/dwp-benefits-statistical-summary-february-2020
The latest release of these statistics can be found in the benefit statistics collection.
This is a summary of the latest National Statistics about the benefits administered by the Department for Work and Pensions (DWP).
1. Headlines
What you need to know about the DWP benefits in this report:
- there were 20 million people claiming DWP benefits at August 2019
- two thirds of benefit claimants are of State Pension Age (13 million)
- the number of people receiving State Pension has fallen to 12.6 million
The rollout of Universal Credit means that the number of people claiming some older-style Working Age benefits is falling:
- Housing Benefit fell to 3.3 million claimants in November 2019
- Employment and Support Allowance fell to 2 million claimants at August 2019
- Jobseeker’s Allowance fell to 183,000 claimants at August 2019
- Income Support fell to 372,000 claimants at August 2019
The latest Universal Credit Official Statistics show:
- there were 2.7 million Universal Credit claimants at December 2019
Figure 1: DWP benefits by number of claimants at August 2019
| Benefit | Number of claimants |
|---|---|
| State Pension | 12,565,000 |
| Housing Benefit | 3,452,000 |
| Personal Independence Payment | 2,242,000 |
| Universal Credit | 2,350,000 |
| Employment and Support Allowance | 1,976,000 |
| Attendance Allowance | 1,590,000 |
| Disability Living Allowance | 1,598,000 |
| Pension Credit | 1,574,000 |
| Carer’s Allowance | 1,300,000 |
| Income Support | 372,000 |
| Jobseeker’s Allowance | 183,000 |
Source: DWP benefits statistics.
Figures for Universal Credit, Personal Independence Payments and Housing Benefit covering later time periods are available on Stat-Xplore.
2. Pensions
State Pension
Figure 2: People receiving State Pension by scheme to August 2019
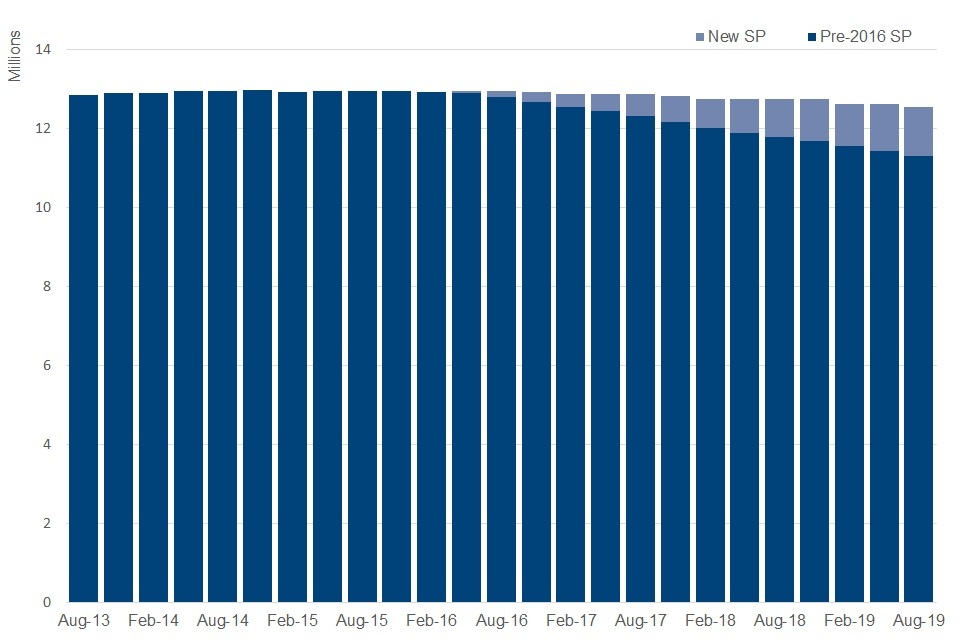
This stacked bar chart shows the number of State Pension beneficiaries by scheme: Pre2016 scheme and new State Pension, which was introduced in April 2016
Source: DWP benefits statistics.
There were 12.6 million people receiving State Pension at August 2019; a decrease of 200,000 on a year earlier. Since December 2018, the State Pension Age (SPA) has been raised for both men and women. This has resulted in fewer new claims over the period while the SPA is increasing from 65 to 66.
New State Pension
Figure 3: A comparison of average weekly amounts of State Pension by scheme and gender at August 2019
| State Pension scheme | Male | Female |
|---|---|---|
| New State Pension | £160.18 | £152.55 |
| Pre-2016 State Pension | £163.78 | £135.56 |
Source: DWP benefits statistics.
At August 2019 the average weekly payment for people receiving State Pension was £148.62; an increase of £4.80 since August 2018.
The new State Pension (nSP) scheme was introduced for people reaching State Pension Age from 6 April 2016. At August 2019 there were 1.2 million people receiving nSP. The nSP average weekly payment was £158.28 (including any Protected Payments).
The introduction of nSP has evened out some of the gap between the average weekly payments for men and women, as women tend to get more under the new scheme than under the Pre-2016 scheme. However, due to earlier timetabled increases in women’s State Pension Age fewer women have joined the new scheme than men.
Pension Credit
Figure 4: A comparison of Pension Credit recipients by payment type and gender at August 2019
| Type of Pension Credit | Male | Female |
|---|---|---|
| Guarantee Credit only | 270,000 | 507,000 |
| Savings Credit only | 108,000 | 151,000 |
| Both Guarantee and Savings Credit | 186,000 | 352,000 |
Source: DWP benefits statistics.
At August 2019, there were 1.6 million people receiving Pension Credit (PC); representing a total of 1.9 million beneficiaries including partners. There were 94,000 fewer recipients against the previous year. Nearly two thirds of people getting PC (64%) were women. Among other factors, the downward trend in overall PC caseload is due to the raising of the SPA and the introduction of nSP in April 2016.
3. Housing
Housing Benefit
Figure 5: Housing Benefit claimants by sector at November 2019
| Sector | Number of claimants |
|---|---|
| Private Rented Sector | 852,000 |
| Social Rented Sector | 2,452,000 |
Source: DWP benefits statistics.
The number of people claiming Housing Benefit (HB) has been gradually decreasing and will continue to fall as Universal Credit (UC) replaces HB for Working Age claimants. At November 2019, there were 3.3 million recipients of HB and 1.5 million households with a housing element in their UC assessment.
74% of HB recipients (2.5 million) were tenants in the Social Rented Sector and 26% were in the Private Rented Sector (850,000).
As at November 2019, 14% (290,000) of Working Age HB recipients had a reduction to their weekly award amount due to the Removal of Spare Room Subsidy scheme. This is where tenants in social housing whose accommodation is deemed to be larger than they need may lose part of their HB award. The average reduction amount was £15.44.
4. Health, disability and care
Personal Independence Payment (PIP) and Disability Living Allowance (DLA)
Figure 6: The number of people claiming Personal Independence Payment or Disability Living Allowance to August 2019
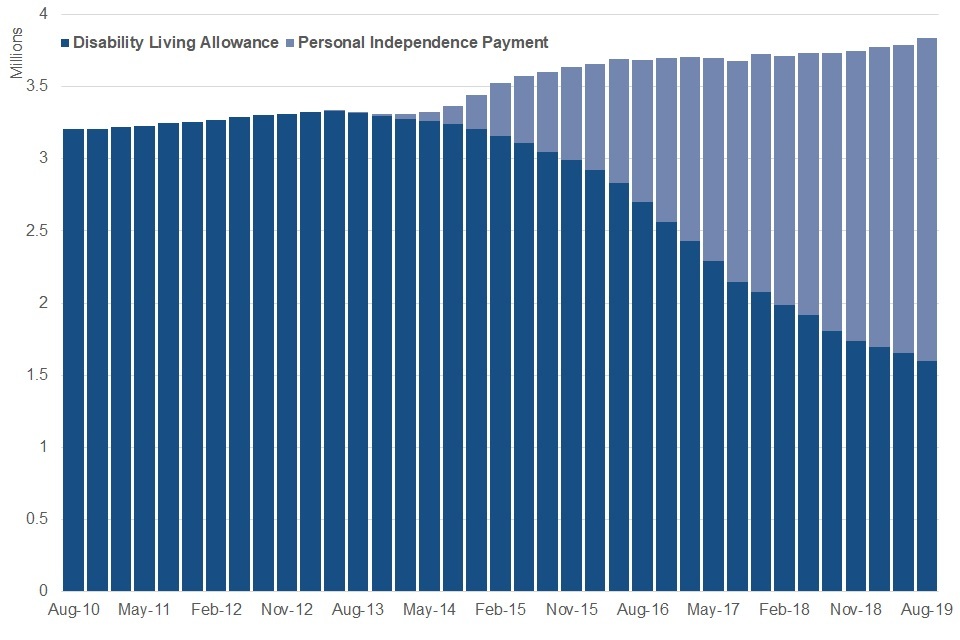
Time series made up of stacked bar charts to show how the number of people claiming Personal Independence Payment (PIP) and Disability Living Allowance (DLA) has changed since the introduction of PIP. There are now more people claiming PIP than DLA
Source: DWP benefits statistics.
There were 3.8 million people claiming either PIP or DLA at August 2019; an increase of 110,000 during the last year. There were 2.2 million people claiming PIP at August 2019, and 1.6 million people claiming DLA. The number of people claiming PIP rose by 320,000 while DLA claims fell by 210,000.
Of the 1.6 million DLA claimants, a small number (18,000) were entitled to DLA but did not receive any payment. For example, payments can be temporarily suspended if the claimant is in hospital.
Attendance Allowance
At August 2019, there were 1.6 million Attendance Allowance (AA) claimants; a decrease of 18,000 from August 2018, due to State Pension Age changes. 1.4 million claimants were receiving a payment and 160,000 (10%) were entitled to the benefit but not receiving payment. As with DLA above, AA payments can be temporarily suspended for instance, if the claimant is in hospital.
Employment and Support Allowance and Incapacity Benefits
Figure 7: A comparison of claims in payment by benefit type for incapacity related benefits
| Benefit | Number of claimants | In payment | Not in payment |
|---|---|---|---|
| Employment and Support Allowance | 1,976,400 | 1,868,000 | 108,000 |
| Incapacity Benefit | 25,460 | 60 | 25,390 |
| Severe Disablement Allowance | 19,000 | 19,000 | 0 |
Source: DWP benefits statistics.
There were 2 million people on Employment and Support Allowance (ESA), Incapacity Benefit (IB) or Severe Disablement Allowance (SDA) at August 2019; a decrease of 240,000 over the last year.
The number of ESA claims has decreased by 11% over the last year because most new claims to income-related ESA are going onto UC instead. Out of the 2 million ESA claimants:
- 1.6 million are in the Support group
- 290,000 are in the Work-Related Activity group
- 54,000 are in the Assessment phase
- 830,000 ESA claimants are former IB cases who have been migrated
The process of migrating IB claimants onto ESA has almost concluded, and as such there are very few IB claims still in payment. The majority of the remaining count are now National Insurance Credits Only type cases who do not receive a payment. Going forward, future summaries will now focus on ESA; we will continue to publish IB and SDA statistics on Stat-Xplore.
Carer’s Allowance
The total number of people claiming Carer’s Allowance (CA) at August 2019 was 1.3 million; a rise of 8,300 over the last year. Increases in State Pension Age and in the number of people claiming disability benefits may have contributed to this rise. Of the total number claiming Carer’s Allowance, 32% (420,000) were entitled to the benefit but do not receive payments.
Recipients of Carer’s Allowance in Scotland are eligible for Carer’s Allowance Supplement (CAS), which is payable once every six months.
CAS statistics are released by the Scottish Government.
5. Work and unemployment
Figure 8: The number of people claiming Income Support and Jobseeker’s Allowance to August 2019
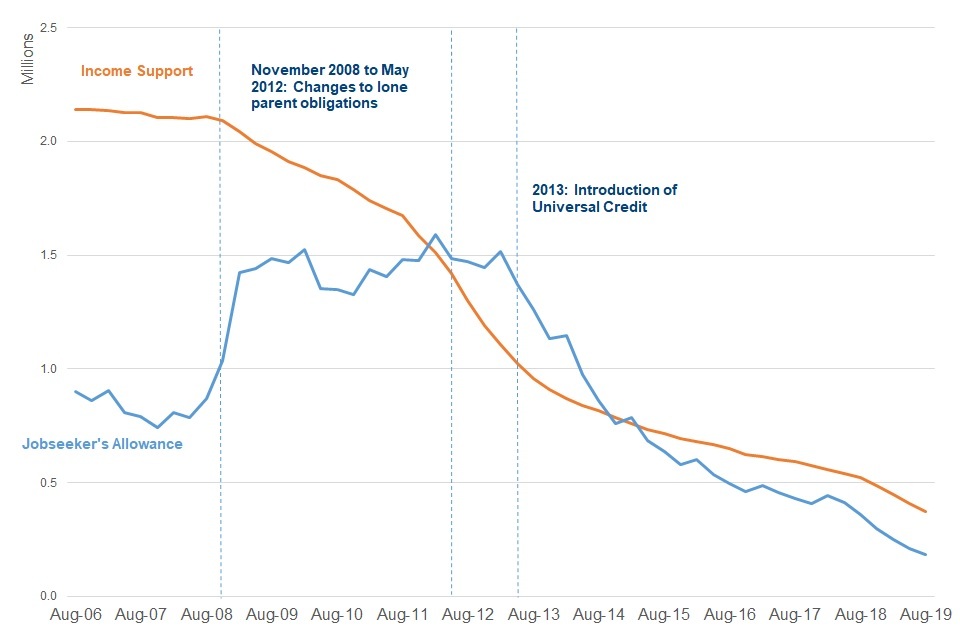
Line graph showing the declining numbers of people claiming either IS orJSA. The number of IS claimants has been impacted by both the changes to Lone Parent obligations since 2008, and the introduction of Universal Credit in 2013
Source: DWP benefits statistics.
Income Support
At August 2019, the total number of people claiming Income Support (IS) was 370,000; a decrease of 150,000 over the last year. Lone parents represent 61% of the number of people claiming IS, and carers represent 37%. The number of people claiming IS due to incapacity has now fallen to just 260. Universal Credit is replacing IS. New claims to IS can now only be made if people currently receive the severe disability premium, or where the premium was received within the last month and eligibility still exists.
Jobseeker’s Allowance
There were 180,000 people claiming Jobseeker’s Allowance (JSA) in August 2019; a decrease of 177,000 (49%) over the last year. The number of people claiming Jobseeker’s Allowance is falling as Universal Credit replaces it. Read the Alternative Claimant Count statistics to get a better view of the number of people claiming unemployment benefits.
6. Working Age Benefit Combinations
People can claim more than one DWP benefit at a time. This section looks at how benefits are claimed in combination for Working Age claimants.
Figure 9: Benefit combinations at August 2019
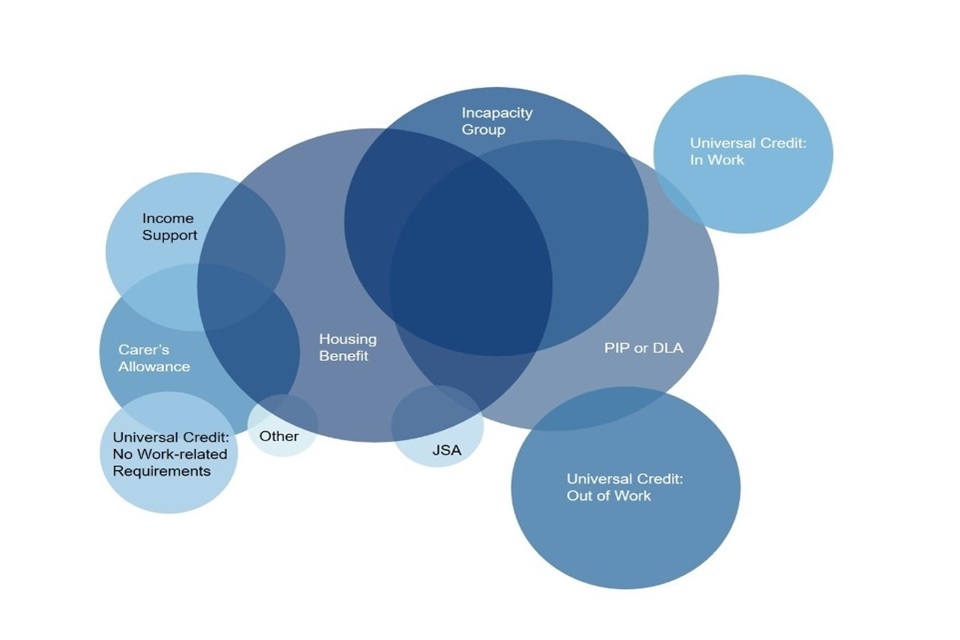
Diagram uses circles with different areas to show the relative size of DWP working age benefits by number of claimants. Circles intersect to show how some benefits are claimed in combination
Source: DWP benefits statistics.
This diagram uses overlapping circles, where larger circles and overlaps show more people claiming a particular combination of benefits.
Experimental statistics for August 2019 there were 7 million Working Age claimants, of which:
- 2.7 million received HB
- 2.3 million claimed PIP or DLA
- 2 million claimed an Incapacity Benefit, such as ESA
- 930,000 people claimed a multiple combination of HB and Incapacity Benefits, along with PIP or DLA
Since the introduction of Universal Credit in 2013 this picture has been gradually changing, with more people claiming UC and fewer people claiming combinations of the other benefits. In August 2019, 33% of the individuals included in the benefit combination statistics claimed UC, up from 9% in August 2018.
Please read the Universal Credit Official Statistics. The key headline figures show:
- 2.7 million people were on Universal Credit, as of 12th December 2019
- 980,000 (36%) UC claimants are in employment
- 1 million (37%) are in the ‘Searching for Work’ conditionality regime
- 670,000 (25%) are in the ‘No Work Requirements’ conditionality regime
7. About these statistics
This is a summary of the latest National Statistics about the benefits administered by the Department for Work and Pensions (DWP). Data are released on a quarterly basis in:
- February
- May
- August
- November
This summary is released every February and August.
This publication was assessed by The UK Statistics Authority in December 2010 and designated as a National Statistic in October 2011, in accordance with the Statistics and Registration Service Act 2007 and signifying compliance with the Code of Practice for Statistics.
All of DWP’s statistics are National Statistics except:
- Personal Independence Payments (Official Statistics)
- Universal Credit (experimental statistics)
- Benefit Combinations (experimental statistics)
- Bereavement Support Payment (experimental statistics)
- Housing Benefit Flows (experimental statistics)
- Alternative Claimant Count (experimental statistics)
The statistics in this publication are affected by the introduction of Universal Credit. Universal Credit was introduced in April 2013 in certain pathfinder areas of North West England. Between October 2013 and December 2018, Universal Credit was progressively rolled out and is now available in every jobcentre across the country.
Universal Credit is replacing:
- Income-related Employment and Support Allowance
- Income–based Jobseeker’s Allowance
- Housing Benefit for Working Age claimants
- Income Support
- Working Tax Credit
- Child Tax Credit
Please see Universal Credit statistics for information on the number of people and households on Universal Credit.
Information on the following benefits is published separately:
- Benefit Sanctions statistics
- Industrial Injuries Disablement Benefit statistics
- Child Support Agency cases statistics
- Maternity Allowance statistics
Where to find out more
Find previous releases of this data.
More detailed statistical tables covering all National Statistics benefits can be found using Stat-Xplore. This is an online tool that lets you create and download customised statistical tables, and view the results in interactive charts.
Data tables are provided where data is not available on Stat-Xplore.
Read our policies and statements for background information on DWP National and Official benefit statistics, including some of the processes involved in developing and releasing these statistics.
Known issues, changes and revisions
During the quality assurance of Bereavement Support Payment (BSP) experimental official statistics, we identified an issue with claims in payment figures. Some tables have been removed from this and previous releases. Further information can be found on the DWP benefits statistics collection page and in the “Welfare and Benefits” community on StatsUserNet. Email stats-consultation@dwp.gov.uk if you have any comments or questions.
You can find information about Widow’s Benefit and Bereavement Benefits on Stat-Xplore.
Due to the 2019 Local Government Reorganisation, 5 new Unitary Authorities were created at April 2019, replacing 15 Local Authority Districts. Datasets on Stat-Xplore showing Housing Benefit Administration by Local Authority have now been updated to reflect this change from April 2019. Residency-based geography breakdowns will be updated to reflect the above changes as part of a routine refresh in Spring 2020.
Further information about changes and revisions are in our background information note.
8. Contact information and feedback
For more information about this release, contact: alan.gibson@dwp.gov.uk.
DWP would like to hear your views on our statistical publications. If you use any of our statistics publications, we would be interested in hearing what you use them for and how well they meet your requirements. Email stats-consultation@dwp.gov.uk with your feedback.
You can also join the Welfare and Benefit Statistics community on StatsUserNet. DWP announces items of interest to users in this forum, as well as replying to users’ questions.
Lead statistician: Alan Gibson.
ISBN: 978-1-78659-173-9