DSIT Main Estimate memorandum 2026 to 2027
Published 27 May 2026

© Crown copyright 2026
This publication is licensed under the terms of the Open Government Licence v3.0 except where otherwise stated. To view this licence, visit nationalarchives.gov.uk/doc/open-government-licence/version/3 or write to the Information Policy Team, The National Archives, Kew, London TW9 4DU, or email: psi@nationalarchives.gov.uk.
Where we have identified any third party copyright information you will need to obtain permission from the copyright holders concerned.
This publication is available at https://www.gov.uk/government/publications/dsit-main-estimate-memorandum-2026-to-2027/dsit-main-estimate-memorandum-2026-to-2027
This memorandum gives further explanation to the Department for Science, Innovation and Technology (DSIT) Main Estimate 2026 to 2027. The format of this document follows guidance from the Parliamentary Scrutiny Unit, to provide wider context on the department’s objectives and finances.
1. Overview
1.1 Objectives
The Department for Science, Innovation and Technology (DSIT) has the following priority outcomes:
-
Growth and Prosperity – Harnessing and accelerating science and technology to drive economic growth, raise living standards, and make life more affordable across the UK.
-
Modernising Public Services – Using technology to make public services more accessible, efficient, and responsive to people’s needs.
-
Tech Adoption and Skills – Ensuring everyone — across all regions and backgrounds — can access the skills, tools, and opportunities to thrive in a digital economy.
-
Technology You Can Trust – Making sure technology is safe, trusted, and delivers positive outcomes for society, with a particular focus on protecting children online.
The detail of how spending programmes relate to these priorities is provided in Section 3.1.
1.2 Spending controls
DSIT’s spending is broken down into several spending totals, for which Parliament’s approval is sought.
The spending totals which Parliament votes are:
-
Resource Departmental Expenditure Limit (“Resource DEL”) – expenditure within the current financial year, including day to day running costs such as staff and corporate costs.
-
Capital Departmental Expenditure Limit (“Capital DEL”) – expenditure on creating or acquiring assets, where value will extend beyond the current financial year; for DSIT, this includes investment in digital infrastructure, and Research and Development (R&D) spending.
-
Resource Annually Managed Expenditure (“Resource AME”) – less predictable day to day spending; for DSIT, this relates mainly to movements in the value of provisions and the expenditure of the National Endowment for Science, Technology and the Arts (NESTA) Trust.
-
Capital Annually Managed Expenditure (“Capital AME”) – less predictable investment spending; for DSIT, this relates primarily to pension valuations.
In addition, Parliament votes on the net cash requirement, designed to cover the elements of the above budgets, which require DSIT to pay out cash in year.
1.3 Main areas of spending
The chart below shows the main components of DSIT’s RDEL and CDEL budgets for the year, included in the latest Main Estimate, and the proportions of funds spent on its main activities. Figures in the charts below may not sum back to the totals due to rounding. The breakdown is based on allocations agreed during 2026-27 Business Planning. These allocations may change during the year as DSIT takes an active portfolio management approach, and Ministers decide on opportunities for redeploying any emerging underspends or headroom.
Resource DEL: total budget £917.806 million 2026 to 2027
| Description | £ million |
|---|---|
| Core admin costs | 368.8 |
| Government Digital Function | 361.9 |
| Digital, Broadcasting and Media | 147.1 |
| Building Digital UK | 33.2 |
| Other costs including partners organisations | 6.8 |
| Total | £917.8 million |
Capital DEL by spending areas in 2026-27 (£m)
Total budget £15,209.226 million 2026 to 2027[footnote 1]
| Description | £ million |
|---|---|
| UK Research and Innovation (UKRI) | 9,252.2 |
| UK contribution to EU Programmes | 2,121.0 |
| Other costs | 1,207.0 |
| UK Space Agency | 679.0 |
| Building Digital UK | 648.3 |
| Met Office | 344.9 |
| Advanced Research and Invention Agency (ARIA) | 220.0 |
| Science and Society | 219.0 |
| Government Digital Function | 202.5 |
| Geospatial Commission | 175.2 |
| National Measurement System (NMS) | 136.6 |
| Other partner organisations | 3.0 |
| Information Commissioner’s Office (ICO) | 0.5 |
| Total | £15,209.2 million |
Notes:
‘Other costs’ includes Office for Quantum, Digital Economy Unit and Office for Life Sciences.
1.4 Comparison of spending totals sought
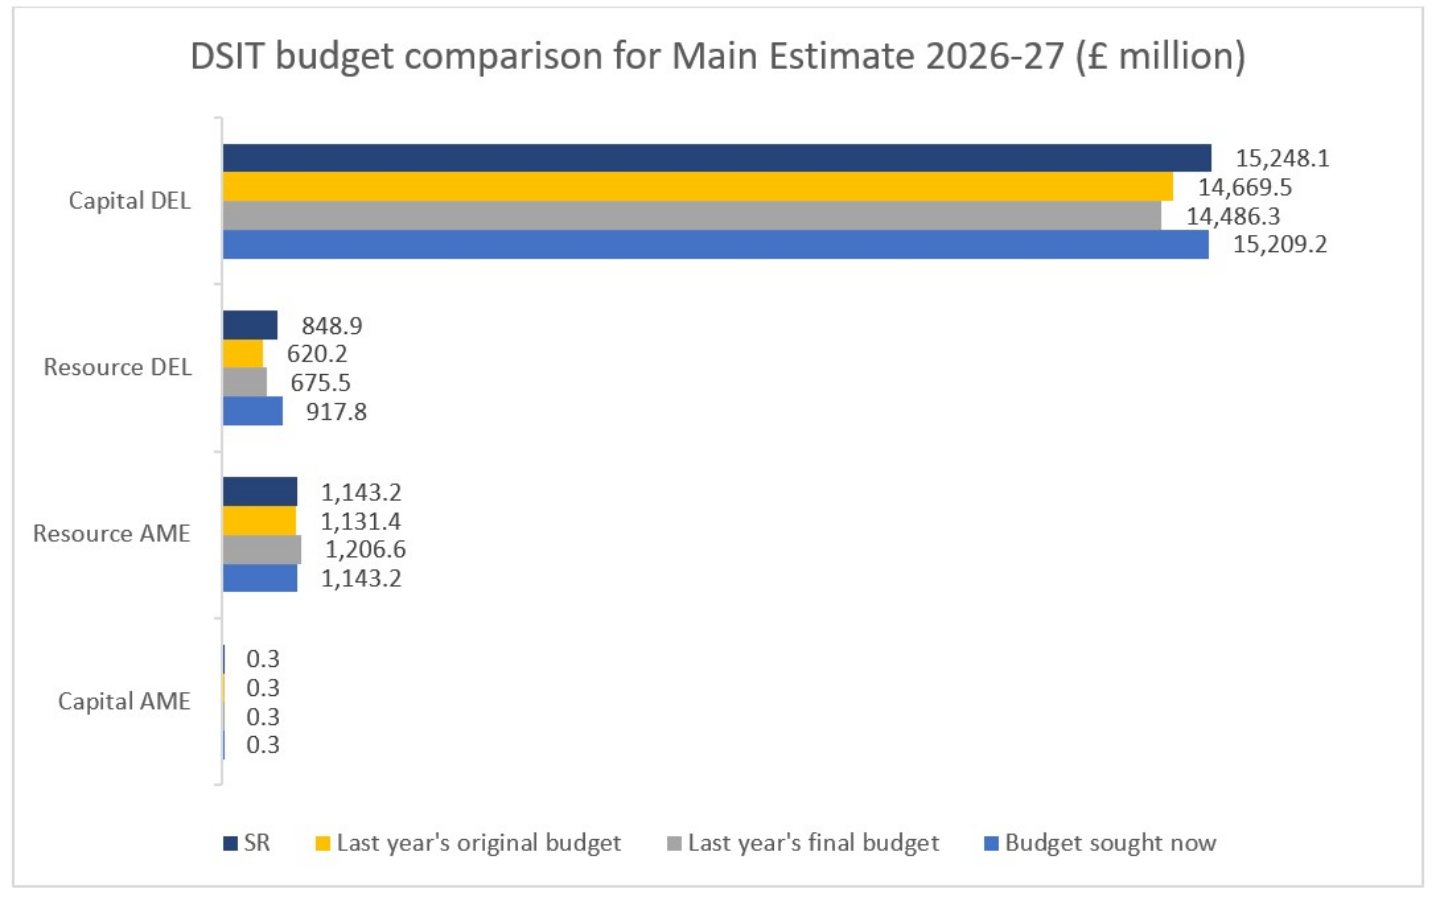
The table and chart below show how the totals sought for DSIT in its Main Estimate compare with the Spending Review, the Supplementary Estimate for last year, and the Main Estimate for last year . Resource and Capital DEL are shown on a net basis.
Table 1: Spending total amounts sought for DSIT this year compared with the Spending Review.
| Main Estimate 2026 to 2027 | Difference (+/-) compared to Spending Review (SR25) (£m) | Difference (+/-) compared to Spending Review (SR25) (%) | ||
|---|---|---|---|---|
| Resource DEL | 917.8 | +68.9 | +8.1% | |
| Capital DEL | 15,209.2 | -38.9 | -0.3% | |
| Resource AME | 1,143.2 | 0.00 | 0.0% | |
| Capital AME | 0.3 | 0.0 | 0.0% |
Table 2: Spending total amounts sought for DSIT this year compared with the final budget last year.
| Main Estimate 2026 to 2027 | Difference (+/-) compared to Supplementary Estimate 2025 to 2026 (£m) [footnote 2] | Difference (+/-) compared to Supplementary Estimate 2025 to 2026 (%) | ||
|---|---|---|---|---|
| Resource DEL | 917.8 | +242.3 | +35.9% | |
| Capital DEL | 15,209.2 | +722.9 | +5.0% | |
| Resource AME | 1,143.2 | -63.4 | -5.3% | |
| Capital AME | 0.3 | 0.0 | 0.0% |
Table 3: Spending total amounts sought for DSIT this year compared with the original budget last year.
| Main Estimate 2026 to 2027 | Difference (+/-) compared to Main Estimate 2025 to 2026 (£m) | Difference (+/-) compared to Main Estimate 2025 to 2026(%) | ||
|---|---|---|---|---|
| Resource DEL | 917.8 | +297.6 | +48.0% | |
| Capital DEL | 15,209.2 | +539.7 | +3.7% | |
| Resource AME | 1,143.2 | +522.9 | +84.3% | |
| Capital AME | 0.3 | 0.0 | 0.0% |
Figure 1: DSIT budgets, £ million
1.5 Key drivers of spending changes since last year
Resource DEL
There is a net increase in RDEL of £242.3 million in the amount sought in the Main Estimate for 2026-2027, compared to the budget agreed as part of the Supplementary Estimate 2025-2026. The main changes relate to:
- £165.9 million increase in Programme budgets, mainly resulting from HMT providing an increase in Government Digital Service budgets of £117.2 million at the Spending Review. This funding is to prioritise scaling core digital infrastructure and delivering the Digital Blueprint for Government – with RDEL increasing as mature services move from development into live operation.
- £76.7 million increase in Admin budgets reflecting an increase in SR settlement to account for the latest department size following the recent MoGs, Arm’s Length Body (ALB) reform (£18.9 million increase in Admin budgets) and the Matrix shared service reform programme (a £25 million increase compared with 2025-26 budgets).
Capital DEL
There is a £722.9 million increase in CDEL budgets in 2026-2027 compared to the Supplementary Estimates 2025-2026, relating to an increase in Spending Review settlement in addition to agreed Budget Exchanges from 2025-26. The main increases relate to:
-
£241.7 million increase in Office for Life Sciences budgets reflecting an ambition to deliver on existing commitments, including those set out in the Life Sciences Sector Plan.
-
£223.5 million increase in Office for Quantum budgets due to increased investment in quantum technology as part of the DSIT-led Quantum Missions Accelerator Programme.
-
£161.0 million increase in BDUK budgets due to an increase in programme activity during 2026-27, of which £34.3 million relates to ‘budget exchange’ and reprofile from prior year.
-
£150.3 million increase in Digital Economy Unit mainly due to increased spend in the AI Research Resource expansion programme and Sovereign AI, including equity investments for AI start-up companies.
-
£148.0 million decrease in Space budgets following the completion of HMG’s further investment in Eutelsat, crystalising in 2025-26.
-
£134.8 million increase in Government Digital Service budgets including One Login, driven by further enhancement of GOV.UK, an increase in Public Sector AI initiatives including Gov Voice, and an increase in Geospatial programmes funding during 2026-27.
-
£92.7 million increase in EU Programmes due to expected higher association costs during 2026-27.
-
£36.3 million increase in ARIA budgets reflecting ARIA’s organisational plans as it grows substantially, over the SR period, continuing to fund breakthrough R&D, catalysing new paths to prosperity for the UK.
-
£19.2 million decrease in Met Office budgets reflecting planned supercomputer spend, ahead of milestone adjustments, as well as the recognition of higher expected loan repayments, which offset the expenditure.
There is a £63.4 million decrease in Capital and Resource AME budget sought compared to the budget agreed as part of the Supplementary Estimate 2025-26. This is mainly a result of a decrease in expected depreciation costs in 2026-27.
1.6 Key drivers of spending changes since the Spending Review
The budgets presented in this Main Estimate represent current Spending Review settlement, with no further spending changes to disclose. This section will be used in future Estimates rounds to highlight any such changes.
1.7 Reserve claims and spending pressures
No additional funding has been provided by HM Treasury since the SR25 Settlement.
1.8 Funding and other spending announcements
Confirmation of DSIT’s Spending Review Phase 2 settlement, covering 2026-27 onwards, was made through Spending Review 2025, published in June 2025, which set departmental resource budgets to 2028-29 and capital budgets to 2029-30. Phase 2 confirmed DSIT’s multi-year settlement and funding priorities for science, innovation and digital transformation.
As part of the settlement DSIT will:
-
Spend up to £14.1 billion on Research and Development in 2026-27, contributing to £86 billion of public R&D funding across the Spending Review period, providing long term certainty and stability for the UK research base.
-
Fund £38.6 billion R&D for UKRI over the next 4 years (£9.2 billion in 2026-27)
- Of this, £14 billion will go to curiosity-driven research, where the UK is already leading.
- To strengthen how we apply and commercialise our research, £8 billion will fund work aimed at governmental and societal priorities, and £7 billion will support innovative companies to start-up, scale and succeed in the UK. Within these categories, £9 billion will go towards the Industrial Strategy sectors.
-
Entrepreneurship – the ‘Entrepreneurship Prospectus’ was published alongside the Budget to help growing companies.
- We are investing £4 million a year in new ‘Enterprise Fellowships’, funding up to 100 researchers to spin-out or take up secondments in UK firms.
- The British Business Bank announced measures, including Series B funding for scaling firms and plans to unlock pension fund capital for UK asset.
-
Fund a package of investments in Artificial Intelligence skills, compute capacity, and dedicated AI growth zones, across the UK.
- The appointment of a panel of AI Ambassadors, including Nobel laureate Simon Johnson, Monzo co-founder Tom Blomfield, and AI researcher Raia Hadsell from Google DeepMind.
- A £10 million investment for the semiconductor industry in South Wales to maximise the growth opportunities from the AI Growth Zone including creating high-skilled jobs in local communities. It builds on the Industrial Strategy and the Digital and Technologies Sector Plan, ensuring the UK remains at the forefront of innovation in frontier technologies.
-
Support place‑based innovation and regional growth, including continued investment in high‑potential innovation clusters across the UK.
-
Investing up to £520 million in a new Life Sciences Innovative Manufacturing Fund – The UK is building new research infrastructure, scaling manufacturing, improving regulation, strengthening clinical trials and securing further private investment in life sciences. Our ambition is to be Europe’s leading life sciences economy by 2030.
- We announced a new £50 million R&D fund pilot to support large-scale life sciences projects.
- The Life Sciences Innovative Manufacturing Fund has awarded its first grants, securing £30 million of investment in West Midlands companies.
- We are also providing £50 million for mental health research and £10 million for addiction research.
-
Implement the government’s commitment to 10 year R&D budgets, creating a stable environment for long term partnerships between government, industry and the research sector.
-
Invest in digital transformation across government, supporting delivery of digital public infrastructure, replacement of legacy systems and deployment of productivity‑enhancing AI tools across the public sector and continuing the delivery of the National Data Library, providing secure, ethical access to public data assets to support research, innovation and improved public services.
-
Progress implementation of the AI Opportunities Action Plan, including sustained support for AI capability, safety and adoption to improve productivity and public service delivery.
-
Continue to fund Project Gigabit and the Shared Rural Network, driving the rollout of digital infrastructure to under-served parts of the UK.
-
Continue to support the transformation of corporate functions across government to deliver more efficient, cost-effective and modern systems as part of government’s Shared Services Strategy.
1.9 New policies and programmes - ambit changes
The ambit has been updated to include minor changes to ensure complete coverage of DSIT’s activities, and removal of outdated references.
As of 1 April 2026, UK Space Agency (UKSA), which was previously an Executive Agency of DSIT, moved to the core department.
1.10 Administration costs and efficiency plans
At Supplementary Estimate 2025-2026, the administration budget (excluding ringfenced depreciation) was set at £334.0 million. The Main Estimate 2026-2027 budgets reflect the £410.7 million administration budget agreed with HM Treasury for 2026-2027, including changes agreed as part of the Spending Review 2025 Phase 2. The £76.7 million increase mainly relates to a £25 million increase in the Matrix budget in 2026-27. As in 2025-26, DSIT expects to transfer budget to other government departments for the Matrix programme again at the Supplementary Estimate.
The £33.4 million increase compared with original budget set at SR25 relates to changes agreed as part of the SR25 settlement letter. This includes budget switches in relation to ALB reform, whereby corporate staff costs for UKSA (previously CDEL) and BDUK (previously RDEL programme) now score in admin budgets, as well as BCTs with other government departments at Main Estimate.
Table 4: administration costs - spending total amounts sought this year compared to original budget this year and final budget last year
| Main Estimate 2026 to 2027 (£m) | Difference (+/-) compared to SR25 (£m) | Difference (+/-) compared to SR25(%) | Difference (+/-) compared to Supplementary Estimate 2025 to 2026 (£m) | Difference (+/-) compared to Supplementary Estimate 2025 to 2026 (%) | ||
|---|---|---|---|---|---|---|
| Administration costs | 410.7 | +33.4 | +9.1% | +76.7 | +44.1% |
1.11 Spending trends
The DSIT DEL Spending Trends charts below show overall spending trends since the establishment of DSIT. For the last 4 years, it is based on historic data for outturns, budgets presented in the Supplementary Estimate 2025-26 and Main Estimate 2026-27. Resource DEL is the net position. For comparability, this now excludes non-cash depreciation for all years, following its reclassification from Resource DEL to Resource AME, following a Budget Regime Change, in line with HMT direction.
Figure 2: DSIT DEL spending trends: 2021 to 2022 to 2029 to 2030 (£m).

Figure 2 shows outturns for 2021 to 2022, 2022 to 2023, 2023 to 2024 and 2024 to 2025, 2025 to 2026 Supplementary Estimates budgets set, 2026 to 2027 Main Estimates budgets sought and Spending Review budgets for 2027-28, 2028-29 and 2029-30. Note that 2029-30 RDEL budgets were not set through SR25 and therefore do not appear in this diagram.
DEL budgets
Capital DEL increases mainly reflect a continuing growth in spend qualifying as R&D since the last Spending Review. R&D budgets’ material increases when compared with 2025-26, relate to EU programmes, Office for Life Sciences and ARIA (see details in table 4.1). Non-R&D CDEL budgets such as BDUK have also increased compared with 2025-26.
Resource DEL in 2026-2027 reflects an increase in budget for key programmes including Digital Technologies and Telecoms and the Government Digital Service, following the Digital MoG.
Figure 3: DSIT AME spending trends: 2021 to 2022 to 2028 to 2029 (£m).
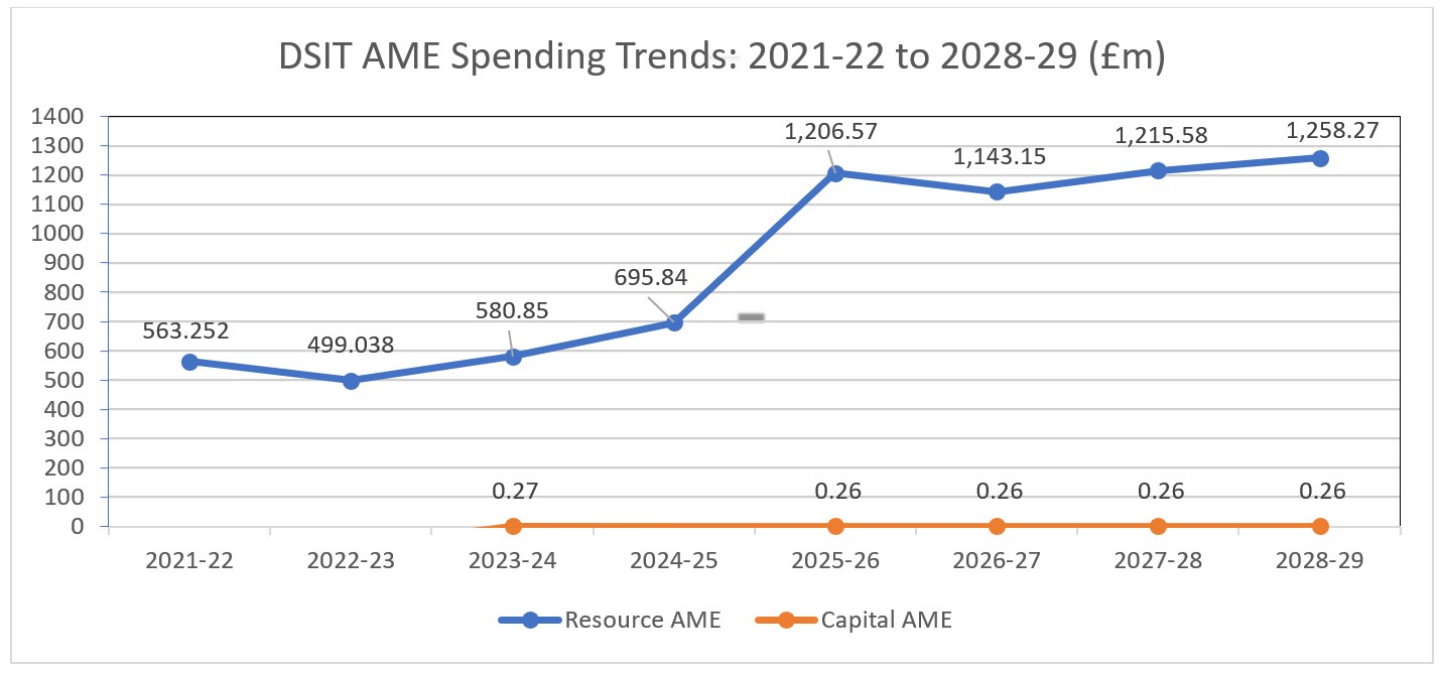
Figure 3 shows outturns for 2021 to 2022, 2022 to 2023,2023 to 2024 and 2024 to 2025, 2025 to 2026 Supplementary Estimates budgets set, 2026 to 2027 Main Estimates budgets sought and Spending Review budgets for 2027-28 and 2028-29. Note that 2029-30 AME budgets were not set through SR25. AME budgets for SR25 were based on current year projections and will be reviewed at future Estimates rounds.
AME budgets
Resource AME in DSIT is subject to significant fluctuation from year to year due to non-cash costs arising from movements in provisions and the impact of changes to discount and exchange rates. The main provision in 2026-2027 relates to a £178 million potential foreign exchange rate movement on EU Programmes hedging on forward contracts. This is lower than in 2025-2026, based on the latest assessment of foreign exchange hedging exposure.
As of 2026-2027, non-cash depreciation has been moved from Resource DEL to Resource AME, per HMT direction. Prior years’ outturn has also been restated to reflect this change.
2. Spending detail
As shown in the table in Section 3.1, departmental expenditure may contribute to different strategic objectives. However, due to Parliamentary rules, budgets must be assigned to only one specific Estimate subhead even though spending often contributes to other lines.
The subheads in the Resource DEL and Capital DEL tables are explained below:
| Subhead Letter(s) | Subhead Name | Subhead Description |
|---|---|---|
| A/ F/ I/ M | Science and Research | Includes spend on Academies, GO Science, the UK Space Agency, Horizon Europe, Research England, UK Research and Innovation (UKRI) (an ALB), the Office for Life Sciences (OLS), Met Office, and spend and income (including dividends) relating to public corporations. |
| B/ G/ J | Capability | Includes spend on enabling functions, corporate and running costs. |
| C/ H/ K/ N | Support for the Digital, Broadcasting and Media Sectors | Includes spend relating to Digital Economy Unit (which includes the Open Networks R&D Fund programme which will deliver upon the UK’s 5G Supply Chain Diversification Strategy, building secure and resilient communications infrastructure as well as enhancing competition and innovation within the telecoms supply chain), Broadband, AI, Ofcom (an ALB) and Information Commissioners Office (ICO) (an ALB). |
| D/ L | Modernising and reforming the work of the Government Functions | Includes spend in relation to the Digital areas which were transferred via MoG from Cabinet Office in July 2024, plus the activities of the Geospatial Commission and the Cyber MoG from Cabinet Office in June 2025. |
| E | Building Digital UK | Relates to the spend and income of DSIT’s former Executive Agency BDUK (which moved to DSIT core department as of 1 November 2025), which includes Project Gigabit, Shared Rural Network (SRN) and Superfast Broadband. |
2.1 Explanations of changes in spending
Resource DEL
The table below shows how DSIT’s spending plans for Resource DEL (net) compare with the previous year’s Supplementary Estimate .
Table 5: Resource DEL spending plans this year compared to last year
| Subhead | Description | 2026 to 2027 Main Estimates budget sought (£m) | 2025 to 2026 Supplementary Estimates budget approved (£m) | Change from last year (£ m) | Changes from last year (%) | Differences of more than 10% which are more than £10 million (see note number) | |
|---|---|---|---|---|---|---|---|
| A, F | Science and Research | 52.1 | 52.4 | -0.4 | -0.7% | no data | |
| B, G | Capability | 322.9 | 257.9 | 65.0 | 25.2% | 1 | |
| C, H | Support for the Digital, Broadcasting and Media sectors | 147.8 | 88.3 | 59.5 | 67.4% | 2 | |
| D | Modernising and reforming the work of the Government Functions | 361.9 | 236.5 | 125.4 | 53.0% | 3 | |
| E | Building Digital UK | 33.2 | 40.4 | -7.2 | -17.7% | no data | |
| No data | Total voted and non-voted | 917.8 | 675.5 | 242.3 | 35.9% | no data |
Note number:
1. Capability
Resource DEL spending under these subheads is, overall, £65.0 million, or 25.2% higher in the Main Estimate for 2026-2027 compared to the Supplementary Estimate 2025-2026. The main movements are:
-
£18.9 million increase following the incorporation of central functions from Building Digital UK (previously RDEL Programme) and UK Space Agency (previously Capital DEL) into core department.
-
£21.5m increase resulting from a ‘switch’ from Capital DEL relating to cloud computing.
-
£19.3 million of ‘Budget Cover Transfers’ out made at 2025-26 Supplementary Estimate, which have not yet been transferred in 2026-27.
2. Support for the Digital, Broadcasting and Media Sectors
Resource DEL spending under these subheads is, overall, forecast to be £59.5 million, or 67.4% higher at Main Estimate 2026-2027 compared to the Supplementary Estimate 2025-2026. The main movements are:
- £22.7 million increase in Europe, Data, Digital and Security portfolio, reflecting additional funding for the TechFirst Youth programme and Cyber Resilience, funded from Integrated Security budgets.
- £17.3 million increase in Data Protection, driven by a £16.4 million planned increase in Digital Inclusion and Skills funding, building on the Digital Inclusion Innovation Fund investment in 2025-26.
3. Modernising and reforming the work of the Government Functions
Resource DEL spending under these subheads is, overall, £125.4 million or 53.0% higher in the Main Estimate 2026-27 compared to the Supplementary Estimate 2025-26. This reflects ministerial agreed prioritisation to fund MoG IT change, protect and scale core digital infrastructure, and deliver the Digital Blueprint for Government, with RDEL increasing, as mature services move into live operation.
Capital DEL
The table below shows how spending plans for Capital DEL compare with last year.
Table 6: Capital DEL spending plans this year compared to last year
| Subhead | Description | 2026 to 2027 Mains Estimates budget sought (£m) | 2025 to 2026 Supplementary Estimates budget approved (£m) | Change from last year (£m) | Change from last year (%) | Differences of more than 10% which are more than £10 million; of more than 5% which are more than £200 million; and significant or unusual change (see note number) | |
|---|---|---|---|---|---|---|---|
| A, F | Science and Research | 13,717.1 | 13,495.9 | 221.2 | 1.6% | no data | |
| B, G | Capability | 15.1 | 22.0 | -6.8 | -31.2% | no data | |
| C, H | Support for the Digital, Broadcasting and Media sectors | 451.1 | 238.3 | 212.8 | 89.3% | 4 | |
| D | Modernising and reforming the work of the Government Functions | 377.7 | 242.9 | 134.8 | 55.5% | 5 | |
| E | Building Digital UK | 648.3 | 487.3 | 161.0 | 33.1% | 6 | |
| No data | Total voted and non-voted | 15,209.2 | 14,486.3 | 722.9 | 5.0% | no data |
Note number:
4. Support for the Digital, Broadcasting and Media sectors
Total capital spending under these subheads is forecast to increase by £212.8 million or 89.3% at the Main Estimate 2026-2027 compared to the 2025-2026 Supplementary Estimate. This is mainly due to:
- £150.3 million increase in Digital Economy Unit, mainly driven by increased spend in the AI Research Resource expansion programme, Sovereign AI, including equity investments for AI start-up companies.
- £42.8 million increase in Europe, Data, Digital and Security due to funding for the Tech First programme in addition to an uplift in Capability Hardware Enhanced Reduced Instruction Set Computer (CHERI) funding.
- £25.2 million increase in Support for Broadcasting and Media, driven by funding for telecoms R&D.
5. Modernising and reforming the work of the Government Functions
Total capital spending under these subheads is forecast to increase by £134.8 million or 55.5% at the Main Estimate 2026-2027 compared to the 2025-2026 Supplementary Estimate. This is due to:
- £60.0 million increase in Government Digital Service, including One Login, reflecting further enhancement of GOV.UK App and Chat functionality, development of GOV.UK Mailbox, and investment in developing interoperability and personalisation between digital platforms.
- £38.0 million increase in Public Sector AI initiatives, including Gov Voice, Customer First and AI Big Bets and innovation, and National Data Library.
- £36.8 million increase in Digital Centre core responsibilities, including Geospatial to fund new programmes to unlock the value of location data.
6. Building Digital UK
Capital budget under this subhead will increase by £161.0 million or 33.1% at the Main Estimate 2026-2027 compared to the 2025-2026 Supplementary Estimate. This is due to:
- £114.0 million increase in the Gigabit programme, reflecting the increased activity in the 2026-27 financial year in line with the 2032 delivery targets.
- £47.0 million increase relating to delivery slippage into 2026-27 for Shared Rural Network, including a £34.3 million Budget Exchange from 2025-26.
Resource AME
The table below shows how spending plans for Resource AME compare with last year.
Table 7: Resource AME spending plans this year compared with last year
| Subhead | Description | 2026 to 2027 Main Estimates budget sought (£m) | 2025 to 2026 Supplementary Estimates budget approved (£m) | Change from last year (£m) | Change from last year (%) | Differences significantly above or below inflation (see note number) | |
|---|---|---|---|---|---|---|---|
| I, M | Science and Research | 980.0 | 1,012.9 | -32.9 | -3.2% | no data | |
| J | Capability | 56.4 | 57.3 | -0.9 | -1.6% | no data | |
| K, N | Support for the Digital, Broadcasting and Media Sectors | 32.5 | 27.8 | 4.7 | 16.7% | no data | |
| L | Modernising and reforming the work of the Government Functions | 74.4 | 108.6 | -34.2 | -31.5% | 7 | |
| No data | Total voted and non-voted | 1,143.2 | 1,206.6 | -63.4 | -5.3% | no data |
Note number:
7. Modernising and reforming the work of the Government Functions
AME spend under these subheads will decrease by £34.2 million or 31.5% at the Main Estimate 2026-2027 compared to the Supplementary Estimate 2025-2026. This is due to an expected reduction in depreciation charges in 2026-27 due to the profile of the useful life of the assets.
Capital AME
The table below shows how spending plans for Capital AME compare with last year.
Table 8: Capital AME spending plans for this year compared with last year
| Subhead | Description | 2026 to 2027 Main Estimates budget sought (£m) | 2025 to 2026 Supplementary Estimates budget approved (£m) | Change from last year (£m) | Change from last year (%) | See note number | |
|---|---|---|---|---|---|---|---|
| I, M | Science and Research | 0.3 | 0.3 | 0.0 | 0.0% | no data | |
| No data | Total voted and non-voted | 0.3 | 0.3 | 0.0 | 0.0% | no data |
2.2 Restructuring
The following changes have been reflected in this Memorandum:
- As at Main Estimate 2026-27, DSIT’s Estimates subheadings have been reviewed and some outdated subheadings from the predecessor department BEIS (now with minimal spend) have been removed and re-mapped to more current subheadings.
- Ringfenced non-cash depreciation, amortisation and impairment budgets, which, per HMT direction, have been moved from Ringfenced RDEL to Ringfenced AME from 2026-27 onwards.
Comparative prior year values and subheads have been restated to reflect the above changes where necessary, meaning that these will not always align to those in the Supplementary Estimate 2025-26 Memorandum.
2.3 Ring fenced budgets
Within the totals, the following elements are ring fenced i.e. savings in these budgets may not be used to fund pressures on other budgets without express permission from HM Treasury.
As part of the Estimate process, HM Treasury can agree to relax ring fences, to allow the department to manage pressures and reallocate underspends.
Table 9: amounts sought this year compared to last year
| 2026 to 2027 Main Estimates (£m) | Difference compared with last year (£m) | Difference compared with last year (%) | ||
| Financial transactions Of which: |
163.0 | -51.5 | -24.0% | |
|---|---|---|---|---|
| British Technology Investments (BTI) | 60.0 | 40.0 | 200% | |
| National Measurement Service (NMS) | 5.6 | -0.5 | -8.2% | |
| Met Office | 17.9 | -9.9 | -35.7% | |
| UK Research and Innovation (UKRI) | 32.2 | 10.2 | 46.3% | |
| Space | 0.0 | -147.0 | -100% | |
| Sovereign AI | 49.8 | 49.8 | 100% | |
| Other | -2.5 | 5.9 | 70.5% | |
| Depreciation [footnote 3] | 463.7 | -38.4 | -7.7% |
2.4 Changes to contingent liabilities
The schedule of contingent liabilities is listed in Annex B Part III: Note K of the Estimate.
This schedule relates to liabilities recognised at the time of issuing this document with a complete audited schedule to be published in the Annual Report and Accounts.
A new contingent liability has been disclosed in relation to the potential VAT liability on the Notify scheme. Discussions with HMRC resolved the VAT inquiry relating to 2025-26 expenditure in which HMRC confirmed the current VAT recovery basis requires revision. VAT could be recovered under a different basis subject to some adjustments. Adjustments for this were made in 2025-26 and any further outflows relating to this inquiry are considered to not be probable.
The estimate for current contingent liabilities which were disclosed at the 2025-2026 Supplementary Estimate have either moved by de minimis amounts or remained unquantifiable.
3. Priorities and performance
3.1 How spending relates to objectives
The table below shows how funding against each subhead contributes to Departmental priorities under the Outcome Delivery Plan.
Outcome 1: Growth and Prosperity
Estimates subheads: A, F, I, M
Outcome 2: Modernising Public Services
Estimates subheads: A, F, I, M, B, G, J, D, L
Outcome 3: Tech Adoption and Skills
Estimates subheads: C, H, K, N, E
Outcome 4: Technology You Can Trust
Estimates subheads: C, H, K, N
3.2 Measures of performance against each priority
DSIT measures performance for the department against its high-level objectives. Each metric has been mapped to the objective it mainly contributes to; however metrics may contribute to more than one objective.
| Metric | 1. Growth and Prosperity | 2.Modernising Public Services | 3. Tech Adoption and Skills | 4. Technology You Can Trust |
|---|---|---|---|---|
| Gross expenditure on Research and Development (GERD) as a percentage of GDP | X | - | - | - |
| Business Expenditure on Research and Development (BERD) | X | - | - | - |
| Field weighted citation impact | X | - | - | - |
| Number of new UK unicorns | X | - | - | - |
| Value of equity investment into R&D-intensive businesses in the UK | X | - | - | - |
| UK digital sector gross value added | X | - | - | - |
| Percentage of premises passed with gigabit-capable broadband (including premises with access to FTTP and/or DOCSIS3.1)[footnote 4] | - | - | X | - |
| Percentage of geographic area with 4G coverage from at least one mobile network operator (UK, outdoor) | - | - | X | - |
| Percentage of premises with 5G coverage from at least one mobile network operator (UK, coverage outside premises) | - | X | - | |
| Business adoption of AI | - | - | X | - |
| Percentage of adults in the UK who report they have experienced potentially harmful online content or behaviour in a 4-week period | - | - | X | |
| Percent of children (11-17) in the UK who report they have experienced potentially harmful online (priority) content or behaviour in a 4-week period | - | - | X | |
| Percentage of civil servants working in digital, data and technology roles | - | X | - | - |
3.3 Major projects
The department is currently responsible for 7 major projects that are included in the Government Major Projects Portfolio (GMPP). Details for the projects are included below, taken from the NISTA Annual Report 2024-2025 published in August 2025.
As part of HMT’s Project Reset, from end of April 2026 NISTA are fundamentally changing the structure of the GMPP. This will lead to a reduction in the number of projects and programmes that sit within GMPP. Projects and programmes exiting GMPP will continue to be monitored as part of a lighter-touch reporting regime. Projects and Programmes that will exit GMPP are noted below.
Met Office Supercomputing 2020+ Programme (Exiting GMPP in April 2026)
Delivering our future Supercomputing capability through the procurement and installation of an increased supercomputing capacity. This includes storage, observation networks, post processing systems and services, tooling for data exploitation delivery and support resources throughout the investment lifetime, data centre hosting, networking security services and decommissioning.
- Start Date: 1 January 2018
- End Date: 11 July 2032
- Whole Life Baseline Cost: £1.24 billion
- NISTA Sub-Category: ICT
- Delivery Confidence Assessment: AMBER
Matrix Cluster Transformation Programme (Exiting GMPP in April 2026)
The Matrix Transformation Programme seeks to implement the Government Shared Service Strategy for 8 government departments, by modernising and consolidating back-office systems and services. This will include delivery of a new shared business process service (BPS), a combined enterprise resource planning (ERP) system including ancillary technologies, and a change in ways of working for all users.
- Start Date: 1 April 2022
- End Date: 30 November 2027
- Whole Life Baseline Cost: £938 million
- NISTA Sub-Category: Government Transformation and Service Delivery
- Delivery Confidence Assessment: AMBER
Project Gigabit (Remaining as a GMPP Programme)
Deliver gigabit capable broadband to at least 99% of premises by 2032[footnote 5] and achieve full coverage as soon as possible. The government is subsidising deployment of non-commercial premises through Project Gigabit, other than premises which are not affordable or do not represent value for money.
- Start Date: 1 April 2021
- End Date: 31 December 2032
- Whole Life Baseline Cost: £5.4 billion
- NISTA Sub-Category: Infrastructure and Construction
- Delivery Confidence Assessment: AMBER
Shared Rural Network (Exiting GMPP in April 2026)
The Shared Rural Network (SRN) programme is a deal between government and the 4 Mobile Network Operators (MNOs) - EE, Virgin Media O2, Vodafone and Three (with obligations flowing through to any subsequent merged entity).
The programme achieved its overarching objectives of delivering 4G coverage to 95% of UK landmass, 280,000 premises and 16,000km of roads over 12 months ahead of the programme deadline of the end of 2025, with the most significant coverage improvements in rural parts of Scotland and Wales.
The SRN programme is split between public and privately funded elements and underpinned by the MNOs’ spectrum licence obligations. In line with the 6-year capital funding period, the MNOs’ legally binding spectrum obligations for the SRN, which are still yet to be met, must be achieved by January 2027 and the programme will continue to deliver coverage improvements up to that point. Having achieved the overarching objectives of the SRN programme, government and the MNOs have worked together to agree a revised plan to target remaining deployment of infrastructure in places where the benefit will be felt the most.
- Start Date: 11 March 2020
- End Date: 11 March 2040
- Whole Life Baseline Cost: £512 million
- NISTA Sub-Category: Infrastructure and Construction
- Delivery Confidence Assessment: AMBER
GOV.UK One Login (Exiting GMPP in April 2026)
GOV.UK One Login provides a single way for users to create an account, log in, and prove their identity to access all central government services. It replaces the previous landscape of siloed and duplicative sign-in and identity-proofing methods, providing one ‘front door’ for connected services that will continue to be operated by departments. By streamlining access, this consolidation reduces costs, lowers the risk of fraud, enhances inclusion, and significantly improves the user experience, amplifying benefits to both government and citizens, ensuring it remains the ‘market-leading’ account and identity verification solution across government.
- Start Date: 4 January 2021
- End Date: 31 March 2028
- Whole Life Baseline Cost: £342.19 million
- NISTA Sub-Category: ICT
- Delivery Confidence Assessment: AMBER
Major Projects Recently Completed/Closed
Open Networks Programme
The Open Networks Research and Development (R&D) Fund is the £250 million government supported programme to deliver upon the UK’s 5G Supply Chain Diversification Strategy. The Open Networks R&D Fund aims to accelerate the development and deployment of open interface architectures, such as Open RAN, and our ambition to:
-
Accelerate open-interface products and solutions - ensuring they are truly interoperable, performant, and sustainable – to support our long-term vision for a more open and innovative telecoms market.
-
Incentivise and de-risk accelerated deployment in the UK - to encourage and accelerate network operators to adopt and deploy open network solutions.
-
Develop an internationally recognised UK telecoms ecosystem - positioning the UK as a leading global market and focal point for research into open network technology.
- Start Date: 1 September 2021
- End Date: 31 March 2025
- Whole Life Baseline Cost: £325 million
- NISTA Sub-Category: Infrastructure and Construction
- Delivery Confidence Assessment: N/A (Programme completed)
National Underground Asset Register
The National Underground Asset Register (NUAR) is a new digital map of the pipes and cables beneath our feet. The service will improve the efficiency and safety of works and is envisaged to deliver over £4 billion of economic growth over 10 years.
- Start Date: 9 August 2021
- End Date: 31 March 2026
- Whole Life Baseline Cost: £42.6 million
- NISTA Sub-Category: Government Transformation and Service Delivery
- Delivery Confidence Assessment: AMBER
Major Projects expected to join the portfolio in 2026-27
National Timing Centre (NTC) is expected to be added to GMPP in 2026. The exact timing is to be confirmed.
The Infrastructure and Projects Authority reports on delivery of major projects annually. Data for DSIT can be found here.
4. Other information
4.1 Research and Development Expenditure
The following is provided as contextual information on R&D expenditure at the request of the Science, Innovation & Technology Committee. In contrast to the spending outlined in previous sections, it does not represent a firm spending commitment as part of the estimates process.
R&D spending under the Frascati definition is expected to increase relative to last year’s budgets as explained below.
Table 10: Research and Development expenditure
| No data | Spending plans this year - 2026 to 2027 Main Estimates (£m)[footnote 6] | Difference (+/-), compared to original budget this year Spending Review 2025[footnote 7] (£m) | Difference (+/-), compared to original budget this year Spending Review 2025 (%) | Difference (+/-), compared to final budgets last year Supplementary Estimates 2025-26 (£m) | Difference (+/-), compared to final budgets last year Supplementary Estimates 2025-26 (%) | Differences significantly above or below inflation (see note number) | |
|---|---|---|---|---|---|---|---|
| UK Research & Innovation (UKRI)[footnote 8] | 9,220 | - | - | -1.4 | -0.0% | no data | |
| UK contribution to EU programmes | 2,121 | - | - | 92.7 | 4.6% | no data | |
| UK Space Agency (UKSA) | 679 | - | - | 3.1 | 0.5% | no data | |
| Met Office | 327 | - | - | -37.1 | -10.2% | 1 | |
| National Academies | 219 | - | - | -1.3 | -0.6% | no data | |
| Advanced Research & Invention Agency (ARIA) | 220 | - | - | 36.3 | 19.7% | 2 | |
| National Measurement System (NMS) | 131 | - | - | 0.6 | 0.5% | no data | |
| AI Security Institute (AISI) | 60 | - | - | -9.0 | -13.0% | 3 | |
| Office for Life Sciences (OLS) | 264 | - | - | 241.7 | 1,084.3% | 4 | |
| Government Office for Science (GO Science) | 19 | - | - | 1.0 | 5.7% | no data | |
| Other DSIT Programmes[footnote 9] | 797 | - | - | 142.7 | 21.8% | 5 | |
| Total R&D | 14,056 | - | - | 469.3 | 3.5% | no data |
Differences of more than 10% are explained below.
1. Met Office
R&D spend has decreased compared with Supplementary Estimate due to a lower allocation for Supercomputer this year due to the profile of activity, and higher loan repayments being received, which offset expenditure.
2. Advanced Research & Invention Agency
R&D spend has increased compared with Supplementary Estimate, reflecting ARIA’s organisational plans as it grows over the SR period, continuing to fund breakthrough R&D, catalysing new paths to prosperity for the UK.
3. AI Security Institute
AISI R&D spend has decreased compared with last year, in line with the Spending Review settlement.
4. Office for Life Sciences
R&D spend has increased compared with Supplementary Estimate. This is due to an ambition to deliver on existing commitments, including those set out in the Life Sciences Sector Plan, as well as timing differences – further BCTs out to other government departments are expected at Supplementary Estimate again this year, as well as potential internal reallocations to UKRI for managed programmes.
5. Other DSIT programmes
Other R&D spend for 2026-27 is to be formally allocated within DSIT, therefore ‘other’ R&D spend appears to have increased at present.
4.2 Additional specific information required by the Select Committee
Table 11: breakdown of administration budget - spending total amounts sought this year compared to the final budget last year
| Administration budget | Main Estimate 2026 to 2027 (£m) | Variance to Supplementary Estimate 2025 to 2026 (£m) | Variance to Supplementary Estimate 2025 to 2026 (%) | |
|---|---|---|---|---|
| Wages and salaries / Purchase of goods and services / other | 410.7 | 76.7 | 23% | |
| Depreciation | 0.0 | 0.0 | 0% | |
| Total core department and Agency administration | 410.7 | 76.7 | 23% | |
| UKRI (depreciation) | 0.0 | 0.0 | 0% | |
| Information Commissioners office | 0.0 | 0.0 | 0% | |
| Information Commissioners office (depreciation) | 0.0 | 0.0 | 0% | |
| Ofcom (depreciation) | 0.0 | 0.0 | 0% | |
| UK Shared Business Services | 0.0 | 0.0 | 0% | |
| Total partner organisations administration | 0.0 | 0.0 | 0% | |
| Total administration budget | 410.7 | 76.7 | 23% |
4.3 Additional specific information required by the Select Committee
Breakdown of Income Sources and Trend Analysis
| Source of Income | DSIT Group Estimated Income 2026-27 (£m) | DSIT Group Estimated Income 2025-26 (£m) | DSIT Group Income Outturn 2024-25 (£m) |
|---|---|---|---|
| Fees, charges and recharges to/ from external customers and central Government organisations | 413.8 | 386.1 | 345.0 |
| Income from other government departments and public sector | 527.0 | 653.1 | 665.0 |
| Sales of goods and services | - | 42.0 | 47.0 |
| European Union funding | - | 2.6 | 5.0 |
| Current grants and capital grants | 6.8 | 191.4 | 213.0 |
| Miscellaneous income | 77.0 | 155.8 | 72.0 |
| Other income | - | - | 29.0 |
| Total Operating Income | 1,024.6 | 1,430.9 | 1,376.0 |
| Finance Income | |||
| o/w Loan repayments | 70.7 | 44.2 | 23.0 |
| o/w Dividends | 33.4 | 40.2 | 39.0 |
| o/w Shares disposal | - | 14.3 | - |
| o/w Secondments recharges | - | 1.0 | - |
| Finance Income | 104.1 | 99.8 | 62.0 |
| Total Income | 1,128.7 | 1,530.8 | 1,438 |
Income will be finalised at the year end and an updated view presented at Supplementary Estimate, and for the purposes of preparing the income forecast we have assumed for some areas that historic trends will continue into 2025–26; therefore, the position presented is an estimate.
| Source of Income | (£m) | Commentary |
|---|---|---|
| Fees, charges and recharges to/ from external customers and central Government organisations | 413.8 | The Department’s income primarily arises from fees and charges associated with its regulatory and digital services functions. The largest element relates to received and retained income from Ofcom (c£231 million), reflecting its role in overseeing and regulating the UK communications sector. A substantial proportion (c£121 million) also comes from fee income received and retained from the Information Commissioner’s Office (ICO), which supports the delivery of its statutory regulatory responsibilities. The Department further receives c£40 million cost‑recovery income from the Government Digital Service (GDS), including contributions from public‑sector users of the GOV.UK Notify platform, which contributes to sustaining core digital services across government. |
| Income from other government departments and public sector | 527.0 | In 2026-27, this income is predominantly expected from Innovate UK (IUK) activity. The income arises where government funding is combined with industry or other partners to deliver research and innovation projects across priority sectors. Key contributors include income from government departments for the Centre for Aerodynamics, other IUK-managed initiatives such as Faraday (supporting battery innovation) and the Advanced Propulsion Centre (supporting low‑carbon propulsion technologies) or Co‑Funding for Manufacturing, Materials & Mobility, reflecting the breadth of IUK’s role in partnering with industry to drive UK innovation. |
| Sales of goods and services | - | No such income has been confirmed yet for 2026-27. |
| European Union funding | - | No such income has been confirmed yet for 2026-27. |
| Current grants and capital grants | 6.8 | Current capital grants from other government departments in relation to research programmes, for example in relation to Office for Life Sciences. |
| Miscellaneous income | 77.0 | The main source of miscellaneous income is the income received by UKSBS, reflecting cost‑recovery for the shared services UKSBS provides across multiple government organisations. Additional funding from the DSIT Geospatial Programme income, which supports national research infrastructure and specialist data mapping capability. |
| Finance Income | 104.1 | Finance income comprises approximately £53 million in retained loan‑repayment interest from the Met Office and the National Measurement System (NMS). In addition, around £33 million relates to dividend payments received from the Met Office, the Intellectual Property Office (IPO) and Ordnance Survey. |
| Total Income | 1,128.7 |
4.4 Additional specific information required by the Select Committee
Additional breakdown of UKRI budgets[footnote 10]
Main Estimate 2026-27 – by R&D bucket:
| R&D bucket | Spending plans this year Main Estimate 2026-27 (£m) [footnote 11] | Supplementary Estimate 2025-26 (£m) |
|---|---|---|
| B1 – Applicant-led Research | 815 | - |
| B1 – Quality-related research funding | 2,258 | - |
| B1 – Other investments | 580 | - |
| B1 – Curiosity-driven Research - Total | 3,653 | - |
| B2 – Industrial Strategy Sectors | 935 | - |
| B2 – Wider priorities | 651 | - |
| B2 – R&D Missions Programme | 50 | - |
| B2 – Large-scale compute | 240 | - |
| B2 – Infrastructure | 49 | - |
| B2 – Strategic Government and Societal Priorities - Total | 1,924 | - |
| B3 – Industrial Strategy Sectors | 979 | - |
| B3 – Wider Priorities: All 4 subsectors | 159 | - |
| B3 – Local Innovation Partnership Fund LIPF | 410 | - |
| B3 – Supportive Innovative Companies - Total | 1,638 | - |
| B4 – Institutes | 402 | - |
| B4 – Collective Talent | 806 | - |
| B4 – Infrastructure | 486 | - |
| B4 – International subscriptions and partnerships | 130 | - |
| B4 – Other investments | 180 | - |
| B4 – Enabling and Strengthening UK R&D - Total | 2,004 | - |
| Grand Total | 9,220[footnote 12] | - |
Supplementary Estimate 2025-26 – by research council:
| Research Council | Spending plans this year (Main Estimate 2026-27) (£m) | Supplementary Estimate 2025-26 (£m) |
|---|---|---|
| Council R&D budgets [footnote 13] | - | 5,742 |
| Of which Arts and Humanities Research Council (AHRC) | - | 74 |
| Of which Biotechnology & Biological Sciences Research Council (BBSRC) | - | 328 |
| Of which Engineering and Physical Sciences Research Council (EPSRC) | - | 649 |
| Of which Economic and Social Research Council (ESRC) | - | 161 |
| Of which Medical Research Council (MRC) | - | 619 |
| Of which Natural Environment Research Council (NERC) | - | 329 |
| Of which Science and Technology Facilities Council (STFC) | - | 638 |
| Of which Research England (RE) | - | 2,002 |
| Of which Innovate UK (IUK) | - | 942 |
| Cross UKRI R&D budgets | - | 2,763 |
| Of which Collective Talent | - | 761 |
| UKRI Reported Total[footnote 14] | - | 8,505 |
| Managed programmes and SE25-26 budget adjustments [footnote 15] | - | 716 |
| Overall UKRI Total[footnote 16] | - | 9,221 |
5. Accounting Officer approval
This memorandum has been prepared according to the requirements and guidance set out by the House of Commons Scrutiny Unit, available on the Scrutiny Unit website.
The information in this Estimates Memorandum has been approved by myself as departmental Accounting Officer.
Emran Mian
Accounting Officer
Permanent Secretary
Department for Science, Innovation and Technology
27 April 2026
-
Some values within this Capital DEL graph do not align to the R&D table in section 4.1. This is due to Capital DEL budgets in this section 1.3 including Financial Transactions budgets, which are not R&D-related and therefore not included within the R&D values. ↩
-
From Main Estimate 2026-27, non-cash depreciation has moved from Resource DEL to Resource AME for all financial years. The Supplementary Estimate and Main Estimate 2025-26 values have therefore been adjusted for the retrospective reclassification of depreciation budgets, to aid comparability. The values shown therefore do not align with the corresponding 2025-26 Estimates Memorandum. ↩
-
As of 2026-27 depreciation has been moved from Resource DEL to Resource AME. ↩
-
FTTP is “Fibre to the Premises” which is to say a fibre-optic broadband data connection allowing fast transit of high volumes of data. DOCSIS3.1 is a broadband standard using conventional cables to achieve a similarly high-speed connection. ↩
-
The pre-SR target was by 2023; this has since been updated to 2032. ↩
-
The values in this column are based on the DSIT R&D plans to 2029-2030 published October 2025, with additional lines added for ‘Government Office for Science’ and ‘other DSIT programmes’, for comparability with Supplementary Estimate. ↩
-
The values in this column are based on the DSIT R&D plans to 2029-2030 published October 2025, with additional lines added for ‘Government Office for Science’ and ‘other DSIT programmes’, for comparability with Supplementary Estimate. ↩
-
The UKRI Initial Allocation for 2026-27 may change following further confirmation and re-allocation of DSIT managed programmes. This will be updated at Supplementary Estimate, if required. See also further breakdown of UKRI budgets in section 4.4 below. ↩
-
Includes DSIT-led programmes such as Geospatial, International funding (incl. ODA). ↩
-
UKRI have recently published a breakdown SR budget allocations UKRI Budget Allocations. The table above aligns to this publication. ↩
-
As of 2026-27, UKRI have changed from reporting their budget breakdown by research council to reporting using the R&D buckets. As a result, there is no direct comparator for Main Estimate budgets – see below table which shows the breakdown as at Supplementary Estimate 2025-26, by council. For future Estimates Memorandum comparators will be available using the R&D buckets. UKRI have published further details on this change in reporting, to aid comparability between 2025-26 and 2026-27 allocations Schematic mapping of UKRI’s previous funding lines to our new model ↩
-
The small difference in UKRI total compared with the R&D table in Section 4.1 is as a result of rounding differences. The difference in the CDEL budget per Section 1.4 relates to Financial Transactions, which are CDEL-related but not R&D-related, so are included within 1.4 but not 4.1. ↩
-
Some individual council figures are greater than published allocations as some funding that was originally allocated to cross-UKRI budgets has been distributed amongst the research councils. ↩
-
Totals differ from those published in the R&D allocations explainer primarily due to the timing of Research England payments, due to differences in academic years and financial years. This does not represent a decrease in overall funding available to UKRI. ↩
-
This line includes £13 million Budget Cover Transfers from other departments at SE25-26 which had not yet been formally assigned to the relevant council or programme. ↩
-
UKRI total is greater than the published allocation as it includes programmes that UKRI manages on behalf of DSIT that were not included in published allocations. ↩