Drug misuse: Findings from the 2013/14 Crime Survey for England and Wales
Updated 15 August 2014
Applies to England and Wales

© Crown copyright 2014
This publication is licensed under the terms of the Open Government Licence v3.0 except where otherwise stated. To view this licence, visit nationalarchives.gov.uk/doc/open-government-licence/version/3 or write to the Information Policy Team, The National Archives, Kew, London TW9 4DU, or email: psi@nationalarchives.gov.uk.
Where we have identified any third party copyright information you will need to obtain permission from the copyright holders concerned.
This publication is available at https://www.gov.uk/government/statistics/drug-misuse-findings-from-the-2013-to-2014-csew/drug-misuse-findings-from-the-201314-crime-survey-for-england-and-wales
1. Introduction
This release examines the extent and trends in illicit drug use among a nationally representative sample of 16 to 59 year olds resident in households in England and Wales, and is based on results from the 2013 to 2014 Crime Survey for England and Wales (CSEW).
The release covers the following topics:
- Extent and trends in illicit drug use among adults, including separate analysis of young adults (16 to 24 year olds);
- Frequency of illicit drug use in the last year;
- Illicit drug use by personal, household and area characteristics and lifestyle factors;
- Estimates of illicit drug use by ethnicity and sexual orientation. Accessibility of drugs is covered in the Annex.
As population estimates based on the 2011 Census are now available, the Office for National Statistics embarked on a programme of work to re-weight CSEW data using the new estimates. Therefore, drug use estimates from 2001 to 2002 to 2012 to 2013 presented in this publication have been re-weighted using new Census 2011 based population weights. Re-weighting the data in this way has had minimal impact on the drug use estimates. For more detail on the re-weighting programme and the impact on drug use estimates, please see the Technical annex of the full report.
While responsibility for the CSEW transferred to the Office for National Statistics on 1 April 2012, the Home Office has retained responsibility for analysis and publication of this Drug Misuse publication.
Copies of other Home Office publications are available on the Home Office pages of the Gov.uk website.
The dates of forthcoming publications are pre-announced and can be found via the UK National Statistics Publication Hub.
For further information about the CSEW, please email crimestatistics@ons.gov.uk
Home Office Responsible Statistician
David Blunt, Chief Statistician and Head of Profession for Statistics Contact via crimestats@homeoffice.gov.uk
The United Kingdom Statistics Authority has designated these statistics as National Statistics, in accordance with the Statistics and Registration Service Act 2007 and signifying compliance with the Code of Practice for Official Statistics. Designation can be broadly interpreted to mean that the statistics: meet identified user needs; are well explained and readily accessible; are produced according to sound methods; and are managed impartially and objectively in the public interest. Once statistics have been designated as National Statistics it is a statutory requirement that the Code of Practice shall continue to be observed.
This statistical bulletin is produced to the highest professional standards and is free from political interference. It has been produced by statisticians working in the Home Office Statistics Unit in accordance with the Home Office’s Statement of Compliance with the Code of Practice for Official Statistics, which covers Home Office policy on revisions and other matters. The Home Office Statistics Unit works under the direct line management of the Home Office Chief Statistician, who reports to the National Statistician with respect to all professional statistical matters. From April 2012 publication of Crime Statistics bulletins transferred to the Office for National Statistics.
2. Extent and trends in illicit drug use among adults
This section covers the extent and trends in illicit drug use among adults aged 16 to 59 measured by the 2013 to 2014 Crime Survey for England and Wales (CSEW). Also included separately are figures for young adults aged 16 to 24. Figures are presented since 1996 when comparable questions were first included on the survey.
The User Guide to Drug Misuse: Findings from the CSEW provides further details relating to illicit drug use measures.
2.1 Key facts
- Around 1 in 11 (8.8%) adults aged 16 to 59 had taken an illicit drug in the last year. However, this proportion more than doubled when looking at the age subgroup of 16 to 24 year-olds (18.9%).
- Levels of last year drug use in 2013/14 were higher than in 2012 to 2013. In 2012 to 2013, 8.1% of 16 to 59 year-olds and 16.2% of 16 to 24 year-olds had taken an illicit drug in the last year. However, these figures were both lower than in 1996.
- Cocaine, ecstasy, LSD and ketamine use increased between 2012 to 2013 and 2013 to 2014. However there were no statistically significant decreases in last year drug use of any individual drug types among 16 to 59 year olds between 2012 to 20 13 and 2013 to 2014.
- Around one-third of adults had taken drugs at some point during their lifetime. Of 16 to 59 year olds, 35.6% had reported ever using drugs.
Estimates of illicit drug use among adults from the 2013 to 2014 CSEW can be found in the Illicit drug use among adults tables.
2.2 Extent and trends in overall drug use and Class A drug use
The 2013 to 2014 CSEW shows that (also see Figure 2.1):
- Around 1 in 11 (8.8%) adults aged 16 to 59 had taken an illicit drug (excluding mephedrone) in the last year, which equated to around 2.7 million people. This proportion was an increase compared with 2012 to 2013 (8.1%) but is back to the same level as in 2011 to 2012;
- The overall trend in the proportion of adults taking an illicit drug in the last year has been essentially stable at between 8% and 9% per cent since 2009 to 2010 following a period of decreasing rates from a peak in 2003 to 2004. (Prior to 2003 to 2004 the proportion remained broadly flat at around 12%).
- The proportion of adults aged 16 to 24 taking any drug in the last year was around double the proportion in the 16 to 59 age group, at 18.9%. This was an increase compared with 2012 to 2013 (16.2%) but around the same level as in 2011 to 2012 (19.2%).
Survey data can fluctuate from one year to the next and therefore, it is not yet possible to tell whether the increases between 2012 to 2013 and 2013 to 2014 (as detailed below) signal a reverse of the long-term downward trends, or that either the 2012/13 levels were particularly low or the 2013 to 2014 levels particularly high. Indeed, an upturn in the figures was seen 2008/09 but this did not ultimately affect the overall downward trend.
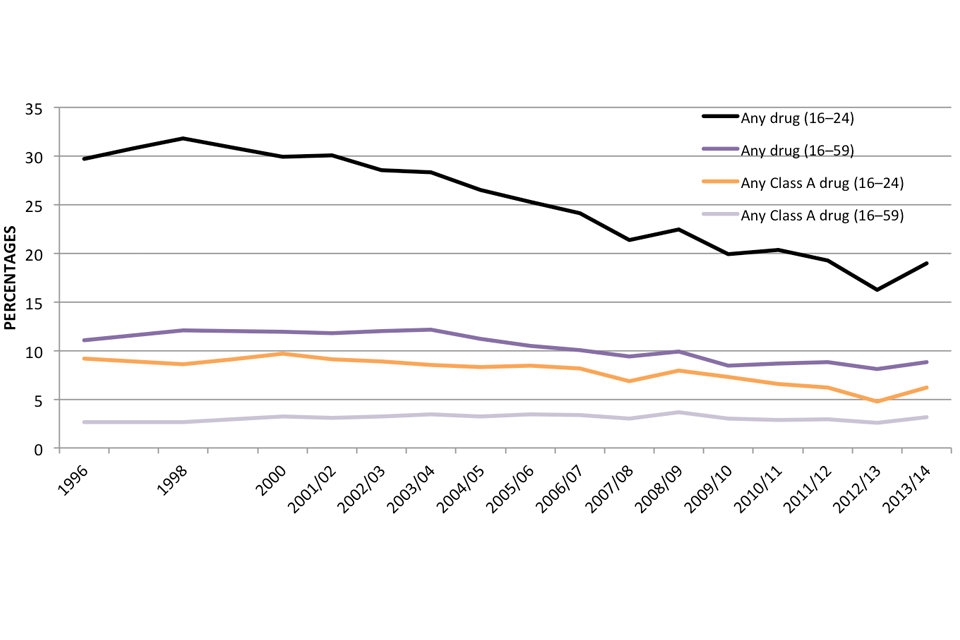
Figure 2.1: Trends in illicit drug use (excluding mephedrone) in the last year among adults, by age group, 1996 to 2013 to 2014, Crime Survey for England and Wales
.
Chart notes
Source: Home Office, Illicit drug use among adults tables: Tables Ext_02 and Ext_05. Note: For 2001 to 2002 to 2005 to 2006 16 to 24 year-old figures have not been re-weighted based on census 2011 weights as it has not been possible to reproduce the youth boost weights.
Including mephedrone, the proportion of adults aged 16 to 59 taking any illicit drug in the last year was 8.8% in 2013 to 2014 (i.e. no different to the proportion when excluding mephedrone). This was an increase from 8.1% in 2012 to 2013 but a similar level to 2011 to 2012 (9.0%) and 2010 to 2011 (8.8%).
According to the 2013 to 2014 CSEW, 3.1% of adults aged 16 to 59 had taken a Class A drug in the last year, equivalent to 985,000 people. Although this proportion increased from 2.5% in 2012 to 2013, the long-term trend in Class A drug use in the last year for all adults (as shown in Figure 2.1) has been broadly stable over the last few years.
Figure 2.1 also shows that the long-term trend in Class A drug use in the last year for adults aged 16 to 24 decreased between the 1996 (9.2%) and 2013 to 2014 (6.2%) surveys. This was due in part to a decline in last year use of ecstasy, LSD and magic mushrooms over the same period (see the next section ‘Extent and trends in individual drug use’). The apparent increase in Class A drug use among 16 to 24 year olds from the 2012 to 2013 survey (4.8%) was not statistically significant, and it is too early to say whether this indicates a change in the long-term downward trend. There have been fluctuations before in this series, notably in 2007 to 2008 and 2008 to 2009.
2.3 Extent and trends in individual drug use
Cannabis
As in previous years, cannabis was the most commonly used drug in the last year, with 6.6% of adults aged 16 to 59 using it last year. As shown in Figure 2.2, this is a similar level to 2012 to 2013 (6.3%), which was the lowest proportion since measurement began in 1996 (when the proportion was 9.4%). The long-term trend shows that the level of last year cannabis use for 16 to 59 year olds fell between 2002 to 2003 and 2009 to 2010, following a period when it was around 10%. Since 2009 to 2010 it has remained essentially stable at between 6 and 7 per cent.
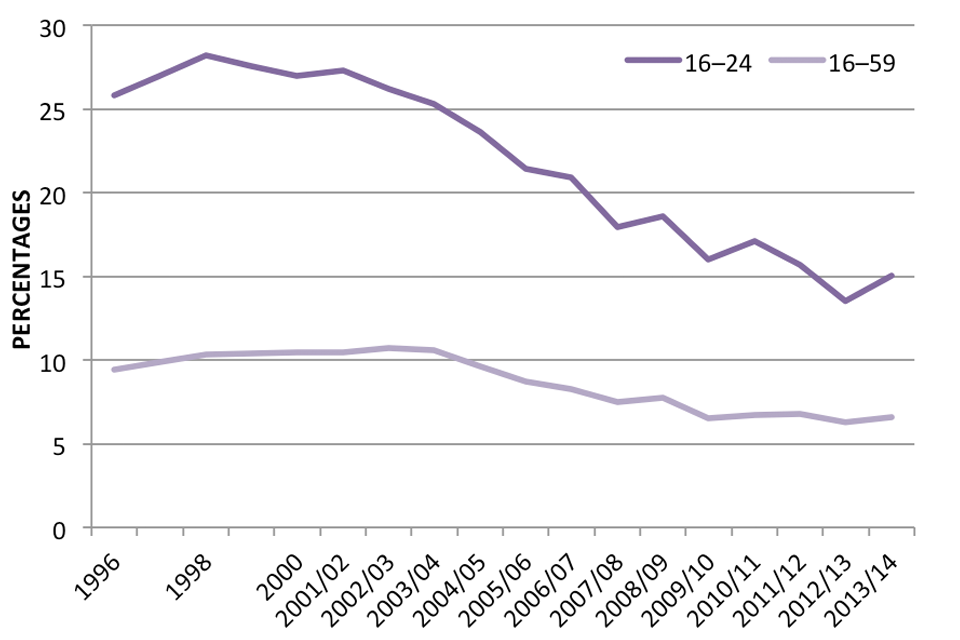
Figure 2.2: Proportion of adults using cannabis in the last year, by age group, 1996 to 2013 to 2014, Crime Survey for England and Wales
.
Chart notes
Source: Home Office, Illicit drug use among adults tables: Tables Ext_02 and Ext_05. Note: For 2001 to 2002 to 2005 to 2006 16 to 24 year-old figures have not been re-weighted based on census 2011 weights as it has not been possible to reproduce the youth boost weights.
Similar to the findings for all adults, cannabis was the most commonly used drug in the last year among young adults, with 15.1% of adults aged 16 to 24 using it last year. This was not statistically significantly different from the level in 2012 to 2013 (13.5%), which saw the lowest proportion since measurement began in 1996 (when it was 25.8%, although the peak was 28.2% in 1998). As with the trend for Class A drug use among young people, it is too early to say whether this indicates a change in the long-term downward trend. There have been fluctuations before in this series, notably in 2008 to 2009 and 2009 to 2010.
Powder cocaine
As in recent years, after cannabis, the next most commonly used drug in the last year by adults aged 16 to 59 was powder cocaine (2.4%).
As shown in Figure 2.3, the proportion of adults aged 16 to 59 using powder cocaine in the last year was higher than in 2012 to 2013 (1.9%) and is back at the same level as 2009 to 2010 (2.4%). This increase in cocaine use has made a major contribution to the increase in overall drug use between 2012 to 2013 and 2013 to 2014.
Although the proportion of adults reporting using powder cocaine in 2013 to 2014 was much higher than in 1996 (0.6%), usage still remains lower than the peak in 2008 to 2009 (3.0%).
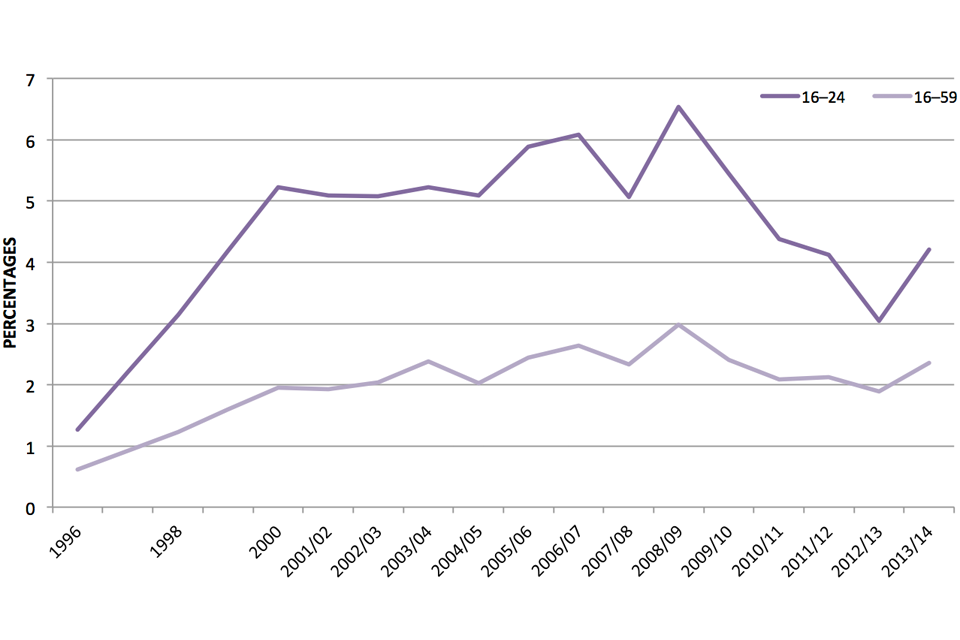
Figure 2.3: Proportion of adults using powder cocaine in the last year, by age group, 1996 to 2013 to 2014, Crime Survey for England and Wales
.
Chart notes
Source: Home Office, Illicit drug use among adults tables: Tables Ext_02 and Ext_05. Note: For 2001 to 2002 to 2005 to 2006 16 to 24 year-old figures have not been re-weighted based on census 2011 weights as it has not been possible to reproduce the youth boost weights.
Despite the fall in last year Class A drug use by young adults aged 16 to 24 between 1996 and 2013 to 2014 (see Figure 2.1) there was a statistically significant increase in the use of powder cocaine over the same period (1.3% to 4.2%). However, the apparent increase in cocaine use between 2012 to 2013 and 2013 to 2014 (from 3.0% in 2012 to 2013 to 4.2% in 2013 to 2014) was not statistically significant, and it is too early to say whether this indicates a change in the downward trend observed since peak usage in 2008 to 2009 (6.5%).
The trend since 1996 in cocaine use in the last year for those aged 16 to 24 has followed a similar pattern to that for all adults aged 16 to 59, although the proportions are around twice that of the wider age group. However, in recent years, this gap has closed slightly.
Ecstasy
As shown in Figure 2.4, the level of last year ecstasy use by adults aged 16 to 59 rose from a year earlier and was similar in 2013 to 2014 (1.6%) to that seen in 1996 (1.7%). The proportion of 16 to 59 year olds using ecstasy in the last year has remained between 1.2% and 2.1% since measurement began in 1996.
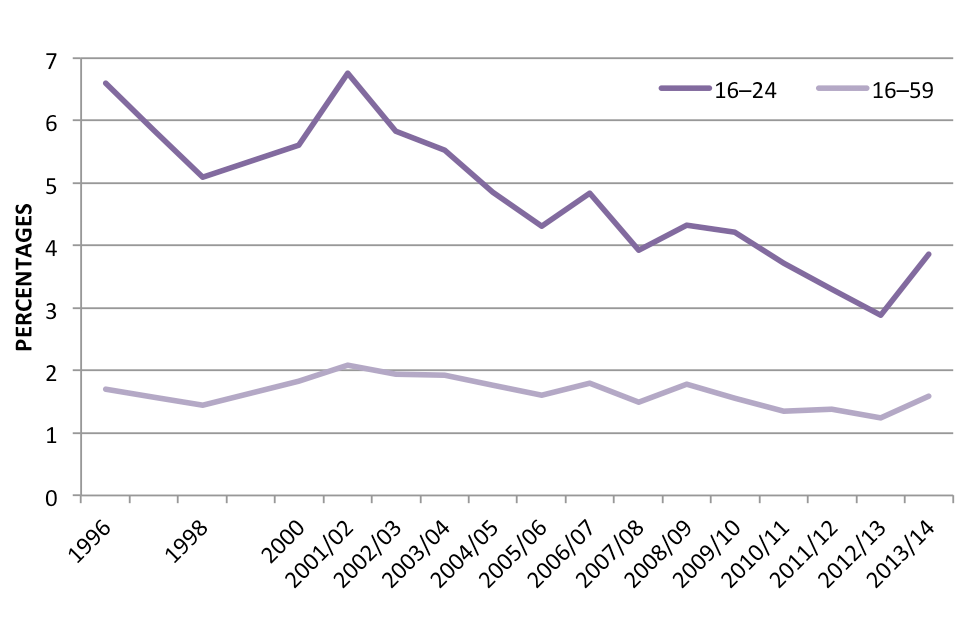
Figure 2.4: Proportion of adults using ecstasy in the last year, by age group, 1996 to 2013 to 2014, Crime Survey for England and Wales
.
Chart notes
Source: Home Office, Illicit drug use among adults tables: Tables Ext_02 and Ext_05. Note: For 2001 to 2002 to 2005 to 2006 16 to 24 year-old figures have not been re-weighted based on census 2011 weights as it has not been possible to reproduce the youth boost weights.
The proportion of 16 to 24 year olds reporting ecstasy use in the last year was 3.9%, a non statistically significant increase when compared with 2012 to 2013 (2.9%). Although the long-term trend in last year ecstasy use among young adults is quite erratic (Figure 2.4), use has fallen since the peak in 2001 to 2002 (6.8%).
Other illicit drugs
Looking at changes in individual drug use in the last year between 2012 to 2013 and 2013 to 2014:
- For adults aged 16 to 59, as well as the increases in powder cocaine and ecstasy use (see above) there were statistically significant increases in last year use of LSD (0.2% in 2012 to 2013 to 0.3% in 2013 to 2014) and ketamine (0.4% to 0.6% in 2013 to 2014);
- For young adults aged 16 to 24, there was an increase in the last year use of ketamine between 2012 to 2013 and 2013 to 2014 (0.8% to 1.8%), however no other changes in levels of use of any other drugs were found to be statistically significant.
For adults aged 16 to 59 and young adults aged 16 to 24, there were no statistically significant decreases in last year use between 2012 to 2013 and 2013 to 2014 for any type of drug. Despite some increases between 2012 to 2013 and 2013 to 2014, levels of last year use of most drug types in 2013 to 2014 were not significantly different from 2011 to 2012 levels. It is too soon to tell whether this indicates a possible ‘levelling-off’ of drug-use levels or what the impact will be on the long term-trend.
See Tables Ext_02 and Ext_05 for trends in last year drug use.
Questions on khat have not been asked since the 2011 to 2012 survey, which showed that the proportion of adults using khat in the last year was 0.2%, the same level as in 2010 to 2011. A question on khat was reintroduced to the 2014/15 survey so future estimates will be available.
2.4 Last year use of legal emerging drugs
The 2013 to 2014 CSEW asked questions on the last year use of legal emerging drugs salvia and nitrous oxide (these questions were added to the CSEW for the first time in 2012 to 2013):
- 2.3% of adults aged 16 to 59 had taken nitrous oxide in the last year (similar to 2.0% in 2012 to 2013, i.e. not statistically significantly different)
- 0.5% of adults aged 16 to 59 had taken salvia in the last year (a statistically significant increase from 0.3% in 2012 to 2013) For young adults, aged 16 to 24:
- 7.6% had taken nitrous oxide in the last year (not statistically significantly different from 6.1% in 2012 to 2013)
- 1.8% had taken salvia in the last year (not statistically significantly different from 1.1% in 2012 to 2013)
2.5 Lifetime use of illicit drugs
Respondents are also asked about drugs they have ever used ever, but are considered to be a less reliable measure of current drug use than the last year drug use. Figures on lifetime drug use are also likely to be influenced by other factors, such as an ageing population (i.e. the longer people live, the more likely they are to have taken drugs). Therefore only headline figures on lifetime drug use are presented here. More detail is available in the Illicit drug use among adults tables.
According to the 2013 to 2014 CSEW:
- Around one-third (35.6%) of adults aged 16 to 59 said they had taken an illicit drug (excluding mephedrone) in their lifetime, which equates to around 11.2 million people. This is a similar level to recent years but an increase from 30.4% in 1996;
- The proportion of adults aged 16 to 24 having ever taken an illicit drug was similar to adults aged 16 to 59 (36.3%), equivalent to around 2.2 million young adults and at a similar level to recent years. However, unlike for adults aged 16 to 59, this is a statistically significant fall from 1996 (48.4% for 16 to 24 year-olds);
- 15.4% of all adults aged 16 to 59 and 12.9% of 16 to 24 year olds had taken a Class A drug in their lifetime. The trends in Class A drug use since 1996 for each age group follow similar patterns to use of any illicit drug;
- 12.9% of 16 to 24 year olds had taken a Class A drug in their lifetime (around 791,000 people). This was a decrease from 19.4% in 1996;
- For all adults aged 16 to 59, the drug most commonly reported as ever used was cannabis, with around three-in-ten (29.9%) adults reporting using this drug at some point during their lifetime. Around one-in-ten adults said that they had used amphetamines (11.0%), powder cocaine (9.4%), ecstasy (9.3%) or amyl nitrite (9.1%) in their lifetime;
- For young adults (aged 16 to 24), the drugs most widely used ever were cannabis (30.8%), powder cocaine (9.3%) and ecstasy (9.0%).
Section 2 notes: 1. The only exception was last year use of LSD which increased significantly for the 16 to 59 age group only between 2011 to 2012 and 2013 to 2014.
3. Frequency of illicit drug use in the last year
This section investigates levels of frequent drug use, defined as taking any illicit drug more than once a month on average in the last year, among adults aged 16 to 59 and among young adults aged 16 to 24 as measured by the 2013 to 2014 Crime Survey for England and Wales (CSEW). It also looks at those who took drugs on average once a month in the last year and those who said they had used drugs in the last year but less often than once a month.
The User Guide to Drug Misuse: Findings from the CSEW provides further details relating to illicit drug use measures.
3.1 Key facts
- The prevalence of frequent drug use has remained broadly similar over the last three years. In 2013 to 2014, 3.1% of adults aged 16 to 59 were defined as frequent drug users (having taken any illicit drug more than once a month on average in the last year), a slightly higher proportion than in 2012 to 2013 (2.8%) but similar to the 2011 to 2012 proportion (3.2%).
- Young adults were more likely to be frequent drug users than older people. The proportion of young adults aged 16 to 24 classed as frequent drug users (6.6%) was more than twice as high as the proportion of all adults aged 16 to 59 (3.1%) in 2013 to 2014 and represented a statistically significant increase compared with 2012 to 2013 (5.1%).
- There were differences in levels of frequent drug use among respondents with different personal, household and area characteristics. Levels of use of any illicit drug more than once a month on average in the last year were higher among men than women, among those who went to pubs or nightclubs more often and among those who lived in more deprived areas.
- Those who went to nightclubs or pubs more often were more likely to use drugs frequently. Levels of use of any illicit drug more than once a month on average in the last year were higher among those who went to nightclubs four or more times in the last month (10.9%) compared with 2.3% of respondents who had not visited a nightclub in the past month. A similar pattern was found among those visiting pubs more often.
- People living in deprived areas were more likely to be frequent drug users. A larger proportion (4.5%) of respondents who lived in more deprived areas were frequent drug users compared with those who lived in the least deprived areas (2.3%).
3.2 Data tables
Estimates of frequent drug use in the last year among adults from the 2013 to 2014 CSEW can be found in the Frequent drug use tables. Historical frequent drug use data can be found in the Extent and trends in illicit drug use tables.
3.3 Extent of frequent drug use
Estimates from the 2013 to 2014 CSEW show that 3.1% of adults aged 16 to 59 were defined as frequent drug users, i.e. those that have taken any illicit drug more than once a month on average in the last year. This was slightly higher than in 2012 to 2013 (2.8%), although the increase was not statistically significant, and is similar to the 2011 to 2012 proportion (3.2%).
Frequent drug users made up 40% of the adults who reported drug use within the last year, a similar proportion to the 2012 to 2013 survey (38%, data not shown). A small proportion (8%) of adults who reported using drugs in the last year said they had used drugs once a month on average, and the remaining 52% said they had used drugs in the last year but less often than once a month.
The proportion of all young adults (i.e. those aged 16 to 24) defined as frequent drug users was over twice as high (6.6%) as the proportion of frequent drug users among all adults aged 16 to 59 (3.1%). However, among young adults who reported taking any drug in the last year, two-fifths (40%) were defined as frequent drug users, the same proportion as among adults aged 16 to 59 who reported taking drugs last year (40%). Similarly to all adults, 7% of 16 to 24 year olds who had used drugs in the last year said they had used them once a month and 53% said they had used them less frequently than once a month.
As reported in the previous section (Extent and trends in illicit drug use among adults), cannabis was the most prevalent drug taken in the last year among adults aged 16 to 59 (6.6% had used cannabis in the last year) and among those aged 16 to 24 (15.1%). Of those 16 to 59 year olds who had used drugs in the previous year, 76% reported taking cannabis (80% among those aged 16 to 24).
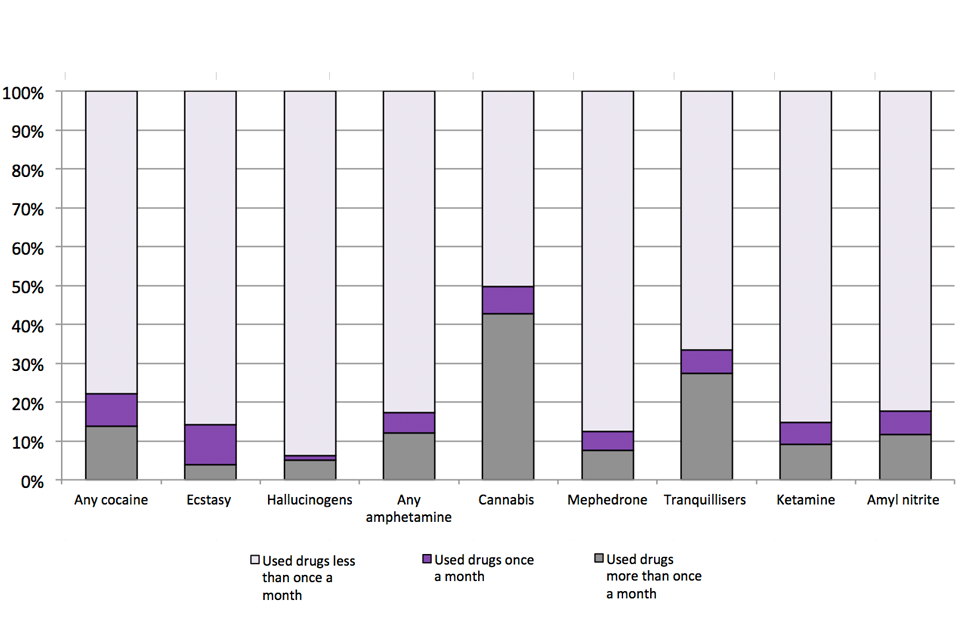
As shown in Figure 3.1, of those aged 16 to 59 reporting use of cannabis during the last year, 43% reported frequent use of this drug (i.e. they had taken it more than once a month on average in the last year). The equivalent proportion for young adults aged 16 to 24 was similar at 41%. Only 7% of adults aged 16 to 59 who had used cannabis in the last year, had used it just once a month. This figure was 6% among 16 to 24 year olds. In contrast, respondents were less likely to use class A drugs frequently – for example, only 14% of 16 to 59 year olds reporting using cocaine more often than once a month.
Figure 3.1: Proportion of users of each individual drug type who were frequent or less frequent users of that specific drug, 16 to 59 year olds, 2013 to 2014 Crime Survey for England and Wales
.
Chart notes
Source: Home Office, Illicit drug use among adults tables: Tables Ext_02 and Ext_05.
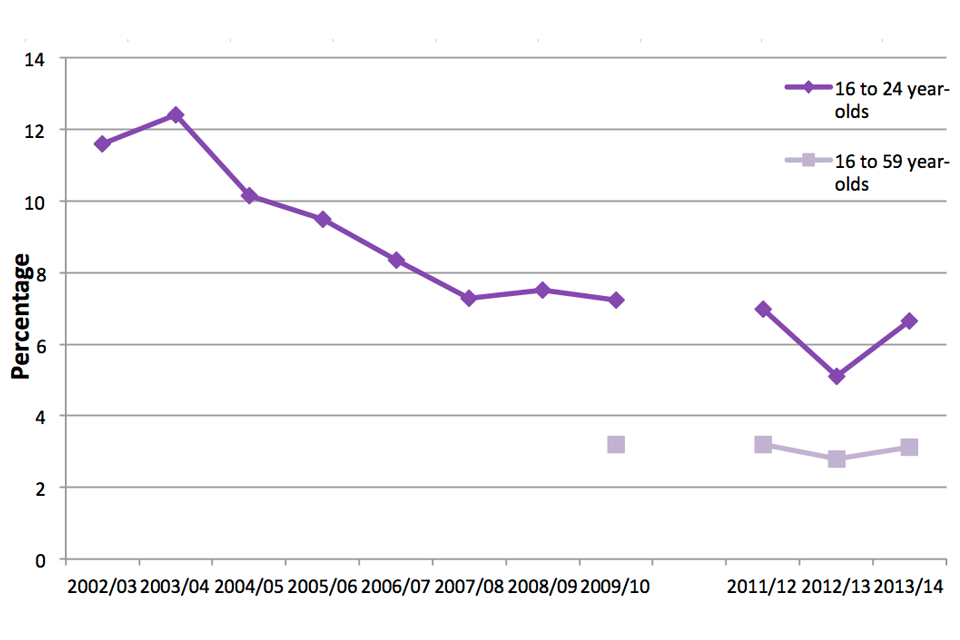
3.4 Trends in frequent drug use
There has been a decrease in frequent drug use among 16 to 24 year olds since measurement began in the 2002 to 2003 survey (from 11.6% to 6.6% of this population). As shown in Figure 3.2, there was a general downward trend between 2003 to 2004 (12.4%) and 2007 to 2008 (7.3%). The trend was broadly flat between 2007 to 2008 and 2011 to 2012, and following a fall in 2012 to 2013, returned to a similar level in 2013 to 2014. Questions on frequency of drug use in the last year were first completed by all adults aged 16 to 59 in the 2009 to 2010 survey and the proportion of frequent drug users in this age group has been relatively consistent at around 3%.
Figure 3.2: Proportion of 16 to 24 and 16 to 59 year olds classified as frequent drug users, 2002 to 2003 to 2013 to 2014, Crime Survey for England and Wales
.
Chart notes
Source: Home Office, Illicit drug use among adults tables: Tables Ext_02 and Ext_05. From 2012 to 2013 figures include frequent users of mephedrone only. However, these numbers are so small that excluding them from the 2012/13 and 2013 to 2014 figures does not change the proportions to one decimal place. Data for 2010 to 2011 are not available; see the Technical annex for more information.
3.5 Frequent drug use by selected personal, household and area characteristics
The proportion of frequent drug users varied by personal and area characteristics. For example:
- Levels of use of any illicit drug more than once a month on average in the last year were higher among men than women in 2013 to 2014. Men were three times as likely as women to report frequent drug use in the last year (4.8% and 1.5% respectively).
- Around 10.9% of respondents who had been to a nightclub four or more times in the last month were frequent drug users. This compares with 2.3% of respondents who had not visited a nightclub in the past month.
- Similarly, those who visited pubs more frequently were more likely to be frequent drug users (9.2% of those who had been to the pub nine times or more in the past month), compared with those who hadn’t visited a pub in the past month (2.4%).
- A larger proportion (4.5%) of respondents who lived in more deprived areas were frequent drug users compared with those who lived in the least deprived areas (2.3%).
- The likelihood of frequent drug use in the last month tended to decrease as household income rose; 6.2% of respondents with an annual household income of under £10,000 reported frequent drug use, decreasing to 1.5% of respondents with a total household income of £50,000 or more.
Similar relationships were also found for those who said they used drugs once a month and for those who said they used drugs in the last year but less often than once a month.
A full breakdown of drug use by personal, area and household characteristics appears in Frequent drug use tables F_03 and F_04.
4. Illicit drug use by personal, household and area characteristics and lifestyle factors
This section presents findings from the 2013 to 2014 Crime Survey for England and Wales (CSEW) on levels of illicit drug use over the last year by age, gender, frequency of nightclub and pub/wine bar visits, alcohol consumption and some area characteristics. Illicit drug use by additional personal, household and area characteristics are included in the Illicit drug use by demographics tables but are not commented on here.
The User Guide to Drug Misuse: Findings from the CSEW provides further details relating to illicit drug use measures and definitions.
4.1 Key facts
- Younger people are more likely to take drugs than older people. The level of any drug use in the last year was highest among 16 to 19 year olds (19.3%).The level of drug use was much lower in the oldest age group covered by this part of the survey (1.5% of 55 to 59 year olds).
- The average age of drug users has risen since 1996. The average age of people using an illicit drug in the last 12 months has increased from 26.6 years in 1996 to 29.3 years in 2013 to 2014. This age increase is also reflected in the change in the distribution of ages of drug users between these two survey years. It is also likely to reflect the ageing population in England and Wales.
- Men are more likely to take drugs than women. Around one-in-eight (11.8%) men had taken an illicit drug in the last year, according to the 2013 to 2014 CSEW, compared with 5.8% of women.
- People living in urban areas reported higher levels of drug use than those living in rural areas. Around a tenth (9.3%) of people living in urban areas had used any drug compared with 6.5% of those living in rural areas.
- Higher levels of drug use are associated with increased frequency of visits to pubs, bars and nightclubs. For example, use of any class A drug in the 12 months prior to interview was around 8 times higher among those who had visited a nightclub at least four times in the past month (17.1%) compared with those who had not visited a nightclub in the past month (2.0%). A similar pattern was found for those visiting pubs and bars more frequently.
4.2 Data tables
Estimates of last year illicit drug use by personal, household and area characteristics and lifestyle factors from the 2013 to 2014 CSEW, alongside long-term trends for certain characteristics, can be found in the Illicit drug use by demographics tables.
4.3 Extent and trends in illicit drug use by age group
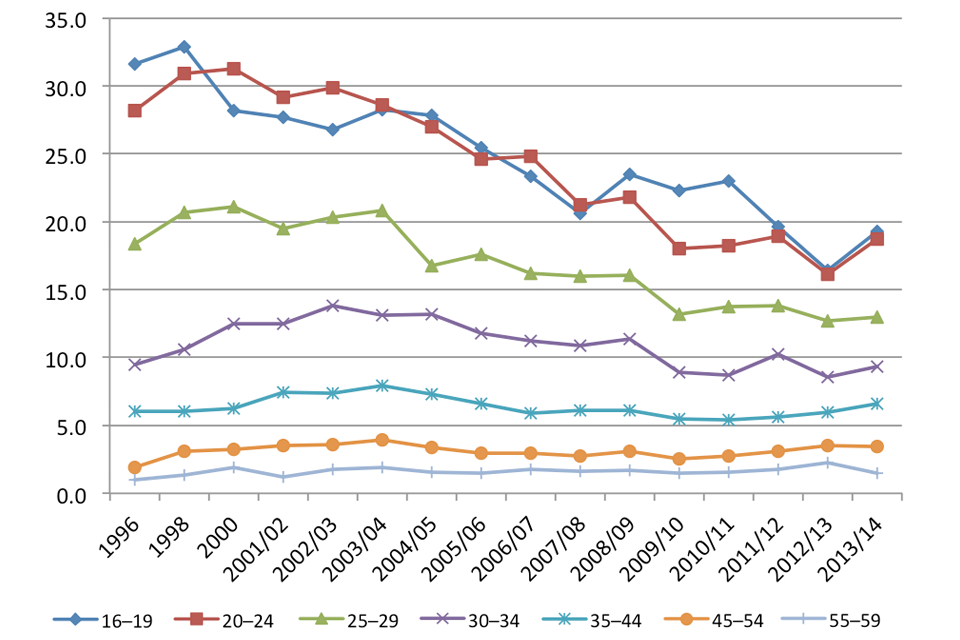
As shown in previous years, the level of any drug use in the last year was highest among the youngest age groups; 19.3% of 16 to 19 year olds and 18.7% of 20 to 24 year olds reported any drug use in the last year. Levels of illicit drug use then decreased as age increased, from 13.0% of those aged 25 to 29 to 1.5% of 55 to 59 year olds.
Figure 4.1: Proportion of 16 to 59 year olds reporting use of any drug in the last year, by age group, 1996 to 2013 to 2014, Crime Survey for England and Wales
.
Chart notes
Source: Home Office, Illicit drug use by demographics tables: Table D_03.
Between the 1996 and 2013 to 2014 CSEW last year use of any illicit drug fell overall, due in large part to the declines in illicit drug use among 16 to 24 year olds (as shown in Figure 4.1) for the most prevalent drug types (cannabis, ecstasy, amphetamines and hallucinogens). Over the same period, there have been increases in any drug use among 45 to 54 year olds (from 1.9% to 3.5%). These have primarily been driven by increases in the use of cannabis, although use of this drug among these age groups is still relatively low compared to younger age groups. Compared with estimates from the 2012 to 2013 CSEW, it appears any drug use in the last year has increased among those aged under 45 years. However, none of the changes in any drug use for those aged 44 years and below were statistically significant.
Class A drug use was highest among 20 to 29 year olds with 7.7% of 20 to 24 year olds and 5.9% of 25 to 29 year olds reporting use of these types of drugs in the last year. The overall use of Class A drugs has remained largely stable since 1996, peaking in 2008 to 2009 at 3.6%, and falling to 3.1% in 2013 to 2014.
Age profile of last year drug users
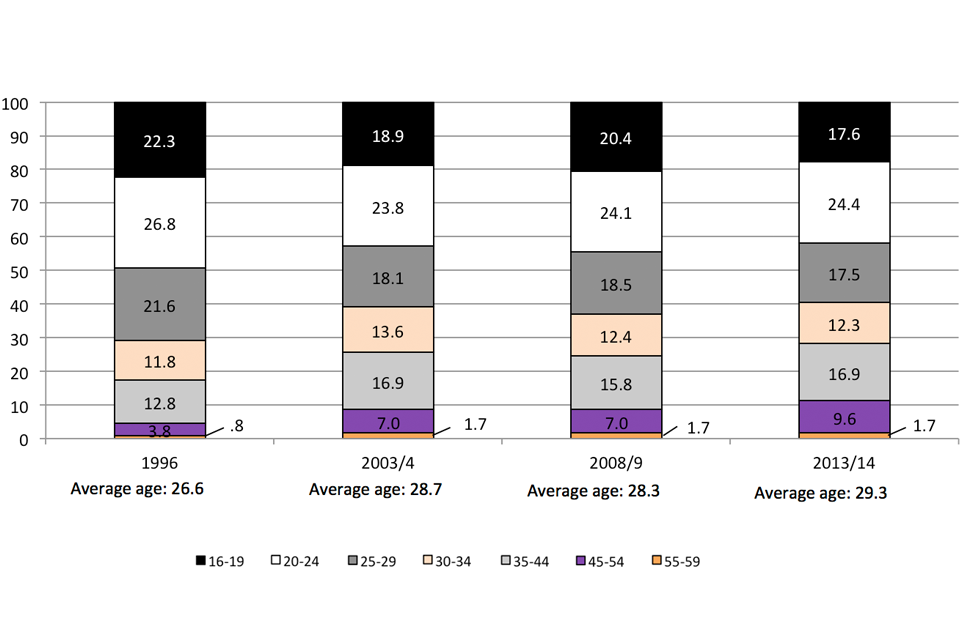
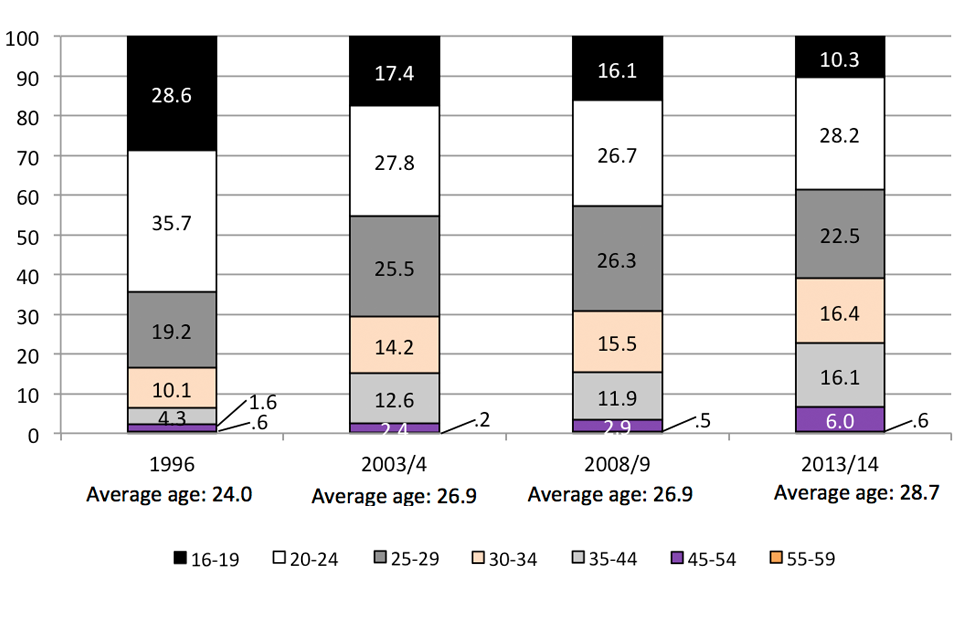
The average age of people using an illicit drug in the last 12 months has increased from 26.6 years in 1996 to 29.3 years in 2013 to 2014. This age increase is also reflected in the change in the distribution of ages of drug users between these two survey years, as shown in Figure 4.2.
The proportion of last year drugs users aged 16 to 24 has fallen from 49.2% in 1996 to 42.0% in 2013 to 2014, as shown in Figure 3.2. Conversely, the proportion of drug users aged 45 to 59 has increased from 4.6% in 1996 to 11.3% in 2013 to 2014.
This is likely to be due to a number of factors, including the 1996 population of drug users ageing and continuing to use drugs, relatively fewer new young users taking up drugs, increased take up of drugs by older people than in 1996, or a combination of these.
Figure 4.2: Age breakdown of people who had used any illicit drug in the last 12 months, for selected survey years, Crime Survey for England and Wales
.
Chart notes
Source: Home Office, Illicit drug use by demographics tables: Table D_11a.
A similar, but more pronounced, pattern is also shown in the age profile of class A drugs users in Figure 4.3. The proportions of drug users in the youngest age groups have decreased between 1996 and 2013 to 2014, while the proportions in age groups between 25 and 54 have increased over the same period.
The average age of people using class A drugs increased from 24 years in 1996 to 28.7 years in 2013 to 2014. Although class A drug users are younger on average than users of any illicit drug, the gap in average age appears to be closing (e.g. in 1996 there was a 2.6 year difference between average age of any illicit drug users compared with any class A drug users; in 2013 to 2014 this fell to 0.6 years difference between average age of any illicit drug users compared with any class A drug users).
Figure 4.3: Age breakdown of people who had used any class A drug in the last 12 months, for selected survey years, Crime Survey for England and Wales
.
Chart notes
Source: Home Office, Illicit drug use by demographics tables: Table D_11b.
4.4 Extent and trends in illicit drug use by gender
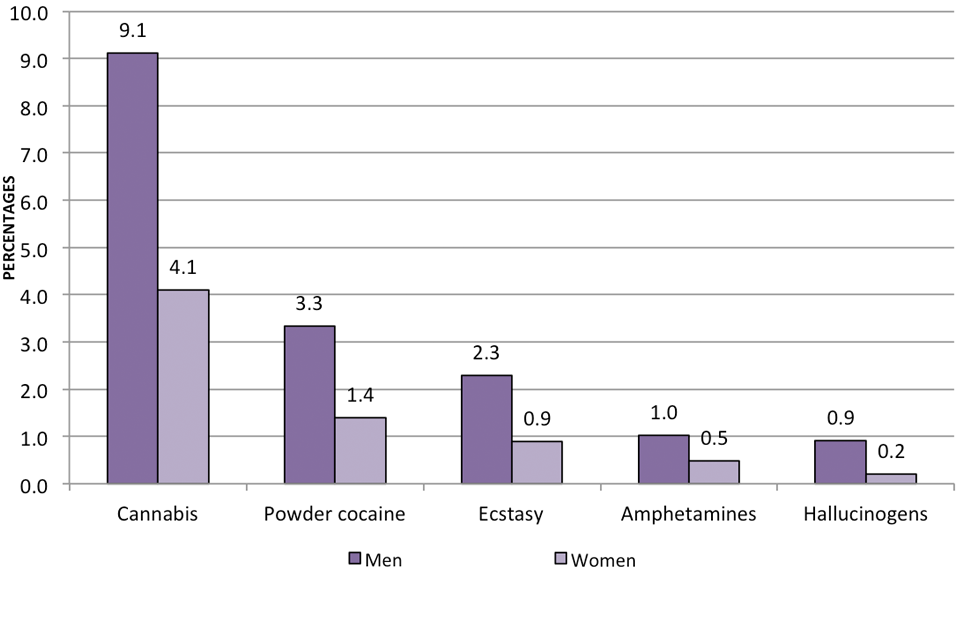
Levels of illicit drug use during the last year were higher among men than women in 2013 to 2014, a pattern that has been seen since 1996. Around one-in-eight (11.8%) men had taken an illicit drug in the last year, compared with around one-in-seventeen women (5.8%). According to the 2013 to 2014 survey, men were more than twice as likely to report use of cannabis in the last year as women (9.1% of men had used cannabis in the last year, compared with 4.1% of women), as well as powder cocaine and ecstasy among other drugs, as shown in Figure 4.4.
Figure 4.4: Proportion of 16 to 59 year olds reporting use of selected drugs in the last year by gender, 2013 to 2014 Crime Survey for England and Wales
.
Chart notes
Source: Home Office, Illicit drug use by demographics tables: Table D_03.
In 2013 to 2014, the use of any Class A drug in the last year increased among men compared with 2012/13 (from 3.6% to 4.4%), and was driven by increased powder cocaine use (usage prevalence of this drug increased from 2.7% to 3.3% of men). Over the longer term, between 1996 and 2013 to 2014, there have been falls in use of hallucinogens, amphetamines, cannabis and any drug, but an increase in the use of powder cocaine, among both men and women.
4.5 Extent and trends in illicit drug use by lifestyle factors
Illicit drug use varied by lifestyle factors such as frequency of nightclub visits, pub/wine bar visits and alcohol consumption.
As shown in previous years, levels of drug use in the last year increased with the frequency of nightclub visits and pub/wine bar visits. For example, in 2013 to 2014, among adults aged 16 to 59:
- Use of any class A drug in the 12 months prior to interview was around 8 times higher among those who had visited a nightclub at least four times in the past month (17.1%) compared with those who had not visited a nightclub in the past month (2.0%);
- This was driven by last year use of ecstasy, which was around 15 times higher among those who had visited a nightclub at least four times in the past month (11.9%) compared with those who had not visited a nightclub in the past month (0.8%);
- Similarly, powder cocaine use was around 13 times higher among those who had visited a pub or bar at least nine times in the last month (11.4%) than those who had not visited a pub or bar at all in the last month (0.8%).
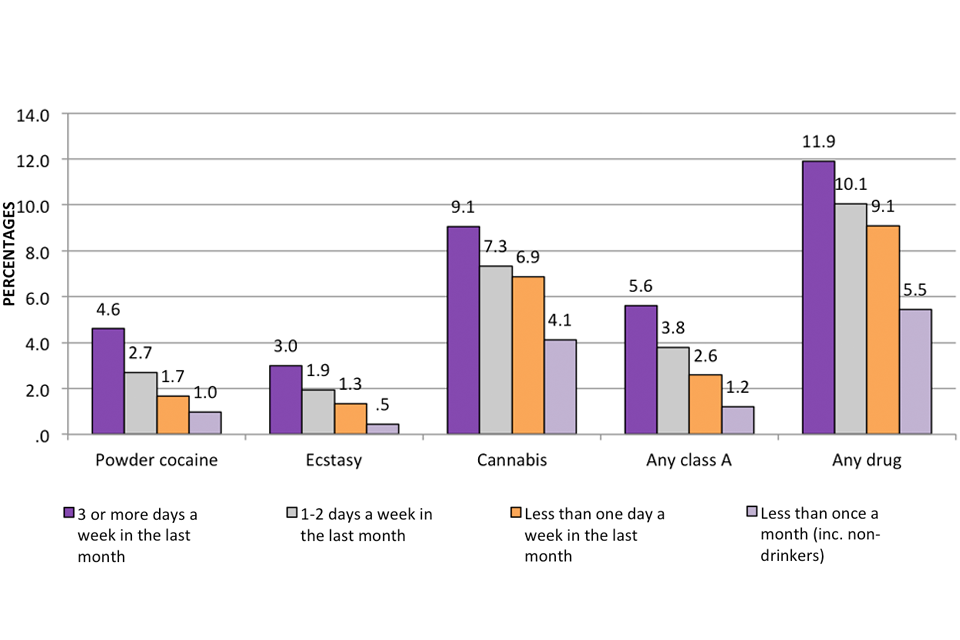
As shown in Figure 4.5, in 2013/14, as frequency of alcohol consumption increased, so did last year drug use. Adults aged 16 to 59 who reported drinking alcohol three or more days per week in the last month were around twice as likely to have used any illicit drug (11.9%) and four times more likely to have used a Class A drug (5.6%) in the last year than those who reported drinking less than once a month (including non-drinkers) (5.5% for any drug and 1.2% for any Class A drug).
Figure 4.5: Proportion of 16 to 59 year olds reporting use of individual drugs in the last year by frequency of alcohol consumption, 2013 to 2014 Crime Survey for England and Wales
.
Chart notes
Source: Home Office, Illicit drug use by demographics tables: Table D_01.
4.6 Extent and trends in illicit drug use by area characteristics
In the 2013 to 2014 CSEW, levels of any drug use in the last year varied by area characteristics. For example:
- Use of any drug, any Class A drug and any stimulant drug, was higher among those living in urban areas compared with those living in rural areas. For example, 9.3% of people living in urban areas had used any drug compared with 6.5% of those living in rural areas.
- There was variation in drug use by Output Area Classification. Those living in areas classified as ‘City living’, ‘Multicultural’ or ‘Constrained by circumstances’ were more likely to have used any drug (14.7%, 10.8% and 10.5% respectively) than those living in other types of areas (e.g. 5.6% of those living in ‘Countryside’ areas). Use of any Class A drug was higher among those living in ‘City living’ (6.5%) and ‘Multicultural’ (4.7%) areas compared to other types, such as ‘Countryside’ areas (1.2%).
- Use of any drug was almost twice as high among those living in flats, maisonettes or bedsits (13.6%) compared with those living in a house (7.9%).
5. Estimates of illicit drug use by ethnicity and sexual orientation
This section presents findings on levels of illicit drug use of 16 to 59 year olds by ethnicity and sexual orientation. The commentary for the analysis focuses on last year drug use of any drug (excluding mephedrone) as this is the best indicator available to measure patterns of recent drug use.
Typically, around one-in ten respondents who completed the self-completion module in each year identified themselves as being from a background other than White.
Estimates of illicit drug use are routinely broken down by a high level ethnic group classification. However, in order to provide estimates of drug use among more specific minority ethnic groups, the findings presented in this chapter use combined data from the 2011 to 2012, 2012 to 2013 and 2013 to 2014 CSEWs (the ‘combined dataset’). The resulting larger sample size means it is possible to provide estimates of drug use for a more detailed breakdown of ethnic groups than would be possible using one year’s worth of survey data.
Similar analysis was last carried out on a combined dataset based on the 2006 to 2007, 2007 to 2008 and 2008 to 2009 surveys and was published in Drug Misuse Declared: Findings from the 2009/10 British Crime Survey.
Estimates of use of illicit drugs ever, along with estimates of last year use, are available by ethnic group in the Illicit drug use among adults by ethnicity and sexual orientation tables.
The self-completion module of the CSEW, which covers more sensitive topics such as illicit drug use, also includes an additional question asking respondents about their sexual orientation. A relatively small proportion (around 3%) of self-completion module respondents in each year identified themselves as gay, lesbian or bisexual. Therefore, similarly to estimates for ethnicity, the findings presented in this chapter use combined data from the 2011 to 2012, 2012 to 2013 and 2013 to 2014 CSEW in order to provide more robust estimates of use of individual drugs by sexual orientation broken down by gender. Figures and commentary are based on analysis of respondents’ drug use in the last year.
Similar analysis was last carried out on a combined 2007/08 and 2008/09 dataset and published in Drug Misuse Declared: Findings from the 2009 to 2010 British Crime Survey.
The User Guide to Drug Misuse: Findings from the CSEW provides further details relating to illicit drug use measures and definitions, and the Technical annex gives more detail on the three-year combined dataset.
5.1 Key facts
- Adults from mixed ethnic backgrounds were the most likely to have taken any illicit drug in the last year compared with adults from other ethnic groups. Adults from Asian or Asian British ethnic backgrounds generally had the lowest levels of last year drug use.
- Last year cannabis use was highest among adults from a mixed ethnic background than for adults from other ethnic groups. The overall mixed ethnic group had a higher prevalence of last year cannabis use than any other group (13.8%), for example when compared with adults from a white background (7.0% overall).
- Gay or bisexual adults were more likely to have taken any illicit drug in the last year than heterosexual adults. In particular, gay or bisexual men were the group most likely to have taken any illicit drug in the last year (33.0% had taken drugs in the last year), with higher levels of illicit drug use than gay or bisexual women (22.9%) and heterosexual men (11.1%).
5.2 Data tables
Estimates of drug use by ethnicity and sexual orientation based on the combined dataset (2011 to 2012, 2012 to 2013 and 2013 to 2014 CSEW) can be found in the Ethnicity and sexual orientation tables.
5.3 Estimates of illicit drug use by ethnicity
Illicit drug use by ethnicity
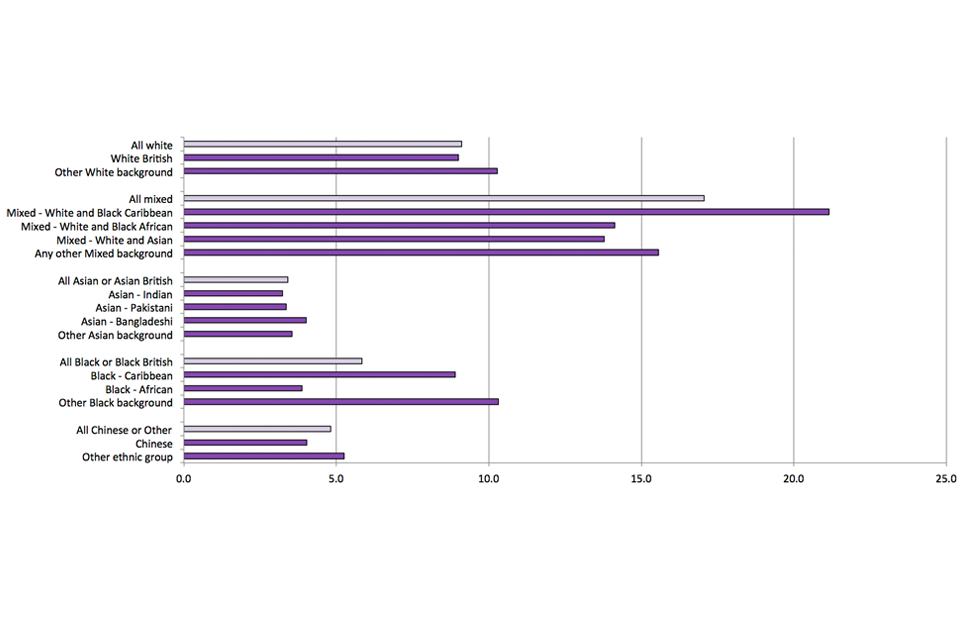
Overall, those from mixed ethnic backgrounds generally had the highest level of any drug use in the last year (17.1% of this group had taken drugs in the last year), compared with other ethnic groups. Within the mixed ethnic group, the general pattern was that adults from mixed-white/black Caribbean backgrounds had the highest level of drug use, although compared with other mixed ethnic groups the differences were not statistically significant (likely due to the small number of respondents in each group).
Proportions taking drugs within the more specific mixed ethnic groups ranged between 13.8% and 21.2% (as shown in Figure 4.1). Adults identifying as mixed-white/black Caribbean had statistically significantly higher levels of drug use than any other non-mixed ethnic groups (21.2%, compared with, for example, white-British, 9.0%).
Figure 5.1: Illicit drug use in the last year among adults, by ethnic group, 2011 to 2012 to 2013 to 2014 combined CSEW dataset
.
Chart notes
Source: Home Office, Illicit drug use among adults by ethnicity and sexual orientation tables: Table Eth_01.
As these results are taken from the combined dataset, these will not match the figures presented in the Illicit drug use by personal, household and area characteristics and lifestyle factors section.
Mixed ethnic groups also had the highest levels of Class A drug use in the last year. The most prevalent drug among each of the ethnic groups was cannabis. The overall mixed ethnic group had a higher prevalence of last year cannabis use than any other group (13.8% overall, ranging from 8.9% for mixed-white/black African to 16.0% mixed-white/black Caribbean), for example when compared with adults from a white background (7.0% overall).
Adults from the Asian or Asian British and Chinese or other ethnic groups generally had the lowest levels of last year drug use. Levels were similar among those identifying as Asian-Indian (3.2%), Asian-Pakistani (3.4%), Asian-Bangladeshi (4.0%) and Chinese (4.0%).
Within black or black British backgrounds, those from a black-Caribbean background had higher levels of cannabis and any drug use in the last year (8.0% and 8.9% respectively) than adults with a black-African background (2.8% and 3.9% respectively).
Illicit drug use by ethnicity and gender
Overall prevalence of drug use among men in the general population is around twice as high as for women (see Illicit drug use by personal, household and area characteristics and lifestyle factors section). Similarly, for all ethnic backgrounds the difference in drug use between men and women was statistically significant except in the Indian, Pakistani, Bangladeshi, Chinese and black African groups (see Figure 4.2).
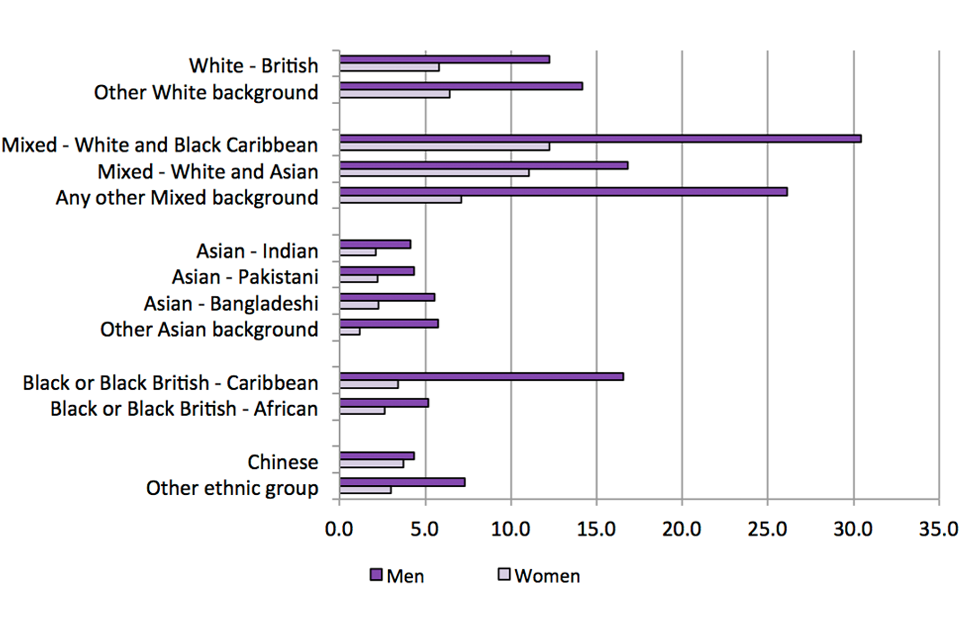
Figure 5.2: Illicit drug use in the last year among adults, by ethnic group and gender, 2011 to 2012 to 2013 to 2014 combined CSEW dataset
.
Chart notes
Source: Home Office, Illicit drug use among adults by ethnicity and sexual orientation tables: Table Eth_01. Note: due do small sample sizes it is not possible to show figures for men within ‘Mixed – white/black African’ and ‘Other black background’.
As white British adults made up the vast majority of respondents, it is unsurprising that levels of last year use of any illicit drug for white British men (12.3%) were around twice as high as for white British women (5.8%), i.e. similar to the whole population.
Levels were also around twice as high for men than for women in the overall ‘mixed’ (24.5% of men, 10.4% of women) and ‘Asian or Asian British’ (4.6% of men, 2.0% of women) groups, and within these high-level groups, men from ‘any other mixed’ background had four times (26.1% men, 7.1% women) and ‘other Asian’ backgrounds five times (5.8% men, 1.2% women) the levels for women of the same ethnic background.
‘Black or black British’ men had around three times the level of last year drug use as women from the same ethnic background (9.0% men, 3.2% women) and in particular black Caribbean men had around five-times the last year drug use as black Caribbean women (16.5% men, 3.4% women).
Illicit drug use by ethnicity, standardised by age
Levels of illicit drug use are known to be higher among younger adults, so the age profile of the different ethnic groups is likely to affect drug use estimates for adults within those groups (see Illicit drug use among adults by ethnicity and sexual orientation tables: Table Eth_07). The higher level of drug use among adults from a mixed ethnic group may reflect the younger age profile of these individuals. To illustrate, around half (53%) of the high-level mixed ethnic group were aged between 16 and 29 (mean age 31.1), whereas in the general population the proportion of adults aged 16 to 29 was lower at around one third (31%) (mean age 37.5).
‘Age-standardisation’ can be used to adjust rates and take into account the age profile of the ethnic groups (see Technical annex for more detail). Standardising the drug use rates in this way means that many of the differences observed between groups disappear, which suggests that age, not ethnicity, is the key driver of differences between groups.
As with the non-standardised analysis, the age-standardised level of last year drug use in mixed ethnic backgrounds remained higher than in other high-level groups (white; black or black British; Asian or Asian British; Chinese or Other). However, the difference between mixed and other groups was not as large, in particular when compared with white backgrounds which had the second highest rate.
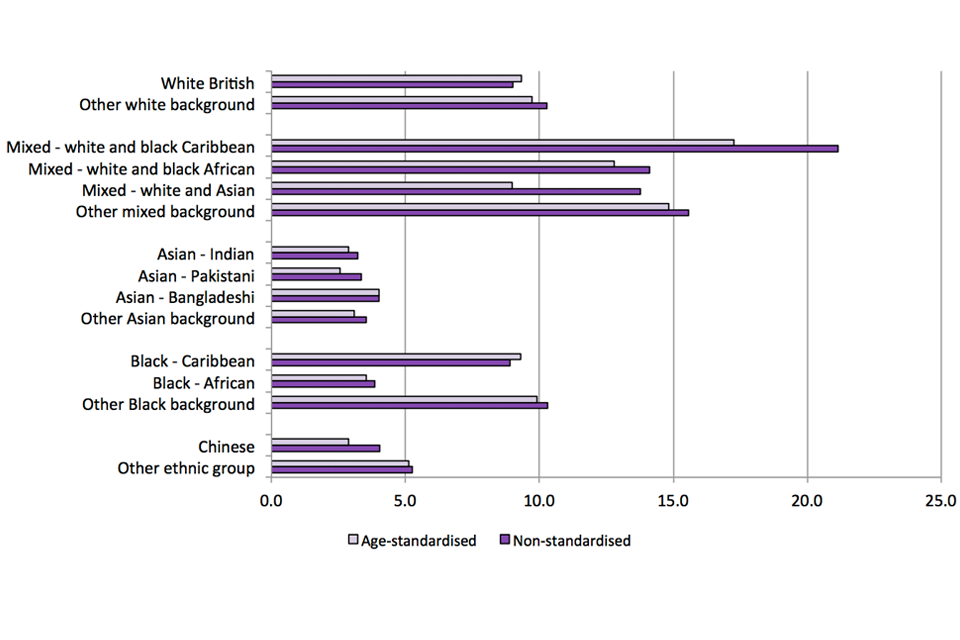
Looking at the more detailed mixed backgrounds (see Figure 5.3), the overall age-standardised picture was again similar to the non-standardised analysis. The higher level of drug use among the mixed-white/black Caribbean group remains evident, although as with the non-standardised analysis this was not statistically significantly different from the mixed-white/black African or ‘any other mixed’ ethnic groups. Standardising the drug use rates in this way means that many of the differences observed between groups disappear, which suggests that age, not ethnicity, is the key driver of differences between groups.
Figure 5.3: Age-standardised and non-standardised illicit drug use in the last year among adults, by ethnic group, 2011 to 2012 to 2013 to 2014 combined CSEW dataset
.
Chart notes
Source: Home Office, Illicit drug use among adults by ethnicity and sexual orientation tables: Table Eth_07.
5.4 Estimates of illicit drug use by sexual orientation
Of the respondents in the combined dataset, 97% reported that they were heterosexual; 2% gay or lesbian and 1% bisexual. Analysis presented here combines adults who identified as being gay or lesbian with those who were bisexual, i.e. 3% of the respondents in total.
Illicit drug use by sexual orientation
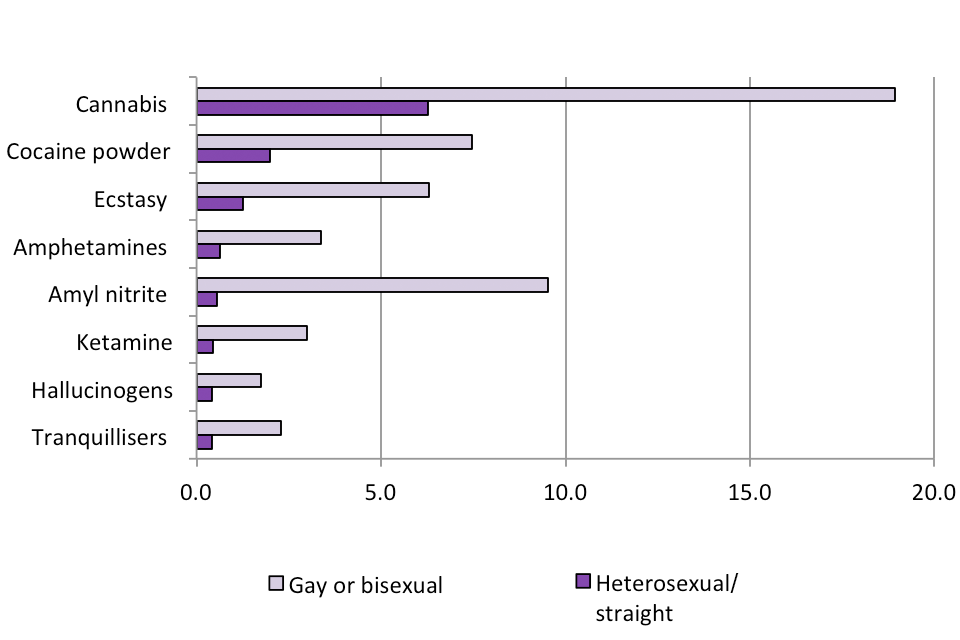
Overall, gay or bisexual adults were more likely to have taken illicit drugs in the last year (28.4% had taken drugs in the last year) compared with heterosexual adults (8.1%). This higher prevalence of last year drug use among gay or bisexual adults was also true for any Class A drug (10.0% for gay or bisexual adults compared with 2.7% of heterosexual adults) and across most drug types: powder cocaine, ecstasy, hallucinogens, amphetamines, methamphetamine, cannabis, tranquilisers, ketamine and amyl nitrite (see Figure 5.4).
Figure 5.4: Illicit drug use in the last year among adults, by drug type and sexual orientation, 2011 to 2012 to 2013 to 2014 combined CSEW dataset
.
Chart notes
Note: Drugs shown are those that had been taken by at least 0.5% of the general population in the last year. Source: Home Office, Illicit drug use among adults by ethnicity and sexual orientation tables: Table Sex_Pref_01.
Illicit drug use by sexual orientation and gender
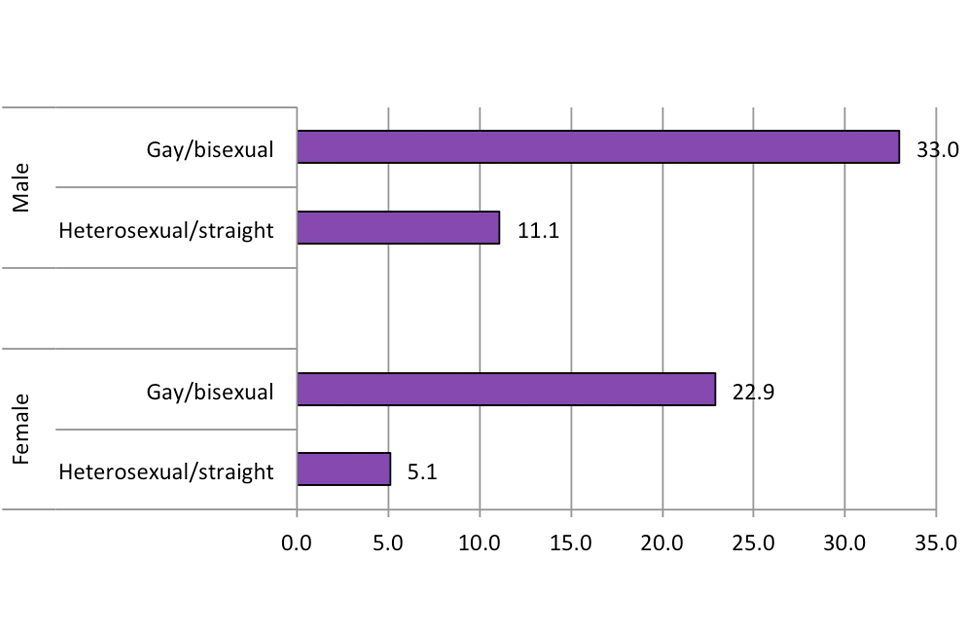
As shown in Figure 5.5, the higher drug use prevalence among gay/bisexual adults also remained when making comparisons within gender.
Figure 5.5: Use of any illicit drug in the last year among adults, by sexual orientation and gender, 2011 to 2012 to 2013 to 2014 combined CSEW dataset
.
Chart notes
Source: Home Office, Illicit drug use among adults by ethnicity and sexual orientation tables: Table Sex_Pref_01.
One-third (33.0%) of gay/bisexual men had used drugs in the last year, which was around three times higher than the proportion of last year drug use by heterosexual men (11.1%). This reflects higher levels of use of the majority of individual drugs asked about, i.e. powder cocaine, ecstasy, amphetamines, methamphetamine, cannabis, tranquilisers, ketamine and amyl nitrite. The greatest difference was detected in the use of amyl nitrite in the last year by gay or bisexual men compared with heterosexual men (14.7% and 0.8% respectively).
Last year use of any drug among gay/bisexual women was around four times higher than for heterosexual women (22.9% and 5.1% respectively). Far higher levels of last year cannabis use among gay or bisexual women (17.5% compared with 3.8%) explained much of this difference, however last year prevalence of powder cocaine, ecstasy, hallucinogens, amphetamines, tranquilisers, ketamine and amyl nitrite were also higher among gay/bisexual females than heterosexual females.
Illicit drug use – comparison of gay/bisexual men with gay/bisexual women
Overall prevalence of drug use among men in the general population is around twice as high as for women (see Demographics section) and, as mentioned above, 97% of respondents reported that they were heterosexual. It is therefore not surprising that heterosexual men had higher levels of last year drug use than heterosexual women for all drug types asked about.
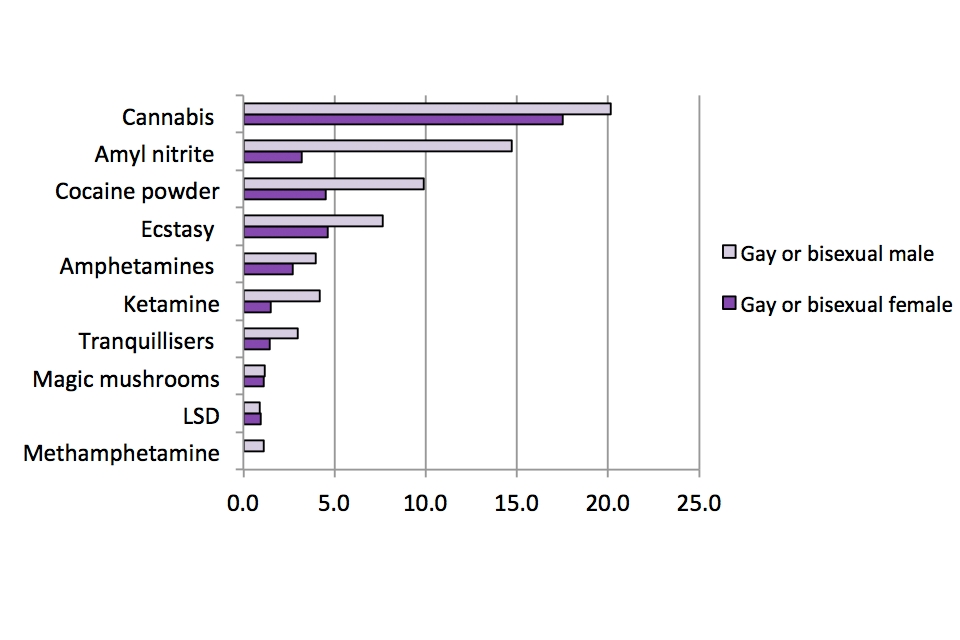
Similarly, gay/bisexual men reported overall higher levels of last year drug use than gay/bisexual women for both any illicit drug and any Class A drug (33.0% and 12.3% for men compared with 22.9% and 7.2% for women). Also, levels of amyl nitrite use in the last year were around five-times greater for gay or bisexual men (14.7%) than for gay or bisexual women (3.2%). However, there was more similarity in levels of use of certain drugs when comparing genders (see Figure 5.6). For example, a similar proportion of gay or bisexual men (20.1%) and gay or bisexual women (17.5%) had used cannabis in the last year (see Figure 5.6).
Figure 5.6: Illicit drug use in the last year among gay or bisexual adults, by drug type and gender, 2011 to 2012 to 2013 to 2014 combined CSEW dataset
.
Chart notes
Note: Drugs shown are those that had been taken by at least 0.5% of the gay or bisexual population in the last year Source: Home Office, Illicit drug use among adults by ethnicity and sexual orientation tables: Table Sex_Pref_01.
Compared with gay or bisexual women, gay or bisexual men had statistically significantly higher levels of last year use of the following illicit drugs:
- amyl nitrite (gay/bisexual men: 14.7%, gay/bisexual women: 3.2%),
- cocaine powder (gay/bisexual men: 9.9%, gay/bisexual women: 4.5%),
- ecstasy (gay/bisexual men: 7.7%, gay/bisexual women: 4.6%)
- ketamine (gay/bisexual men: 4.2%, gay/bisexual women: 1.5%).
Additionally, no gay or bisexual women said that they had taken methamphetamine, (gay/bisexual men: 1.1%), crack cocaine (gay/bisexual men: 0.8%), or anabolic steroids (gay/bisexual men: 0.8%).
Illicit drug use by sexual orientation, standardised by age (within gender)
The higher level of illicit drug use among gay/bisexual adults in general may be due, at least in part, to the younger age profile of individuals identifying themselves as in this group. Around one third (31%) of the heterosexual population (mean age 37.6) is aged between 16 and 29; the equivalent proportion of those identifying themselves as gay or bisexual (mean age 33.0) is almost half (46%).
Additionally, 55% of gay/bisexual respondents were male compared to 50% of the heterosexual population. As levels of illicit drug use are known to be higher among younger adults, and also among men (see Demographics section), the higher levels of drug use among gay or bisexual adults may be explained, at least in part, by the age and sex profile of this group.
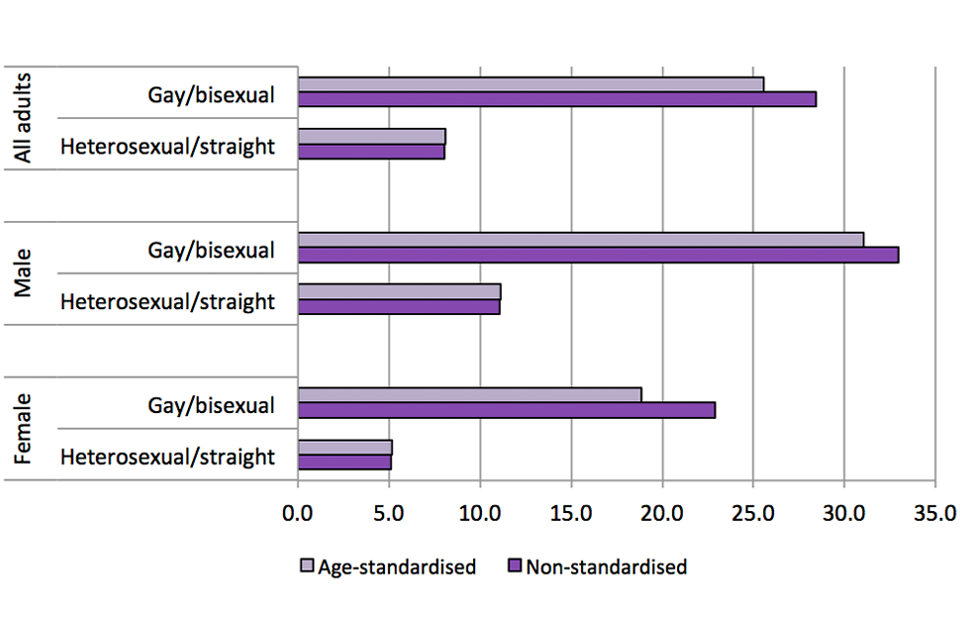
Age-standardisation was used to adjust rates within sexual orientation and gender groups to take into account the younger age profile of gay or bisexual adults and see whether sexual orientation was the key driver of differences between groups (see the Technical annex for further details). However, age-standardising the drug use rates shows that the variations observed between heterosexual and gay or bisexual adults remain after controlling for the differing age and gender distributions, indicating that levels of drug use are relatively higher among gay or bisexual adults than heterosexual adults (see Figure 5.7).
Figure 5.7: Age-standardised and non-standardised use of any illicit drug in the last year among adults, by sexual orientation and gender, 2011 to 2012, 2013 to 2014 combined CSEW dataset
.
Chart notes
Source: Home Office, Illicit drug use among adults by ethnicity and sexual orientation tables: Table Sex_Pref_01.
The differences in level of drug use between heterosexual and gay/bisexual men and heterosexual and gay/bisexual women were still apparent when standardised for age (see Technical annex for details on age-standardisation).
However, the difference in age profile between heterosexual and gay/bisexual women was more pronounced than the difference between heterosexual and gay/bisexual men (31% of heterosexual females are aged between 16 and 29, whereas 51% of gay/bisexual females are in the same age bracket). This means that age-standardisation had a greater effect for gay/bisexual women than gay/bisexual men, so once estimates of last year drug use are standardised by age the differences between heterosexual and gay/bisexual adults were less pronounced for women than for men.
6. Annex: Accessibility of drugs
Findings presented here are from the 2013/14 Crime Survey for England and Wales (CSEW) on the source from which the most recent drugs taken were obtained, the location where they were obtained (i.e. where the drugs were bought by, or given to, the individual) and the location where they were subsequently taken.
These findings are similar to those reported in Drug misuse: findings from the 2012 to 2013 CSEW, and so this section has not been included as a full chapter. Full accessibility statistics for selected personal and area characteristics from the 2013 to 2014 CSEW can be found in the Accessibility of drugs tables.
The analysis is based only on those adults aged 16 to 59 who said they had taken drugs in the 12 months previous to interview. The results in this section will be heavily influenced by use of cannabis, as this was the most prevalent drug used in the last year (see ‘Extent and trends in illicit drug use among adults’ section). It was not possible to carry out separate analysis by drug type.
6.1 Key facts
- Last year drug users most commonly sourced their drugs from someone well known to them. Over half (57%) of adults aged 16 to 59 who had taken drugs in the last 12 months said that the last drugs they had used were obtained from someone well known to them who was not a family member, for example a friend, work colleague or neighbour. Just under a quarter (22%) had obtained their drugs from a dealer, while just 4% had obtained their drugs from a family member.
- A very small proportion of drugs were sourced from the Internet. Only 1% of adults who had used drugs in the last 12 months sourced the last drugs they took from the Internet.
- Drugs were mostly sourced from a domestic setting. Just over a half (51%) of adults (who had used drugs in the last 12 months) were in a domestic setting when they obtained the last drugs they took, i.e. their own home or someone else’s home. The remaining half had obtained them at other locations in roughly equal proportions, namely at a bar or pub (10%), at a club, party or rave (11%), on the street/in a park/outdoor area (14%) or somewhere else (14%).
- The majority of last year drug users took drugs in a domestic setting. Almost two-thirds of adults (62%) had been in a domestic setting (i.e. at their home or someone else’s home) the last time they took drugs. Almost a quarter (23%) took the drugs at a pub, bar, club, party or rave (i.e. typically late night venues), while 6% took them in an outside location (e.g. the street, park or other outdoor area).
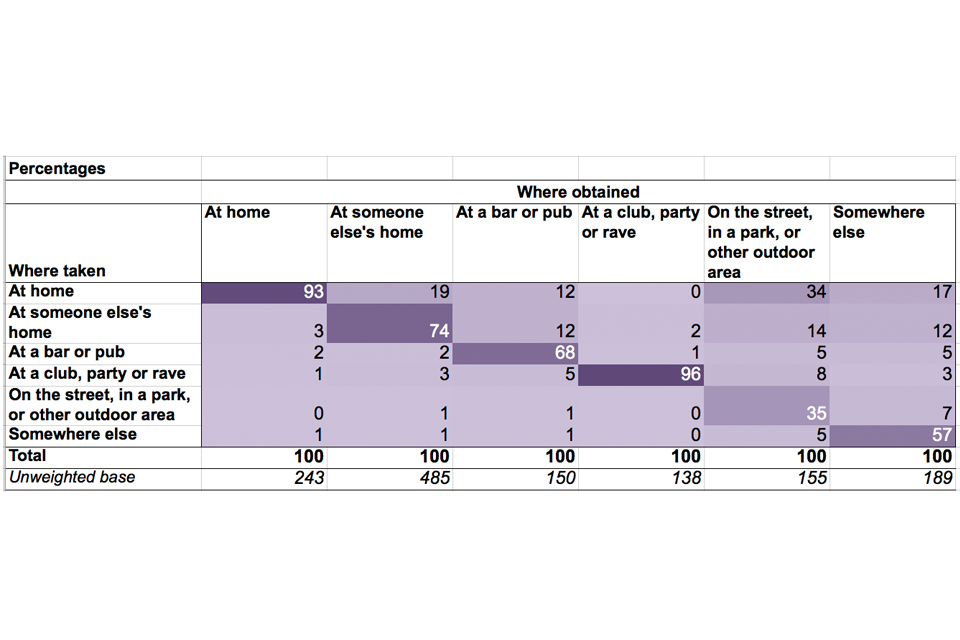
- Last year drug users were most likely to take drugs in the same location as they obtained them. As shown in Figure A1, of those adults who obtained the drugs they last took at home, 93% took the drugs at home as well. This is true of most locations, in particular at a club, party or rave (96%), with the exception of those who obtained their drugs in an outside location. Although 35% of these adults also took the drugs in an outside location, just over a third (34%) took them at home instead.
Figure A1: Where drugs were taken by where they were obtained the last time they were taken, 2013 to 2014 CSEW
.
Table notes
Source: Home Office, Accessibility of drugs tables: Table A_04.
7. Technical annex
The Technical annex of the full report contains details of:
- Data quality and interpreting the figures
- Re-weighting the CSEW
- Other data sources