Death in people aged 75 years and older in England in 2017
Published 14 June 2019

© Crown copyright 2019
This publication is licensed under the terms of the Open Government Licence v3.0 except where otherwise stated. To view this licence, visit nationalarchives.gov.uk/doc/open-government-licence/version/3 or write to the Information Policy Team, The National Archives, Kew, London TW9 4DU, or email: psi@nationalarchives.gov.uk.
Where we have identified any third party copyright information you will need to obtain permission from the copyright holders concerned.
This publication is available at https://www.gov.uk/government/publications/death-in-people-aged-75-years-and-older-in-england-in-2017/death-in-people-aged-75-years-and-older-in-england-in-2017
Approximately half a million people die in England each year, two-thirds of whom are aged 75 years of age and older. Life expectancy has risen over the past 25 years, and as such, the fraction of people aged 75 years and older has risen and is projected to continue to rise.
As a result, the number of deaths in this age group is rising at an accelerated rate. The population of England is ageing, and this has important implications for the provision of end of life care, which the NHS intends to personalise and improve in the coming years, according to policy set out in the NHS Long Term Plan.
This report aims to consider differences in the causes of death and places of death amongst people aged 75 years and older in England in 2017 and examines how these differences have changed over the past decade. The influence of factors such as age, sex and socioeconomic deprivation on cause and place of death are investigated.
1. Main findings
Amongst deaths in people aged 75 years and older in England in 2017:
- a third of deaths were amongst people aged 90 years and older
- dementia was a contributory or underlying cause in a quarter of deaths
- the proportion of deaths where cancer or liver disease was the underlying cause has risen since 2007, but the proportion of deaths from chronic heart disease and stroke has fallen
- the most common places of death varied by cause of death
- single, widowed or divorced people died in care homes far more frequently than people who were married or in a civil partnership
- people from more deprived areas died at younger ages than people from less deprived areas, were less likely to die at home, in hospices, and in care homes, and were more likely to die in hospital
2. Population and deaths amongst people aged 75 years and older in England
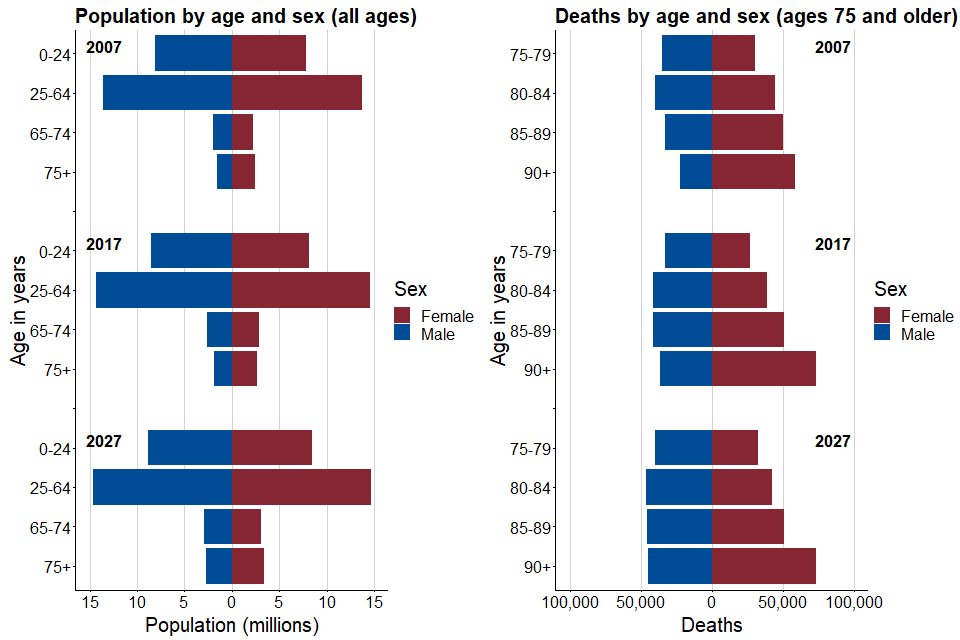
The number of people in England aged 75 years and older is rising and is projected to continue to rise. In 2017, there were 4.5 million people aged 75 years and older in England, representing 8.2% of the total population. The proportion of the English population aged 75 years and older has risen over the past 10 years, from 7.7% (3.9 million people) in 2007. By 2027, the total number of people in England in this age group is projected to reach 6.1 million, representing 10.3% of the total population.
Amongst those aged 75 years and older in England in 2017, 1.8 million (40.0%) were aged 75 to 79, 1.4 million (30.2%) were aged 80 to 84, 856,812 (18.9%) were aged 85 to 89, and 495,244 (10.9%) were aged 90 years and older.
Amongst those aged 75 and older, the fraction of people aged 90 and older has increased since 2007, when only 9.1% of people were aged 90 years and older. This shows that the fraction of people aged 75 years and over falling into the very oldest age category is also rising. Females represented the majority (2,611,949; 57.6%) of people aged 75 years and older in England in 2017. This majority increased with age, with females representing 53.8% of people aged 75-79, but 69.0% of people aged 90 and older.
In 2017, there were 498,882 deaths amongst people of all ages in England. In general, death is an event that occurs in old age. In 2017, 341,620 (68.5%) of all deaths occurred in people aged 75 years and older, of which 17.6% were amongst people aged 75 to 79, 23.5% were amongst people aged 80 to 84, 27.0% were amongst people aged 85 to 90, and 32.0% were amongst people older than 90 years. Deaths typically occurred at younger ages for males than for females; for males, 49.0% of deaths were in the 75 to 84 age group compared with 34.7% of deaths for females.
The charts below show population and deaths by age and sex in 2017, compared with the same information from 2007 and projected information for 2027. The left chart shows the population by sex for all ages, and the right chart shows deaths by sex for people aged 75 years and older.
Figure 1: Past, current and projected population and deaths in England in 2007, 2017 and 2027
Graph showing past, current and projected population and deaths in England in 2007, 2017 and 2027
3. Causes of death amongst people aged 75 years and older in England
Cause of death is an important factor in determining where an individual dies, and the care that they require before death. The table below shows the leading causes of death amongst people aged 75 years and older.
Table 1: Leading causes of death amongst people aged 75 years and older in England in 2017 and 2007
| Cause of death | 2017: Number of deaths | 2017: Proportion of deaths | 2007: Number of deaths | 2007: Proportion of deaths |
|---|---|---|---|---|
| Cancer | 74,112 | 21.7% | 65,798 | 21.0% |
| Chronic heart disease | 39,307 | 11.5% | 42,329 | 13.5% |
| Stroke | 23,742 | 6.9% | 32,490 | 10.4% |
| Liver disease | 3,685 | 1.1% | 2,185 | 0.7% |
| Dementia* | 87,199 | 25.5% | 40,253 | 12.8% |
| COPD* | 36,501 | 10.7% | 26,392 | 8.4% |
| Other causes | 105,758 | 31.0% | 115,769 | 36.9% |
*Deaths from dementia and chronic obstructive pulmonary disease (COPD) were recorded if these illnesses were an underlying or contributory cause of death. Deaths from cancer, chronic heart disease, stroke and liver disease were recorded if these illnesses were the underlying cause of death. For this reason, some deaths may fall into multiple categories (for example, if a person’s underlying cause of death was cancer, but dementia was also a contributory cause of death). For this reason, total proportion of deaths sums to over 100%.
Amongst people aged 75 years and older, deaths in the oldest age groups (85 years and older) were less likely to be caused by cancer, COPD and liver disease compared to the younger age groups, and more likely to be caused by chronic heart disease, stroke, and dementia. In general, women experienced a higher proportion of deaths where dementia was an underlying or contributory across all age groups.
The figures below show the proportion of deaths by underlying cause in each age group for people aged 75 years and older, separated by sex. ‘Other’ causes of death include any where cancer, chronic heart disease, stroke and liver disease were not listed as an underlying cause of death and deaths where dementia or COPD were not listed as contributory causes. The most common ‘other’ underlying causes of death amongst people aged 75 and older were influenza, pneumonia, and ischaemic heart disease (these causes account for approximately one-third of all other deaths). Deaths from ‘other’ causes increased in older age groups.
Figure 2: Percentage of deaths from leading causes of death amongst people aged 75 years and older in 2017, by age and sex

Graph showing percentage of deaths from leading causes of death amongst people aged 75 years and older in 2017, by age and sex
*Due to low sample sizes of deaths from liver disease in people aged 95-100 years, the average percentage of deaths from liver disease is displayed for the entire age group, represented by the dotted line.
**Deaths from dementia and COPD were recorded if these illnesses were an underlying or contributory cause of death, and are denoted by dashed lines. Deaths from cancer, chronic heart disease, stroke and liver disease were recorded if these illnesses were the underlying cause of death. For this reason, some deaths may fall into multiple categories (for example, if a person’s underlying cause of death was cancer, but dementia was also a contributory cause of death). Deaths from ‘other’ causes were defined as deaths where the underlying cause was not listed as cancer, chronic heart disease, stroke or liver disease, and deaths where dementia and COPD were not listed as an underlying or contributory cause of death.
4. Factors affecting place of death for people aged 75 years and older in England in 2017
Together with patient choice, factors such as age, sex, type of illness and marital status influence place of death. The table below shows the place of death across all 341,620 deaths amongst people aged 75 and older who died in England in 2017. For information on how place of death is categorised, refer to “Classification of Place of Death: a Technical Bulletin from the National End of Life Care Intelligence Network”.
In this report the group described as ‘Elsewhere’ is called ‘Other places’ in the reference.
Table 2: Proportion of deaths by place of death for people aged 75 years and older in England in 2017
| Place of death | 2017: Number of deaths | 2017: Proportion of deaths | 2007: Number of deaths | 2007: Proportion of deaths |
|---|---|---|---|---|
| Hospital | 155,899 | 45.6% | 176,345 | 56.3% |
| Home | 67,425 | 19.7% | 48,485 | 15.5% |
| Care home | 101,966 | 29.8% | 74,581 | 23.8% |
| Hospice | 12,569 | 3.7% | 10,049 | 3.2% |
| Elsewhere | 3,761 | 1.1% | 3,882 | 1.2% |
Since 2007, the proportion of deaths in hospital has fallen. Deaths at home and in care homes have become more common, and deaths in hospices have become slightly more common since 2007.
The first graphic in Figure 3 shows the proportion of deaths in each place of death for each age between 75 and 100 years. The proportion of deaths in hospitals, hospices and at home decreased with increasing age. Conversely, the proportion of deaths in care homes increased with age.
The second graphic in Figure 3 shows, for each place of death, the proportion of males and females amongst people who died there in 2017. Two-thirds of the people who died in care homes were females. Females were also more likely to die in locations other than those listed here (elsewhere) than males. Amongst people who died in hospices, a slightly higher proportion were males. In hospitals, a slightly higher fraction were females. Amongst people who died at home, a roughly equal number of deaths were amongst men and women.
Figure 3: Place of death for people aged 75 years and older by age and sex

Graph showing place of death for people aged 75 years and older by age and sex
The graphics in Figure 4 show the relationship between cause of death and place of death. The first graphic shows, for each cause of death, the proportion of deaths that occurred in each location. For all causes other than dementia, hospital was the most common place of death. For people where dementia was an underlying or contributory cause of death, the most common place of death was a care home (which includes nursing and residential care homes).
Home was the second most common place of death for people whose underlying cause of death was cancer, chronic heart disease, and liver disease, and for people who had COPD as an underlying or contributory cause of death. The second most common place of death was care homes for people whose underlying cause of death was stroke. Dying in a hospice was more common for people whose underlying cause of death was cancer or liver disease, in comparison to other causes of death.
The second graphic in Figure 4 shows, for each place of death, the proportion of deaths in each location that were due to each cause of death. In hospitals, approximately 40% of deaths were due to “other” causes (such as influenza, pneumonia, and ischaemic heart disease). Cancer was the leading cause of death amongst people who died at home.
The leading cause of death in care homes was dementia (as an underlying or contributory cause of death). In hospices, cancer was the underlying cause for over two-thirds of deaths. Cancer was the leading cause of death amongst people who died elsewhere.
Figure 4: Deaths in people aged 75 years and older by place of death and cause of death

Graph showing deaths in people aged 75 years and older by place of death and cause of death
*Deaths from dementia and COPD were recorded if these illnesses were an underlying or contributory cause of death. Deaths from cancer, chronic heart disease, stroke and liver disease were recorded if these illnesses were the underlying cause of death. For this reason, some deaths may fall into multiple categories (for example, if a person’s underlying cause of death was cancer, but dementia was also a contributory cause of death). Deaths from ‘other’ causes were defined as deaths where the underlying cause was not listed as cancer, chronic heart disease, stroke or liver disease, and deaths where dementia and COPD were not listed as an underlying or contributory cause of death.
Information on the marital status of people aged 75 years and older was used as a best-available indication of whether people were living alone at the time of death versus living with a partner. It was assumed that the proportion of people living alone at the time of death was higher amongst people who were single/widowed/divorced than people who were married or in a civil partnership.
Amongst people aged 75 and older who died in 2017, place of death differed by marital status. A higher proportion of people who were single, widowed or divorced died in care homes compared to people who were married or in a civil partnership. Conversely, a higher proportion of people who were married or in a civil partnership at the time of their death died in hospital and at home.
Single, widowed or divorced women were particularly likely to die in care homes compared to their counterparts who were married or in a civil partnership. Single, widowed or divorced people aged 85 years and older were also particularly likely to die in care homes compared to their counterparts who were 85 years and older and married or in a civil partnership. The figure below shows the differences in place of death by marital status for different sexes and age groups.
Figure 5: Deaths in people aged 75 years and older by place of death and marital status

Graph showing deaths in people aged 75 years and older by place of death and marital status
5. Inequalities in cause and place of death in England in 2017
Considering variations in death in different socioeconomic groups is important to highlight inequality in:
- death rates
- cause of death
- place of death
The Income Deprivation Affecting Older People Index (IDAOPI) was used to group people aged 75 and older who died in 2017 by deprivation quintiles.
The IDAOPI ‘measures’ the proportion of people 60 years of age and older who receive means-tested benefits in small geographic areas known as Lower Super Output Areas (LSOAs). All LSOAs were ranked by IDAOPI score, and the ranks were used to generate equal-sized quintiles of deprivation, where quintile 1 represents the highest proportion of people receiving means-tested benefits, and quintile 5 represents the lowest. The deprivation quintile was extracted for the usual place of residence for each person aged 75 years and older who died in England in 2017, in order to measure the relationship between deprivation and differences in age, cause and place of death.
In 2017, the number and proportion of deaths amongst people aged 75 years and older in the most deprived quintile was lower than the other 4 less deprived quintiles, reflecting the lower life expectancy in this group. The proportion of deaths in the most deprived quintile decreased by 2 percentage points compared to 2007, and the proportion of deaths in the least deprived quintile increased by 2 percentage points compared to 2007.
Table 3: Total number and proportion of deaths amongst people aged 75 years and older in each deprivation quintile in England in 2017
| Deprivation quintile | 2017: Number of deaths | 2017: Proportion of deaths | 2007: Number of deaths | 2007: Proportion of deaths |
|---|---|---|---|---|
| 1 (Most deprived) | 54,417 | 15.9% | 56,165 | 17.9% |
| 2 | 68,642 | 20.1% | 67,224 | 21.5% |
| 3 | 74,637 | 21.8% | 68,289 | 21.8% |
| 4 | 75,287 | 22.0% | 65,379 | 20.9% |
| 5 (Least deprived) | 68,637 | 20.1% | 56,285 | 18.0% |
Age of death differed by deprivation quintile. Amongst people in the most deprived quintile, a higher proportion of deaths occurred at younger ages compared to people in the less deprived quintiles.
The proportion of people who died of the most common causes of death amongst people aged 75 years and older differed by deprivation quintile. The proportion of deaths from cancer was higher in less deprived quintiles. Deaths from liver disease and where COPD was a contributory cause were more common in more deprived quintiles. The proportion of deaths due to causes other than the 6 investigated here was higher in less deprived quintiles.
Figure 6: Proportion of deaths by age and cause amongst people 75 years of age and older in each deprivation quintile in England in 2017

Graph showing proportion of deaths by age and cause amongst people 75 years of age or older in each deprivation quintile in England in 2017
*Deaths from dementia and COPD were recorded if these illnesses were an underlying or contributory cause of death. Deaths from cancer, chronic heart disease, stroke and liver disease were recorded if these illnesses were the underlying cause of death. For this reason, some deaths may fall into multiple categories (for example, if a person’s underlying cause of death was cancer, but dementia was also a contributory cause of death). Deaths from ‘other’ causes were defined as deaths where the underlying cause was not listed as cancer, chronic heart disease, stroke or liver disease, and deaths where dementia and COPD were not listed as an underlying or contributory cause of death.
Amongst people aged 75 years and older who died in 2017, there was variability in the proportion of people from each deprivation quintile amongst people who died in each place of death. In hospitals, the proportion of people who died in each deprivation quintile was more equal than at home or in hospices, where deaths amongst people from the least deprived quintiles were more common.
The proportion of people from each deprivation quintile dying at each place of death differed between people aged 75 to 84 and people aged 85 years and older (as shown on the bottom row of Figure 7), although part of this difference may be explained by the relative scarcity of deaths in the most deprived quintile in the older age group due to the lower life expectancy.
Figure 7: Proportion of deaths by place of death amongst people 75 years of age and older in each deprivation quintile in England in 2017

Graph showing proportion of deaths by place of death amongst people 75 years of age or older in each deprivation quintile in England in 2017
Data source: Office for National Statistics
6. Other resources
PHE’s Atlas of Variation for Palliative and End of Life Care allows users to explore local variations in death and end of life care, and is available either as a report, via the Atlas of Variation page on PHE Fingertips (available under the “Themed Atlases” subsection, published in 2018), or as an interactive Instant Atlas on NHS Rightcare.
PHE’s National End of Life Care Intelligence Network also develops End of Life Care Profiles, providing information on end of life care indicators for various geographies in England.
7. Authors
This report has been produced and authored by the National End of Life Care Intelligence Network with particular input from Ursula Dalrymple, Andy Pring, Nicola Bowtell and Julia Verne.
For queries relating to this publication, contact: neolcin@phe.gov.uk