UK cyber security sectoral analysis 2023
Published 19 April 2023

© Crown copyright 2023
This publication is licensed under the terms of the Open Government Licence v3.0 except where otherwise stated. To view this licence, visit nationalarchives.gov.uk/doc/open-government-licence/version/3 or write to the Information Policy Team, The National Archives, Kew, London TW9 4DU, or email: psi@nationalarchives.gov.uk.
Where we have identified any third party copyright information you will need to obtain permission from the copyright holders concerned.
This publication is available at https://www.gov.uk/government/publications/cyber-security-sectoral-analysis-2023/uk-cyber-security-sectoral-analysis-2023
Foreword: Viscount Camrose

Viscount Camrose, Minister for AI and Intellectual Property
The United Kingdom continues to play a pivotal role in the global cyber security ecosystem. In December 2021, the government published the National Cyber Strategy, which set out the UK’s place as a leading responsible and democratic cyber power, able to protect and promote our interests in and through cyberspace. The Strategy outlines our commitment to ‘strengthening the UK cyber ecosystem, investing in our people and skills and deepening the partnership between government, academia and industry.’
The Cyber Security Sectoral Analysis research has tracked the growth of the UK cyber security sector sxince 2018 and has provided an evidence base for the capabilities and expertise that exist in the UK. Our firms have grown strongly, demonstrated resilience, and provided critical vital support to our economy, society, and way of life.
Within this year’s study, we are now tracking almost 2,000 cyber security firms in the UK. In the last 12 months, the sector has demonstrated strong growth across a number of key measures. The sector’s revenue has grown to more than £10.5 billion, and the sector has added over 5,300 jobs across all regions of the UK. I am particularly pleased to see that the cyber sector continues to have strong representation outside London and the South East, with more than half of cyber firms based in other regions and these firms receiving a growing share of external investments, reflecting the skills and innovation present across the whole of the UK.
The cyber security sector continues to play a vital role in growing the whole of the UK economy, and as such, we continue to invest in skills to help get more people into cyber security at all ages, including the Cyber Explorers and Upskill in Cyber programmes, business support programmes for start-ups, scale-ups, and spin-outs such as Cyber Runway and NCSC for Start-Ups, and supporting regional collaboration through the UK Cyber Cluster Collaboration (UKC3) programme.
I want to thank everyone working in cyber security for their tireless contribution to keep the UK safe and secure online. We will continue to do all we can to support the sector in the months ahead.
Viscount Camrose
Minister for AI and Intellectual Property
Department for Science, Innovation and Technology
Executive summary
Introduction
Ipsos, Perspective Economics, glass.ai and the Centre for Secure Information Technologies (CSIT) at Queen’s University Belfast were jointly commissioned by the Department for Digital, Culture, Media and Sport (DCMS) in March 2022 to undertake an updated analysis of the UK’s cyber security sector. In February 2023, the parts of DCMS responsible for cyber security policy moved to the new Department for Science, Innovation and Technology (DSIT).
This analysis builds upon the previous UK Cyber Security Sectoral Analysis (published in February 2022) that provides a recent estimate of the size and scale of the UK’s cyber security industry. This provided an assessment of:
-
The number of businesses in the UK supplying cyber security products or services
-
The sector’s contribution to the UK economy (measured through revenue and Gross Value Added, or GVA)
-
The number employed in the cyber security sector
-
The products and services offered by these firms
Project scope and summary of methodology
The diagram below sets out a summary of the research methodology used. This is consistent with previous studies to support a time-series analysis of the sector’s performance to date.
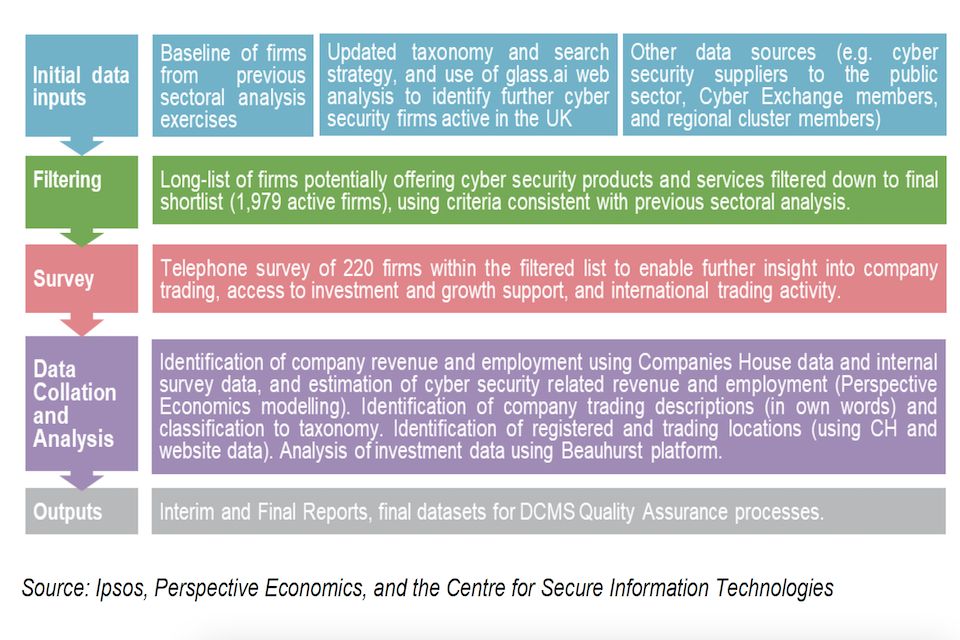
A chart showing the methodology used in this report, including initial data inputs, filtering, the survey itself, data collection and analysis, then final outputs.
Source: Ipsos, Perspective Economics, and the Centre for Secure Information Technologies
Key findings[footnote 1]
| Number of companies | We estimate that there are 1,979 firms currently active within the UK providing cyber security products and services |
|---|---|
| Sectoral Employment | We estimate there are approximately 58,005 Full Time Equivalents (FTEs) working in a cyber security related role across the cyber security firms identified This reflects an estimated increase of c. 5,300 cyber security employee jobs within the last 12 months (an increase of 10%) |
| Sectoral Revenue | We estimate that total annual revenue within the sector has reached £10.5 billion within the most recent financial year[footnote 2] This reflects an increase of c. 3% since last year’s study (which suggests slower growth from the previous year, during which the sector saw notably positive growth) |
| Gross Value Added | We estimate that total GVA for the sector has reached c. £6.2 billion This reflects an increase of 17% since last year’s study, and suggests that despite a slower growth in revenues, sectoral productivity has grown significantly due to increased profitability We estimate that GVA per employee has increased from £101,000 to £107,400 within the last year (an increase of 6%), suggesting improved productivity is also reflected through profitability and staff remuneration |
| Investment | In 2022, £302 million has been raised across 76 deals in dedicated cyber security firms. Whilst this figure reflects a decrease in the value of investment raised compared with 2020 (£814 million) and 2021 (£1,013 million) levels, the number of deals in dedicated cyber security firms remains robust (76 deals in 2022 compared with 86 in 2021) |
1. Introduction
This analysis builds upon the previous UK Cyber Security Sectoral Analysis (published in February 2022) that provides a recent estimate of the size and scale of the UK’s cyber security industry. This continues the time-series analysis undertaken by the research team since 2018.
This provides an assessment of the number of businesses in the UK supplying cyber security products or services; the sector’s contribution to the UK economy (measured through revenue and Gross Value Added[footnote 3], or GVA); the number employed in the cyber security sector; and an overview of the products and services offered by these firms.
1.1 Method and sources
The UK cyber security sector does not have a formal Standard Industrial Classification (SIC) code, and this study therefore closely aligns itself to that of the baseline analysis, to provide a time series analysis of how the sector has progressed since the baseline (2017/18) and subsequent annual studies.
The cyber security sector remains fast-moving, and continually subject to changes in products, services, and market approaches. This year’s study is fully consistent with the previous updated methodology set out within last year’s report. This includes an improved identification of businesses offering cyber security products and services in the UK, using:
-
An updated and refined taxonomy to better identify and classify cyber security activity
-
An established data partnership with leading data intelligence firm glass.ai (using Artificial Intelligence (AI) techniques[footnote 4] to identify businesses using web data)
-
Ongoing telephone and online survey of cyber security businesses in May to July 2022
The following methodology and research sources were used to provide an overarching shortlist of UK cyber security businesses, and to estimate their economic contribution related to the sale of cyber security products or services.
The process by which we identify and measure the economic contribution of cyber security activity reflects a best estimate by the Ipsos, Perspective Economics, glass.ai and Centre for Secure Information Technologies team, using agreed parameters for the inclusion of respective firms considered to be active in the field.
The key stages below are consistent with previous Cyber Security Sectoral Analysis exercises to enable a time series comparison
Stage 1: Desk Research
The research team conducted initial desk research to explore how the cyber security market had changed within the last 12 months. This included:
-
Engagement with UK cyber security regional networks and clusters, to gather local intelligence
-
A review of published reports regarding the output or activities of the sector (e.g., UK Cyber Security Exports Strategy and associated annual export statistics)
-
Recent investments or initiatives in the cyber security sector (including review of investments and acquisitions, and identification of new industry initiatives and cohorts, e.g., Cyber Runway)
-
Any emerging trends in the market (including supply side and demand side), e.g., enhanced demand attributable to cloud security or working from home, or new product innovations requiring specific cyber security requirements
Stage 2: Initial Data Collection & Gap Analysis
The research team sought to identify potential active cyber security firms in the UK through:
-
A review of firms previously identified in the sectoral analysis (identifying current status and determining inclusion in the updated set)
-
A review of company participation within clusters, networks, and/or government supported initiatives
-
A revised search strategy and updated taxonomy, informed through workshops with industry and academic stakeholders in the cyber security community
-
An updated taxonomy has been used to inform a long list of firms (identified through use of glass.ai web data and by Perspective Economics). This list was subject to automated and manual review, and refined to a final cyber security business list for analysis (n = 1,979)
The business metrics include (but are not limited to):
-
Company name, registered number, company status, and date of incorporation
-
Registered and trading locations (using official and web data)
-
Company website and contact details
-
Core description of company activities related to cyber security
-
Company size[footnote 5] (large / medium / small / micro)
Stage 3: Cyber Security Sectoral Survey
Ipsos conducted a representative survey of 220 cyber security firms from May to July 2022. The survey used the list of firms (n = 1,979) established in Stage 2 of this study as a sample frame from across the UK. The purpose of the survey was to understand firm-level performance, barriers, and collaboration in further detail.
It covered the following topics:
-
The categories of products and services offered across firms
-
The client sectors that cyber security firms work across
-
Revenue estimates (to supplement the other published data found in Stage 2)
-
Extent of export activity, or international collaboration
-
Perceived barriers to growth
-
Understanding areas of collaboration and reasons for working with cyber security partners
Appendix C provides the full technical details for the survey, including the data collection approaches and response rate.
Stage 4: Qualitative Consultations
This research has also been supported through 22 one-to-one consultations with cyber security firms, and investors and economic development leads in the cyber security sector. Participants were purposively sampled to reflect variation in size, location, product or service focus, and maturity, with participating cyber security firms being recruited from the Ipsos survey recontact sample.
Stage 5: Data Blending
In September 2022, the results of the cyber security sector survey were used to inform gaps within the list of identified cyber security sector firms e.g. the extent to which a firm provided cyber security products or services and attributed revenues accordingly. This stage involved data cleaning and augmentation from a range of previous sources (including company level accounts, web data, survey data, and wider desk review) to provide a final dataset of cyber security firms, including the development of firm-level metrics used for analysis within the report.
Stage 6: Data Analysis and Reporting
The final stage involved analysis of the final shortlist of firms to provide estimates of total number of firms, products and services offered, whether firms are ‘dedicated or diversified’ with respect to how much of their activity related to cyber security provision, revenue/GVA/employment estimates, locations (registered, trading, and international presence), investment and survey feedback (anonymised at an individual level).
The data sources used to underpin the sectoral analysis included:
-
glass.ai: web data to help identify and map new providers of cyber security products and services, and match these to the cyber security taxonomy, and to extract and parse key company descriptions and locations for identified company websites
-
Bureau van Dijk FAME (and Companies House Data Product): This platform collates Companies House data and financial statements from all registered businesses within the UK
-
Beauhurst: Beauhurst is a leading investment analysis platform, which enables users to discover, track and understand some of the UK’s high-growth companies e.g. identify investment, accelerator participation, and key information
-
Tussell: Tussell provides market insight into public sector procurement through identifying key contracts, spend, buyers and suppliers
-
Cyber Exchange: techUK’s Cyber Exchange directory enables cyber security providers to register an account and set out the products and services they provide to the market
-
Representative survey of cyber security firms: in Summer 2022, Ipsos conducted a representative survey of cyber security firms. The feedback from 220 providers has been useful to understand the financial performance, growth drivers, and challenges for firms within the market
-
One-to-one qualitative consultations: further, the team has also conducted twenty one-to-one consultations with investors, market providers and economic development leads to gather feedback on the growth and performance of the cyber security sector in the UK
1.2 Consistency with the 2022 Cyber Sectoral Analysis
Our approach remains consistent with previous reports (and builds upon the methodology to identify and measure the contribution of the sector). As per previous studies, this report also explores firms that:
-
Have a clear presence within the UK market, through a UK registered business that reports to Companies House on an annual basis
-
Demonstrate an active provision of commercial activity related to cyber security (e.g. through the presence of a website / social media)
-
Provide cyber security products or services to the market (i.e. sell or enable the selling of cyber solutions to other customers)
-
Have identifiable revenue or employment within the UK
-
Appear to be active at the time of writing (i.e. have not, or are not in the process of dissolution)
-
Are not charities, universities, networks, or individual contractors (non-registered) – all excluded for analysis purposes
It also draws upon consistent sources, i.e., company accounts, longitudinal survey data, and Beauhurst for investment data. The financial analysis of firms is also consistent, as it uses company information from the most recent financial year of accounts (analysis undertaken in late 2022, with financial year 2021/22 as the modal year for published accounts) and the underpinning dataset sets out where employment, revenue, GVA and investment are either known or estimated (and the rationale underpinning this).
1.3 Interpretation of the data
Across this report, percentages from the quantitative data may not add to 100%. This is because:
-
We have rounded percentage results to the nearest whole number
-
At certain questions, survey respondents could give multiple answers
It is also important to note that the survey data is based on a sample of cyber sector firms rather than the entire population. Therefore, they are subject to sampling tolerances. The overall margin of error for the sample of 220 firms (within a population of 1,979 firms) is between c.4 and c.6 percentage points. The lower end of this range (4 percentage points) is used for survey estimates closer to 10% or 90%. The higher end (6 percentage points) is used for survey estimates around 50%. For example, for a survey result of 50%, the true value, if we had surveyed the whole population, is extremely likely to be in the range of 44% to 56%.[footnote 6]
By contrast, the data from the 22 qualitative consultations is intended to be illustrative of the key themes affecting the cyber security sector, as a whole, rather than a statistically representative view of cyber sector businesses or investors.
1.4 Acknowledgements
The authors would like to thank the DSIT team for their support across the study. DSIT and the report authors would also like to thank those that participated within this research, including those that participated within the industry survey, the regional cyber security clusters, consultations, and shared data, knowledge, and feedback to help underpin this study.
Note: The cyber security sector continues to increase in size, scope, and specialisms. We are happy to receive comments and feedback regarding the methodology or findings herein, through contacting cybersecurity@dcms.gov.uk
2. Profile of the UK cyber security sector
2.1 Defining the UK cyber security sector
Within the National Cyber Security Strategy 2022, cyber security is defined as:
The protection of internet connected systems (to include hardware, software, and associated infrastructure), the data on them, and the services they provide, from unauthorised access, harm, or misuse. This includes harm caused intentionally by the operator of the system, or accidentally, as a result of failing to follow security procedures or being manipulated into doing so.
Therefore, this sectoral analysis seeks to identify businesses active within the UK that provide products or services that enable the protection of internet connected systems and their users.
In line with previous studies, this analysis is focused upon organisations that include all of the following attributes:
-
Have a clear presence within the UK market, through a UK registered business that reports to Companies House on an annual basis
-
Demonstrate an active provision of commercial activity (e.g. through the presence of an active website / social media presence)
-
Provide cyber security products or services to the market (i.e. sell or enable the selling of cyber solutions to other customers) – aligned to the taxonomy set out below
-
Have identifiable revenue or employment within the UK related to cyber security
-
Appear to be active at the time of writing (i.e. have not, or are not in the process of dissolution)
-
Are not charities, universities, networks, and individual contractors (non-registered) – which are all excluded for analysis purposes
The businesses included within this analysis are considered to provide one or more of the following products or services:
-
Cyber professional services, i.e., providing trusted contractors or consultants to advise on, or implement, products, solutions, or services for others
-
Endpoint and mobile security, i.e., hardware or software that protects devices when accessing networks
-
Identification, authentication, and access controls, i.e., products or services that control user access, for example with passwords, biometrics, or multi-factor authentication
-
Incident response and management, i.e., helping other organisations react, respond, or recover from cyber attacks
-
Information risk assessment and management, i.e., products or services that support other organisations to manage cyber risks, for example around security compliance or data leakage
-
Internet of Things (IoT Security), i.e., products or services to embed or retrofit security for Internet of Things devices or networks
-
Network security, i.e., hardware or software designed to protect the usability and integrity of a network
-
SCADA and Information Control Systems, i.e., cyber security specifically for industrial control systems, critical national infrastructure, and operational technologies
-
Threat intelligence, monitoring, detection, and analysis, i.e., monitoring or detection of varying forms of threats to networks and systems
-
Awareness, training, and education, i.e., products or services in relation to cyber awareness, training, or education
Section 2.3 sets out the type of cyber security products and services in further detail.
2.2 Number of cyber security firms active in the UK
We estimate that there are currently 1,979 firms active within the UK providing cyber security products and services. This reflects a glass.ai and Perspective Economics estimate as of September 2022.
Whilst this reflects an increase in the number of firms offering cyber security products and services (1,838 identified in the previous study), the research team emphasise that this is one metric among many to gauge the health of the sector. For example, this increase includes:
-
Newly registered companies offering cyber security products and services (often very early / small start-ups)
-
Previously registered companies that did not previously offer such services, but have established a product or team to do so recently (e.g. consultancies offering IT risk services)
-
Businesses now identified as providing a relevant cyber security product or service (e.g. identified through provision of an accredited scheme such as Cyber Essentials) where previous web-data matching did not flag such products or services
-
Businesses with limited web data reporting the provision of cyber security products or services, but which have been flagged through engagement with other sources (e.g. consultation with regional clusters)
Throughout this study, the research team emphasise the need to draw upon a wide range of existing sources, alongside the development and deployment of a cyber security taxonomy against Companies House data, analysis of relevant website domains, and in-depth regional engagement. Within the process, a ‘long list’ of several thousand businesses in the UK was identified as potentially relevant to the cyber security sector using keywords and web data. However, this long list was subsequently filtered to ensure each business demonstrated sufficient alignment to the research parameters and the market taxonomy.
For example, web data can identify firms that may have an active registration with Companies House, have a website or social media presence, and meets the parameters of the taxonomy. However, further review of the presence may indicate a lagging status (e.g. the business may have no true employees or may not appear to be active for several years). The team therefore reviewed more than 3,000 firms in detail, removing organisations that may have mentioned security (e.g. offering a secure data centre service) but did not appear to tangibly offer cyber security products or services to the end-market.
This yielded the 1,979 firms in scope, and the research team considers this to be an appropriate figure to gauge the health and composition of the sector whilst ensuring consistency with previous analysis.
We do however note, that as with all emerging sectors, subtle differences in definition can result in varying interpretations of the size and composition of activity. In this respect, there may be other relevant cyber security use cases, which could in future meet the short list requirements (i.e., the 6 conditions set at the beginning of Section 2.1) and could therefore be included in future analysis. This might include, for example, firms involved in areas such as FinTech, RegTech[footnote 7] or Safety Tech[footnote 8]. However, we provide these parameters to avoid duplication, and provide DSIT with a health check regarding the overall cyber security market.
There are also businesses operating within the UK that may, for example, resell cyber security solutions (anti-virus, anti-malware, spam filtering etc) through a broader package of managed IT support. As this cyber security spend should be reflected in the revenues of those providing rather than reselling these solutions, we place less focus on the role of resellers within the sectoral analysis (although do include a small number of larger resellers that offer cyber security advisory services and implementation support).
Overall, this process means that the 1,979 firms for analysis within this report have been assessed and verified as providers of cyber security products and solutions. We provide a high-level breakdown of this provision in subsequent chapters. Given the breadth of ‘cyber security’ as a term, we endeavour to be clear regarding what is in scope, what is being measured, and why this matters, for the sector and for the wider economy and society. The following sub-sections set out an overview of the number of companies by size; the breakdown between companies that appear dedicated or diversified; and the products and or services provided by each company.
Number of registered firms by size
For the 1,979 cyber security firms, Figure 2.1 and Table 2.1 demonstrate the breakdown by size.[footnote 9]
Figure 2.1: Number of registered cyber security firms by size
| Size | Count (percentage) |
|---|---|
| Large | 165 (8%) |
| Medium | 192 (10%) |
| Small | 525 (27%) |
| Micro | 1,097 (55%) |
Source: Perspective Economics, glass.ai (n = 1,979)
Within the UK, the vast majority of all businesses are Small and Medium Enterprises (SMEs), and it is therefore to be expected that the majority of registered businesses within the cyber security sector are small (27%) or micro (55%) in size.
As this study focuses upon businesses with at least one member of staff, the following comparison is noted between the UK’s cyber security sector, and the broader UK business population. This highlights that, despite the cyber security sector containing a considerable proportion of micro and small businesses, there are many providers of scale operating within the UK market (i.e., 18% of businesses offering cyber security products and services to market are medium or large, compared to 3% of all businesses[footnote 10] in the UK).
Table 2.1: Comparison of the Size of Cyber Security Firms and Wider Business Population
| Size | UK Business Population Estimates (2022) | Percentage | Cyber Sectoral Analysis | Percentage[footnote 11] |
|---|---|---|---|---|
| Large (250+ employees) | 7,675 | <1% | 165 | 8% |
| Medium (50-249) | 35,940 | 3% | 192 | 10% |
| Small (10-49) | 217,240 | 15% | 525 | 27% |
| Micro (1-9) | 1,187,045 | 82% | 1,097 | 55% |
| All Businesses with at least 1 employee | 1,447,900 | 100% | 1,979 | 100% |
Change in size
Following last year’s sectoral analysis, we have tracked the performance of each firm (n = 1,838 in the previous study) to understand how the size of cyber security firms has changed (where applicable) in the last 12 months.
The left side of the Sankey diagram (Figure 2.2) shows the size of cyber security firms as identified in the 2022 study, with the right side showing their updated size currently. As this is a brief time period, the size composition of firms remains fairly static.
However, this does highlight that 6.1% of firms[footnote 12] appear to have closed or are no longer fully trading within the last 12 months. This is a similar closure rate to that identified within the previous study (5.9% in 2022), potentially reflecting ongoing market acquisition and merger activity.
Figure 2.2: Sankey Flow Chart – Size (2022 Study – 2023 Study)
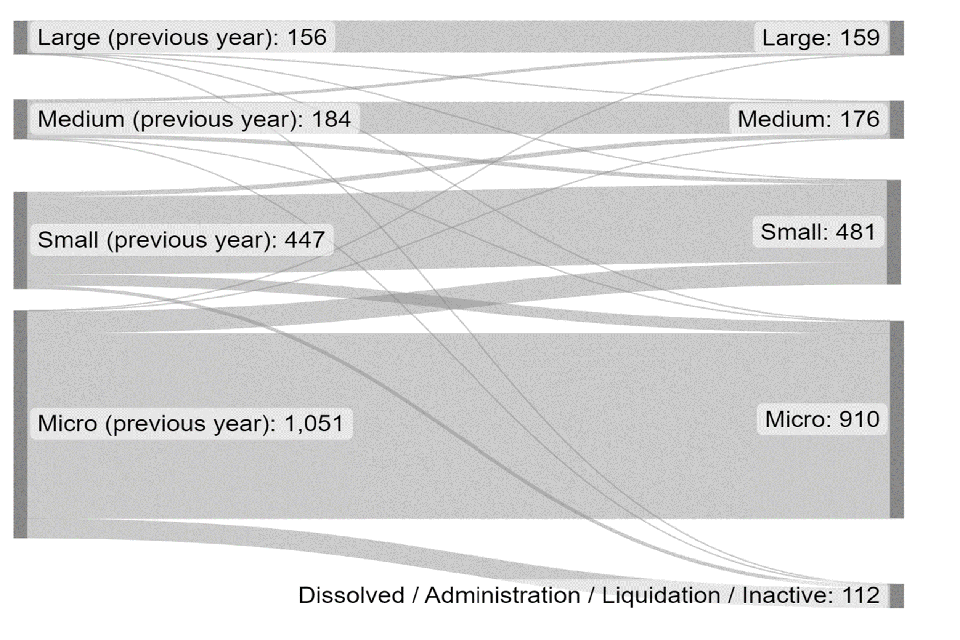
A Sankey flow chart showing the how the number of different sized businesses has changed since last year's report.
Source: Perspective Economics (n=1,838)
Dedicated and diversified providers of cyber security products and services
Within this research, we attempt to categorise firms by whether they are either:
-
Dedicated (or ‘pure-play’), i.e., most (>75%) of the business’ revenue or employment can be attributed to the provision of cyber security products or services
-
Diversified, i.e., less than 75% of the business’ revenue or employment can be attributed to the provision of cyber security products or services
Figure 2.3: Dedicated and Diversified Providers
| Type | Percentage |
|---|---|
| Dedicated | 71% |
| Diversified | 29% |
Source: Perspective Economics (n = 1,979)
The rationale underpinning the need to provide this distinction is attributable to seeking to understand how firms either set up to solely provide cyber security, or firms that provide cyber security as one product or service among others vary with respect to size, scale, growth, and market activity.
Within the current dataset, almost three-quarters (71%) of firms are dedicated providers of cyber security products and services. This reflects no change from the previous study.
Disaggregating these firms by size (as below in Figure 2.4) also highlights that micro and small firms within this analysis are much more likely to be dedicated (82% and 70% respectively), whereas there are few large dedicated cyber security firms (19%).
In other words, this reflects the tendency for several large and medium sized companies in the UK to establish cyber security practices to complement existing provision, e.g., management consultancies, managed service providers, or telecoms firms developing a cyber security division that sells to the market. This also includes a range of larger diversified firms developing cyber security products or solutions tailored towards markets such as aerospace and defence, critical national infrastructure, and professional services.
Figure 2.4: Dedicated / Diversified Cyber Security Firms by Size
| Businesses | Dedicated | Diversified |
|---|---|---|
| Large | 19% | 81% |
| Medium | 55% | 45% |
| Small | 70% | 30% |
| Micro | 82% | 18% |
Source: Perspective Economics (n=1,979)
2.3 Products and services provided by the UK cyber security sector
In order to understand the products and services provided by the UK cyber security sector, DSIT and the research team use a taxonomy (as summarised below) to categorise each of the products and services offered.
This provides a high-level overview of the UK’s cyber security product and service offer. This taxonomy remains broadly consistent with previous years; however, the underlying keywords and terms have been revisited and updated. Further, the use of web data and manual review means that firms can be classified into taxonomy areas through both the text available, and the analyst decision regarding key products and services. This means that the following data reflects an interpretation of the key products and services offered. It is therefore indicative of the main solutions provided by the UK cyber security sector.
In previous studies, the cyber security business survey had asked respondents which products and services they provide (against the taxonomy areas); however, this found that many respondents report to offer all or most of these products and services, which made delineation between specialisms difficult to measure. Therefore, we take a top-down review of products and services using the text data available through web data review.
Taxonomy Definitions:
| Taxonomy Category | Agree Definition (Short) |
|---|---|
| Cyber professional services | Providing trusted contractors or consultants to advise on, or implement, cyber security products, solutions, or services for others |
| Endpoint and mobile security | Hardware or software that protects devices when accessing networks |
| Identification, authentication, and access controls | Products or services that control user access, for example with passwords, biometrics, or multi-factor authentication |
| Incident response and management | Helping other organisations react, respond, or recover from cyber attacks |
| Information risk assessment and management | Products or services that support other organisations to manage cyber risks, for example around security compliance or data leakage |
| Internet of Things | Products or services to embed or retrofit security for Internet of Things devices or networks |
| Network security | Hardware or software designed to protect the usability and integrity of a network |
| SCADA and Information Control Systems | Cyber security specifically for industrial control systems, critical national infrastructure, and operational technologies |
| Threat intelligence, monitoring, detection, and analysis | Monitoring or detection of varying forms of threats to networks and systems |
| Awareness, training, and education[footnote 13] | Products or services in relation to cyber awareness, training, or education |
Source: Ipsos, Perspective Economics and Centre for Secure Information Technologies
Further, we also classify each company by whether they provide (as their main cyber security offering) products, services, managed security services, or act as a cyber security specific reseller.
-
Cyber security product(s): i.e. the business has developed and sells a bespoke product (hardware or software solution) to the market
-
Cyber security service(s): i.e. the business sells a service to the market e.g. cyber security advisory services, penetration testing etc
-
Provide Managed Security Services: i.e. the business offers other organisations some degree of cyber security support e.g. establishes security protocols, monitoring, management, threat detection etc – typically for a monthly or annual fee
-
Resellers: i.e. the business packages and resells cyber security solutions (usually through licencing agreements)
This approach helps policymakers, industry, and investors understand how many companies there are focusing on a particular subsector of the market or offering new products or solutions accordingly.
Product and service provision
Figure 2.5 sets out an analysis of how many companies appear to be focused upon product or service provision. It is worth noting that in reality, there will be some overlap where firms provide both products and services; however, this approach selects one category per firm. Overall, analysis of company trading descriptions suggests that over 7 in 10 (71%) of firms are mainly involved in service provision (including managed services and reselling[footnote 14]), and just under 3 in 10 (28%) are mainly involved in cyber security product development. This is consistent with the 2022 study.
Figure 2.5: Number of Registered Cyber Security Firms by Product/Service Focus
| Type | Count (Percentage) |
|---|---|
| Service | 1,088 (55%) |
| Product | 558 (28%) |
| MSSP | 314 (16%) |
| Reseller | 19 (1%) |
Source: Perspective Economics (n = 1,979)
Taxonomy breakdown
Within this study, we have matched company descriptions (in their own words through website analysis) with the key terms within each taxonomy category, followed by a manual check to assign companies to one (or more) taxonomy categories with respect to their product and service provision. Please note that the increase in company text data, and slight change to the taxonomy structure may impact the figures below from previous years.
On this basis, Figure 2.6 is based upon our analysis of trading descriptions. It demonstrates that ‘Cyber Professional Services’ remains the most commonly provided taxonomy category (73% of businesses, up from 72% last year). Areas of notable growth include Incident Response and Management (41%, up from 33% last year), and Training, Awareness and Education (20%, up from 17%).
Figure 2.6: Number of Registered Cyber Security Firms by Taxonomy Offering
| Category | Percentage |
|---|---|
| Cyber Professional Services | 73% |
| Network Security | 61% |
| Endpoint Security | 60% |
| Threat Intelligence, Monitoring, Detection and Analysis | 56% |
| Information Risk Assessment and Management | 52% |
| Incident Response and Management | 41% |
| Training, Awareness and Education | 20% |
| Identification, Authentication and Access Control | 20% |
| IoT Security (incl. devices, automotive and access control) | 5% |
| SCADA and ICS | 4% |
Source: Perspective Economics (n = 1,979)
3. Location of cyber security firms (UK)
3.1 Introduction
This chapter explores the registered location (i.e., where each business has located its registered address with Companies House), and the active office locations (i.e., where each business has a trading presence or office across the UK) of cyber security firms.
Understanding the registered and trading addresses of cyber security firms in the UK enables regional analysis and supports the evidence-based identification of notable clusters or hotspots of activity. We have identified 4,970 office locations for the 1,979 firms identified within this study. In other words, on average, each firm has over two office locations across the UK (of which, one will be a ‘registered’ location with Companies House).
3.2 Location of UK cyber security firms
Figure 3.1 sets out the breakdown of firms by number of UK office locations identified in each of the twelve regions. This highlights the importance of identifying local units of activity in the UK (marked in blue below) when seeking to understand regional activity, as registered locations can be skewed towards London and the South East.
Figure 3.1: Percentage of Cyber Security Firms by Location
| Businesses | Percentage of Active Offices | Percentage of Registered Firms |
|---|---|---|
| Greater London | 30% | 33% |
| South East | 17% | 20% |
| North West | 9% | 7% |
| Scotland | 8% | 6% |
| South West | 8% | 7% |
| East of England | 6% | 7% |
| West Midlands | 5% | 5% |
| Yorkshire and the Humber | 4% | 4% |
| East Midlands | 4% | 4% |
| North East | 3% | 2% |
| Wales | 3% | 2% |
| Northern Ireland | 2% | 2% |
Source: Perspective Economics (n=4,970)
Active (local offices)
Figure 3.2 sets out the number of active offices identified within this study by UK region. Overall, the data suggests a continuation of last year’s trend in that a slight majority of firms (53%) are based outside of London and the South East regions (which is consistent with the previous year). Further exploration of regional office data suggests no significant changes at the regional level (proportional to overall size of the UK market). Figure 3.3 also highlights the number of active offices by Travel to Work Area, and identifies emergent hotspots in areas such as Greater Manchester, Bristol and Bath, Cambridge, and Newcastle.
Consistent with analysis in previous years the shift to working-from-home practices appear to have resulted in increased flexibility in work patterns and therefore increased regional opportunities across the UK. Further, the DCMS Cyber Security Skills in the UK Labour Market research also highlights the significant increase in remote job postings advertised in cyber security roles across the UK.
Figure 3.2: Active Cyber Security Offices by Region
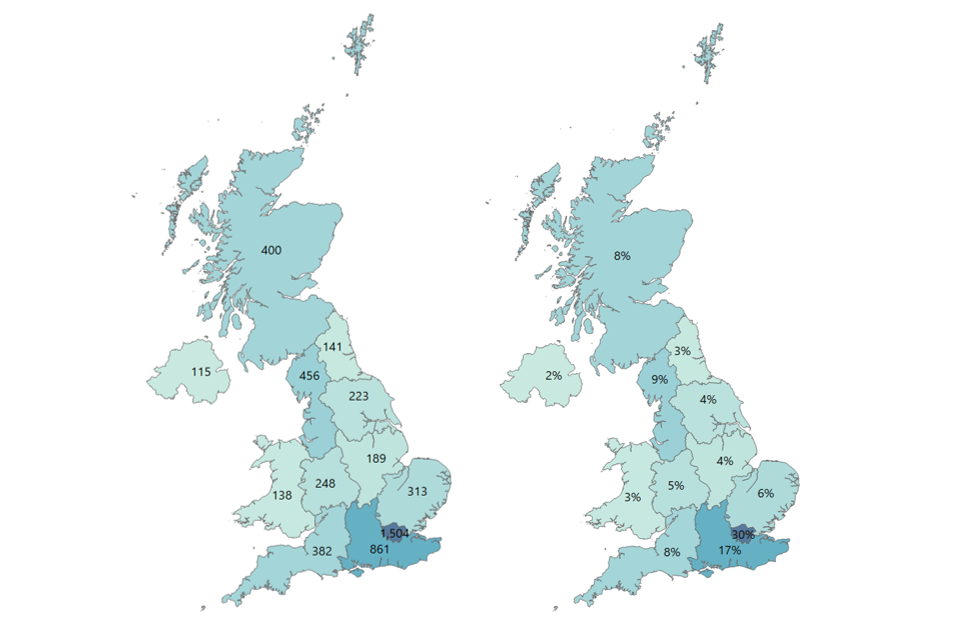
A map showing active cyber security offices by region
Source: Perspective Economics (n=4,970)
Figure 3.3: Active Cyber Security Offices by Travel to Work Area (TTWA)
A map showing active cyber security offices by travel to work area
Source: Perspective Economics (n=4,970) (Darkest blue denotes any TTWA with >50 active offices)
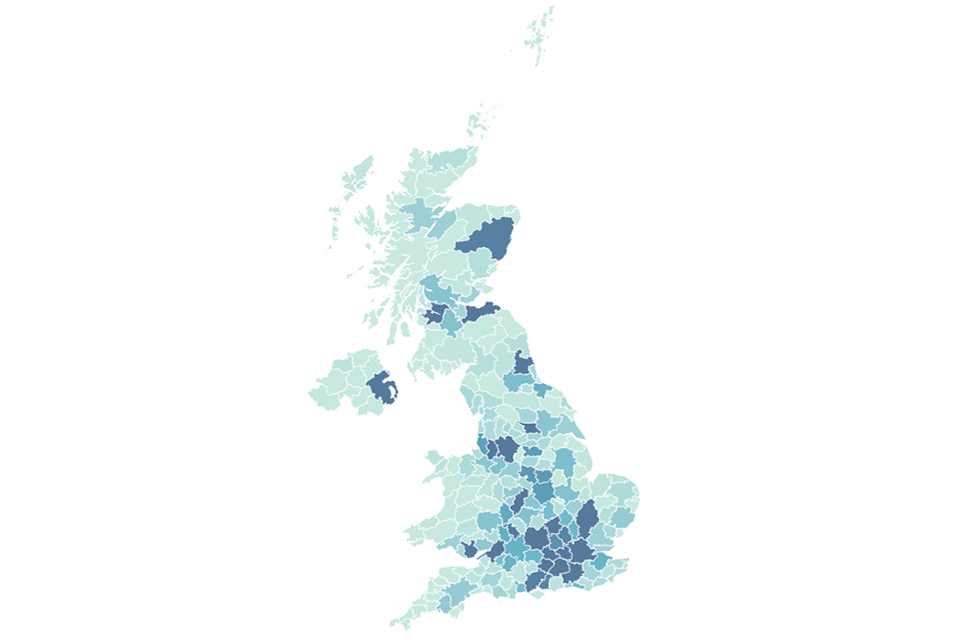
3.3 UK cyber security heatmap
In addition to understanding the number of offices across the UK for cyber security businesses, the research has identified the location of each office, and identified commercial clusters emerging. Heatmaps for each UK region are set out within the report annex.
Figure 3.4: Cyber Security Firm Level Heatmap
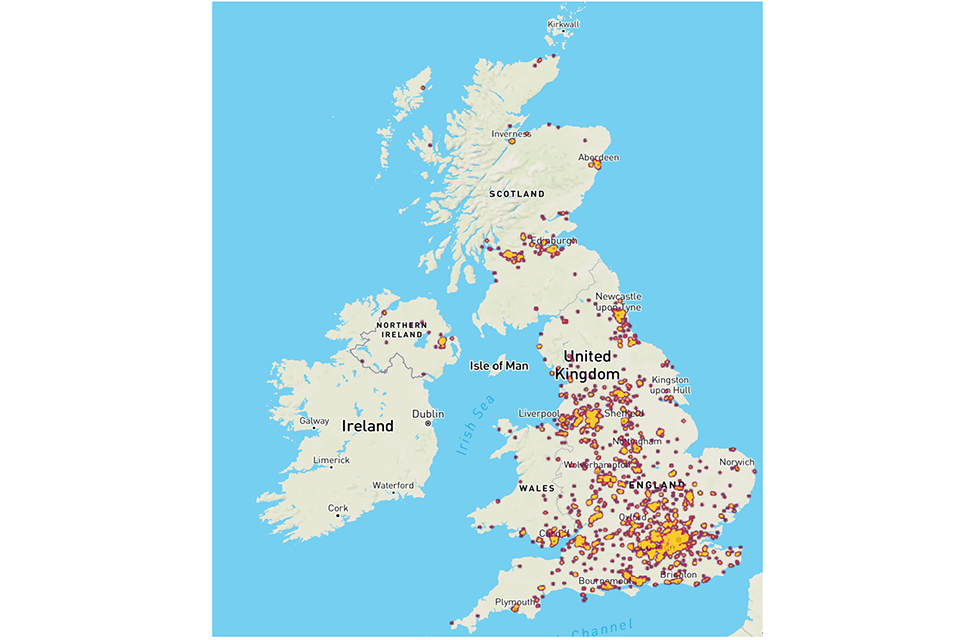
A 'heatmap' showing the location of cyber security firms on a map of the UK
Source: Perspective Economics (n=4,970)
International activity
This section outlines where UK registered cyber security firms have an established physical presence in another country. This helps to inform a further understanding of where firms are exporting, are engaged in international markets, or where multinational firms have a presence in the UK. For the 1,979 providers of cyber security products and services, we have identified:
-
345 UK-headquartered cyber security businesses with a physical presence in international markets (denoted by an office presence)
-
A further 295 cyber security businesses active in the UK appear to be headquartered or originate from outside the UK
For the 345 UK-headquartered cyber security businesses, the following chart sets out the main trading regions (totalling to more than 100%, since firms have offices across multiple locations):
Figure 3.5: Regions with an international presence (by UK-headquartered Cyber Security Firms)
| Region | Percentage |
|---|---|
| United States | 59% |
| European Union / European Economic Area | 43% |
| Australia | 16% |
| India | 12% |
| France | 11% |
| Ireland | 11% |
| Germany | 10% |
| Singapore | 9% |
| Netherlands | 9% |
| South Africa | 8% |
Source: Perspective Economics (n = 345 UK-headquartered firms with an international office presence)[footnote 15]
This suggests sustained growth in the number of UK firms operating with a presence in the United States (increased from 163 firms in last year’s study to 202). The European Union / European Economic Area is an important market, and 150 UK headquartered businesses have offices present across the region (an increase from 133 businesses in last year’s study).
In recent years, the UK has also been a clear international destination for foreign direct investment (FDI) in cyber security. We have identified where internationally headquartered firms (n = 295) have set up a presence in the UK (related to cyber security). In total, we have identified 190 firms from the United States that have set up an office in the UK (an increase from 183 last year). This accounts for 10% of all cyber security firms in the UK and highlights the importance of US-UK collaboration in this area. This is followed by 52 firms from across the European Union and European Economic Area (3% of cyber security firms operating in the UK), followed by 13 firms from Israel, 7 from Australia, and 6 from Canada.
4. Economic contribution of the UK cyber security sector
4.1 Estimated revenue
In the most recent financial year, annual cyber security revenue within the sector is estimated at £10,462 million (rounded to £10.5 billion). This reflects a marginal increase of c. 3%[footnote 16] from last year’s study (£10.1 billion).
This figure is estimated using:
-
Revenue figures available for dedicated (100%) cyber security firms that publish annual accounts
-
Revenue figures available for diversified cyber security firms (multiplied by the estimate of the proportion of the firm’s activity related to cyber security)
-
Reported cyber security revenue estimated (for the most recent financial year) through the cyber sector survey held in Summer 2022
-
Where gaps exist, employment has been sourced or estimated, with revenue estimated using ‘revenue per employee’ (estimated by size using known data) multiplied by ‘number of employees’ to provide an estimated revenue figure on a firm-by-firm basis
This revenue estimate relates to revenue attributable to cyber security activity only. The following subsections set out revenue by size, revenue by size and dedicated/diversified categorisation, and revenue by key company offer. Please note that as the analysis was undertaken in late 2022. We use the most recent financial year reporting data where possible, which means that much of the revenue will have been achieved through work delivered and billed in 2021 (e.g. if a company has a financial year ending March 2022, those accounts will reflect billed work from April 2021 – March 2022).
Revenue by firm size
We estimate that just under three-quarters (£7.7 billion, 74%) of all UK cyber security revenue is earned by large firms (which further demonstrates the earning power of these firms given that they reflect 8% of all market providers).
This includes several very large providers of telecommunications, aerospace, defence and security, and consultancies for which the size and scale of their respective cyber security product and service divisions reflect a considerable proportion of the wider market.
Medium firm revenues have seen a slight increase in revenue share (from 14% in 2022 to 15% in 2023), increasing from £1.4 billion (14%) to £1.6 billion (15%).
Small firms have increased their cyber security related revenues from £857 million in 2022 (8% of revenues) to £893 million in 2023. However, this reflects a larger volume of small firms, and on average, small firm cyber security related revenues have decreased from £1.9 million[footnote 17] to £1.7 million (i.e., on average, small cyber security firms have experienced a decrease in 11% in revenue within the last financial year). It should be noted however that this follows on from the previous year, in which growth in small cyber security firms outstripped the wider market.
The revenue of micro firms has decreased from £313 million to £267 million, while still remaining consistent with the proportion of total sector revenue (3%). Average micro firm cyber security related revenues have fallen from approximately £300,000[footnote 18] to £240,000 (i.e., on average, micro cyber security firms have experienced a decrease of 20% in revenue within the last financial year). This may be attributable to challenging market conditions, particularly for very small cyber security advisory practices during COVID-19 and clients moving staff to ‘working from home’.
Figure 4.1: Total Cyber Security Revenue by Size of Firm
| Size | Revenue (Percentage) |
|---|---|
| Large | £7,724m (74%) |
| Medium | £1,578m (15%) |
| Small | £893m (9%) |
| Micro | £267m (3%) |
Source: Perspective Economics (n=1,979)
Segmentation of revenue by both size and by whether the firm is understood to be ‘dedicated’ or ‘diversified’ also provides an interesting overview of which firms are driving the revenue within the sector.
This highlights that ‘diversified’ firms continue to generate significant revenues through their cyber security offer. However, for Small and Medium Enterprises (SMEs), dedicated cyber security firms generate the greatest proportional revenue (i.e., c. 88% of revenues for each of the SME categories).
Figure 4.2: Total Cyber Security Revenue by Size by Dedicated / Diversified Status
| Businesses | Dedicated | Diversified |
|---|---|---|
| Large | £2,876m | £4,848m |
| Medium | £1,384m | £194m |
| Small | £793m | £100m |
| Micro | £236m | £31m |
Source: Perspective Economics (n=1,979)
This suggests that the UK market remains home to:
-
Approximately 20 ‘anchor’ large and diversified firms, which are estimated to generate over £50 million each in cyber security revenues. This can often be a very small proportion of the firm’s revenues (often in £ billions) but reflects a significant proportion of the UK’s cyber sector
-
A significant ‘dedicated’ and growing middle market: There are now 93 firms (an increase from 84 last year) that we have identified as dedicated providers of cyber security with over £10 million in annual revenues
Finally, segmentation of revenues by size and by those companies that either provide (as a core role) cyber security products, services, managed security services, or resell (set out in Figure 4.3) also provides some useful insight.
Overall, service providers (including Managed Service Providers (MSPs) and Managed Security Service Providers (MSSPs)) are generating approximately £5.7 billion in cyber security related revenues. This remains consistent with last year’s study.
The revenue of Product companies has increased to c. £4.6 billion from 2022’s report which suggested a revenue of £4.2 billion. This indicates continued growth from 2021’s report, where product companies generated c. £3.2 billion in revenue (a total increase of 44% between the 2021 and 2023 reporting periods).
Figure 4.3: Total Cyber Security Revenue by Size and by Offering
| Business | Large | Medium | Small | Micro |
|---|---|---|---|---|
| Product | £3,259m | £947m | £351m | £79m |
| Service | £2,579m | £374m | £442m | £159m |
| MSSP | £1,747m | £239m | £96m | £28m |
| Reseller | £139m | £17m | £4m | £2m |
Source: Perspective Economics (n = 1,979)[footnote 19]
4.2 Estimated employment
We estimate that there are 58,005 Full Time Equivalents (FTEs) working in a cyber security related role across the 1,979 cyber security firms identified. Please note that this figure only relates to the number of estimated FTE cyber security professionals working within cyber security sector firms.
This reflects an increase of 10% (up from 52,727 last year) in employee jobs within the last 12 months, which shows consistent growth from previous years.
Company level employment is initially estimated at the registered level (i.e., this suggests concentrated employment within Greater London and the South East is 75% of the UK figure). However, as this reflects employment at a registered level, this has the effect of underestimating employment for the other regions, whereby employers have employees across the UK. As such, in Figure 4.4, we provide the estimated ‘true’ employment breakdown by region. This estimate draws upon Perspective Economics modelling of key regional employers.
Figure 4.4: Estimated Cyber Security Employment by Region
| Businesses | Estimated Regional Employment | Registered Employment |
|---|---|---|
| Greater London | 30% | 43% |
| South East | 15% | 32% |
| North West | 10% | 6% |
| South West | 8% | 3% |
| Scotland | 7% | 2% |
| East of England | 6% | 6% |
| West Midlands | 6% | 2% |
| Yorkshire and the Humber | 5% | 1% |
| Northern Ireland | 4% | 1% |
| Wales | 4% | 1% |
| East Midlands | 3% | 1% |
| North East | 2% | 1% |
Source: Perspective Economics (n = 58,005 FTEs, estimate. Blue denotes ‘estimated true employment’ and grey is registered-level employment)
Analysis of estimated cyber security employment by company size (Figure 4.5) demonstrates that, in line with last year’s findings, most cyber security employment remains concentrated within large firms (62%). The average size of a cyber security related team has remained consistent with last year’s study, at 29 staff. Across small and micro businesses, the average team size has remained consistent with last year’s figures, with medium seeing the largest change, from an average team size of 51 in 2022 to 56 in 2023. This suggests growth in team sizes among medium-sized businesses, alongside sustained competition within the labour market.
Figure 4.5: Estimated Cyber Security Employment by Size of Firm
| Size | Number Employed |
|---|---|
| Large | 35,770 |
| Medium | 10,778 |
| Small | 8,378 |
| Micro | 3,079 |
| Grand Total | 58,005 |
Source: Perspective Economics (n= 58,005)
Figure 4.6 sets out employment segmented by ‘Dedicated’ and ‘Diversified’ firms. This suggests that employment growth has been most pronounced within ‘dedicated’ firms. This growth has remained consistent for three consecutive years, increasing from 25,241 to 29,897 to 35,646 FTEs. Overall, this suggests an increase of 10,405 (+41%) employees working in dedicated firms across three years. Comparatively, in the same timeframe, diversified employment has increased by just 5%.[footnote 20]
Figure 4.6: Estimated Cyber Security Employment by Dedicated / Diversified
| Type | Employment (Percentage) |
|---|---|
| Dedicated | 35,646 (61%) |
| Diversified | 22,359 (39%) |
Source: Perspective Economics (n = 58,005)
Figure 4.7 also sets out cyber security related employment segmented by company core offering. Just under two-thirds (63%) of employees work within a company that primarily offers cyber security services or managed services, compared to 37% that work primarily within a product environment. The number of staff working within product companies has increased from 15,278 (2021 report, 33% of cyber security staff) to 18,813 (2022 report, 36% of cyber security staff) to 21,339 (current report, 37% of cyber security staff). This suggests a trend which highlights a drive for increased employment within dedicated product firms in the UK.
Figure 4.7: Estimated Cyber Security Employment by Offering
| Type | Employment (Percentage |
|---|---|
| Service | 25,271 (44%) |
| Product | 21,339 (37%) |
| MSSP | 10,966 (19%) |
| Reseller | 429 (1%) |
Source: Perspective Economics (n=58,005)
4.3 Estimated Gross Value Added (GVA)
Gross Value Added (GVA) is used as a measure of productivity (at a firm level, or above). It captures the sum of a firm’s Gross Profit, Employee Remuneration, Amortisation and Depreciation. In this respect, any increase in GVA can highlight an improvement in the performance of a firm or a sector, as evidenced through higher profitability or enhanced earnings.
We estimate that within the most recent financial year, cyber security related GVA (for the 1,979 firms) has reached £6.2 billion. This increase reflects continued and substantial growth in recent years[footnote 21], and suggests improved profitability and remuneration across the firms.
Figure 4.8 sets out an overview of GVA (compared to revenue) by size of firm.
Overall, this data suggests an improved GVA-to-turnover ratio of 0.6:1 (i.e., for every £1 of revenue the sector generates, 60p in direct GVA is generated, compared to 52p last year).
Figure 4.8: Total Cyber Security Revenue and GVA by Size of Firm
| Businesses | Estimated Cyber Security Related Revenue | Estimated Cyber Security Related GVA |
|---|---|---|
| Large | £7,724m | £4,335m |
| Medium | £1,578m | £1,062m |
| Small | £893m | £649m |
| Micro | £267m | £183m |
Source: Perspective Economics (n=1,979)
4.4 Summary of economic contribution
The table below sets out the key findings regarding the economic contribution of the UK’s cyber security sector.
Table 4.1: Summary of Cyber Sector Economic Contribution
| Size | Number of Firms | Estimated Revenue (Cyber Security Related) | Estimated GVA (Cyber Security Related) | Estimated Employment (FTE) (Cyber Security Related) | Estimated Revenue per employee | Estimated GVA per employee |
|---|---|---|---|---|---|---|
| Large | 165 | £7,724m | £4,335m | 35,770 | £215,949 | £121,185 |
| Medium | 192 | £1,578m | £1,062m | 10,778 | £146,376 | £98,489 |
| Small | 525 | £893m | £649m | 8,378 | £106,646 | £77,454 |
| Micro | 1,097 | £267m | £183m | 3,079 | £86,650 | £59,286 |
| Grand Total | 1,979 | £10,462m | £6,228m | 58,005 | £180,371 | £107,366 |
Overall, since last year’s study, the following changes to the key metrics are noted:
-
The number of active cyber security firms (tracked in this study) has increased from 1,838 to 1,979
-
Cyber security related revenues for these firms has increased from £10.1 billion to £10.5 billion (an increase of 4%)
-
Cyber security related GVA for these firms has increased from £5.3 billion to £6.2 billion (an increase of 17%)
-
Estimated revenue per employee has decreased, from c. £192,400 to c. £180,400 (a decrease of 6%)
-
Estimated GVA per employee has increased from c. £101,019 to c. £107,366 (an increase of 6%). This is higher than the most recent estimated GVA per employee for the DCMS Digital Sector (DCMS Economic Estimates) of £79,400 per employee,[footnote 22] suggesting that Cyber Security GVA is 35% higher than the wider Digital Sector. Please note that this is an estimate only, and these figures are derived from different methodologies
5. Investment in the UK cyber security sector
5.1 Introduction
This section draws upon the Beauhurst platform which tracks announced and unannounced investments in high-growth companies from across the UK. Our team has matched Company Registration Numbers and Company Names identified within this current analysis with the platform to identify 1,047 fundraisings[footnote 23] associated with 439 tracked companies. In other words, approximately 1 in every 5 firms identified within our analysis has received some form of external investment or fundraising. This chapter focuses on investment activity within the full year of 2022 (1st January – 31st December), and typically explores investment raised by dedicated cyber security firms.
5.2 Investment to date
The investment timeline (Figure 5.1) demonstrates that 2022 has been a more challenging year for cyber security investment than previous years, with over £500 million raised in 2022 across 96 deals. This includes £302 million raised across 76 deals within dedicated cyber security firms, which we focus on subsequently. Whilst this figure reflects a substantial decrease in the value of investment raised compared with dedicated 2020 (£814 million) and 2021 (£1,013 million) levels, we note that:
-
The number of deals in dedicated cyber security firms remains relatively robust (76 deals in 2022 compared with 86 in 2021). This suggests that early-stage and smaller firms have still been able to secure equity investment in 2022; however, business valuations and demand for external investment may be impacted by wider and global macroeconomic conditions such as higher interest rates[footnote 24] and a potential ‘tech slowdown’[footnote 25]. Indeed, similar downward trends are being experienced across other tech sectors such as Fintech[footnote 26], AI and Cleantech[footnote 27]
-
In 2020 and 2021, there were a number of very large investment rounds raised by some dedicated cyber security firms in the UK, with firms such as Snyk raising over £400 million through Series F, OneTrust raising a Series C investment, and Immersive Labs raising over £53 million. This resulted in high levels of sectoral investment at the aggregate level
-
In contrast, only seven dedicated UK cyber security firms have raised more than £10 million in 2022, highlighting a reduction in much larger investment rounds in UK firms. Many medium and smaller firms in the cyber security ecosystem may also be exploring other routes to growth such as mergers and acquisitions outside of VC investment
-
This data is also highly subject to variation, as a small number of very large investments can significantly impact quarterly and annual trends. As such, we consider that the UK cyber security investment landscape is broadly similar to 2019 levels, which may reflect a ‘return to normal’, rather than a significant loss of investor confidence or engagement
-
Wider VC market intelligence[footnote 28] also suggests that ‘dry powder’ (i.e. the funding VC have available to potentially invest in firms) remains strong, and that this will need to be deployed as valuations normalise in the coming months, particularly as VCs have sustained interest in investing in deeply technical early-stage cyber security firms
This last point was raised in our stakeholder consultations with investors, with UK cyber security investors mentioning:
“The UK is very strong in cyber security R&D. There are a lot of early-stage companies developing lots of interesting technologies. There are plenty of spin-outs, academic know-how, all the way through to people developing new solutions at home.”
“The UK is an attractive place to invest in [for cyber security]. I expect there will be more [VC firms] chasing opportunities in the coming months, and that will drive up valuations.”
“London continues to be an epicentre for investment, but we are seeing [research] strengths across the UK, in areas such as Manchester, Cheltenham, Belfast, Lancaster and Edinburgh”.
Feedback from UK Cyber Security Investors (VC firms)
Please note all subsequent analysis focuses on investment in dedicated cyber security firms only.
Figure 5.1: Investment Timeline
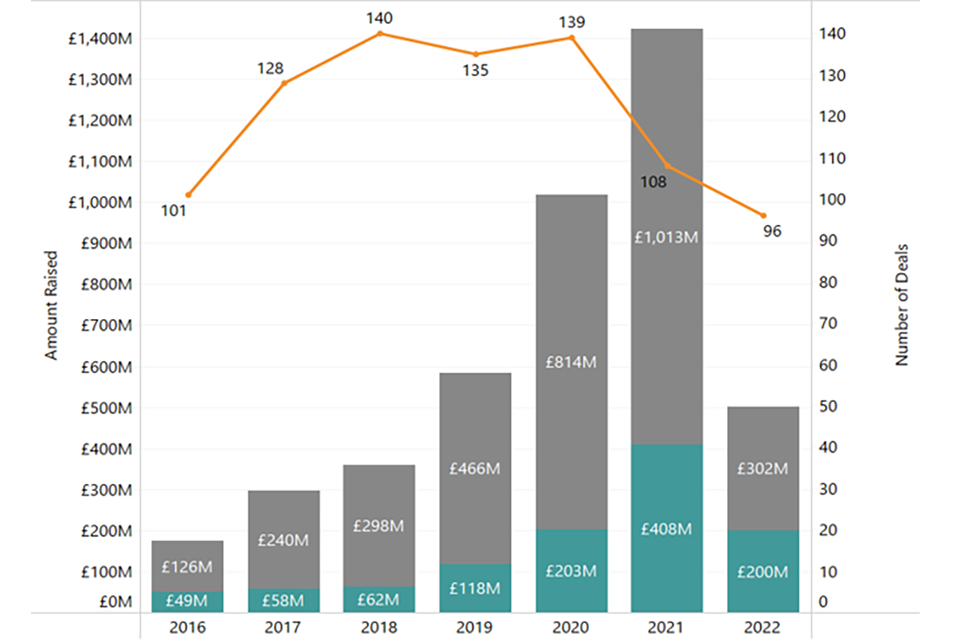
Investment timeline, showing the amount of investment raised and the number of deals in each of the years between 2016 and 2022.
Source = Beauhurst (note, blue = diversified, grey = dedicated, orange = number of deals)
Figure 5.2 highlights the quarterly value and volume of investment raised by dedicated cyber security firms in the UK. This demonstrates that the majority of investment (£193 million across 24 deals) was secured in Q1 2022, and has reduced thereafter, particularly given some of the wider macroeconomic conditions mentioned previously. As highlighted, this is being experienced across the wider tech sector and broader economy, and we expect that 2023 levels should normalise as valuations stabilise, and as funds explore new opportunities for deals with UK cyber security start-ups that show strong commercial performance and potential.
Figure 5.2: Investment Timeline[footnote 29] (Quarterly, Dedicated Cyber Security Investment)
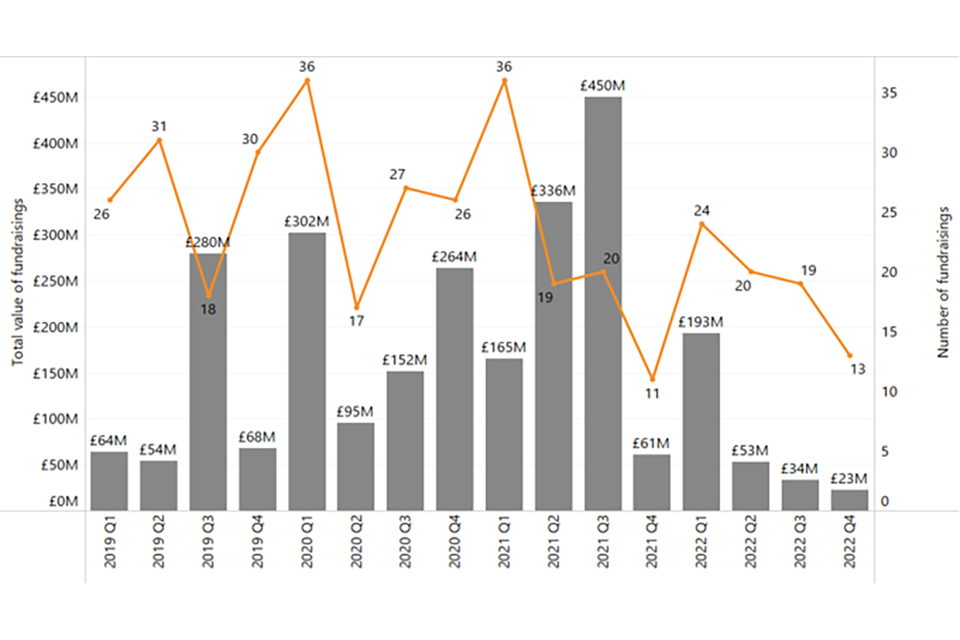
Quarterly investment timeline, showing the amount of investment raised and the number of deals in each quarter between Q1 2019 and Q4 2022.
Source: Beauhurst
5.3 Investment by location
Figure 5.3 sets out an overview of investment performance within cyber security by UK region, with respect to value and volume of investment. This highlights that the majority of investment raised (75%) is within cyber security firms based in London and the South East. However, this is lower than 2021’s figure of 91%, suggesting increased investor interest across the UK regions, particularly in areas such as the North West and South West of England in 2022.
As with the previous two annual studies, 8 of the UK regions generate less than 1% of the UK total each, which highlights sustained disparity with respect to large scale investments. However, as shown by the number of deals, which has remained relatively robust in 2022, many of the regions are home to early-stage companies that could be feasibly supported to secure investments in the future.
In 2022, there was strong alignment between the need to support regional start-ups secure investment and DCMS support for initiatives such as UK Cyber Cluster Collaboration (UKC3) and Cyber Runway, in which regional events to support cyber start-ups took place in cities including Sheffield, Glasgow, Dundee, Belfast, Bristol, and Manchester.
Figure 5.3: Total Investment (Value and Volume, 2022)
| Region | Value - Amount Raised (Percentage) |
|---|---|
| Greater London | £186.1m (62%) |
| South East | £39.4m (13%) |
| North West | £38.1m (13%) |
| South West | £25.7m (9%) |
| West Midlands | £4.5m (1%) |
| Northern Ireland | £2.4m (1%) |
| East of England | £2.1m (1%) |
| Wales | £1.5m (1%) |
| Yorkshire and The Humber | £0.7m (0%) |
| North East | £0.6m (0%) |
| East Midlands | £0.6m (0%) |
| Region | Volume - Number of deals (Percentage) |
|---|---|
| Greater London | 36 (47%) |
| South East | 13 (17%) |
| North West | 6 (8%) |
| East of England | 6 (8%) |
| South West | 5 (7%) |
| Wales | 3 (4%) |
| North East | 2 (3%) |
| East Midlands | 2 (3%) |
| Yorkshire and the Humber | 1 (1%) |
| West Midlands | 1 (1%) |
| Northern Ireland | 1 (1%) |
Source: Beauhurst (2022)[footnote 30]
5.4 Investment by size
Figure 5.4 sets out the volume of investment by company size within the cyber security sector in 2022. The previous study set out that in 2021, only 15% of investment was raised by small and micro level firms (i.e. fewer than 50 staff), with the remainder raised by large (15%) and medium (70%) firms.
As the total value of investment in dedicated firms has fallen by approximately 70% in 2022, this has affected investment by company size. Beauhurst data suggests that in 2022:
-
Medium sized firms (50-249 employees) have raised £93 million (31%) across 8 deals
-
Small firms (10-49 employees) have raised £187 million (62%) across 40 deals
-
Micro firms (1-9 employees) have raised £22 million (7%) across 28 deals
This means that the reduction in investment raised by dedicated cyber security firms in 2022 is predominantly due to the reduction in higher value deals raised among large and medium firms.
Indeed, despite the wider conditions, small firms have increased investment raised by 67% (from £112 million in 2021 to £187 million in 2022), suggesting that investors continue to be interested in deep technical capability and potential among some of the UK’s dedicated cyber start-ups.
Figure 5.4: Total Investment by Company Size (2022)
| Size | Amount raised (Percentage) |
|---|---|
| Medium | £93m (31%) |
| Small | £187m (62%) |
| Micro | £22m (7%) |
Source: Beauhurst (2022)
5.5 Investment by company type
Figure 5.5 highlights how investment preference for companies that primarily offer cyber security products has continued in 2022, with 78% of the volume of investments, and 91% (£275 million) of the respective investment value.
Figure 5.5: Investment by Product / Service Offer (2022)
| Type | Percentage (Count) |
|---|---|
| Product | 59 Investments (78%) |
| Service | 15 Investments (20%) |
| MSP | 2 Investments (3%) |
| Type | Amount Raised (Percentage |
|---|---|
| Product | £275.1m (91%) |
| Service | £11.4m (4%) |
| MSP | £15.3m (5%) |
Source: Beauhurst (2022)
6. Supporting the growth of the sector
6.1 Introduction
In late 2022, the research team held a series of qualitative consultations with a range of cyber security businesses, investors, and economic development leads to gather views about funding and support received, regional engagement, growth, and support needs in the UK cyber security sector. The following provides a summary of this support.
6.2 Recent investments and support initiatives
The National Cyber Strategy 2022 sets out how the government has sought to support the growth of the cyber security sector, through a blend of direct investment in accelerators and growth initiatives, skills and profession support, investment in regions and clusters, and as a key buyer of cyber security products and services.
Some of these initiatives[footnote 31] are summarised below:
Growing the sector and exports, and promoting regional growth:
-
Helping cyber businesses find international markets. The UK exported £5 billion of cyber services in 2021[footnote 32]. Section 6.4 explores export activity among UK cyber security firms identified through the business survey
-
Running Cyber Exchange, a portal for cyber security businesses across all regions of the UK
-
The Cyber Growth Partnership has been bringing government and industry together to break barriers to growth
-
The UK Cyber Cluster Collaboration (UKC3) is building partnerships between industry, academia and local government to ensure opportunities and expertise are available across the regions
Supporting businesses to grow and scale:
-
Running initiatives such as NCSC for Startups to help address some of the most important strategic challenges in cyber security
-
Providing funding for schemes such as Cyber Runway, which supports innovators to launch, grow and scale their business – building on the success of LORCA, HutZero, Cyber101 and the Tech Nation Cyber Programme
-
Supporting the commercialisation of academic research in cyber security through CyberASAP (Cyber Security Academic Startup Accelerator Programme), led by the Innovate UK Knowledge Transfer Network (KTN)
Encouraging new entrants into the cyber security sector to help tackle the skills gap:
-
The CyberFirst bursary scheme supports undergraduate students and is delivering hundreds of individuals, with work experience, into the cyber workforce every year
-
The CyberFirst courses, Discovery, and Explorers programmes have engaged more than 300,000 young people aged 11-17 in the last five years
-
There are now several cyber apprenticeship standards that have been designed by industry and three cyber offerings for initial learning outcomes offered through the DfE ‘Courses for Jobs’ initiative
-
There have been several cyber bootcamps supported through the recent National Skills Fund, taking people into cyber careers
Professionalising the cyber security workforce:
-
The UK Cyber Security Council is a world-first professional authority for cyber security. It has begun to set clear and consistent professional standards, building on all the work that existing professional bodies have done to date
-
The Cyber Security Body of Knowledge (CyBOK) informs and underpins education and professional training for the cyber security sector
These initiatives help to address a range of barriers faced by cyber security businesses. Within this year’s study, survey respondents were asked the extent to which the following barriers impacted their business to some or a great extent.
These barriers remain consistent with previous years; however, the number of businesses noting that staff moving or retiring is a significant challenge has increased from 15% to 24% (as shown in Figure 6.1), suggesting that firms are facing both a challenging labour market, but also loss of existing talent.
Figure 6.1: Barriers reported by cyber security businesses (“to a great extent / to some extent”)
| Challenge | Percentage |
|---|---|
| A lack of candidates in the labour market that have the technical cyber security skills needed | 44% |
| Competition for candidates from other businesses in the cyber sector | 42% |
| Salary demands of candidates are not affordable | 41% |
| A lack of candidates in the labour market that have non-technical skills such as communication, leadership, management, or sales and marketing skills | 32% |
| Competition for candidates from other businesses outside the cyber sector | 27% |
| Your existing employees lacking non-technical skills such as communication, leadership, management, or sales and marketing skills | 24% |
| Staff moving jobs or retiring | 24% |
| Your existing employees lacking the technical cyber security skills that you need | 22% |
Source: Ipsos (n = 220)
6.3 Engagement with other regional bodies and organisations
Types of partnerships and engagement
In the business survey, 70% of cyber security businesses said they engaged[footnote 33] with at least one other type of organisation, with 41% engaging with another cyber security business, 35% attending meetup events, 34% engaging with a university or higher education provider, and 30% engaging with other public sector bodies. This was also reflected in the qualitative interviews where businesses described partnerships and engagement opportunities coming about through several sources, such as events, personal contacts, and connections in industry, academia and local organisational groups.
Some businesses engaged with their local Cyber Security Clusters, Cyber Resilience Centres and local business organisations. In some cases, engagement with these local organisations began through university-hosted networking events, while in other cases businesses were invited by people in their network to help establish or to join a group. This was particularly the case for some of the larger businesses that were interviewed. The involvement of large, recognised businesses was considered a form of endorsement by many smaller businesses looking to find opportunities to increase their own presence and sales.
Engagement with universities was a common theme among cyber security businesses. In some cases, the business started as a spin-off from a university research project, while other business leaders described having existing ties with universities, such as through visiting lectureships or research collaborations. Other forms of engagement with the public sector and the charity sector came through referrals and pro-bono work. Some participants described how former contacts or customers in the public sector referred NHS trusts, police forces and local authorities to cyber security companies, while another described doing pro-bono work for charities on cyber hygiene, which then led to an ongoing partnership.
Benefits and challenges
Cyber security businesses described a number of benefits to partnerships and engagement with other local organisations, as well as several challenges.
Some participants felt Cyber Resilience Centres were a good way to get their name ‘out in the market’ and reported receiving a large number of referrals through these networks. Cyber Security Clusters were also considered good ways to hear about new opportunities, particularly those looking for opportunities to work with the public sector or in sectors that were particularly active in their region. One participant who did not see any commercial or financial benefit from participating in clusters nonetheless felt that cluster had raised their business’ maturity and knowledge of the cyber ecosystem.
“Maturity has been enhanced by understanding the wider operating environment better.” Cyber security business
Participants described a number of benefits of partnering with universities, including access to the latest research, recruitment among graduates, networking events hosted by universities, and the ability to contribute to the curriculum. One participant said they contributed ‘informally’ to the curriculum by helping review and guide student projects. This not only helped the business to identify potential recruits, but also gave students a better understanding of the cyber security marketplace.
“[Attending our Cyber Security Cluster] gives us a regular heartbeat of engagement with universities – access to research, providing ideas, new products, access to skills and designing better syllabuses.” Cyber security business
Partnering with local businesses and charities was also described as a benefit to businesses, allowing businesses to hone their products or services to what customers really needed. One participant noted this served as a ‘reality check’ for the business, which also helped them to develop their own technicians’ client-facing skills.
“[Partnering with local businesses and charities gave us] a better local understanding, coal-face view of what SMEs and local organisations are struggling with. It was a reality check for what cyber resilience means to most businesses in the UK and very useful for developing our own people.” Cyber security business
However, businesses also described a number of challenges associated with partnerships or local engagement.
Finding new opportunities is a key reason for engaging with other organisations, but some participants felt this need was not being met. While Cyber Security Clusters were considered useful for networking, there was mixed feedback regarding varying levels of activity (i.e. some were more active than others). In addition, some participants felt Cyber Resilience Centres had started competing in some of the spaces that their business operated in, for example, offering cyber support services. Among some participants, there was also confusion about what the roles of Cyber Security Clusters and Cyber Resilience Centres were in the ecosystem.
At the same time, some participants noted that the cyber security sector was becoming more diversified, and would probably benefit from more specialised clusters. For example, one participant felt that most businesses involved in their cluster were security testers, which meant other areas of cyber security received less attention.
A challenge associated with university partnerships was the perceived disconnect between the curriculum and current market needs. This meant the university system might not be teaching the sorts of techniques and skills that the market needs. However, there was a recognition that cyber security is a fast-moving market and that change to university curricula is generally much slower. This led to some businesses finding new ways to get involved, such as supporting student projects, offering practical workshops or supporting apprenticeships.
“It’s not easy for [universities] to change what they teach. Syllabus change is dreadfully slow and inflexible … but we [the business] feedback what clients want and what’s hot in the marketplace.” Cyber security business
There were also some challenges with partnering with non-cyber organisations. Businesses offering training or compliance-based services found it challenging to get other organisations to understand the added value of a partnership, particularly if security or compliance was viewed as a barrier or box-ticking exercise.
“Compliance has meant a lot of things are ‘box-ticking’ but [good practices] are not being embedded.” Cyber security business
Government involvement
Participants mentioned several ways in which government involvement could support and enhance the cyber security ecosystem in the UK.
Local government involvement in regional clusters and organisations was considered key in maintaining the diversity of participating organisations, as they could provide localised co-ordination.
“Networks are valuable if there’s diversity in membership – sector, size, scale – so local government involvement would enhance this.” Cyber security business
Participants felt that central government could have a role in co-ordinating the various regional initiatives to help maintain a direction of travel for cyber businesses based on clear strategies and policies, and to help signpost customers to high-quality cyber businesses. Central government involvement was perceived as a form of endorsement, lending credibility to the network, event or organisation. One participant suggested the involvement of large, well-known companies would also have a similar impact.
“Customers want to know what to get based on what’s coming.” Cyber security business
Participants also felt that the UK should continue to support accelerator schemes and interventions, and that initiatives such as Cyber Runway, NCSC for Startups, and CyberASAP had been particularly useful in growing the cyber security ecosystem.
“The UK should continue to support accelerators, and enable companies, government, and academia to work together on grand challenges.” Cyber security investor
6.4 Cyber security exports
In December 2022, the Department for International Trade published updated UK Defence and Security Export Statistics for 2021. This suggested that UK cyber security exports have grown from approximately £4.2 billion in 2020 to £5 billion in 2021 (an increase of c. 20%).
Within this year’s survey, cyber security businesses were asked if they exported, and if so, what and to which regions.
In Figure 6.2, just under two-fifths of businesses (39%) reported that they exported products or services, of which the majority exported to the European Union (78% of exporters), and North America (58% of exporters)
Figure 6.2: Export Regions (for businesses that export)
| Export Region | Percentage |
|---|---|
| The European Union | 76% |
| North America | 58% |
| Asia-Pacific, including East Asia, South Asia, Southeast Asia, Australia, and New Zealand | 35% |
| The Gulf states, including Bahrain, Iraq, Kuwait, Oman, Qatar, Saudi Arabia, the United Arab Emirates and Yemen | 29% |
| Wider Europe, outside of the European Union (including Israel) | 28% |
| Africa | 13% |
| Central or South America | 12% |
Source: Ipsos (n=86)
6.5 Public procurement
Public procurement plays a crucial role in the health of the cyber security sector, and for improving public sector engagement with innovative cyber security start-ups and techniques. This includes where cyber security firms are able to sell products, services, and solutions to public sector buyers such as central and local government, law enforcement and policing, NHS, schools etc. In previous years, we have used Tussell data to identify cyber security related contract notices. For transparency, this measures the number and value of public contracts awarded to UK registered firms related to cyber security. It excludes the award of framework contracts as these can be difficult to identify exact government spending, where the contract value is the same as the framework maximum budget.
Figure 6.3 highlights the significance of public procurement in growing the UK cyber security ecosystem. In 2022, we have identified 655 contracts awarded to UK cyber security businesses to the value of £641 million. This is an increase of £223 million (+53%) since last year’s study.
Within the qualitative research, many investors raised the importance of UK cyber security start-ups being able to work with the public sector to help address national security needs and develop new solutions.
Figure 6.3: Cyber Security Contracts (Value and Volume)
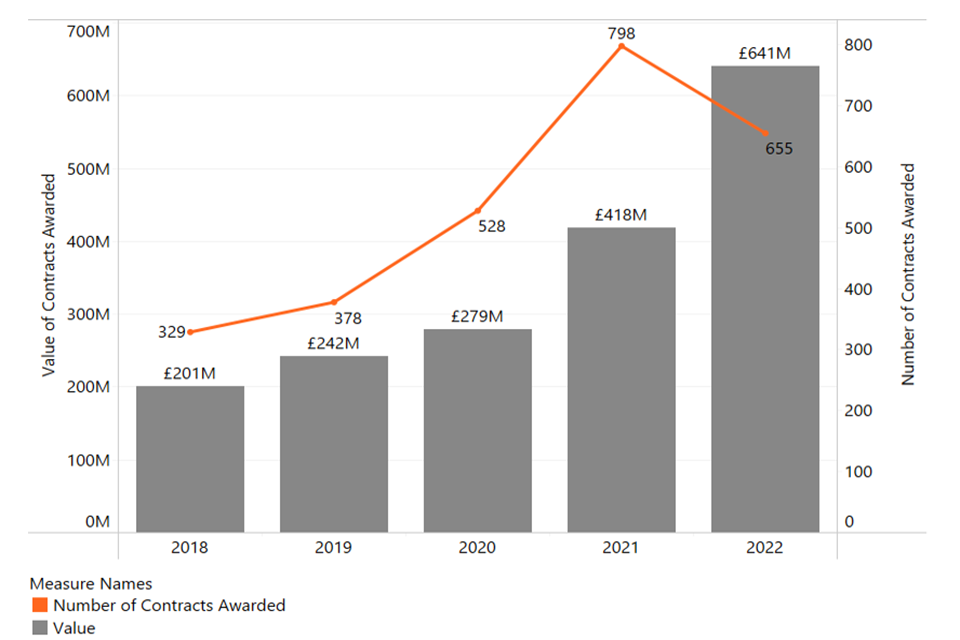
A chart showing cyber security contracts (value in £ and number of contracts) each year between 2018 and 2022.
Source: Tussell[footnote 34] (data source on UK government spend and contracts).
Regional snapshots
Introduction
Whilst this report focuses upon the cyber security sector across the entire UK, we set out snapshots[footnote 35] of the number of cyber security firms, offices, and estimated percentage of UK cyber security related employment.
East Midlands
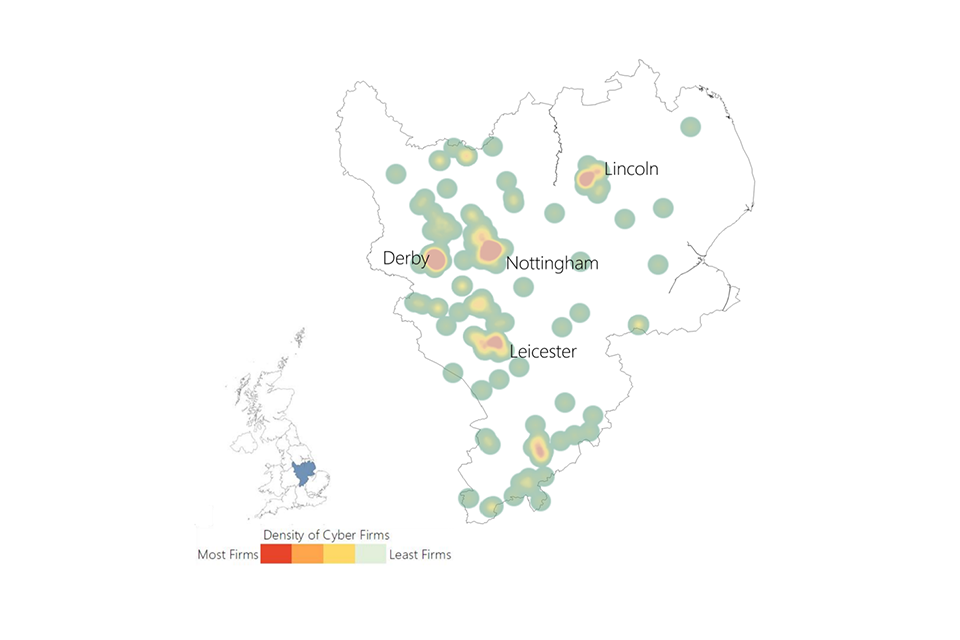
A heat map showing the location of cyber security firms in the East Midlands
| East Midlands | Number of Registered Offices | Total Number of Active Offices |
| 77 | 189 | |
| Percentage of UK Cyber security offices | Estimated percentage of UK based cyber security employment | Mean Advertised Salaries (2022) in core cyber security roles |
| 4% | 3% | £53,700 |
East of England
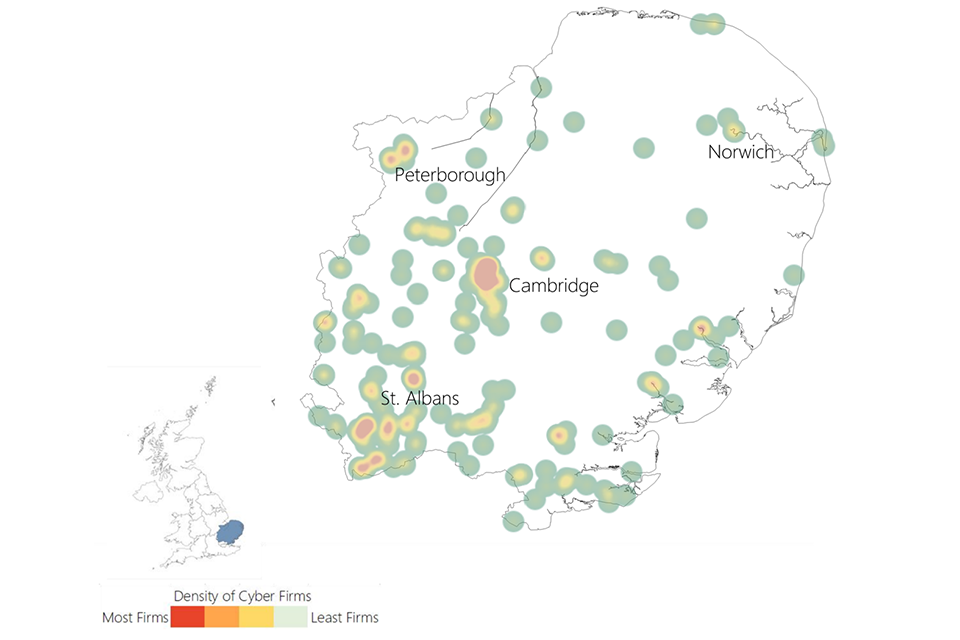
A heat map showing the location of cyber security firms in the East of England
| East of England | Number of Registered Offices | Total Number of Active Offices |
| 142 | 313 | |
| Percentage of UK Cyber security offices | Estimated percentage of UK based cyber security employment | Mean Advertised Salaries (2022) in core cyber security roles |
| 6% | 6% | £56,500 |
Greater London
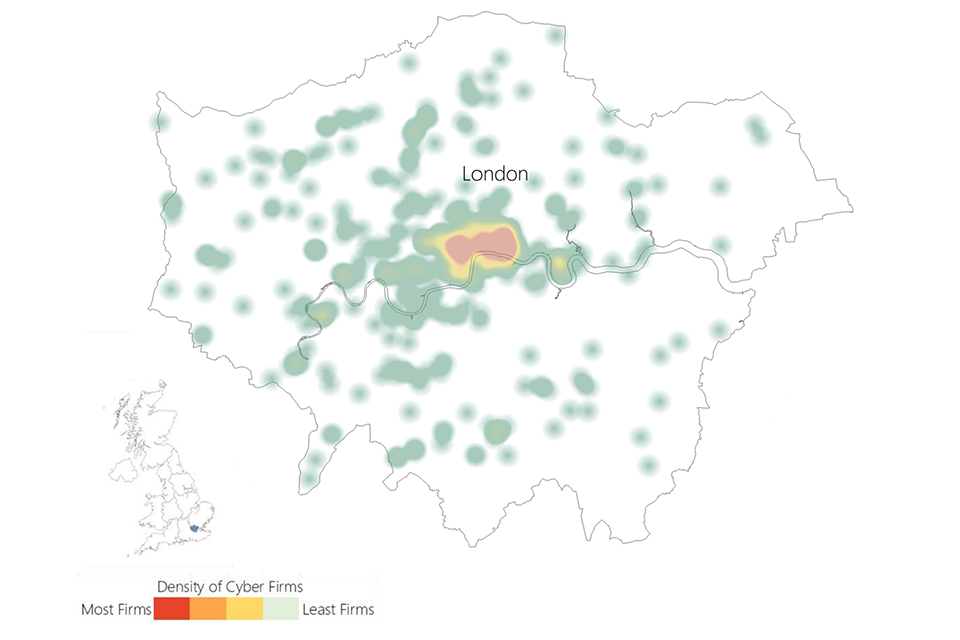
A heat map showing the location of cyber security firms in Greater London
| Greater London | Number of Registered Offices | Total Number of Active Offices |
| 655 | 1,504 | |
| Percentage of UK Cyber security offices | Estimated percentage of UK based cyber security employment | Mean Advertised Salaries (2022) in core cyber security roles |
| 31% | 30% | £71,000 |
North East
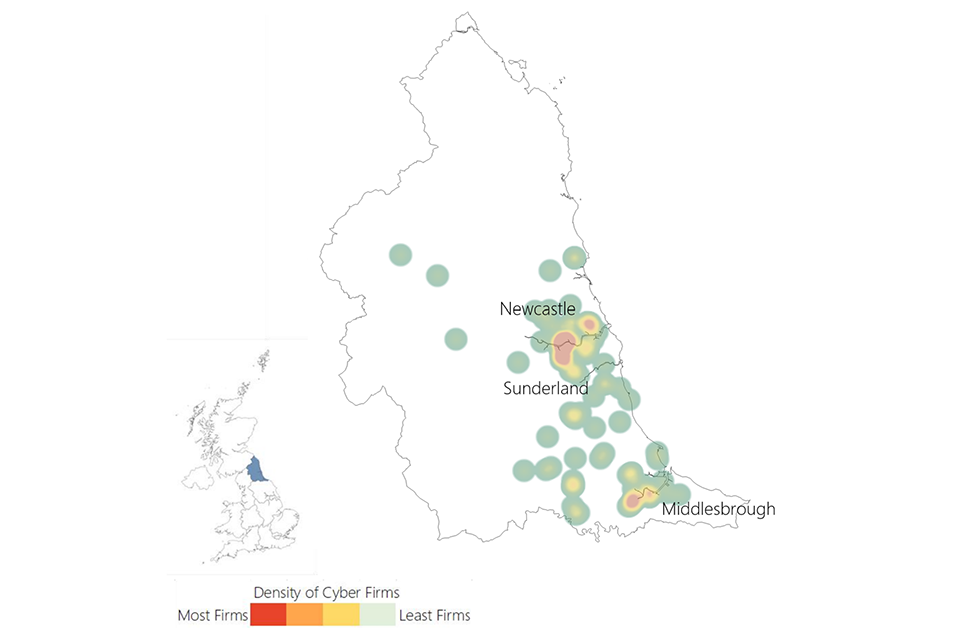
A heat map showing the location of cyber security firms in the North East
| North East | Number of Registered Offices | Total Number of Active Offices |
| 49 | 141 | |
| Percentage of UK Cyber security offices | Estimated percentage of UK based cyber security employment | Mean Advertised Salaries (2022) in core cyber security roles |
| 3% | 2% | £55,300 |
North West
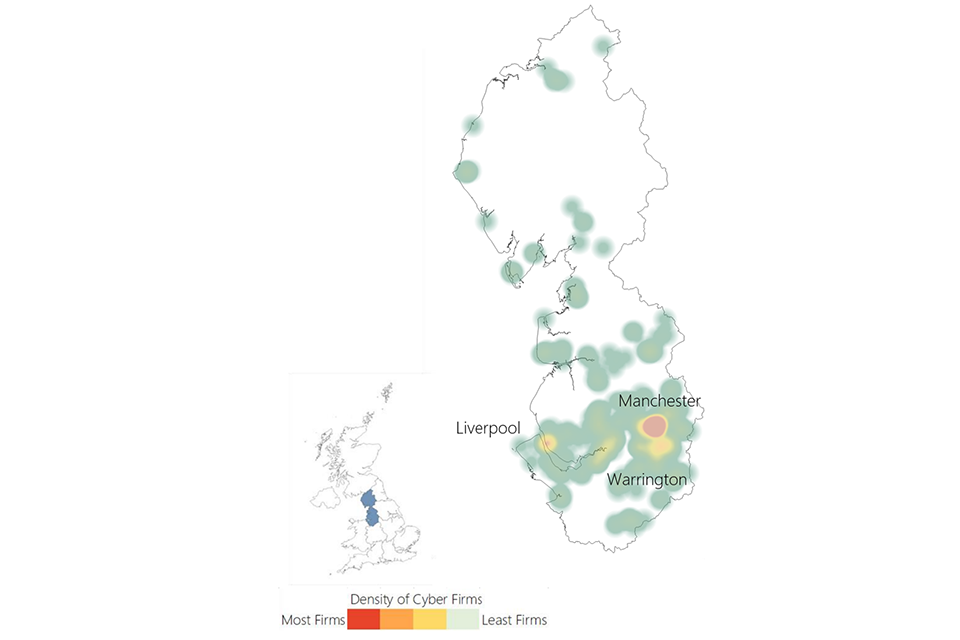
A heat map showing the location of cyber security firms in the North West
| North West | Number of Registered Offices | Total Number of Active Offices |
| 144 | 456 | |
| Percentage of UK Cyber security offices | Estimated percentage of UK based cyber security employment | Mean Advertised Salaries (2022) in core cyber security roles |
| 9% | 10% | £56,800 |
South East
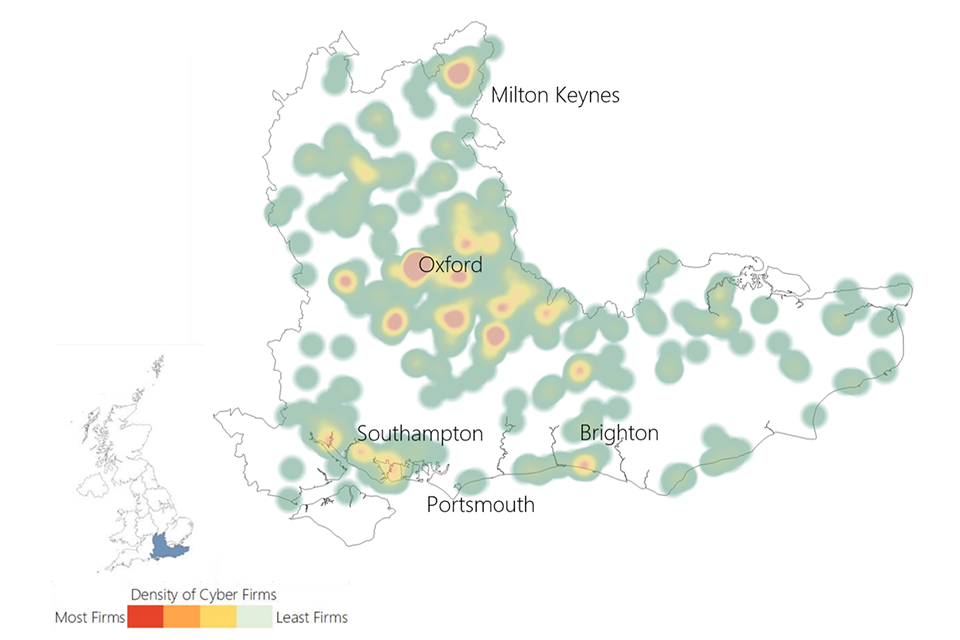
A heat map showing the location of cyber security firms in the South East
| South East | Number of Registered Offices | Total Number of Active Offices |
| 395 | 861 | |
| Percentage of UK Cyber security offices | Estimated percentage of UK based cyber security employment | Mean Advertised Salaries (2022) in core cyber security roles |
| 18% | 15% | £54,700 |
South West
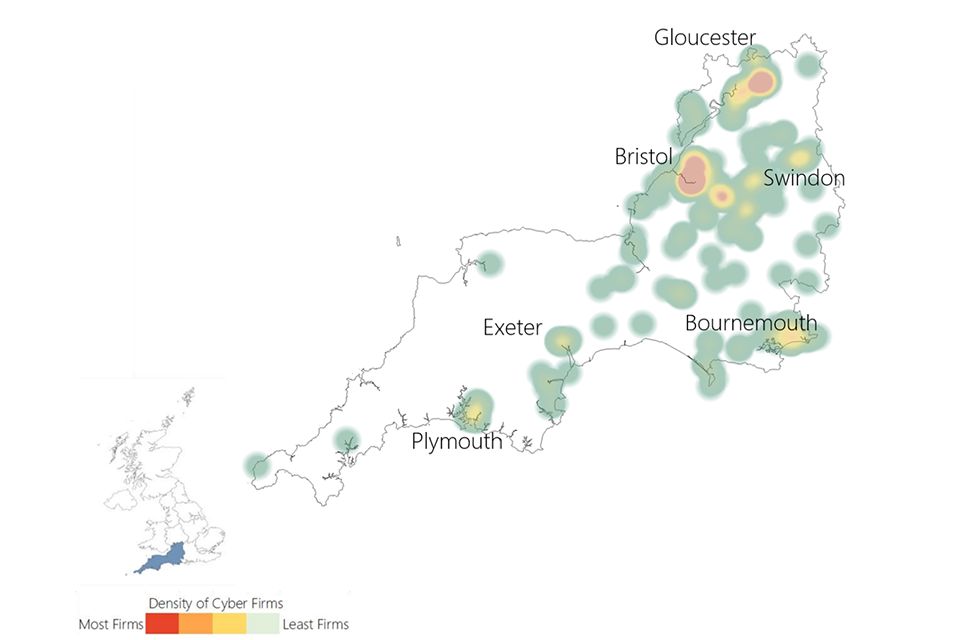
A heat map showing the location of cyber security firms in the South West
| South West | Number of Registered Offices | Total Number of Active Offices |
| 137 | 382 | |
| Percentage of UK Cyber security offices | Estimated percentage of UK based cyber security employment | Mean Advertised Salaries (2022) in core cyber security roles |
| 8% | 8% | £55,700 |
West Midlands
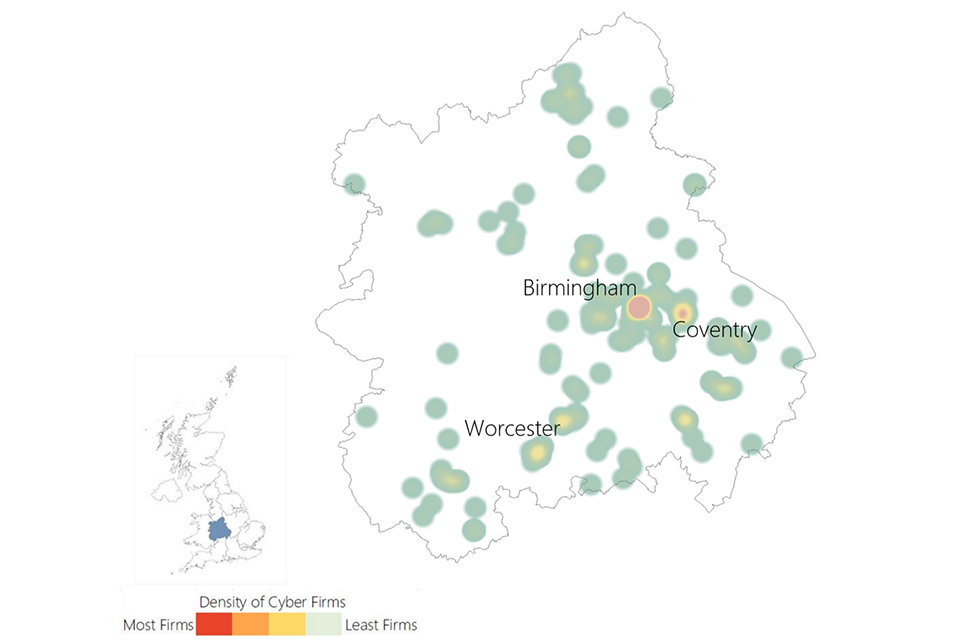
A heat map showing the location of cyber security firms in the West Midlands
| West Midlands | Number of Registered Offices | Total Number of Active Offices |
| 95 | 248 | |
| Percentage of UK Cyber security offices | Estimated percentage of UK based cyber security employment | Mean Advertised Salaries (2022) in core cyber security roles |
| 5% | 6% | £57,100 |
Yorkshire and the Humber
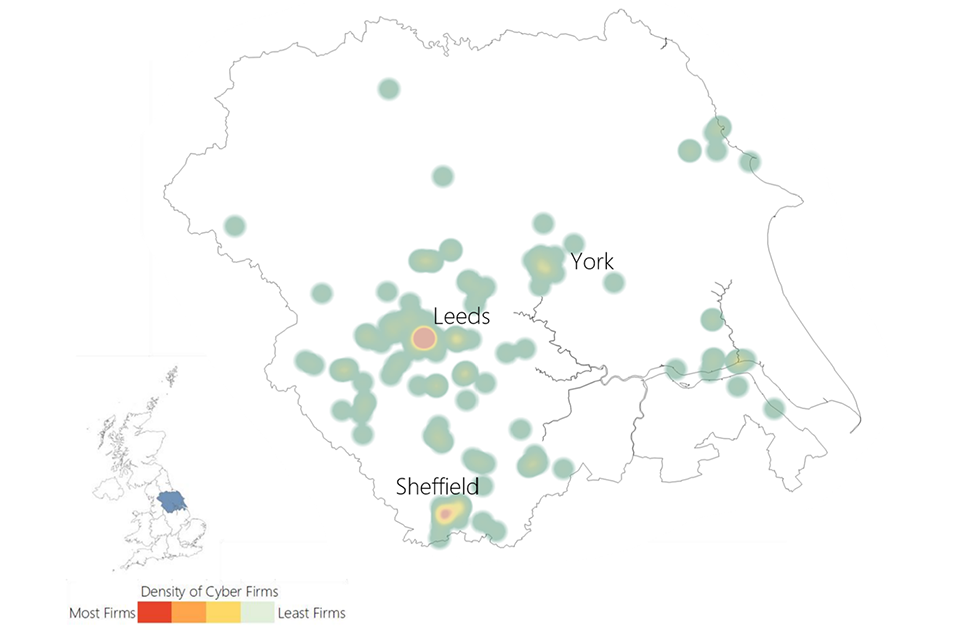
A heat map showing the location of cyber security firms in Yorkshire and the Humber
| Yorkshire and the Humber | Number of Registered Offices | Total Number of Active Offices |
| 75 | 223 | |
| Percentage of UK Cyber security offices | Estimated percentage of UK based cyber security employment | Mean Advertised Salaries (2022) in core cyber security roles |
| 5% | 5% | £55,100 |
Northern Ireland
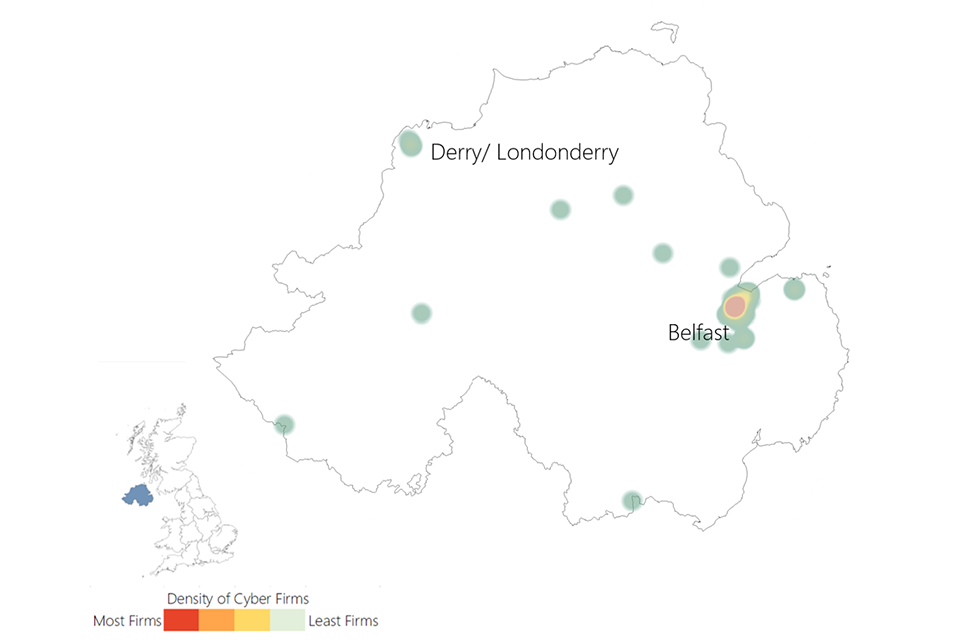
A heat map showing the location of cyber security firms in Northern Ireland
| Northern Ireland | Number of Registered Offices | Total Number of Active Offices |
| 43 | 115 | |
| Percentage of UK Cyber security offices | Estimated percentage of UK based cyber security employment | Mean Advertised Salaries (2022) in core cyber security roles |
| 2% | 4% | £53,800 |
Scotland
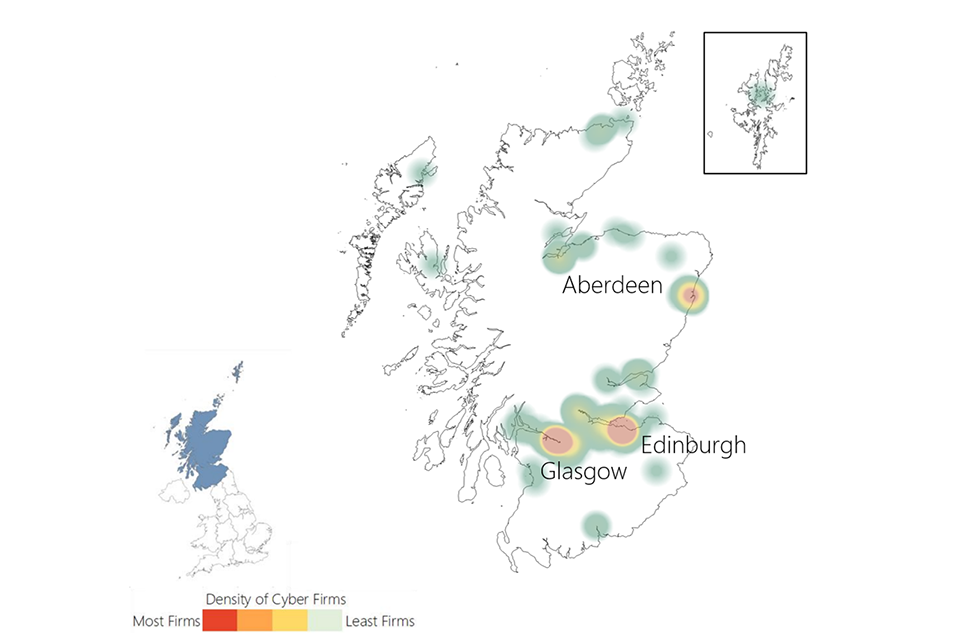
A heat map showing the location of cyber security firms in Scotland
| Scotland | Number of Registered Offices | Total Number of Active Offices |
| 118 | 400 | |
| Percentage of UK Cyber security offices | Estimated percentage of UK based cyber security employment | Mean Advertised Salaries (2022) in core cyber security roles |
| 8% | 7% | £54,500 |
Wales
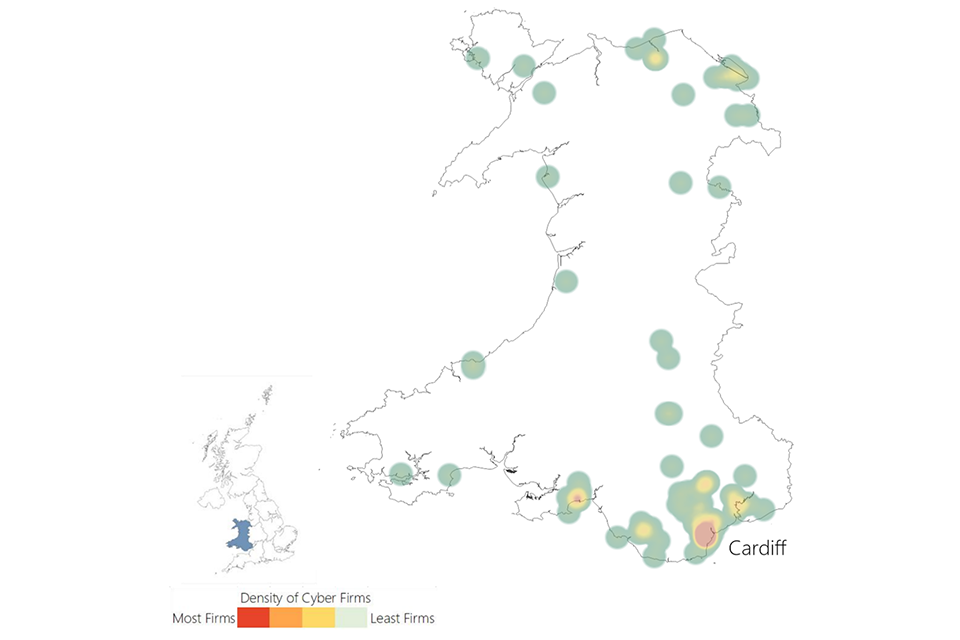
A heat map showing the location of cyber security firms in Wales
| Wales | Number of Registered Offices | Total Number of Active Offices |
| 49 | 138 | |
| Percentage of UK Cyber security offices | Estimated percentage of UK based cyber security employment | Mean Advertised Salaries (2022) in core cyber security roles |
| 3% | 4% | £52,200 |
Report authors
Sam Donaldson, Perspective Economics
David Crozier, Centre for Secure Information Technologies (CSIT)
Sergi Martorell and Iain McLaren, glass.ai
Jamie Douglas and Steven Coutinho, Ipsos
Appendices
A: Overview of sources
The data sources used to underpin the sectoral analysis included:
-
glass.ai: We partner with web-scale intelligence providers glass.ai to use web data to help identify and map new providers of cyber security products and services, and match these to the cyber security taxonomy
-
Bureau van Dijk FAME: (and Companies House Data Product): This platform collates Companies House data and financial statements from all registered businesses within the UK
-
Beauhurst: Beauhurst is a leading investment analysis platform, which enables users to discover, track and understand some of the UK’s high-growth companies e.g. identify investment, accelerator participation, and key information
-
Tussell: Tussell provides market insight into public sector procurement through identifying key contracts, spend, buyers and suppliers
-
Cyber Exchange: techUK’s Cyber Exchange directory enables cyber security providers to register an account and set out the products and services they provide to the market
-
Representative survey of cyber security firms: In Summer 2022, Ipsos conducted a representative survey of cyber security firms. The feedback from 220 providers has been highly useful to understand the financial performance, growth drivers, and challenges for firms within the market
-
One-to-one consultations: Further, the team has also conducted 22 one-to-one consultations with investors, market providers and economic development leads, to gather feedback on the growth and performance of the cyber security sector in the UK
B: Taxonomy and definitions
| Taxonomy category | Agree definition (short) |
|---|---|
| Cyber professional services | Providing trusted contractors or consultants to advise on, or implement, cyber security products, solutions, or services for others |
| Endpoint and mobile security | Hardware or software that protects devices when accessing networks |
| Identification, authentication, and access controls | Products or services that control user access, for example with passwords, biometrics, or multi-factor authentication |
| Incident response and management | Helping other organisations react, respond, or recover from cyber attacks |
| Information risk assessment and management | Products or services that support other organisations to manage cyber risks, for example around security compliance or data leakage |
| Internet of Things | Products or services to embed or retrofit security for Internet of Things devices or networks |
| Network security | Hardware or software designed to protect the usability and integrity of a network |
| SCADA and Information Control Systems | Cyber security specifically for industrial control systems, critical national infrastructure, and operational technologies |
| Threat intelligence, monitoring, detection, and analysis | Monitoring or detection of varying forms of threats to networks and systems |
| Awareness, training, and education[footnote 36] | Products or services in relation to cyber awareness, training, or education |
C: Survey methodology and interpretation
Across this report, percentages from the quantitative data may not add to 100%. This is because:
-
We have rounded percentage results to the nearest whole number
-
At certain questions, survey respondents could give multiple answers
It is also important to note that the survey data is based on a sample of cyber sector firms rather than the entire population. Therefore, they are subject to sampling tolerances. The overall margin of error for the sample of 220 firms (within a population of 1,979 firms) is between c.4 and c.6 percentage points. The lower end of this range (4 percentage points) is used for survey estimates closer to 10% or 90%. The higher end (6 percentage points) is used for survey estimates around 50%. For example, for a survey result of 50%, the true value, if we had surveyed the whole population, is extremely likely to be in the range of 44% to 56%.[footnote 37]
By contrast, the data from the qualitative consultations is intended to be illustrative of the key themes affecting the cyber security sector, as a whole, rather than a statistically representative view of cyber sector businesses or investors.
D: Summary of UK Cyber Security Sectoral Analysis metrics (since 2017 baseline)
The table below sets out a summary of the key metrics identified in the UK Cyber Security Sectoral Analysis since the 2017 baseline. This highlights the continual growth of the sector since the baseline report.
| Study | Number of Firms | Revenue | GVA | Employment | Investment |
|---|---|---|---|---|---|
| 2018 | 846 | £5.7bn | £2.4bn | 31,339 | £238m[footnote 38] |
| 2019 | No study undertaken | No study undertaken | No study undertaken | No study undertaken | No study undertaken |
| 2020 | 1,221 | £8.3bn | £3.8bn | 42,855 | £348m |
| 2021 | 1,483 | £8.9bn | £4bn | 46,683 | £821m |
| 2022[footnote 39] | 1,838 | £10.1bn | £5.3bn | 52,727 | £1,013m |
| 2023 (this study) | 1,979 | £10.5bn | £6.2bn | 58,005 | £302m |
Our standards and accreditations
Ipsos’ standards and accreditations provide our clients with the peace of mind that they can always depend on us to deliver reliable, sustainable findings. Our focus on quality and continuous improvement means we have embedded a “right first time” approach throughout our organisation.
ISO 20252
This is the international market research specific standard that supersedes
BS 7911/MRQSA and incorporates IQCS (Interviewer Quality Control Scheme). It covers the five stages of a Market Research project. Ipsos was the first company in the world to gain this accreditation.
Market Research Society (MRS) Company Partnership
By being an MRS Company Partner, Ipsos endorses and supports the core MRS brand values of professionalism, research excellence and business effectiveness, and commits to comply with the MRS Code of Conduct throughout the organisation. We were the first company to sign up to the requirements and self-regulation of the MRS Code. More than 350 companies have followed our lead.
ISO 9001
This is the international general company standard with a focus on continual improvement through quality management systems. In 1994, we became one of the early adopters of the ISO 9001 business standard.
ISO 27001
This is the international standard for information security, designed to ensure the selection of adequate and proportionate security controls. Ipsos was the first research company in the UK to be awarded this in August 2008.
The UK General Data Protection Regulation (GDPR) and the UK Data Protection Act (DPA) 2018
Ipsos is required to comply with the UK GDPR and the UK DPA. It covers the processing of personal data and the protection of privacy.
HMG Cyber Essentials
This is a government-backed scheme and a key deliverable of the UK’s National Cyber Security Programme. Ipsos was assessment-validated for Cyber Essentials certification in 2016. Cyber Essentials defines a set of controls which, when properly implemented, provide organisations with basic protection from the most prevalent forms of threat coming from the internet.
Fair Data
Ipsos is signed up as a “Fair Data” company, agreeing to adhere to 10 core principles. The principles support and complement other standards such as ISOs, and the requirements of Data Protection legislation.
-
All key metrics tracked by the Cyber Security Sectoral Analysis have grown since 2017. This time-series is highlighted in Appendix D. ↩
-
Revenue analysis was undertaken in late 2022, with financial year 2021/22 as the modal year for company accounts where available. ↩
-
Gross Value Added (GVA is a measure of the increase in the value of the economy due to the production of goods and services. In this study, this captures the estimated direct contribution of the cyber security sector to the UK economy. ↩
-
All firms identified using glass.ai were also subject to human review by the Perspective Economics analyst team for final inclusion in the cyber security sectoral dataset. ↩
-
Full size definitions: Large: Employees >=250 and Turnover > €50 million or Balance sheet total > €43 million // Medium: Employees >50 and < 250 And Turnover <= €50 million or Balance sheet total <= €43 million // Small: Employees >10 and < 50 And Turnover <= €10 million or Balance sheet total <= €43 million // Micro Employees < 10 And Turnover <= €2 million or Balance sheet total <= €2million. ↩
-
Based on 95% confidence intervals. ↩
-
FinTech refers to financial technology used to help deliver financial products and services to users. RegTech refers to ‘regulatory technology’ used to enhance and assist organisations with regulatory and compliance processes. ↩
-
Safety tech providers deliver products and services that enable safer online experiences for citizens. DCMS sector research is available at: https://www.gov.uk/government/publications/safer-technology-safer-users-the-uk-as-a-world-leader-in-safety-tech. ↩
-
Full size definitions: Large: Employees >=250 and Turnover > €50 million or Balance sheet total > €43 million // Medium: Employees >50 and < 250 And Turnover <= €50 million or Balance sheet total <= €43 million // Small: Employees >10 and < 50 And Turnover <= €10 million or Balance sheet total <= €43 million // Micro: Employees < 10 And Turnover <= €2 million or Balance sheet total <= €2 million. ↩
-
UK Business Population Estimates (2022): Available at: https://www.gov.uk/government/statistics/business-population-estimates-2022. ↩
-
Figures may not sum due to rounding. ↩
-
Number of firms dissolved, in administration, or liquidation (112 / 1,838) = 6.1%. ↩
-
The keywords underpinning Awareness, Training and Education have been broadened to include firms offering awareness or training courses without formal accreditation (e.g. online modules in cyber security awareness). ↩
-
Note only a small number of resellers are included – whereby they also appear to offer other services aligned to the agreed cyber security taxonomy e.g. advisory support with implementation of cyber security products or services. We do not include, for example, high street or online retailers. ↩
-
Please note the EU/EEA figure (46%) includes all EU / EEA countries identified (including France, Ireland, Germany, Netherlands in the chart) and is a total estimate. ↩
-
£10,146 million to £10,426 million, CAGR of 3%. ↩
-
447 small firms identified in the previous year’s study, with aggregate cyber security related revenues of £857 million (average of c. £1.9 million). ↩
-
1,051 micro firms identified in the previous year’s study, with aggregate cyber security related revenues of £313 million (average of c. £300,000). ↩
-
Note: Smaller values include Service, Micro £159 million, Product, Micro £79 million, MSP, Micro £28 million, Small £96 million, Reseller, Medium £17 million, Small £4 million, Micro £2 million. ↩
-
2021 report: 21,262; 2022 report: 22,830. ↩
-
2021 report: £4 billion GVA; 2022 report: £5.3 billion (33% increase); 2023 report £6.2 billion GVA (17% increase from previous year, 55% from 2021 report). ↩
-
Digital GVA (£143 billion) / Employment (1,800,000) = £79,400: DCMS (2021) DCMS Sectors Economic Estimates: Monthly GVA. Available at: https://www.gov.uk/government/statistics/dcms-sectors-economic-estimates-monthly-gva-to-september-2022/using-annual-estimates-from-summed-monthly-gva-data, DCMS (2021) DCMS Sectors Economic Estimates: Workforce. Available at: https://www.gov.uk/government/statistics/dcms-sector-economic-estimates-workforce-2021/dcms-sectors-economic-estimates-workforce-january-to-december-2021. ↩
-
The Beauhurst platform tracks investments in these companies from 2006– 2022. ↩
-
Silicon Angle (2022) ‘Investment in early-stage cybersecurity startups slows in the second quarter (August 2022). Available at: https://siliconangle.com/2022/08/02/vc-investment-early-stage-cybersecurity-startups-slows-second-quarter/. ↩
-
Financial Times (2022) ‘The tech slowdown starts to bite’. Available at: https://www.ft.com/content/c146a7e6-6688-4a7b-8f9e-54d51d1c4349. ↩
-
Beauhurst (2022) UK Fintech Market Analysis Q3 2022 Trends: Available at: https://www.beauhurst.com/research/uk-fintech-q3-2022/ Fintech had £491 million raised in equity investment in Q3 2022, compared to £2.13 billion in Q2 2022, a quarterly fall of 77%. ↩
-
Beauhurst (2022) UK Equity Market Update Q3 2022: Available at: https://www.beauhurst.com/research/equity-investment-market-update/ This research suggests a 57% drop in equity investment (by value) between Q3 2021 and Q3 2022. ↩
-
For example, Crunchbase (2023) ‘Cybersecurity Likely To See Valuation Cuts, But Demand Still Strong’: Available at: https://news.crunchbase.com/cybersecurity/cyber-vc-funding-startups-forecast-2023/?utm_source=cb_daily&utm_medium=email&utm_campaign=20230104&utm_content=intro&utm_term=content. ↩
-
Please note that this analysis is undertaken in January 2023 (to capture full 2022 data). However, there is a caveat that Q4 data may be effectively “partial”, as this will be complete for publicly announced deals, but there is a lag for unannounced deals (i.e. deals that are made, but not announced publicly, but are identified through filings with Companies House. SH01s (allotment of shares forms) are required to be submitted within one month of the transaction occurring, though it can sometimes take companies longer to file these). ↩
-
Please note that there were no dedicated cyber security fundraisings in Scotland in 2022. However, there was one deal worth c. £2.3 million raised within a diversified firm (that provides some cyber security in the subsector of identity verification checks). ↩
-
Please note that these are examples, and not an exhaustive list of initiatives supported by government and devolved administrations. ↩
-
DIT UK Defence and Security Exports for 2021. ↩
-
Businesses were asked “Which of the following, if any, has your business collaborated or engaged with in your region in the past 12 months, outside of day-to-day sales?” ↩
-
See www.tussell.com. ↩
-
Each of the sections below sets out a heatmap of the active offices within each region (darker red intensity signals a cluster of firms), count of registered cyber firms, count of active cyber offices in the region, percentage of active UK cyber security offices within the region (i.e. number of active offices in the region divided by the total number of active cyber offices in the UK), and an estimated percentage of UK cyber security sectoral employment within the region. The average advertised salary is derived for 2022 using the Lightcast Analyst tool. This is consistent with the methodology from the Cyber Skills in the UK Labour Market research (published in 2022, with data and analysis from 2021), and updates the figures from that report using labour market data from 2022. ↩
-
The keywords underpinning Awareness, Training and Education have been broadened to include firms offering awareness or training courses without formal accreditation (e.g. online modules in cyber security awareness). ↩
-
Based on 95% confidence intervals. ↩
-
Please note this investment data did not cover the full calendar year due to publication date. ↩
-
Please note the methodology for identifying relevant firms was updated in 2021. ↩