Cyber security longitudinal survey - wave five results
Published 17 February 2026

© Crown copyright 2026
This publication is licensed under the terms of the Open Government Licence v3.0 except where otherwise stated. To view this licence, visit nationalarchives.gov.uk/doc/open-government-licence/version/3 or write to the Information Policy Team, The National Archives, Kew, London TW9 4DU, or email: psi@nationalarchives.gov.uk.
Where we have identified any third party copyright information you will need to obtain permission from the copyright holders concerned.
This publication is available at https://www.gov.uk/government/publications/cyber-security-longitudinal-survey-wave-five-results/cyber-security-longitudinal-survey-wave-five-results
Cyber security longitudinal survey: wave five
The Cyber Security Longitudinal Survey (CSLS) is a multi-year longitudinal study, which follows the same organisations over time. It aims to better understand cyber security policies and processes within medium and large businesses and high-income charities, and the extent to which these organisations change and improve over time.
It will also explore the links over time between these policies and processes and the likelihood and impact of a cyber incident to quantify specific actions resulting in improved cyber incident outcomes.
This is the fifth research year, and therefore the main objective of this report is to establish any significant changes between the fourth year from cross-sectional data, and investigate longitudinal data across all five years. The quantitative survey was carried out in June – August 2025 and the qualitative element August – September 2025.
Responsible analyst
Emma Johns
Enquiries:
Executive summary
Introduction
The purpose of the Cyber Security Longitudinal Survey (CSLS) is to explore how and why UK organisations are changing their cyber security practices and how they implement and improve their cyber defences. For UK government, policymakers, and businesses, it is important to understand drivers of change, awareness of government guidance, and budgetary constraints. It is also vital to analyse the relationship between the actions organisations adopt to improve their cyber security and the likelihood and impact of cyber incidents, in order to provide insight into how and why organisations are changing their cyber security practices.
This report covers findings from the fifth wave of the multi-year study. The report presents analysis of both cross-sectional and longitudinal quantitative data, as well as qualitative data. Both the cross-sectional and longitudinal analysis includes comparisons to previous waves of the research (Wave One from 2021, Wave Two from 2022, Wave Three from 2023, Wave Four from 2024). Where relevant, differences between businesses and charities, or business size, are reported.
Participants in the study include medium (50-249 employees) and large (250+ employees) UK businesses and high-income charities (annual income of more than £1 million). The Wave Five main stage survey took place between June and August 2025. Qualitative interviews were conducted between September and October 2025.
The cross-sectional analysis demonstrates a snapshot of businesses and charities compared to previous waves. These snapshots explore the extent to which organisations undertook a wide range of cyber security activities within the last 12 months of survey completion and how such activities vary by organisation type and business size.
The longitudinal data explores rates of change across two points in time; an organisation’s first interview as the first point in time, and the second interview as the second point in time. This is examined across key variables, such as the cyber security practices organisations have adopted, levels of adherence to recognised standards, awareness of government guidance, and resource or budgetary constraints. It also compares changes over time between businesses and charities, and business size.
The qualitative analysis triangulates the quantitative data and provides insight into drivers and barriers to behaviour change. These interviews explored cyber incidents, uptake of government products, cyber security policies, cyber security processes, cyber security budgets and understanding cyber security behaviour change.
The cross-sectional, longitudinal and qualitative results have been integrated throughout each chapter to gain a deeper understanding and explanation of cyber practices, policies and behaviour change. Further details on the methodology, interpretation of results, and key findings can be found in the remainder of this report and the accompanying technical report .
Key Findings
While the cyber security landscape appears to be a constantly evolving and complex landscape, businesses and charities demonstrate variability in their cyber security policies, processes and behaviours. Key findings from the report are as follows:
Prevalence and impact of cyber incidents
This survey asks organisations about their experience of cyber security incidents. While the Cyber Security Breaches Survey should considered the main source of data on prevalence of cyber security incidents, this survey shows that cyber security incidents continued to be highly prevalent in Wave Five.
-
Most organisations continued to experience some form of cyber incident in Wave Five (82% businesses, 77% charities)
-
From the longitudinal data, over half of organisations (54%) reported the same experience of incidents, or incidents with impacts and outcomes, at each point of time. For example, 52% of organisations that did not have an incident at the first point of time, also did not have an incident at the second point of time
-
Over a third (34%) of organisations experiencing an incident with impact and/or outcome at time point 1 then experienced an incident without impact and/or outcome at time point 2, which suggests that either the organisation has improved resilience to minimise the impacts of an incident experienced at time point 2, or the incident was not as intrusive as to cause an impact or outcome.
-
Although it might be assumed that a lack of incidents reflects strong cyber resilience, this capacity is not assessed within this approach. As a result, organisations with no reported incidents are treated as having an unknown ability to respond and recover
Organisations’ cyber policies and processes
Businesses and charities generally seem to be inclined towards a proactive cyber security approach than reactive, although variability remained. Supplier management continued to be a pertinent weakness in organisational cyber resilience.
-
The proportion of organisations reporting adherence to Cyber Essentials rose significantly since Wave Four, for both businesses (30% vs 23%) and charities (28% vs 19%)
-
Organisations were also more likely to say they adhere to at least one of the main cyber security standards (Cyber Essentials, Cyber Essentials Plus, ISO27001 at time point 2 (31% gain vs 20% loss)
-
Organisations that experienced an incident with a tangible impact or outcome were more likely to show improved adherence to all five Cyber Essentials controls at time point 2.
-
In contrast, organisations that only experienced minor or no-impact incidents showed no clear change in adherence, and overall adherence at time point 2 was not strongly influenced by whether an organisation had any incident at time point 1.
-
Charities remained more likely to have a risk registry that covered cyber security than businesses (78% vs 64%)
-
The longitudinal data corroborates this trend; charities were much more likely to have propensity for a risk registry over 2-wave data than businesses
-
More businesses and charities reported having specific cyber insurance policies, likely reflecting a significant drop in ‘Don’t know’ responses about the types of cyber security policies in place since Wave Four.
-
Longitudinally, 98% of organisations that had specific cyber insurance at time point 1 had some form of cyber insurance policy (whether cyber specific or within general insurance) at time point 2. This shows that there is minimal fluctuation over time for those organisations already with some form of cyber insurance policy, in contrast to many other cyber security practices which show more fluctuation over time. Supply chain management remained a weakness amongst both charities and businesses.
-
Longitudinally, medium-sized businesses and charities were less likely over time to formally assess cyber security of suppliers. However, this was more likely if an organisation had an incident, or incident with impact and/or outcome.
Understanding cyber security behaviour change
In Wave Five, external influences such as widespread cyber-attack reports[footnote 1] emerged as catalysts to drive behaviour change, whether that was influencing budget, leadership discussions, or internal checks on cyber processes and policies.
Proactive vs reactive approach
-
Cyber incidents that incurred an impact and/or outcome mostly tended to have more influence on an organisation’s cyber security posture than those that experience none, or incidents without impact and outcome.
-
From the longitudinal data, if an organisation experienced no incident at time point 1 there were no statistically significant patterns of increased positive change versus negative change, compared to those organisations who experienced an incident (with or without impact and/or outcome).
-
This demonstrates a generally reactive approach that many organisations take following an incident, rather than a proactive approach. Although organisations cannot predict when a cyber incident may occur, they seemed generally aware of the increasing threat of cyber-attacks. However, the unpredictability of cyber incidents being a catalyst for change is a concern.
External influences and drivers of change
-
Publicised cyber incidents often prompted additional checks or enabled funding, but heightened awareness did not always result in tangible change; some organisations deemed their systems sufficiently secure.
-
External information sources, such as reports on sector-wide incidents, tended to be cited as motivation for improving cyber security posture (51% of businesses vs 41% of charities).
Communication and behaviour change
-
Individuals were frequently cited as weak points within most organisations.
-
Tailored communication emerged as an important approach to influence behaviour change within an organisation.
Training, education, and organisational response
-
Organisations implemented continuous training and regular penetration tests to strengthen cyber security defences and improve staff cyber practices.
-
Staff awareness and readiness were widely recognised as primary defences against future attacks, prompting greater investment in user education.
Cyber security budget and board involvement
Organisations have reported significant increases to incorporate cyber risk over time. However, this did not always translate to effective cyber budgets or board involvement, especially for charities. When an organisation experienced an incident that had a tangible impact or outcome, this often prompted stronger cyber security measures, resulting in more improvements than setbacks over time.
-
Over one-third of organisations (37% businesses, 36% charities) reported an increase in budgets in Wave Five
-
However, charities were more likely than businesses to report their cyber security budgets as insufficient and potentially leaving them exposed in some areas (10% charities vs 5% businesses)
-
Longitudinally, charities were less likely to report frequent board discussions (more often than 6 months) than businesses over time when comparing positive and negative change rates.
-
Large businesses were twice as likely to see uptake of more frequent board discussion while charities showed a higher propensity for negative change over time (Large business rate of change = 2.1, charity rate of change = 0.8).
-
This highlights that while organisations have attempted to integrate cyber risk into wider business areas, this does not translate into a charity’s budget or board level of involvement.
-
Longitudinally, across all organisations there was a lower propensity for positive change around frequency of board training.
1. Introduction
1.1 Background to the research
The Department for Science, Innovation and Technology (DSIT) commission the Cyber Security Longitudinal Survey (CSLS); a study composed of businesses, which are divided into medium (50-249 employees) and large enterprises (250+ employees), and high-income charities (annual income of more than £1m). In turn, large businesses consist of both large (250-499 employees) and very large businesses (500+ employees).[footnote 2] The findings will evaluate long-term links between the cyber security policies and processes adopted by these organisations, and the likelihood and impact of a cyber incident. It also supports the government to shape future policy in this area and inform future government cyber interventions.
This report is based on cross-sectional findings on Wave 5 (2025) and longitudinal data from 2021 (Wave One), 2022 (Wave Two), 2023 (Wave Three) and 2024 (Wave Four). Due to the longitudinal nature of the study, the aim is to track trends over time and, wherever possible, speak with the same organisations in each wave. The design of this research was influenced by a study the Department for Digital, Culture, Media and Sport (DCMS) previously commissioned to investigate the feasibility of creating a new longitudinal study of large organisations.
The core objectives of this study are to:
-
Explore how and why UK organisations are changing their cyber security profile and how they implement, measure, and improve their cyber defences
-
Provide a more in-depth picture of larger organisations, exploring topics that are covered in less detail in the Cyber Security Breaches Survey (CSBS), such as understanding drivers of change in relation to cyber security, awareness and uptake of government guidance and budgetary constraints in relation to implementing cyber security policies
-
Examine how organisations’ cyber security actions relate to the likelihood and impact of a cyber incident.
1.2 Difference from the Cyber Security Breaches Survey
This study differs from the CSBS in multiple important aspects. Firstly, it uses a longitudinal approach, where the aim is to track changes in cyber resilience over time, whereas the CSBS uses a cross-sectional sample that provides a snapshot of cyber resilience. This five-year longitudinal study (CSLS) collects data from the same organisation (businesses or charities) on more than one occasion (up to five points in time) to analyse the link between large and medium organisations’ behaviours towards cyber security and the extent to which they influence the likelihood and impact of experiencing an incident over time. In comparison, results from CSBS provide a static view of cyber resilience, the cyber threats organisations face and the actions they are taking to stay secure at a given time.
Secondly, the CSLS focuses only on medium and large businesses, and high-income charities whereas the CSBS includes businesses of all sizes, all charities, and educational institutions. CSBS is an official statistic and therefore, for overall statistics on cyber security results from CSBS should be used.
Additionally, different questions are used, so while there are some similarities in the questions and topics covered by the two surveys, results are not comparable. Further detail on overlapping questions can be found in the Cyber Security Longitudinal Survey Wave Four Technical Report. Please visit the gov.uk website to see publications of the Cyber Security Breaches Survey.
1.3 Methodology
There are two strands to the Cyber Security Longitudinal Survey. First, Ipsos undertook a random probability multimode[footnote 3] (telephone and online) survey covering 521 businesses and 273 UK registered charities between June and August 2025.[footnote 4] Of these, 611 interviews (77%) were completed via telephone and 183 interviews (23%) were completed through the online survey option. The data for businesses and charities have been weighted to be statistically representative of these two populations. Subsequently, 24 in-depth interviews were conducted in September and October 2025, to gain qualitative insights from some of the organisations that participated in the Wave 5 quantitative survey.
This longitudinal study tracks changes over time by attempting to follow the same organisations in all five annual waves. In Wave Four, 1,046 organisations (574 businesses and 472 charities) agreed to be recontacted. Data for Wave Five includes 5656 interviews (70%) who were part of the longitudinal sample, comprising 292 interviews with businesses and 264 with charities.
In addition to the organisations that had participated in the study in previous years, the survey was issued to businesses and charities that had not taken part previously. 45% (238 interviews) of the achieved sample in Wave Five came from fresh sample, comprising 229 interviews with businesses and 9 with charities. This allowed the survey to maintain a strong overall achieved sample size and, as such, ensure that robust analysis could be completed from this research and allow more detailed longitudinal analysis in future waves. To avoid possible selection bias, the ‘fresh’ business sample was selected using random probability sampling. The business sample was proportionally stratified by region and disproportionately stratified by size and sector.
The questionnaire for Wave Five of the survey only had one minor change since Wave Four, which was an update to codes for guidance available, to reflect current guidance. This change and more technical details, including methodological notes for the longitudinal analysis and a copy of the questionnaire, are available in the separately published Technical Annex.
1.3.1 Profile of survey respondents
Figure 1.1.1: Businesses and charities overall (weighted %)
Percentage of the sample that were businesses, split by size, and charities
| Businesses | 66% |
| Charities | 34% |
Base: All businesses (n=521); All Charities (n=273)
Figure 1.1.2: Businesses size breakdown – makeup of businesses that responded(weighted %)
| Medium Businesses | 82% |
| Large Businesses | 9% |
| Very Large Businesses | 9% |
Base: Medium businesses (n=427); Large Businesses (n=48); Very Large Businesses (n=46)
Please note: If organisations had been confirmed as eligible and interviewed in an earlier wave but now have fewer than 50 employees (businesses) or a turnover of less than £1 million (charities), they were still considered eligible to be interviewed and treated as medium businesses. This applied to 25 businesses in Wave Five.
Figure 1.2.1: Businesses breakdown by region (weighted %)
The distribution of responding businesses by UK regions
Businesses and charities by nation and region
| North East | 2% |
| Yorks and Humberside | 9% |
| East Midlands | 7% |
| Eastern | 9% |
| London | 10% |
| South East | 15% |
| South West | 11% |
| Wales | 5% |
| West Midlands | 9% |
| North West | 11% |
| Northern Ireland | 4% |
| Scotland | 9% |
Base: 521 UK businesses
Figure 1.2.2: Charities breakdown by nations (weighted %)
The distribution of responding charities by UK nations
| England and Wales | 79% |
| Northern Ireland | 2% |
| Scotland | 19% |
Base: 273 charities
Figure 1.3: Businesses breakdown by sector (weighted %)
Distribution of responding businesses by sector
| Manufacturing | 16% |
| Retail or wholesale (including vehicle sales and repairs) | 14% |
| Administration or Real Estate | 14% |
| Professional, scientific or technical | 11% |
| Health, social care or social work (excluding NHS) | 11% |
| Food or hospitality | 9% |
| Information or communication | 7% |
| Construction | 5% |
| Transport or storage | 4% |
| Finance or insurance | 3% |
| Education (excluding public sector schools, colleges and universities) | 2% |
| Arts or recreation | 2% |
| Utilities or production | 1% |
| Service or membership organisations | 3% |
Base: 521 UK businesses
1.3.2 Profile of qualitative respondents
Twenty-four follow-up interviews were carried out with representatives of organisations covered by the survey. They were selected to provide the following profile:
Table 1.1: Profile of qualitative respondents
| Category | Definition | Achieved | |
|---|---|---|---|
| Category | Businesses | 16 | |
| Charities | 8 | ||
| Size (employees): (Businesses only) | Medium (50-249) | 10 | |
| Large (250+) | 6 | ||
| Sector (Businesses only) | Broad mix of sectors | 16 | |
| Region (Businesses only) | Broad mix of regions | 16 |
1.4 Longitudinal analysis and cross-sectional analysis
The cross-sectional series has been the focus for each previous year of reporting and provides a snapshot of the extent to which organisations undertook a wide range of cyber security activities within the last 12 months of survey completion and how such activities vary by changes over time between businesses and charities, and business size. In principle, the CSLS cross-sectional series could be used to track trends over time. However, for more robust data, both cross-sectional and longitudinal data should be analysed, where viable, to comprehensively grasp changes over time.
Wave Four and Wave Five of the CSLS study has enabled the size of the available longitudinal sample to grow such that it can produce robust results to help inform the trends seen in the cross-sectional series. Previous uses of the longitudinal component of the study have largely been exploratory and indicative in nature. This year’s report is the first time it has been possible to provide an integrated report providing insights based both on the aggregate net change seen in the cross-sectional analysis and the individual change seen at the level of the organisation.
For the purposes of analysis, businesses are divided into medium (50-249 employees) and large enterprises (250+ employees).[footnote 5] Large businesses consist of both large (250-499 employees) and very large businesses (500+ employees). All charities included in the survey have a reported annual income of at least £1 million according to national charity regulator sample data.[footnote 6] The nature and size of cyber threats and incidents faced differs by size of organisations and charities, as shown in previous reports. Hence, it is anticipated that longitudinal patterns of response will differ between these organisational types.
Previous analysis of the longitudinal component has illustrated that growth apparent in the cross-sectional series cannot always be interpreted as a year-on-year incremental gain based on organisations attaining a positive status on a cyber security activity in one year and necessarily retaining a positive response in all future years. Rather, underlying growth trends are based both on gains and losses of positive behaviours accompanied by positive stability for some organisations previously carrying out that activity.
In this report, the focus of the longitudinal analysis is on assessing the extent of behavioural flux in cyber security activities and how this varies by two classifications, as explained below. Further work is required to understand why some activities show more flux than others and reasons for both positive and negative changes of cyber activities.
A second classification, used in the longitudinal analysis, is the experience of cyber incidents reported at the first interview. It is anticipated that experience of an incident, particularly one with adverse consequences, may influence organisations to increase positive activity among organisations not undertaking the activity at their first interview. Similarly, it may decrease positive activities among those already undertaking them. Using any experience of the incidents listed in the questionnaire (excluding phishing), organisations were first classified as experiencing an incident or not. Among those who experienced an incident (excluding phishing), any impact or outcome resulting from that incident was used to classify incidents as less adverse (incident with no impact or outcome) and more adverse (incident with an impact and/or outcome). Thus, three levels of experience were created: no incident; incident only and incident with adverse consequences (impact and/or outcome). Changes in positive and negative activities were compared between these three groups with more adverse consequence expected to have greater impacts on gains and losses.
1.5 Interpretation of cross-sectional quantitative findings
The cross-sectional analysis reports on the aggregate trends in cyber experiences and protective behaviours. This report analyses significant[footnote 7] changes (at the 95% confidence level) since Wave Four and Wave Five, and between organisation type and size within Wave Five. As stated above, the quantitative cross-sectional results should be interpreted in conjunction with the longitudinal and qualitative analysis to understand the wider state of cyber security over time.
The survey results are subject to margins of error, which vary with the size of the sample and the percentage figure concerned. For all percentage results, subgroup differences by size, sector and other survey answers have only been mentioned in the text of the report where they are statistically significant. There is a guide to statistical reliability in the technical report.
For the purposes of analysis, businesses are divided into medium (50-249 employees) and large enterprises (250+ employees).[footnote 8] In turn large businesses consist of both large (250-499 employees) and very large businesses (500+ employees). All charities included in the survey have a reported annual income of at least £1 million according to national charity regulator sample data.[footnote 9]
Where base sizes are noted as smaller than 50, they should be treated with caution.
1.6 Interpretation of longitudinal quantitative findings
The longitudinal data enable exploration of rates of positive and negative activities underlying the aggregate trends shown by the cross-sectional series. The longitudinal results are framed between time point 1, when a respondent was first interviewed, and time point 2, when they were interviewed a second time. Thus, the data can be analysed across two time points to assess rates of change.
The rates of change are considered through creating a ratio of positive to negative activity changes. A ratio of more than ‘1’ shows that the positive activity exceeds the negative activity rate from time point 1 to time point 2. A ratio of less than ‘1’ therefore shows that the negative activity rate exceeds the positive rate. For example, large businesses with a ratio of 1.2 adherence to Cyber Essentials shows that more large businesses are gaining adherence to Cyber Essentials, a positive activity, between two points in time than losing, a negative activity, at a rate of 1.2.
As described in the accompanying Technical Report, it has been necessary to pool together organisations that started at Waves One, Two, Three and Four into a single analytic dataset to create a substantial sample size. The longitudinal analysis thus focuses on these organisations’ status at their first interview and explores how this status has remained stable, or changed, at the second interview. For example, the analysis reveals how many of those undertaking a cyber security vulnerability audit at the time of their first interview also carried one out at the time of their second interview. This da ta depicts experience levels of incidents only at time point 1, in order to measure the impact on other variables over time, namely the time point 2 data.
1.7 Interpretation of qualitative findings
The qualitative findings in this report are intended to provide insight into the behaviours, views, and experiences of a range of businesses and charities. As part of the changes in Wave Four, which remained in Wave Five, Ipsos continued the Capability, Opportunity, Motivation - Behaviour model (COM-B) behavioural science approach to help understand behaviour changes. The qualitative research did not set out to determine the prevalence of these behaviours, views, and experiences.
Where the report indicates that ‘few’, ‘some’, or ‘many’ businesses and charities experienced or felt something, this is in relation to the research participants only. Findings cannot be considered representative of the entire UK business and charity population and should not be interpreted as generalisable to the entire business population.
Qualitative findings follow a cross-sectional nature and should not be interpreted as longitudinal findings.
1.8 Acknowledgements
Ipsos and DSIT would like to thank all the organisations and individuals that participated in the survey. We would also like to thank the organisations that endorsed the fieldwork and encouraged businesses and charities to participate, including:
- Tech UK
- Association of British Insurers
- Institute of Chartered Accountants in England and Wales (ICAEW)
2. Prevalence and impact of cyber incidents
This chapter examines the prevalence, type and frequency of cyber incidents that organisations have experienced in Wave Five of the Cyber Security Longitudinal Survey. This is important baseline information to understand the cyber security landscape among businesses and charities. The primary use of prevalence data is to allow for longitudinal comparisons, rather than analyse cross-sectional changes wave on wave. Therefore, this chapter presents Wave Five cross-sectional findings only, with separate longitudinal analysis presented in section 2.5. These longitudinal findings explore the prevalence and frequency of incidents, and incidents with impacts and outcomes, over time.
It is important to note that the official government statistics of cyber incidents should be taken from the Cyber Security Breaches Survey. The CSLS Wave Five results presented here focus only on medium-sized businesses, large businesses, and high-income charities. CSBS has further statistical data about the wider business population in the UK.
In Wave Five, most businesses and charities continued to experience some type of cyber incident (82% businesses, 77% charities). While phishing remained the most common type of attack, businesses reported a higher likelihood of experiencing different types of attacks than charities, such as email impersonation scams (56% businesses vs 46% charities ) or takeovers or attempts to take over website, social media accounts or email accounts (11% businesses vs 6% charities). These impersonation scams were not only limited to emails and included WhatsApp or other channels.
Following an incident, businesses were more likely to report a negative outcome than charities (22% businesses vs 15% charities). Common responses to incidents with outcomes included re-training of staff on specific threats, or technical solutions such as multi-factor authentication.
Organisations also reported wider impacts from cyber incidents. For example, 29% of large businesses reported additional staff time to deal with an incident, or to inform customers/beneficiaries or stakeholders. In addition to financial impacts, reputational damage and disruptions to day-to-day running of the organisation emerged as problematic impacts.
The longitudinal data in section 2.5 show that over half of organisations experienced the same levels of incidents, or incidents with impacts and/or outcomes, from time point 1 to time point 2. Slight improvements in incident recovery capabilities seemed apparent, likely because the organisation has improved capacity to minimise the impacts of an incident experienced at time point 2, or the incident was not as intrusive to as to cause an impact or outcome.
2.1 Prevalence of cyber incidents
In Wave Five, most organisations experienced a cyber incident. In fact, around eight in ten businesses (82%) and charities (77%) reported they had experienced some form of cyber security incident over the last twelve months. Businesses were more likely than charities to experience some form of cyber incident (63% businesses vs 53% charities). Excluding phishing attacks, very large businesses were significantly more likely to experience a cyber incident than medium-sized businesses (74% very large vs 62% medium-sized businesses). From the qualitative findings, cyber security incidents occurred frequently, with incidents reported within the last month, two months previously, and even on the current day of the interview. The constant threat levels were generally seen as tiresome.
“We get literally hundreds of phishing emails daily.”
Business, Medium, Transportation and Storage, England
2.2 Types of cyber incidents
Phishing and email impersonation scams were the most prevalent cyber security incidents experienced by organisations. Around three-quarters of organisations (76% businesses, 73% charities) reported phishing incidents. Around half (56% of businesses, 46% of charities) reported email impersonation scams, with businesses significantly more likely to experience impersonations than charities.
In Wave Five, businesses were also more likely than charities to experience:
-
Email or online impersonation of staff, volunteers, or the organisation (56% of businesses vs 46% of charities)
-
Takeovers or attempted takeovers of a website, social media, or email account (11% of businesses vs 6% of charities)
-
Denial of service attacks (8% of businesses vs 3% of charities)
Among businesses, larger organisations were more likely than medium-sized ones to experience:
-
Phishing attacks (83% of large businesses vs 74% of medium-sized businesses)
-
Unauthorised access to files or networks by staff (14% of large businesses vs 5% of medium-sized businesses)
This highlights that businesses, and in particular large businesses were more likely to have experienced incidents and attacks, but also more varied incidents and attacks.
Qualitatively, organisations described a similar pattern of cyber incident prevalent and type. Phishing attacks emerged as the main incident type across organisations, which included phishing links from suppliers and general phishing emails.
Impersonation attempts represented another significant threat, with communications impersonating CEOs and senior managers occurring through WhatsApp, email, and other channels. Account compromises also occurred, including incidents where email accounts were hijacked resulting in thousands of ransom payment emails, alongside regular attempts to hack into user accounts.
Email was the main way cyber-attacks occurred. Attackers used email to steal login credentials and deliver ransomware. Attack methods exploited multiple communication channels beyond email, with WhatsApp scams commonly noted. This highlighted a concerning trend in multi-channel phishing attempts.
Cloud storage systems presented additional vulnerabilities, demonstrated by an incident where a malicious file downloaded via Edge browser spread to an organisation’s OneDrive through syncing.
The effectiveness of training programmes was limited, with staff clicking on phishing links and providing credentials despite having undergone training. Communications showed increasing sophistication, potentially due to the use of artificial intelligence, which made fraudulent messages challenging for staff to identify.
2.3 Outcomes of cyber incidents
In Wave Five, businesses were more likely to report any type of outcome from cyber incidents than charities (22% businesses vs 15% charities). Outcomes were asked only of businesses and charities who experienced an incident, so this result is not attributable to the higher likelihood of a business receiving an attack. The most common outcomes mentioned were:
-
the organisation’s website, applications or online services were taken down or made slower (6% of businesses, 4% of charities, not significantly different)
-
temporary loss of access to files or network (5% of businesses, 4% of charities, not significantly different)
Large businesses were more likely to experience outcomes from a cyber security incident than medium-sized businesses (30% large businesses vs 20% medium-sized businesses), specifically to experience:
-
Compromised accounts or systems used for illicit purposes (11% large businesses vs 3% medium-sized businesses)
-
Physical devices or equipment being corrupted or damaged (7% large businesses vs 3% medium-sized businesses)
These negative outcomes from attacks could be linked to more sophisticated attacks, or potentially increased awareness of the outcomes among larger businesses.
From the qualitative findings, incident analysis involved various investigative activities. These included exporting sign-in logs, conducting antivirus scans, and investigating device activity using tools such as Microsoft Defender for Endpoint. Device isolation represented another immediate response measure, with potentially impacted devices isolated from networks and restricted access implemented.
Account management also emerged as a priority in immediate cyber security incident response. Organisations disabled accounts involved in incidents, including those where users had not clicked malicious links, with restrictions lifted only after accounts were confirmed secure.
After incidents occurred, organisations improved their staff cyber security training and awareness programmes. Key messages about recognising and avoiding phishing attempts were repeated to staff, with instructions to check email addresses and wording for inconsistencies. Organisations shared findings from incident analyses with all teams to help them understand threats and how to respond effectively.
Technical responses to cyber security incidents included implementing multi-factor authentication where it had not been used before. This helped prevent unauthorised access to sensitive information. Organisations also improved their encryption measures as part of their response. Security audits were conducted to examine login patterns, checking where and when employees logged in to ensure these matched their normal behaviour.
Organisations kept detailed records of all response actions using service desk systems to maintain audit trails. They brought in external IT experts to help deal with attacks and understand how they happened. Vendors supported organisations by providing updated security patches and advice. Increased monitoring was put in place, which included putting affected users on priority monitoring lists for extended periods.
In some instances, incidents validated existing measures rather than prompting changes. Where successful recovery occurred, this reinforced confidence in existing approaches rather than prompting overhaul of security measures.
2.4 Impact of cyber incidents on organisations
Incidents that did not directly have a negative outcome were still shown to have wider impact on organisations. The wider impacts measured included additional staff time to deal with an incident, prevention of carrying out day-to-day work, new measure to prevent future incidents, among other measures outlined in the technical report.
Around one-third of businesses and charities reported experiencing some kind of impact from cyber incidents (37% businesses vs 35% charities). Again, large businesses were more likely to report an impact from an incident than medium-sized businesses (47% large businesses vs 36% medium-sized businesses).
Large businesses were also more likely to report impacts compared to medium-sized businesses (excluding phishing, 53% large businesses vs 45% medium-sized businesses). This was particularly higher for large businesses for the following impacts:
- Additional staff time to deal with the incident, or to inform customers/beneficiaries or stakeholders (35% vs 24%)
-
Stopped staff from carrying out their day-to-day work (15% vs 10%)
-
New measures needed to prevent or protect against future incidents (42% vs 32%)
This places a high burden on large businesses to be vigilant in their cyber security posture, as they were more likely to report impacts from attacks.
2.5 Longitudinal analysis of cyber incidents
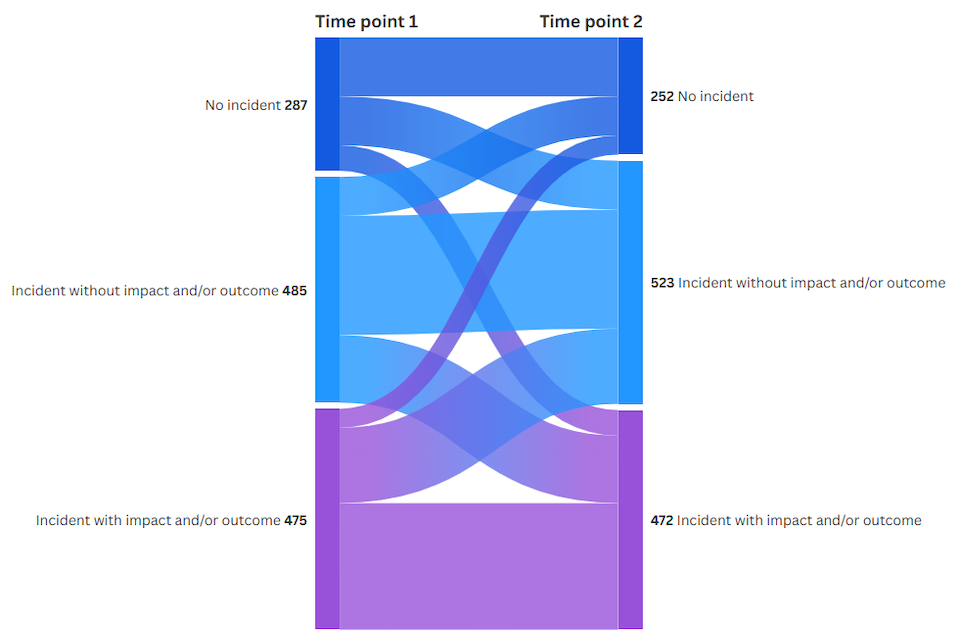
A longitudinal measure of experience of incidents was created through the combination of three variables: no incident, an incident without an impact and/or outcome, and an incident with an impact and/or outcome. This longitudinal data allows for analysis of the level of impact and/or outcomes organisation’s experience over time. Further, it is used as a key variable to understand how positive and negative cyber activity changes relate to levels of incidence, impact and/or outcome.
The longitudinal data, as illustrated in Chart 2.1 below, shows that of those organisations that did not experience any incidents at time point 1:
-
52% did not experience any incident at time point 2
-
32% of organisations experienced an incident without an impact or outcome at time point 2
-
16% experienced an incident with an impact and/or outcome at time point 2
Of those organisations that experienced an incident without an impact and/or outcome at time point 1:
-
17% did not experience an incident at time point 2
-
53% experienced an incident without an impact or outcome at time point 2
-
30% experience an incident with an impact or outcome at time point 2
Of those organisations that experienced an incident with an impact or outcome at time point 1:
-
9% experienced no incident at time point 2
-
34% experienced an incident without an impact or outcome at time point 2
-
57% experience an incident with an impact or outcome at time point 2
Figure 2.1: Longitudinal Cyber Security Incident Experience
| Type of incident | Time point 1 | Time point 2 | |
|---|---|---|---|
| No incident | 287 | 252 | |
| Incident without impact and/or outcome | 485 | 523 | |
| Incident with impact and/or outcome | 475 | 472 |
This data suggests that organisations’ experience of cyber incidents can vary from year to year. However, across two time points, over half of organisations (54%) reported the same experience of incidents, or incidents with impacts and/or outcomes.
Over a third (34%) of organisations experiencing an incident with impact and/or outcome at time point 1 then experienced an incident without impact and/or outcome at time point 2, which suggests that either the organisation has improved resilience to minimise the impacts of an incident experienced at time point 2, or the incident was not as intrusive as to cause an impact or outcome. This is compared to less than a third (30%) of organisations who had an impact and outcome at time point 2, after experiencing no impact and outcome at time point 1.
Although it might be assumed that a lack of incidents reflects strong cyber resilience, this capacity is not assessed within this approach. As a result, organisations with no reported incidents are treated as having an unknown ability to respond and recover.
Experience of an incident with an impact and/or outcome at the first interview tended to be associated with a similar experience at the second interview. This was especially apparent for large businesses with two-thirds (66%) of those experiencing an incident with an impact and/or outcome at time point 1 also experiencing one at time point 2.
However, 57% of charities and 55% of medium-sized businesses also reported experiencing an incident with an impact and/or outcome at both time points. Large businesses were also slightly more likely than others to see an incident at time point 1 convert to an incident with an impact and/or outcome at time point 2 (37% large businesses, 31% medium-sized businesses, 27% charities). Charities were not exempt from an increased exposure to cyber incidents. Of those experiencing no incident at time point 1, 57% experienced an incident (with or without an impact and/or outcome) at time point 2, compared to 54% of large businesses and 41% of medium-sized businesses following the same pattern of experience over time.
3. Cyber security policies and processes
This chapter explores the reported cyber security policies and processes of businesses and charities. Effective cyber security policies and processes are important building blocks for an organisation’s cyber security posture. This chapter explores cross-sectional, longitudinal and qualitative data.
Adherence to Cyber Essentials showed a significant increase among both businesses and charities compared with Wave Four (30% of Wave Five businesses vs 23% of Wave Four; 28% of Wave Five charities vs 19% of Wave Four). Over time, the longitudinal data demonstrated that organisations were more likely claim adherence with at least one of the three standards at time point 2 (Cyber Essentials, Cyber Essentials Plus, ISO 27001).
Further from the longitudinal data, adherence to any one of the accreditations showed 31% gains vs 20% losses. Additionally, adherence to all five Cyber Essentials controls[footnote 10] were more likely increase over time, after an organisation experienced an incident with an impact and outcome. Therefore, although adherence to accreditation standards was lost among some organisations, a much greater percentage reported a gain rather than a loss.
Overall, adherence did not seem significantly impacted by whether a business or charity experienced some kind of incident, or incident with impacts and outcomes. This suggests that regardless of levels of incidence, adherence may be influenced by other factors. Charities and smaller businesses were 1.5 times more likely to experience a gain than a loss of adherence to an accreditation standard, as were medium-sized businesses. For large businesses the gain to loss ratio was slightly higher at 1.65.
Businesses were more likely to report investing in threat intelligence in Wave Five (44% Wave Five vs 36% Wave Four). However, the longitudinal data highlights that this threat intelligence can fluctuate over time. More investigation would be needed in potential next waves to understand the increase.
Charities remained more likely to have a risk registry that covered cyber security than businesses (78% vs 64%). The longitudinal data corroborates this trend; charities were much more likely to have propensity for a risk registry over two points in time than businesses.
Both businesses and charities were more likely to report having a specific cyber insurance policy compared to Wave Four. Businesses increased from 29% to 35% , and charities increased from 30% to 40% . The number of businesses and charities that reportedly did not know about insurance significantly dropped wave on wave (from Wave Four to Wave Five, Don’t know reduced from 20% to 13% for businesses , and 12% to 7% for charities). This suggests that awareness and uptake of a specific insurance policy, or broader knowledge of insurance policies, may be the reason for an apparent increase in cyber insurance policies over time.
Supply chain management remained a weakness amongst both charities and businesses. Less than a third of organisations stated they carried out formal assessment of suppliers in the past 12 months (28% of businesses and 26% of charities in Wave Five ). Qualitatively, organisations generally lacked awareness about cyber security incidents in their supply chains, acknowledging they likely happen without their knowledge. Longitudinally, medium-sized businesses and charities were less likely over time to formally assess cyber security of suppliers. However, this was more likely if an organisation had an incident, or incident with impact and/or outcome (See Figure 3.9.3 below).
3.1 Uptake and usage of standards, certifications and government guidance
Organisations were asked if they adhered to each of three standards for cyber security: Cyber Essentials, Cyber Essentials Plus and/or ISO 27001, rather than whether they were formally accredited to them. Cyber Essentials has seen a significant increase amongst both businesses and charities, compared to Wave Four. Amongst businesses at Wave Five, 30% reported that they adhered to Cyber Essentials, compared to 23% in Wave Four. There was no significant difference among business sizes for Cyber Essentials, although adherence to the ISO 27001 standard remained higher for larger businesses than medium-sized businesses (24% large businesses vs 16% medium-sized businesses). Businesses also remain more likely to adhere to ISO 27001 compared to charities (17% vs 10% ). Amongst charities, 28% reported adherence to Cyber Essentials compared to 19% in Wave Four. Despite this increase wave on wave, a large proportion of businesses (37%) and charities (41%) did not comply with either ISO 27001, Cyber Essentials, nor Cyber Essentials Plus.
Figure 3.1: Businesses’ standards and accreditations
Which of the following standards or accreditations, if any, does your organisation adhere to?
| Wave | % ISO 27001 | % Cyber Essentials | % Cyber Essentials Plus | % None of these | % Don’t know |
|---|---|---|---|---|---|
| Wave 1 | 15 | 14 | 8 | 42 | 26 |
| Wave 2 | 17 | 19[s1] | 11[s1] | 39 | 20 |
| Wave 3 | 19 | 18 | 9 | 41 | 21 |
| Wave 4 | 15 [s2] | 23 | 15[s1] | 35 | 20 |
| Wave 5 | 17 | 30 | 15 | 37 | 11 |
[s1] Significant change from previous year at 95% significance level
[s2] Significant difference between businesses and charities at 95% significance level
Base: All businesses at Wave One (n=1205), Wave Two (n=688), Wave Three (n=542), Wave Four (n=674) and at Wave Five (n=521).
Figure 3.1 above shows businesses’ standards and accreditations. Figure 3.2 below shows charities’ standards and accreditations.
Figure 3.2: Charities standards and accreditations
Which of the following standards or accreditations, if any, does your organisation adhere to?
| Wave | % ISO 27001 | % Cyber Essentials | % Cyber Essentials Plus | % None of these | % Don’t know |
|---|---|---|---|---|---|
| Wave 1 | 9 | 16 | 7 | 46 | 25 |
| Wave 2 | 9 | 23[s1] | 9 | 40 | 24 |
| Wave 3 | 7 | 23 | 8 | 45 | 19 |
| Wave 4 | 9 | 19 | 12 | 47[s2] | 18 |
| Wave 5 | 10 | 28 | 11 | 41 | 15 |
[s1] Significant change from previous year at 95% significance level
[s2] Significant difference between businesses and charities at 95% significance level
Base: All charities at Wave One (n=536), Wave Two (n=373), Wave Three (n=310), Wave Four (n=548) and at Wave Five (n=273).
Longitudinally, a higher percentage of organisations claimed adherence to at least one of the accreditations at time point 2 compared to time point 1. 31% of organisations showed a gain of any accreditation adherence, compared to 20% loss of any accreditation adherence (shown in Figure 3.3 below). There were no statistically significant differences in adherence gains and losses by organisation type, or whether an organisation experienced no incident, an incident without an impact and/or outcome, or an incident with an impact and/or outcome.
Figure 3.3: Longitudinal Cyber Essentials rules or controls
| Standard or Accreditation | Positive change | Negative change | Rate of change |
|---|---|---|---|
| Any | 31% | 20% | 1.55 |
| Standard or Accreditation by impact type | None | Incident without impact and/or outcome | Incident with impact and/or outcome | |
|---|---|---|---|---|
| Any | 1.5 | 1.5 | 1.6 |
| Standard or Accreditation by organisation type | Medium-sized businesses | Large businesses | Charities | |
|---|---|---|---|---|
| Any | 1.45 | 2.23 | 1.48 |
Base: 3,361
Note: “Any” includes accreditation to at least one of: Cyber Essentials, Cyber Essentials Plus, ISO 27001
Standard or accreditation
The cross-sectional and longitudinal data demonstrate that organisations are becoming more resilient by adhering to at least one accreditation. Specific periods show increased adherence, such as the increase in Cyber Essentials uptake from Wave Four to Wave Five . A longitudinal comparison of adherence to each individal accreditation standard is complex and has the potential for misdirection. There is much flux in the gain and loss of adherence to each accreditation standard. However, adherence losses in this case do not necessarily imply losing a positive behaviour because they also include moves to a different type of accreditation among these three standards . Consequently, references to losses here should be treated with caution because they refer to flux more generally rather than a simple loss of positive activity.
The cross-sectional and longitudinal data demonstrate that organisations are becoming more resilient by adhering to at least one accreditation, and specific periods show increased adherence, such as the increase in Cyber Essentials uptake from Wave Four to Wave Five. However, individual accreditation shows fluctuation across two-time points, for example the longitudinal data showed more adherence loss than gain at time point 2 for Cyber Essentials overall (13% gain vs 39% loss across two time points).
To attain Cyber Essentials accreditation, organisations are required to have technical controls in place in five key areas:
-
A policy to apply software security updates within 14 days
-
Up-to-date malware protection across all your devices
-
Firewalls that cover your entire IT network, as well as individual devices
-
Restricting IT admin and access rights to specific users
-
Security controls on your organisation’s own devices (e.g. laptops)
In addition to the question about adherence to Cyber Essentials, organisations were asked whether they have controls in place in each of these five technical areas (regardless of whether or not they had accreditation). Despite varied claimed adherence to Cyber Essentials as a whole, more organisations showed an uptake in controls needed for Cyber Essentials across two points in time (42% gain vs 23% loss across two time points, shown in Figure 3.4 below). The longitudinal data also shows that organisations were more likely to have all five Cyber Essentials controls in place if they experienced an incident, and even more so if they experienced an incident with an impact or outcome at time point 2, as shown in Figure 3.4 below.
Figure 3.4: Longitudinal Cyber Essentials rules or controls
| Rule or Control | Positive change | Negative change | Rate of change |
|---|---|---|---|
| All five Cyber Essentials | 42% | 23% | 1.82 |
| Rule or Control | None | Incident without impact and/or outcome | Incident with impact and/or outcome |
|---|---|---|---|
| All five Cyber Essentials | 1.1 | 1.8 | 2.5 |
| Rule or Control | Medium-sized businesses | Large businesses | Charities |
|---|---|---|---|
| All five Cyber Essentials | 1.96 | 2.04 | 1.48 |
Base: 3361
Regardless of accreditation compliance, most businesses and charities reported to have at least one rule or control in place against cyber threats. Since Wave Four, more businesses reported that they backup data securely via a cloud service (92% Wave Five vs 86% Wave Four). Large businesses were more likely to report any monitoring of user activity (82% vs 66% medium), backup data securely via other means (79% vs 67% ), or use a VPN (91% vs 78% medium). Charities saw increased numbers reporting a policy to apply software security updates within 14 days (74% vs 64% at Wave Four). Compared to charities, businesses were more likely to:
-
Use a VPN (80% businesses vs 58% charities)
-
Implement firewalls that cover your entire IT network, as well as individual devices (97% businesses vs 90% charities)
-
Backing up data securely via other means (69% businesses vs 55% charities)
-
Monitor user activity (68% businesses vs 57% charities)
Advice and guidance
Businesses and charities displayed similar levels of awareness of NCSC or DSIT guidance, except for the Software Security Code of Practice which businesses were more likely to be aware of (50% businesses vs 41% charities). Just under half of organisations (44% of businesses and 47% of charities) reported use of any information or guidance from the NCSC to inform their cyber security approach. This was more likely within large businesses than medium-sized businesses (59% large businesses vs 41% medium-sized businesses).
Figure 3.5: Guidance awareness of businesses and charities
Which of the following NCSC and DSIT information or guidance, if any, are you aware of or have you used? Summary of aware
| Wave | Businesses | Charities |
|---|---|---|
| 10 steps to Cyber Security | 54% | 51% |
| Cyber Security Toolkit for Boards | 33% | 36% |
| Cyber Aware, including top tips for staying online | 57% | 56% |
| Check your Cyber Security guidance | 47% | 42% |
| Cyber Governance Code of Practice | 46% | 39% |
| Software Security Code of Practice | 50%[s2] | 41% |
| None of these | 25% | 25% |
[s2] Significant difference between businesses and charities at 95% significance level
Bases: 521 UK businesses; 273 charities
From the qualitative findings, businesses commonly cited regulatory compliance as a strong driver of cyber security practices. Several organisations adhered to Financial Conduct Authority (FCA) guidelines and related industry regulations, while aligning with ISO 27001, NIST frameworks, and NCSC recommendations. Cyber Essentials and Cyber Essentials Plus formed a baseline, supplemented with internal policies on password management, Single Sign-On (SSO), and general cyber security monitoring
Frameworks such as CISSP and SOC 2 were also referenced, alongside the NHS Data Security and Protection Toolkit for healthcare operations. Businesses emphasised a zero-trust approach, rigorous internal monitoring, red team audits, employee activity tracking, and controlled access. Policies were often linked to employee contracts to ensure accountability. AI tools and vendor newsletters were used to support gap analysis and drive proactive improvements.
“We are registered with NCSC…There’s lots of certification we have…BSI…IEC…Crest…CIIs…So we, we usually follow the procedures anyway.”
Business, Medium, Information or Communication
Businesses highlighted the need to balance operational feasibility with stringent security measures. Certification efforts frequently required adaptations to accommodate legacy systems or minimise operational disruption, while still demonstrating a commitment to formalising and improving processes.
Among charities, adherence to recognised frameworks was similarly central. Cyber Essentials and Cyber Essentials Plus were widely implemented, alongside ISO 27001 where feasible.
“We follow quite a lot of best practice because we’re ISO 27001 certified and Cyber Essential certified. So we follow best practice in regards to things like malware, having antivirus installed and updated, keeping our platforms updated within 14 days for urgent updates.”
Charity, England
Charities also referenced NHS or local government guidelines, including the DSP Toolkit when handling NHS data, and accessed specialist advice through insurers. Cyber Essentials Plus accreditation was often jointly managed with IT services, with ongoing staff training. Collaborative learning was emphasised, with lessons shared across dioceses and government bodies. Internally, charities prioritised proactive monitoring using Avast antivirus and Microsoft Admin Portal alerts, alongside user education and restricted external access, particularly for suppliers.
“We can access some specialist advice and support through the insurance company as well, because they like to know that we’re, you know, we’re not just open to anybody, you know, our systems are fairly well locked down.”
Charity, England
3.2 Current cyber security policies
Businesses and charities were asked to report whether they identified cyber security risks such as vulnerability audits, risk assessments, threat intelligence investments or use specific tools such as Intrusion Detection Systems. Compared to Wave Four, both businesses and charities significantly increased their levels of threat intelligence at Wave Five. Overall, businesses reported using more identification methods outlined above than Wave Four (90% vs 85% in Wave Four) . This was largely driven by threat intelligence which significantly increased from 36% in Wave Four to 44% in Wave Five. Large businesses were more likely to use one of these identifying tools than medium-sized businesses. Businesses in general were more likely to use one of these tools than charities (90% vs 85%). One-third (33%) of charities said they invested in threat intelligence compared to 25% in Wave Four. Risk assessments remained the most commonly used form of risk identification for charities at 70% in Wave Five.
Figure 3.6: Identifying cyber security risks
Which of the following, if any, have you done over the last 12 months to identify cyber security risks to your organisation?
| Wave | Businesses | Charities |
|---|---|---|
| A cyber security vulnerability audit | 60% | 49% |
| A risk assessment covering cyber security risks | 71% | 70% |
| Invested in threat intelligence | 44% [s1] | 33% |
| Used specific tools designed for security monitoring, such as Intrusion Detection Systems | 67% [s1] | 56% |
| None of these | 10% | 15% |
[s1] Significant change from previous year at 95% significance level
Bases: 521 UK businesses; 273 charities
Similarly to Wave Four, businesses were more likely than charities to have:
-
Performed a cyber security vulnerability audit (60% businesses vs 49% charities)
-
Invested in threat intelligence (44% businesses vs 33% charities)
-
Used specific tools designed for security monitoring (67% businesses vs 56% charities)
Longitudinally, organisations demonstrated an uptake in identifying some cyber security risks. Cyber security vulnerability audits showed higher gains of reported audits in organisations across two time points (positive change 34%, negative 27%, shown in figure 3.7). Organisations experiencing an incident, or an incident with an impact or outcome were more likely to show a positive change around auditing (shown in Figure 3.7).
Figure 3.7: Longitudinal cyber identification processes
| Cyber identification processes | Positive change | Negative change | Rate of change | |
|---|---|---|---|---|
| A cyber security vulnerability audit | 34% | 27% | 1.26 | |
| A risk assessment covering cyber security risks | 44% | 17% | 2.59 | |
| Invested in threat intelligence | 21% | 37% | 0.57 | |
| Used specific tools designed for security monitoring | 40% | 19% | 2.1 |
| Cyber identification processes | None | Incident without impact and/or outcome | Incident with impact and/or outcome |
|---|---|---|---|
| A cyber security vulnerability audit | 1 | 1.3 | 1.44 |
| A risk assessment covering cyber security risks | 2 | 2.3 | 3.2 |
| Invested in threat intelligence | 0.3 | 0.5 | 0.9 |
| Used specific tools designed for security monitoring | 1.2 | 2.2 | 2.9 |
| Cyber identification processes | Medium-sized businesses | Large businesses | Charities | |
|---|---|---|---|---|
| A cyber security vulnerability audit | 1.14 | 2.81 | 1.21 | |
| A risk assessment covering cyber security risks | 2 | 4.36 | 3.3 | |
| Invested in threat intelligence | 0.51 | 1.13 | 0.53 | |
| Used specific tools designed for security monitoring | 2.17 | 5.2 | 1.6 |
In the longitudinal panel, organisations that completed a risk assessment covering cyber security risks showed a particularly high pattern of positive change from time point 1 to time point 2 (positive change 44%, negative change 17%, shown in Figure 3.7).
Investment in threat intelligence, while shown increase wave on wave from the cross-sectional data (36% businesses in Wave Four vs 44% in Wave Five; 25% charities in Wave Four vs 33% in Wave Five), has shown fluctuation longitudinally. Counterintuitively, despite the recent increase in cross-sectional prevalence, organisations overall showed more negative change than positive change (positive change 21%, negative change 37%, shown in Figure 3.7). This pattern of results arises because until Wave Five, the cross-sectional prevalence levels were relatively flat.
Given that the longitudinal panel comprises only two interviews from each cohort of entrants to the study averaged across the first four waves of data entrants, the spike in Wave Five take-up is not apparent for most of the longitudinal cases. Nevertheless, businesses that were medium-sized were more likely to invest in threat intelligence than charities, and even more so for large businesses who showed more positive change between two time points. Organisations also showed a higher propensity for positive change around threat intelligence if they had an incident, or incident with impact and/or outcome at time point 2.
When asked to identify if they used specific tools designed for security monitoring, almost two-thirds (63%) of organisations in Wave Five reported that they do, in line with Wave Four. However, the longitudinal data showed an increased propensity over time for positive change (positive change 40%, negative change 19%, shown in figure 3.7) to use security monitoring tools. Again, incidents and incidents with impacts and outcomes were more likely to influence security monitoring tool uptake, and larger businesses were much more likely to do this than medium-sized businesses or charities (rates of change shown in Figure 3.7).
Charities remained more likely to have a risk registry that covered cyber security than businesses (78% charities vs 64% businesses), whereas businesses were more likely to have documentation that:
- identified most critical assets their organisation wanted to protect than charities (64% vs 55%)
- outlines how much cyber risk their organisation is willing to accept (34% vs 26%)
Longitudinal data corroborates this increase, as charities were much more likely to have propensity for positive changes related to a risk registry at time point 2 than businesses (Charity rate of positive change was 3.5 times, compared to 1.5 for medium-sized businesses and 1.6 for large businesses).
Businesses with documentation that outlines how much cyber risk their organisation is willing to accept increased compared to Wave Four (34% Wave Five vs 28% Wave Four). This was seemingly driven by large businesses (44% large businesses vs 33% medium-sized businesses).
Both businesses and charities were more likely to report having a specific cyber insurance policy compared to Wave Four. Businesses increased from 29% to 35%, and charities increased from 30% to 40%. Further, businesses and charities were more aware whether they had a specific, general, or no insurance. Don’t know reduced from 20% to 13% for businesses, and 12% to 7% for charities. This suggests that awareness may be the reason for the apparent uptake of a specific insurance policy, or broader knowledge of insurance policies. Large businesses were more likely to have specific cyber insurance policies (43% large businesses vs 34% of medium-sized businesses), while medium-sized businesses are more likely to have cyber security cover as part of a broader insurance policy (29% large vs 38% medium).
Longitudinally, 98% of organisations that had specific cyber insurance at time point 1 had some form of cyber insurance policy (whether cyber specific or within general insurance) at time point 2. 90% of organisations that had some form of cyber insurance policy (whether cyber specific or within general insurance) at time point 1 had some form of cyber insurance policy (whether cyber specific or within general insurance) at time point 2. This shows that there is minimal fluctuation over time for those organisations already with some form of cyber insurance policy.
Figure 3.8: Businesses that have cyber insurance policies or cover
There are general insurance policies that provide cover for cyber security incidents, among other things. There are also specific insurance policies that are solely for this purpose. Which of the following best describes your situation?
| Wave | % We have a specific cyber security insurance policy | % We have cyber security cover as part of a broader insurance policy | % We are not insured against cyber security incidents | % Don’t know |
|---|---|---|---|---|
| Wave 1 | 18 | 35 | 13 | 34 |
| Wave 2 | 25[s1] | 36 | 11 | 28 |
| Wave 3 | 26 | 43[s1] | 13 | 17 |
| Wave 4 | 29 | 40 | 11 | 20[s2] |
| Wave 5 | 35 [s1] | 36 | 16 [s1] | 13 [s1] |
[s1] Significant change from previous year at 95% significance level
[s2] Significant difference between businesses and charities at 95% significance level
Base: All businesses at Wave One (n=1205), Wave Two (n=688), Wave Three (n=542), Wave Four (n=674) and at Wave Five (n=521).
Figure 3.8 above shows businesses that have cyber insurance policies or cover. Figure 3.9 below shows charities that have cyber insurance policies or cover.
Figure 3.9: Charities that have cyber insurance policies or cover
There are general insurance policies that provide cover for cyber security incidents, among other things. There are also specific insurance policies that are solely for this purpose. Which of the following best describes your situation?
| Wave | % We have a specific cyber security insurance policy | % We have cyber security cover as part of a broader insurance policy | % We are not insured against cyber security incidents | % Don’t know |
|---|---|---|---|---|
| Wave 1 | 24 | 42 | 14 | 20 |
| Wave 2 | 32[s1] | 42 | 10 | 16 |
| Wave 3 | 32 | 46 | 10 | 11 |
| Wave 4 | 30 | 41 | 16[s1][s2] | 12 |
| Wave 5 | 40 [s1] | 42 | 11 | 7 [s1] |
[s1] Significant change from previous year at 95% significance level
[s2] Significant difference between businesses and charities at 95% significance level
Base: All charities at Wave One (n=536), Wave Two (n=373), Wave Three (n=310), Wave Four (n=548) and at Wave Five (n=273).
From the qualitative findings, businesses highlighted continuous efforts in vulnerability management and Security Operations Centre (SOC) activities as central to improving cyber security. These measures were reported to reduce system vulnerabilities and enable faster incident response, contributing to fewer incidents and improved reaction times. Key effective actions included implementing multi-factor authentication (MFA), onboarding cyber security monitoring and detection software for threat visibility, deploying endpoint security, and enhancing staff education on password security.
Other impactful measures included deploying email security from malicious emails (phishing, ransomware, spam, and malware), company firewalls, incident response planning, and strict deadlines for mandatory training. Staff awareness and proactive reporting were consistently emphasised as crucial to maintaining a secure environment. Conversely, over-reliance on antivirus software, previous approaches focused solely on technology purchases and attempts to lock down network ports were reported as less effective, often creating a false sense of security or encountering user resistance.
Technical and procedural measures were viewed as integral to maintaining resilience. Organisations reported using comprehensive firewalls, conditional access controls, and micro-segmentation to limit the spread of potential breaches. Cyber security certifications, including Cyber Essentials and ISO 27001, alongside regular staff awareness activities, reinforced these controls. One business described strict adherence to internal policies and external audits as a major strength that ensured ongoing improvement. Overall, technical controls and formal governance frameworks appeared mutually reinforcing, combining technology and process to reduce vulnerability.
Partnerships with Managed Security Service Providers (MSSPs) provided additional assurance through 24/7 monitoring, incident response, and staff training. Participants described a strong security culture, where employees actively questioned suspicious communications. Organisations that had experienced attacks cited effective recovery processes and lessons learned as evidence of maturity, indicating that prior incidents reinforced organisational readiness.
“We’re not just talking, we’re walking the walk.”
Business, Medium, Transport and Storage
Large businesses remained more likely to have a physical server than medium-sized businesses (81% businesses vs 71% charities). Overall, businesses also remained much more likely to have a physical server than charities (74% businesses vs 47% charities), although this remained relatively stable wave on wave for both businesses and charities.
Figure 3.10: Businesses’ use of physical server or cloud server
Does your organisation use or provide any of the following?
| Wave | % A cloud server that stores your data or files | % Your own physical server that stores your data or files | % None of these |
|---|---|---|---|
| Wave 1 | 68 | 82 | 3 |
| Wave 2 | 70 | 81 | 2 |
| Wave 3 | 72 | 76 | 4 |
| Wave 4 | 79[s1] | 76[s2] | 3 |
| Wave 5 | 83 | 74[s1] [s2] | 3 |
[s1] Significant change from previous year at 95% significance level
[s2] Significant difference between businesses and charities at 95% significance level
Base: All businesses at Wave One (n=1205), Wave Two (n=688), Wave Three (n=542), Wave Four (n=674) and at Wave Five (n=521).
Figure 3.10 above shows businesses’ use of physical server or cloud server. Figure 3.11 below shows charities’ use of physical server or cloud server.
Figure 3.11: Charities’ use of physical server or cloud server
Does your organisation use or provide any of the following?
| Wave | % A cloud server that stores your data or files | % Your own physical server that stores your data or files | % None of these |
|---|---|---|---|
| Wave 1 | 77 | 72 | 5 |
| Wave 2 | 80 | 66 | 3 |
| Wave 3 | 86 | 60 | 2 |
| Wave 4 | 88[s2] | 54 | 5 |
| Wave 5 | 88 [s1] | 47 | 4 |
[s1] Significant change from previous year at 95% significance level
[s2] Significant difference between businesses and charities at 95% significance level
Base: All charities at Wave One (n=536), Wave Two (n=373), Wave Three (n=310), Wave Four (n=548) and at Wave Five (n=273).
3.3 Cyber processes
Supplier cyber security management remains a low priority for most organisations. Similar to Wave Four, less than a third of organisations at Wave Five stated they formally assessed the potential cyber security risks presented by their suppliers in the past 12 months (28% businesses, 26% of charities in Wave Five). At Wave Five, this was more common in large businesses compared to medium-sized businesses (40% large businesses vs 25% medium-sized businesses). This is a potentially concerning challenge since suppliers can be a risk factor in cyber incidents.
Of those who reported they reviewed immediate supplier risks, businesses were more likely than charities to carry out a formal assessment of their cyber security (44% businesses vs 28% charities) and give suppliers information or guidance on their cyber security (55% businesses vs 35% charities).
The longitudinal data shows that more organisations had a propensity to show negative change than positive change around any supplier cyber engagement. On a formal level, organisations were less likely to carry out any assessment or management of cyber risks by suppliers or partners over time (negative change 37%, positive change 16%, shown in Figure 3.12). However, if the organisation experienced an incident (with or without impacts and outcomes), the organisation was less likely to lose supplier cyber security assessment/management (shown in Figure 3.12). Large businesses were the only subset of organisations to show the same level of change over time for supplier management, that is the rate of change across two points were equal (rate of change=1).
Figure 3.12: Longitudinal supplier activity
| Supplier Activity | Positive change | Negative change | Rate of change |
|---|---|---|---|
| Any supplier activity | 12% | 42% | 0.29 |
| Formally assess/manage potential cyber security risks | 16% | 37% | 0.43 |
| Supplier Activity by impact type | None | Incident without impact and/or outcome | Incident with impact and/or outcome |
|---|---|---|---|
| Any supplier activity | 0.17 | 0.26 | 0.4 |
| Formally assess/manage potential cyber security risks | 0.2 | 0.4 | 0.63 |
| Supplier Activity by organisation type | Medium-sized businesses | Large businesses | Charities |
|---|---|---|---|
| Any supplier activity | 0.22 | 0.79 | 0.29 |
| Formally assess/manage potential cyber security risks | 0.33 | 1.00 | 0.45 |
From the qualitative findings, organisations generally lacked awareness about cyber security incidents in their supply chains. Organisations recognised that incidents likely occurred without their knowledge. They acknowledged that not hearing about incidents did not mean they had not happened.
Interviewees flagged that suspicions existed that incidents within supply chains may have been kept quiet and not reported when they occurred. This suggested potential non-disclosure practices that further limited organisational visibility of supply chain vulnerabilities.
The supply chain incidents that were identified varied in scale and impact. Third-party supplier breaches affected organisations, including incidents involving contact details from support services, though impacts were described as very minimal. Small supplier compromises occurred, such as incidents involving window fitting companies where phishing attempts targeted multiple individuals with some falling for the attempts.
Major infrastructure incidents also occurred, including compromised cloud servers where hackers reached network perimeters, prompting cyber insurance use and cyber forensic team engagement for discovery and investigation.
Both businesses and charities generally maintained lists of external suppliers, though the structure and formality of these lists varied. Some operated formal approved supplier systems with defined vetting processes, while others relied on long-standing relationships or informal practices driven by convenience.
Among businesses, several demonstrated mature third-party risk management processes. One organisation used a tiered system that ranked suppliers by criticality, with higher-tier suppliers subject to detailed questionnaires, monitoring, and cyber risk assessments. Another employed a Request for Proposal (RFP) process that required “must-have” legal, financial, and security standards, verified through due diligence and certifications such as ISO or SOC 2. These models applied more scrutiny to critical suppliers and lighter checks to lower-risk vendors.
Some businesses had begun integrating minimum cybersecurity standards into supplier checks, requiring enterprise-grade antivirus, multi-factor authentication (MFA), and phishing awareness training in line with NCSC guidance. However, enforcement—particularly with smaller contractors—was described as challenging. Larger or regulated businesses also had rigorous governance and audit frameworks, with suppliers undergoing multiple internal checks and compliance reviews.
“If a supplier breaks compliance rules, business relations are stopped until they can reprove their adherence.”
Business, Large, Manufacturing
In contrast, medium-sized businesses tended to operate more informally. Many maintained supplier lists without structured approval mechanisms, preferring to continue working with trusted vendors.
“We did have a list of suppliers but there wasn’t a real approval process… we liked to maintain the same suppliers just to keep things simple.”
Business, Medium, Real Estate
Supplier selection in these cases often prioritised reliability or cost over cybersecurity. Financial and insurance checks were more common than technical security assessments, and long-standing supplier relationships made it difficult to impose new security requirements.
Charities also maintained supplier lists, but the level of cyber scrutiny varied. Many followed approved frameworks or tendering processes that assessed financial stability, insurance, and, where applicable, cybersecurity credentials such as ISO 27001 or Cyber Essentials. Some used external frameworks like the London Universities Purchasing Consortium or APUC, though adherence was flexible.
Others took a less formal approach, engaging suppliers individually through contracts that included IT security requirements. Peer consultation was common, with organisations seeking advice from others in their sector.
“We had a conversation with somebody doing my job in a similar charity elsewhere.”
Charity, England
Businesses were more likely than charities to have an incident response plan (69% vs 60% ). This was particularly evident in large businesses (84% vs 67% ). Of those that had incident management processes, half of businesses (50%) and less than half (38%) of charities tested their incident response policies and processes. Large businesses were more likely to do this (65% large businesses vs 45% medium-sized businesses ).
Longitudinally, organisations were more likely to have incident response plans over time (positive change 33%, negative change 17%). This was particularly evident for those with an experience of an incident with impacts and/or outcomes at time point 2 (no incident rate of change = 1.1, incident with impact and/or outcome rate of change = 2.8).
4. Understanding behaviour change
This chapter explores what drives organisations to change their cyber security behaviour. Understanding behaviour change is vital to influence cyber security policy and help organisations improve their cyber security posture. This chapter mainly covers cross-sectional analysis as well as qualitative analysis. However, two key questions to understand influence and drivers of behaviour change were only introduced in Wave Four.
In the quantitative survey, participants were asked about the extent to which their approach to cyber security was influenced by certain groups such as external IT consultants, investors and customers. Organisations were also asked which factors were influential in helping to improve the organisation’s cyber security posture.
The qualitative phase was informed by a behavioural science approach, specifically the COM-B framework[footnote 11] to identify the influences on behaviour change (see methodology and technical report for more details). This provides a structured way of understanding the mechanisms underpinning behaviour and subsequently what needs to be changed to facilitate desired behaviours and more optimal decision making.
Organisations showed positive motivations for behaviour change, as well as common barriers. Internally, cyber incidents mostly resulted in positive action for an organisation’s cyber security posture. Issues like individual motivation, and communication of threats, emerged as key themes. Externally, widespread media reports of attacks were used as prompts to check an organisation’s own cyber security capability, as well as a catalyst for improved cyber budgets or senior leadership buy-in.
Table 4.1 below summarises the key overarching COM-B analysis explored in chapter 4. Specific COM-B qualitative analysis is further explored in chapters 2-5. For example, while in chapter 3.1 businesses noted feasibility and resourcing as behavioural motivations, the overarching COM-B analysis highlights that there could be other overarching motivations for change such as reputational damage, news of large-scale attack, and board engagement. Therefore, chapter 4 should be framed in conjunction with specific qualitative insights throughout other chapters.
Table 4.1 COM-B Summary Table
| COM-B Category | Overview | |
|---|---|---|
| Capability |
Internal Resources and Training: Some organisations implemented continuous training programs and penetration tests that increased cyber awareness, showing investment in building psychological and technical capability to handle cyber threats. Communication Challenges: Differences in understanding and emphasis on tailored communication highlight gaps in psychological capability among staff. |
|
| Opportunity |
External Influences and Pressures: News of large-scale attacks and regulatory requirements created external pressures (the physical environment) for organisations to enhance cybersecurity practices. Board Engagement: Proactive board engagement and senior leadership facilitated change (the social environment). |
|
| Motivation |
Reputation: Reputational risk served as a strong motivator, especially for senior leadership and cyber teams to act following cyber incidents. Awareness & Attitudinal Changes: Increased vigilance following incidents tended to boost motivation. Reflective motivation was evidenced by proactive measures and investments following incidents. |
|
| Behaviour | Reactive vs. Proactive Approaches: Organisations tended to take a reactive approach to incidents and make changes, although proactive measures were encouraged when board engagement and leadership support were higher. |
4.1 Internal influences on behaviour change
Cyber incidents as catalyst for change
Cyber incidents that incurred an impact and/or outcome mostly tended to have more influence on an organisation’s cyber security posture than those that experience none, or incidents without impact and outcome. From the longitudinal data, if an organisation experienced no incident at time point 2, there were no statistically significant patterns of increased positive change versus negative change, compared to those organisations who experienced an incident (with or without impact and/or outcome). Conversely, 8 of the longitudinal variables analysed in this report (see Annex C for full variable list) showed statistically significant positive changes over time if an organisation experienced and incident, or an incident with impact and/or outcome.[footnote 12] This demonstrates a generally reactive approach that many organisations take following an incident, rather than a proactive approach. Although organisations cannot predict when a cyber incident may occur, they seemed generally aware of the increasing threat of cyber-attacks. However, the unpredictability of cyber incidents being a catalyst for change is a concern.
“With cyber, it’s never an if, it’s a when it happens to us.”
Large business, Health, social care or social work sector
Each incident, whether successful or not, increased organisational awareness and helped maintain vigilance.
“Every time you get something, people just become a bit more aware.”
Business, Medium, Transportation and Storage, England
From the cross-sectional data, businesses in Wave Five were more likely to cite direct impact of an incident as important to improve their cyber security posture:
-
41% businesses vs 29% charities
-
41% businesses in Wave Five vs 35% in Wave Four
However, it is important to note that businesses were more likely to experience an incident than charities, so this cross-sectional data should be treated with caution.
Reputation
Reputational risks were frequently cited as a motivation for change, especially for the cyber teams and senior leadership. Public trust was damaged when people received fake emails that appeared to come from organisational addresses. This impact on public perception was a primary long-term effect of cyber security incidents.
Reputation also served as a primary motivation outside of potential losses, or disruptions to day-to-day running of the organisation.
Internal resources and training
Organisations needed significantly more time to monitor and analyse cyber security threats compared to before. They required additional resources to review interceptions and compromises, and to check that communications were genuine.
Organisations often implemented continuous training programmes and penetration tests to strengthen their cyber security defences. They recognised the increased need for user education, identifying staff awareness and readiness as primary defences against future attacks. Incidents reminded non-technical staff that cyber threats were real dangers.
Cybersecurity staff talked positively about the effectiveness of training, although levels of training sometimes ranged from introductory tasks for new employees to monthly phishing or impersonation testing. This gap in regular testing was mostly noted due to budget constraints.
Communication
Communication continued to be a key challenge between cyber security roles and wider staff. Individuals were frequently cited as weak points for most organisations. While cyber security staff may know the risks and attempt to communicate this to staff, knowledge that communications were read and understood by individuals were hard to track. Emails and newsletters were common methods of communicating, but participants held mixed views on their effectiveness. One large construction company stated they tried to be as visible as possible throughout key meetings and with senior leadership, which they believed helped improve staff attitudes. A charity mentioned building trust between the IT department and volunteers was paramount, so that there was not a name and shame culture.
“Your staff are either going to be your biggest strength or your greatest weakness”
Medium-sized business, Transport or storage
“They follow if we ask them something to do and they understand that it’s not about pointing out, but we learn together”
Charity, England
However not all organisations took this approach. Some cited that they flagged any errors in training tasks or potential cyber threats to the individual’s manager, as they deemed this approach more effective. This demonstrates that not all organisations take the same approach to internal communications, and trust vs accountability is not a clear-cut cyber culture across all organisations.
Tailored communication emerged as a common theme in order to influence behaviour change. One participant mentioned age-related challenges, with older individuals perhaps lacking familiarity with technology, and younger generations potentially being over-trusting or careless. It was also apparently difficult for cyber staff to know which employees were vigilant or not.
“With 80 staff there are different attitudes… Who takes it seriously, who doesn’t take it seriously.”
Medium-sized business, Professional, scientific or technical sector
Reducing impact of individuals
Further internal barriers were high staff turnover rates, such as in the construction sector, where cyber staff can communicate effectively but newer employees can be a risk. One participant mentioned that certification and accreditation simplified compliance and communication with potential customers.
Less effective measures included phishing tests without follow-up and initiatives hindered by staff apathy or limited resources. Persistent challenges were human factors, communication difficulties, budget constraints, and supply chain risks beyond the organisation’s control. Lessons reinforced the importance of shared responsibility, proactive monitoring, ongoing training, strong leadership support, and fostering a security-aware culture.
“Healthy competition is good, people are sensitive to phishing tests, publicised attacks reduces apathy…Having a CEO that trusts you is vital for any effective cyber security issues, supply chain is a risk as they are out of control even if you have a lot of resources available for them.”
Charity, England
Board engagement
One business’s encounter with a ransomware incident significantly altered board attitudes, prompting increased security investment and a shift towards a more proactive approach. Generally, senior leadership were seen as important catalysts for wider business change. For example, one participant explained the accountability to senior leaders, which led to more budget for testing of wider staff. This highlights the top-down approach that close cyber and board relationships can have on a business’ wider cyber security posture.
“The most effective action was the directors understanding it and allowing me to do the other actions.”
Medium-sized business, Retail or wholesale
Charities similarly highlighted MFA, cloud adoption (e.g., SharePoint), Cyber Essentials and ISO certifications, and staff training as the most effective actions. Penetration testing and SME-focused security tools were also valued.
“We follow quite a lot of best practice because we’re ISO 27001 certified and cyber essential certified. So we follow best practice in regards to things like malware, having antivirus installed and updated, keeping our platforms updated within 14 days for urgent updates.”
Charity, England
Among charities, perceived strengths similarly centred on leadership support, robust governance, and an absence of major incidents. Many had achieved or were working toward recognised accreditations such as ISO 27001 or Cyber Essentials, supported by regular training and testing programmes. Medium-sized businesses and charities often relied on internal expertise and tight access controls, alongside high staff awareness and clear reporting channels. Collaboration and information sharing across similar organisations were highlighted as particularly valuable for learning and preparedness.
“So we exchange things. And technically, learning from our examples, our people’s faults, actually, sorry to say, is best learning rather than learning from your own faults and mistakes.”
Charity, England
Levels of board engagement and attitudes towards cyber security is explored in more depth in Chapter 5 of this report.
4.2 External influences on behaviour change
Large-scale attacks in the news
External influences emerged as a key influence on organisations in the past 12 months, often spontaneously mentioned. This was particularly evident in news stories of large-scale cyber attacks, such as on major retailers. Participants mentioned that these public incidents prompted them to do extra checks or allowed for funding because of the reality of potential impact for their own organisation.
“But then as soon as [you] can’t go and do shopping online at [large retailer], it starts to hit closer to home…I can then use that as an example.”
Charity, England
“When you see a big news story, you can’t help but go back and just triple check your own work.”
Medium-sized business, Transport or storage
“That gives me ammunition internally…To help justify taking extra steps to get some funding.”
Charity, England
Incidents like these or others in an organisation’s sector also facilitated organisational motivation for accreditation adherence. These external factors relate closely to a fear of reputational loss, as mentioned internal drivers in section 4.1.
However, this higher level of awareness did not always lead to actual change. Some organisations mentioned this led to an assessment of own systems but then determined that the systems were secure enough and did not require an update.
Business vs charity external influence
From the cross-sectional data, businesses in general noted that multiple external factors helped to improve their organisation’s cyber security posture. Businesses were more likely to report that the following had helped to improve their organisations cyber security posture than charities:
-
Advice from internal cyber security experts (48% vs 38% charities)
-
Recent information received from customers or clients (33% vs 18% charities)
-
Reports on cyber security incidents affecting others in our sector (51% vs 41% charities)
Businesses reported the following factors in improving their cyber security posture as more influential than Wave Four:
-
Advice from internal cyber security experts (48% Wave Five vs 42% Wave Four)
-
Reports on cyber security incidents affecting others in our sector (51% Wave Five vs 41% Wave Four)
-
Reports on cyber security incidents in general (61% vs 52%)
-
Recent updates of requirements from insurers (41% vs 33%)
- Recent updates on regulatory requirements (46% vs 39%)
- Recent information received from customers or clients (33% v 25%)
Some of this is driven by large businesses, which were more likely to be driven to change by security assessment findings (68% vs 47% ). This shows that generally businesses were more likely to be driven to change from external influences than charities.
For charities, while there were no statistically significant changes in individual factors since Wave Four, overall, there was notable improvement in cyber posture. In Wave Four, one-fifth (20%) of charities stated there was no notable improvement in the organisation’s cyber security posture, which was just 3% in Wave Five.
Figure 4.1: Driving behaviour change in cyber security practices
In the last 12 months, which, if any, of the following factors have been influential in helping to improve the organisation’s cyber security posture?
| Influence | Businesses | Charities |
|---|---|---|
| Findings from security review/assessment/test | 49% | 43% |
| Advice from internal cyber security experts | 48% [s1][s2] | 38% |
| Advice from external cyber security experts | 64% | 60% |
| Direct experience of cyber security incidents | 41% [s1][s2] | 29% |
| Reports on cyber security incidents affecting others in our sector | 51%[s1][s2] | 41% |
| Reports on cyber security incidents in general | 61% [s1] | 56% |
| Recent updates on requirements from insurers | 41% [s1] | 43% |
| Recent updates on regulatory requirements | 46%[s1] | 42% |
| Recent information received from customers/clients | 33%[s1] [s2] | 18% |
| Recent information received from partners | 30% | 25% |
| Recent information received from other stakeholders | 27% | 32% |
| There has been no notable improvement | 3%[s1] | 3%[s1] |
[s1] Significant change from previous year at 95% significance level
[s2] Significant difference between businesses and charities at 95% significance level
Bases: 521 UK businesses; 273 charities
External stakeholders used for Security Operations Centre (SOC), pen testing, advisory capacity were noted as important to some organisations. However, slightly different to Wave Four, importance of reliance on external stakeholders tended to be based on how much confidence there is in internal expertise (such as a colleague with 25 years of experience) rather than size of business. Because of the multiple stakeholders involved, there is perceived lack of control e.g., compliance from suppliers.
“We do have…three sort of external companies we’re relying on for security to a certain degree and there’s kind of deliberately no overlap between them.”
Medium sized business
Businesses and charities’ influence from feedback of certain groups remained relatively stable wave on wave. Over half (60%) of businesses reported that external IT or cyber security consultants influenced their actions, while only around a quarter (24%) of businesses were influenced to take action by another organisation in their sector implementing similar measures. Large businesses were more likely than medium-sized businesses to take action based on feedback from:
-
Regulators for their sector (48% large businesses vs 35% medium-sized businesses)
-
Whoever audits their accounts (44% large businesses vs 28% medium-sized businesses)
-
Another organisation in their sector experiencing a cyber security incident (52% large businesses vs 31% medium-sized businesses)
-
Another organisation in their sector implementing similar measures (33% large businesses vs 23% medium-sized businesses)
Charities were more likely to report being influenced by external IT or cyber security consultants wave on wave (66% Wave Five vs 59% Wave Four). Influence of the other groups remained stable. There were also no significant differences between charities and businesses for influence of feedback on actions.
Figure 4.2: Influence of feedback on cyber security amongst businesses
Over the last 12 months, how much have your actions on cyber security been influenced by feedback from any of the following groups? (A great deal/fair amount)
| Wave | % External IT or cyber security consultants | % Your insurers | % Your customers | % Regulators for your sector | % Whoever audits your account |
|---|---|---|---|---|---|
| Wave 1 | 47 | 26 | 21 | 21 | 19 |
| Wave 2 | 53[s1] | 35[s1] | 27 | 23 | 22 |
| Wave 3 | 53 | 34 | 21 | 21 | 21 |
| Wave 4 | 64[s1] | 42[s1] | 35[s1] | 33[s1][s2] | 29[s1][s2] |
| Wave 5 | 60 | 43 | 36 | 36 | 30 |
[s1] Significant change from previous year at 95% significance level
[s2] Significant difference between businesses and charities at 95% significance level
Base: All businesses at Wave One (n=1205), Wave Two (n=688), Wave Three (n=542), Wave Four (n=674) and at Wave Five (n=521).
Bodies that influenced businesses and charities
Businesses commonly cited participation in industry groups and engagement with government initiatives as central to strengthening cyber security. Several organisations reported working with the City of London Cyber Griffin unit through industry memberships. One business highlighted signing up for the City of London Police National Cyber Security Centre’s alerting and monitoring service. External commercial arrangements included penetration testers, managed SIEM providers, and other managed service providers (MSSPs).
“I’m constantly looking at the National Cyber Security Centre, looking at the Open Worldwide Application Security Project (OWASP) … I’m having to go out and find the free variants of it and making the utilisation, using what I can.”
Business, Medium, Real Estate
Some businesses relied on government guidance and frameworks, including the NCSC’s 10 Steps to Cyber Security, Cyber Security Toolkit for Boards, and Cyber Aware resources, although use was not always consistent. Platforms such as BitSight were employed to scan external vulnerabilities and support remediation with vendors. Several organisations drew on professional contacts or informal networks, including law enforcement and intelligence bodies, to inform decisions and verify security measures.
Resources leveraged by businesses and charities
Businesses also leveraged vendor newsletters and AI tools to stay updated on emerging threats and manage patching. Partnerships with Managed Security Service Providers enabled continuous monitoring and alerting, freeing internal IT teams to focus on strategic improvements. Cyber security certifications, such as Cyber Essentials and NIST frameworks, provided structured approaches to security, with some organisations reporting that they went beyond ISO 27001 requirements to achieve more comprehensive coverage. Overall, external engagement and commercial partnerships were critical in supplementing internal capabilities and supporting proactive security measures.
Among charities, external support similarly included both public and private resources. The NCSC was widely used for training, monitoring, and guidance, including tools such as Exercise in a Box and multi-factor authentication education.
“NCSC, we use them quite a bit. So they’re monitoring our sites, our email. They’re very proactive, actually…which is very, very helpful.”
Charity, England
MSPs
Managed service providers and IT consultants were frequently relied upon to provide technical support and address vulnerabilities. Membership in sector bodies, such as the Scottish Federation of Housing Associations or the Scottish Colleges Information Leaders (SCIL), enabled access to training, consultancy, and peer learning. Charities also drew on Microsoft support, vendor partnerships, newsletters, and collaboration to share knowledge and anticipate threats. Social media and free resources were occasionally used to identify tools or guidance, reflecting tight budget constraints.
“Being a social care charity, we work on very slim margins and we just don’t have a lot of money to throw at it. So, we’re kind of always looking for freebies, I suppose.”
Charity, England
Similar to the quantitative results shown in Figure 4.1, external factors appeared to be more influential qualitatively this wave than previous, particularly surrounding large-scale attacks reported in the media. While this creates an opportunity for driving change, it is unreliable. Businesses tended to be more influenced by external sources of behaviour change than charities. Various bodies, guidance, and MSPs were noted as important catalysts for change, since the resources available allowed for time-poor organisations to have clear direction on how to improve cyber security posture.
4.3 Impact of cyber incidents
From the qualitative findings, cyber security incidents led to organisations becoming more alert and watchful about security matters. Each reported incident increased awareness about the importance of cyber security. This helped reduce complacency amongst staff, making them recognise the need to stay vigilant.
Even smaller incidents, such as emails sent to the wrong person, taught staff valuable lessons and made them more careful in future communications.
“I think they helped improve attitudes because people could see. Oh, we’re at risk. I think if nothing at all happened then people get a bit complacent, don’t they? So, they see the risk, and I think they can see how to avoid the risk.”
Business, Medium, Manufacturing, Wales
Incidents became powerful teaching moments for organisations. They helped improve practices and showed the ongoing need for vigilance and education. Staff developed better understanding of risks and how to avoid them. When staff were personally affected by smaller incidents, they often felt embarrassed, which helped reinforce what they had learned.
Cyber security incidents had mixed effects on how organisations viewed security, with both positive and negative impacts. Some organisations became more proactive, increasing their security investments and reviewing their existing defences after incidents like ransomware attacks. However, not all organisations changed their attitudes. Some remained focused only on their own internal security and paid less attention to what external businesses were doing.
Different groups within organisations viewed cyber security incidents differently. Management tended to worry about the costs or reputational harm, while staff were concerned about disruption to their daily work and job security. Problems arose when security measures made routine work more complicated, even when organisations tried to promote good security practices.
Organisations generally accepted that their partner companies needed to improve their cyber security practices in supply chains. After experiencing cyber security incidents, organisations took email account compromises more seriously, showing they had become more aware of threats.
Several organisations experienced minimal long-term effects from cyber security incidents. This was because the incidents were relatively minor, with the main cost being downtime during the incident rather than lasting damage. Organisations reported no significant negative long-term effects from the cyber security incidents they experienced.
However, some long-term effects did emerge. Communication difficulties with legitimate suppliers became a major issue when suppliers could not meet security requirements. This negatively affected business operations in departments such as gas fitting and surveying. To maintain operations, organisations lifted some restrictions on certain suppliers but had to monitor them closely.
5. Cyber security budget and board involvement
This chapter examines the sufficiency of cyber security budgets amongst businesses and charities, as well as levels of board involvement, training, and organisational structures in relation to cyber security. This includes cross-sectional analysis of cyber security budgets and incorporates both cross-sectional and longitudinal data for board involvement.
Wave Five of the cross-sectional data showed just over one-third (37%) of businesses and (36%) charities reported their budgets increased in the last 12 months. However, charities were more likely than businesses to report their cyber security budgets as insufficient and potentially leaving them exposed in some areas (10% charities vs 5% businesses). This remained a consistent challenge across waves, with financial constraints potentially leaving charities exposed to cyber threats.
This could be influenced by the level of board engagement. Businesses reported a notable increase in board engagement; however, charities did not demonstrate any board involvement increases wave on wave. Longitudinally, while overall organisations had a higher propensity to make positive changes around board member governance at time point 2, there were no significant differences based on organisation type nor incident experience.
Charities were less likely to report frequent board discussions (more often than 6 months) than businesses over time when comparing positive and negative change rates. Large businesses were twice as likely to see uptake of more frequent board discussion while charities showed a higher propensity for negative change over time (Large business rate of change = 2.1, charity rate of change = 0.8).
Longitudinally, across all organisations there was a lower propensity for positive change around frequency of board training. However, there were no significant differences among organisation type nor incident experience.
5.1 Budget
Most businesses and charities either increased their cyber security budgets, or their budgets remained the same. Over one-third (37%) of businesses and (36%) charities reported their budgets increased in the last 12 months, while only 2% of businesses and 4% of charities decreased their budgets. Large businesses were more likely to increase their budgets, either sizeably (16% large vs 9% medium-sized), or somewhat (36% large vs 25% medium-sized). A large proportion (36%) of businesses and (41%) charities kept the same budgets, which in real terms is a decrease due to inflation. and (41%) charities kept the same budgets, which in real terms is a decrease due to inflation.
Figure 5.1: Change in organisations’ cyber security budget
How has the budget for cyber security changed in the last 12 months? Has it…?
| Wave | Businesses | Charities |
|---|---|---|
| Sizeably increased | 10% | 10% |
| Somewhat increased | 27% | 26% |
| Increased in line with inflation | 18% | 17% |
| Stayed the same | 36% | 41% |
| Somewhat decreased | 1% | 3% [s2] |
| Sizeably decreased | 1% | 1% |
| Don’t know | 7% [s2] | 2% |
[s2] Significant difference between businesses and charities at 95% significance level
Bases: 521 UK businesses; 273 charities
Figure 5.2 shows the majority of businesses consider their cyber security budgets to be sufficient to address their main priorities, with a significant increase from 48% in Wave 4 to 56% in Wave 5. However, around one in three businesses still feel their budget only partly meets their needs or leaves some areas exposed, and a small proportion remain unsure.
Figure 5.2: Sufficiency of organisations’ cyber security budget
Which of the following best characterises your cyber security budget? Is it…?
| Wave | Businesses | Charities |
|---|---|---|
| Sufficient to address cyber security needs/goals | 32% | 32% |
| Sufficient to address main priorities | 56% | 52% |
| Insufficient and potentially leaving the organisation exposed in some areas | 5% | 10% |
| Insufficient and definitely leaving areas of the organisation exposed | 2% | 3% |
| Don’t know | 5% | 4% |
[s1] Significant change from previous year at 95% significance level
Bases: 521 UK businesses; 273 charities
Figure 5.3 shows that 52% of charities in both Wave Four and Wave Five describe their budgets as sufficient to address their main priorities. However, fewer than a third report that their budgets are adequate to meet all their goals and needs, with 32% in Wave Five compared to 29% in Wave Four.
Figure 5.3: Sufficiency of charities cyber security budget
Which of the following best characterises your cyber security budget? Is it…?
| Wave | % Sufficient to address cyber security needs/goals | % Sufficient to address main priorities | % Insufficient and potentially leaving the organisation exposed in some areas | % Insufficient and definitely leaving areas of the organisation exposed | Don’t know |
|---|---|---|---|---|---|
| Wave 4 | 29 | 52 | 9 | 2 | 8[S1] |
| Wave 5 | 32 | 52 | 10[s2] | 3 | 4 |
Bases: 273 charities
[s1] Significant change from previous year at 95% significance level
[s2] Significant difference between businesses and charities at 95% significance level
Similar to previous waves, charities were more likely than businesses to report their cyber security budgets as insufficient and potentially leaving them exposed in some areas (10% charities vs 5% businesses). Since Wave Four, more businesses noted that their cyber budget was sufficient to address their main priorities (56% Wave Five vs 48% Wave Four). Around one-fifth (22%) of businesses and (21%) charities highlighted that cyber security investment is harder to justify than other areas of the organisation, in line with Wave Four. Medium-sized businesses were more likely to state their cyber security investment is harder to justify than other areas of the business (23% medium-sized businesses vs 15% large businesses).
Figure 5.4: Attitude towards cyber budget
Which of the following statements best describes your organisations attitude towards cyber security investment? Is it…?
| % Wave | Businesses | Charities |
|---|---|---|
| Easier to justify than other areas of the business | 29% | 24% |
| Given equivalent/fair treatment in comparison to other areas of the business | 46% | 52% |
| Harder to justify than other areas of the business | 22% | 21% |
| Don’t know | 3% | 3% |
No significant changes from previous years or between businesses and charities at 95% significance levels were observed
Bases: 521 UK businesses; 273 charities
From the qualitative findings, leadership support and financial investment in cyber security helped organisations maintain security and prevent significant breaches. For example, in one organisation leadership showed this support by investing in robust cyber systems, including Arctic Wolf, SIEM platforms, and the Full Defender suite.
Investment levels were substantial in some instances, with one medium sized chartered accountancy and tax advisory business spending £300,000 the previous year on five-year contracts for SIEM, firewalls, and antivirus. Another organisation viewed both the substantial financial investment in security and pursuit of recognised certifications as key strengths.
At the same time, resource limitations constrained organisations’ cyber security capabilities. Businesses needed to balance security investment with profitability and could not spend all profits on cyber security. Budget constraints limited how much organisations could invest and how often they could conduct in-depth cyber security measures.
Charities faced this issue more acutely than businesses. Training IT teams to conduct more frequent phishing exercises was identified to work around these budget limitations.
Similar to previous waves, financial constraints limited organisations’ cyber security capabilities.
“I think probably the main thing [barrier] probably would be budget. We do quite well out of the budget because we do have that buy in from senior leadership team. But yeah, there’s always budget constraints.”
Charity, England
Budget restrictions meant only limited money was available for cyber security initiatives. These funding limitations had practical consequences. They prevented businesses from hiring personnel for penetration testing or employing specialist organisations to test networks.
The constraints stopped organisations from implementing more sophisticated security measures and limited technological investments. Organisations had to balance cost-effectiveness with security needs, which meant prioritising certain actions over others based on immediate risks and available resources.
5.2 Board involvement
Businesses reported a notable increase in board engagement compared to Wave Four. Around two-thirds (67%) of businesses stated they have one or more board members whose roles include oversight of cyber security risks, up from 61% in Wave Four. A majority (71%) of businesses stated they have a designated staff member responsible for cyber security, who reports directly to the board, up from 63% in Wave Four. There were no significant differences between large and medium businesses, except for very large (500+) businesses being more likely than medium-sized businesses to have such a designated staff member (82% very large vs 71% medium-sized businesses).
There were no changes among charities wave on wave, and charities were less likely to have any designated board or staff member for cyber security risks than businesses (86% businesses vs 77% charities), particularly board members (51% charities vs 67% businesses).
Longitudinally, while overall organisations had a higher propensity to make positive changes around board member governance at time point 2 (shown in Figure 5.5), there were no significant differences based on organisation type nor incident experience.
Figure 5.5: Longitudinal board governance
| Board Governance Activity | Positive change | Negative change | Rate of change |
|---|---|---|---|
| Oversight of cyber security risks by board members | 34% | 25% | 1.36 |
| Designated staff reporting directly to the board | 38% | 21% | 1.81 |
| Board Governance Activity by impact type | None | Incident without impact and/or outcome | Incident with impact and/or outcome |
|---|---|---|---|
| Oversight of cyber security risks by board members | 1.0 | 1.5 | 1.7 |
| Designated staff reporting directly to the board | 1.3 | 2.0 | 2.2 |
| Board Governance Activity by organisation type | Medium-sized businesses | Large businesses | Charities | |
|---|---|---|---|---|
| Oversight of cyber security risks by board members | 1.8 | 2.2 | 0.8 | |
| Designated staff reporting directly to the board | 1.8 | 2.4 | 1.6 |
Figure 5.6: Businesses’ board governance of cyber security
Does your organisation have any of the following?
| Wave | % One or more board members whose role includes oversight of cyber security risks | % A designated staff member responsible for cyber security, who reports directly to the board | % None of these |
|---|---|---|---|
| Wave 1 | 50 | 55 | 30 |
| Wave 2 | 54 | 61 [s1] | 25 |
| Wave 3 | 55 | 66 | 24 |
| Wave 4 | 61 [s1] [s2] | 63 [s1] | 21 |
| Wave 5 | 67 [s1] [s2] | 71 | 14 |
[s1] Significant change from previous year at 95% significance level
[s2] Significant difference between businesses and charities at 95% significance level
Base: All businesses at Wave One (n=1205), Wave Two (n=688), Wave Three (n=542), Wave Four (n=674) and at Wave Five (n=521).
Figure 5.6 above shows business’ board governance of cyber security. Figure 5.7 below shows charities’ board governance of cyber security.
Medium-sized businesses were more likely to have board-level cyber discussions 1-2 times a year, compared to large businesses (30% vs 19%). Compared to medium-sized businesses, large businesses were more likely to discuss quarterly or more often (65% large vs 49% medium-sized). Businesses were more likely than charities to strongly agree that the board integrates cyber risk considerations into wider business areas (38% businesses vs 26% charities).
From the longitudinal data, while overall the positive change and negative change around frequency of board discussions were similar, both organisation type and incidence type significantly affected frequency of board discussions. Charities were less likely to have frequent board discussions at time point 2 than 1, and less likely to have a positive change than medium-sized and large businesses. This is also influenced by whether an organisation has had an incident, or an incident with impacts and outcomes (shown in Figure 5.8).
Figure 5.7 Charities’ board governance of cyber security
Does your organisation have any of the following?
| Wave | % One or more board members whose role includes oversight of cyber security risks | % A designated staff member responsible for cyber security, who reports directly to the board | % None of these |
|---|---|---|---|
| Wave 1 | 40 | 61 | 32 |
| Wave 2 | 41 | 60 | 31 |
| Wave 3 | 45 | 61 | 29 |
| Wave 4 | 51 | 64 | 24 |
| Wave 5 | 51 | 68 | 23 [s2] |
[s1] Significant change from previous year at 95% significance level
[s2] Significant difference between businesses and charities at 95% significance level
Base: All charities at Wave One (n=536), Wave Two (n=373), Wave Three (n=310), Wave Four (n=548) and at Wave Five (n=273).
Figure 5.8: Longitudinal board discussion frequency
| Board Discussion Frequency | Positive change | Negative change | Rate of change |
|---|---|---|---|
| Board discussions or updates on cyber security | 30% | 27% | 1.10 |
| Board Discussion Frequency by incident type | None | Incident without impact and/or outcome | Incident with impact and/or outcome |
|---|---|---|---|
| Board discussions or updates on cyber security | 0.8 | 1.0 | 1.5 |
| Board Discussion Frequency by organisation type | Medium-sized businesses | Large businesses | Charities | |
|---|---|---|---|---|
| Board discussions or updates on cyber security | 1.3 | 2.1 | 0.8 |
Figure 5.9: Frequency of board discussion or updates on cyber security
Over the last 12 months, roughly how often, if at all, has your board discussed or received updates on your organisation’s cyber security? Is it …
| % Wave | Businesses | Charities |
|---|---|---|
| Never | 7% | 10% |
| Once a year | 13% | 23%[s2] |
| Once every 6 months | 15%[s1] | 14% |
| Quarterly | 29% | 34% |
| Monthly | 18%[s2] | 4% |
| Each time there is a breach or attack | 9% | 8% |
| Don’t know | 5% | 5% |
[s1] Significant change from previous year at 95% significance level
[s2] Significant difference between businesses and charities at 95% significance level
Bases: 521 UK businesses; 273 charities
A large proportion (38%) of charities reported that board members did not receive any cyber security training, significantly more than just 23% of businesses. Board members that did not receive any cyber security training were more common amongst medium businesses (23% medium-sized vs 13% large).
Longitudinally, organisations overall showed a lower propensity for positive change around board training frequency (shown in Figure 5.10). There were no significant differences by organisation type nor incident experience.
Figure 5.10: Longitudinal board training frequency
| Board Training Frequency | Positive change | Negative change | Rate of change |
|---|---|---|---|
| Average frequency of cyber security training for board | 21% | 27% | 0.78 |
| Board Training Frequency by incident type | None | Incident without impact and/or outcome | Incident with impact and/or outcome |
|---|---|---|---|
| Average frequency of cyber security training for board | 0.4 | 0.8 | 0.9 |
| Board Training Frequency by organisation type | Medium-sized businesses | Large businesses | Charities | |
|---|---|---|---|---|
| Average frequency of cyber security training for board | 0.88 | 1.25 | 0.49 |
Base: 3361
Figure 5.11: Frequency the board receives cyber security training amongst businesses
On average, how often does the board receive cyber security training?
| Wave | % Several times a year | % Around once a year | % Less often than once a year | % One received once/one-off training | % Board do not receive any cyber security training | % Don’t know |
|---|---|---|---|---|---|---|
| Wave 2 [Note 1] | 12[s1] | 19[s1] | 4 | 7 | 40 | 18 |
| Wave 3 | 16 | 24 | 4 | 5 | 37 | 14 |
| Wave 4 | 21[s1][s2] | 32[s1][s2] | 6 | 9[s1] | 23 | 9 |
| Wave 5 | 21[s1] [s2] | 34 [s2] | 8 | 9 | 23 | 5 |
[s1] Significant change from previous year at 95% significance level
[s2] Significant difference between businesses and charities at 95% significance level
[Note 1] Not asked in Wave One
Base: All businesses at Wave Two (n=688), Wave Three (n=542), Wave Four (n=674) and at Wave Five (n=521).
Figure 5.11 above shows the frequency the board receives cyber security training amongst businesses. Figure 5.12 below shows frequency the board receives cyber security training amongst charities.
Figure 5.12: Frequency the board receives cyber security training amongst charities
On average, how often does the board receive cyber security training?
| Wave | % Several times a year | % Around once a year | % Less often than once a year | % One received once/one-off training | % Board do not receive any cyber security training | % Don’t know |
|---|---|---|---|---|---|---|
| Wave 2 [Note 1] | 5 | 13 | 7 | 6 | 42 | 26 |
| Wave 3 | 4 | 18 | 8 | 7 | 45 | 18 |
| Wave 4 | 7 | 22 | 11[s2] | 9 | 40[s2] | 11[s1] |
| Wave 5 | 6 | 26 | 13[s2] | 11 | 38 [s2] | 6 [s2] |
[s2] Significant difference between businesses and charities at 95% significance level
[Note 1] Not asked in Wave One
Base: All charities at Wave Two (n=373), Wave Three (n=310), Wave Four (n=548) and at Wave Five (n=273).
From the qualitative findings, some organisations commonly established direct reporting lines between cyber security functions and board level. This showed a shared approach to governance. Boards received regular updates about cyber security matters in both businesses and charities. Board presentations were a standard way to share cyber security information. These presentations included risk scores, breach attempts, and security statistics.
However, the frequency of board engagement with cyber security varied considerably between organisations. Some held weekly executive meetings, others had quarterly committee reports, and some only discussed cyber security annually unless major incidents occurred.
“I report weekly and probably four or five times a year I have to report in more detail. So weekly is just a summary, you know, where we are. Things that have gone well, things that have gone not so well. Any severe issues are reported immediately. You know, things like data breaches, compliance issues, anything like that are reported on the spot.”
Business, Medium, Wholesale and Retail Trade, England
Organisations structured their cyber security governance differently. Some used dedicated subcommittees for cyber security. Others included cyber security discussions in their existing executive and operating committees or full board meetings.
“Well, the Chief Operating Officer is at the moment responsible for it… We have an IT steering group every two months. Cyber security is discussed at that meeting.”
Charity, England
Boards were involved in different ways too. Some actively participated in decision-making and supported security initiatives. Others delegated responsibility, with board members deferring to individual members who had cyber security expertise.
Cyber security became an established item on board agendas across multiple organisations. This showed that boards recognised it as a governance priority. The presence of individual board members with specific cyber security expertise was notable. Some members brought direct experience of incidents, such as ransomware attacks, from their previous organisations.
Boards commonly received the same cyber security training as general staff rather than board-specific programmes.
“I mean, along with all the other stuff, we have training, which, yeah, staff have to do, and they will also do it.”
Business, Medium, Professional, Scientific or Technical, England
Annual training delivery was standard across most organisations. IT departments shared cyber security information with boards through presentations and internal knowledge sharing sessions. However, organisations faced widespread challenges with low completion rates and limited engagement from board members.
“They’ll either ignore it or say they’ve not got time. The only time we, we actually had a response from one of the board members was I sent out a phishing test and seven people clicked on the link and entered the credentials, one of them being a manager. And I, I was very annoyed and went, basically went to this board member and said look, this is ridiculous, you know, we need to do something about this, can you please start pushing this more? And they said yes and then did nothing.”
Business, Large, Other Service Activities, England
Training provision to boards varied significantly. Some organisations provided no training at all, whilst others had mandatory programmes with enforcement measures. The frequency of training ranged from weekly simulated phishing attacks to monthly tailored articles to quarterly awareness courses to annual modules.
Board members’ ability to participate depended on their account access. Those without user accounts could not participate, whilst those with corporate accounts participated fully. Enforcement methods also varied, from actively pursuing board members and threatening escalation for non-completion to having no enforcement at all.
Common patterns emerged around how boards engaged with cyber security training. Boards often delegated cyber security responsibilities to specific individuals or IT departments rather than engaging directly. The voluntary nature of charity trustees and busy schedules of board members created barriers to training participation. Boards tended to rely on IT departments or designated individuals to attend training and share key findings with them.
Board knowledge about cyber security varied considerably. Some boards were described as quite knowledgeable, whilst others showed minimal engagement and support.
Board involvement strengthened organisational cyber security capabilities when leadership showed engagement and support. Boards and leadership teams that co-operated with cyber security requests and acknowledged its critical importance demonstrated this strength.
Board knowledge and attention were key factors that enabled cyber security initiatives. When boards were knowledgeable about cyber security and paid appropriate attention to it, they backed security initiatives. This support helped organisations avoid the struggles that occurred when leadership did not support necessary changes.
Conclusions
This study provides a comprehensive view of organisations’ cyber security across five waves. The key conclusions from this 2025 report are:
Despite adherence to standards and accreditations such as Cyber Essentials improving over time, most organisations tended to be more reactive to drive change. The results explored regarding adherence to Cyber Essentials, Cyber Essentials controls, and adhering to at least one standard or accreditation are promising. Data from Wave Five and previous CSLS reports show that adherence to one of these standards generally leads to more robust cyber security practices. However, the longitudinal results demonstrate that organisations are generally more likely to make a change at time point 2 if they experienced an incident with an impact and/or outcome at time point 1. This highlights a more reactive approach to make positive changes in an organisation’s cyber security posture. A reactive approach may leave organisations vulnerable to serious consequences of an attack.
Reputational damage appears to be a key driver for cyber behaviour change, but reports of large-scale attacks or personal experience of incidents should not be relied on as a catalyst for change. The Wave Five results depicted an apparent increase on the effect of external influences, such as large-scale attacks, to be used as a catalyst for cyber change. This was particularly highlighted in addressing cyber security budget concerns, and/or securing senior leadership buy-in for cyber processes and policies. However, the frequency of these external reports is unreliable. Solidifying the reactive nature of using incidents as evidence for change, this may leave organisations vulnerable if there are no large-scale attacks reported in the future.
Supplier management continued to be a particular weak point in cyber resilience. Less than a third of businesses and charities reported any kind of formal supply chain management processes regarding cyber security. However, most organisations reported experiencing some kind of cyber incident. This poses the risk that a supplier is likely to experience an incident and could lead to impacts and/or outcomes in the rest of the supply chain. Charities and medium-sized businesses showed declining supplier management across two points in time. Consequently, this risk often remains unmitigated across many organisations.
Individuals were frequently cited as weak points for most organisations, however views on effective communication and training varied. Most organisations highlighted that individuals were either an asset or point of weakness for the organisation’s cyber security posture. Tailored communications and frequent training were noted as important ways to increase individual vigilance. However, discrepancies arose among method of communication, and internal cultures of training. For example, while some organisations believed a ‘name and shame’ culture of training errors was ineffective, other organisations posited that this leads to effective behaviour changes rather than complacency. Board members also showed variability in training uptake and vigilance. While there is no one-size fits all approach to organisational communication, cyber culture should be investigated further to assess potential guidance and clarity.
The frequency of board discussions around cyber security relies too heavily on organisation type or experience of incidence. The frequency in which board members discussed or received updates about cybersecurity appears promising for larger businesses and medium-sized businesses, who reported more positive changes around frequent discussions over time. However, charities reported higher levels of negative changes over time. Further, organisations were more likely to show positive changes if they experienced an incident with and impact and/or outcome. Since senior buy-in is important for positive behaviour change, this could leave organisations vulnerable.
Final thoughts
CSLS continues to be an important study to examine the evolution of organisations’ cyber security over time. This report highlights both positive and concerning trends in UK organisations’ cyber security landscape.
While organisations are adopting proactive behaviour changes such as accreditation and standard adherence over time, most organisations’ approach to cyber security results from a reactive standpoint to incidents with an impact and/or outcome. However, some organisations demonstrate a more proactive stance, and further investigation is required to understand the factors underpinning the differences. Addressing internal barriers to behaviour change, such as effective communication and training or leadership buy-in, appear crucial for building a more resilient cyber security posture in the UK. External influences on behaviour change such as widespread coverage of large-scale attacks have proven useful drivers of change, however these cannot be relied on to serve as drivers of change and risk complacency if there are no large-scale attacks reported.
Further research waves hold the potential to provide ongoing insights into cyber resilience among medium and large businesses, and high-income charities. This is particularly relevant for the longitudinal analysis.
Glossary
| Baseline survey | Also see Wave One Survey. The first research year of the survey that took place (2021). | |
| Cyber security | Cyber security includes any processes, practices or technologies that organisations have in place to secure their networks, computers, programs or the data they hold from damage, attack or unauthorised access. | |
| Cyber security posture | An organisation’s overall level of preparedness and effectiveness in defending against and responding to cyber threats. | |
| Cyber defences | Cyber defence refers to the practices, technologies, and strategies used to protect systems from cyber threats, unauthorised access, and attacks. | |
| Cyber Essentials | Cyber Essentials is a UK government-backed scheme that helps organisations protect themselves against common cyber attacks by implementing basic technical controls. | |
| Cyber Essentials Plus | The higher tier of the UK’s Cyber Essentials scheme, providing independent technical testing to verify that basic cyber security controls are correctly implemented. | |
| ISO 27001 | A global standard for establishing and maintaining an Information Security Management System (ISMS) to protect sensitive information. | |
| Regular penetration tests | Planned, simulated cyber attacks on an organisation’s systems, networks, or applications to identify vulnerabilities and assess the effectiveness of security controls. | |
| Longitudinal Survey | A longitudinal survey is a research design that involves repeated observations of the same variables (e.g. people or businesses) over short or long periods of time. | |
| Cyber incident | A cyber incident is a malicious and deliberate attempt by an individual or organisation to breach the information system of another individual or organisation. | |
| Negative Outcome | A negative outcome of an attack involved a material loss from an organisation, such as a loss of money or data. | |
| Negative Impact | A negative impact on organisations did not have to involve a material loss. This could be issues relating to staff disruption or implementing new measures in the organisation. | |
| Medium-sized business | Businesses with 50 to 249 employees. | |
| Large business | Businesses with 250 employees or over. | |
| High-income charities | Charities with an annual income of between £1 million to £10 million per year. | |
| Phishing | Fraudulent attempts to extract important information, such as passwords, from staff with infiltration through a link or attachment sent via email. | |
| Positive change | From the longitudinal analysis, positive change refers to any change an organisation has made that is seen to positively influence their cyber security posture. Also referred to as gain where applicable. | |
| Negative change | From the longitudinal analysis, negative change refers to any change an organisation has made that is seen to negatively influence their cyber security posture. Also referred to as loss where applicable. | |
| Rate of change | From the longitudinal analysis, the rate of change refers to the ratio of positive change to negative change. | |
| Wave One Survey | Also see Baseline survey. The first research year of the survey that took place (2021). | |
| Wave Two Survey | The second research year of the survey that took place (2022). | |
| Wave Three Survey | The third research year of the survey that took place (2023). | |
| Wave Four Survey | The fourth research year of the survey that took place (2024). | |
| Wave Five Survey | The fifth research year of the survey. This is the current survey year (2025). |
Annex A: Further information
The Department for Science, Innovation and Technology would like to thank Ipsos and Steven Furnell of the University of Nottingham for their work in the development and carrying out of the survey and for their work compiling this report.
This research report is accompanied by a technical report.
The responsible DSIT analyst for this release is Emma Johns. For enquiries on this release, please contact us at cybersurveys@dsit.gov.uk.
For general enquiries contact:
Department for Science, Innovation and Technology
22-26 Whitehall
London
SW1A 2EG
For media enquiries only (24 hours) please contact the DSIT press office on 020 7211 2210.
This work was carried out in accordance with the requirements of the international quality standard for Market Research, ISO 20252, and with the Ipsos UK Terms and Conditions which can be found at www.ipsos.com/terms.
Annex B: Guide to statistical reliability
The final data from the survey is based on weighted samples, rather than the entire population of UK businesses or charities. Percentage results are therefore subject to margins of error, which vary with the size of the sample and the percentage figure concerned. For example, for a question where 50% of the 674 businesses sampled in the survey give a particular answer, the chances are 95 in 100 that this result would not vary more or less than 4.0 percentage points from the true figure – the figure that would have been obtained had the entire UK business population responded to the survey. The margins of error that are assumed to apply in this report are given in the following table.
Margins of error (in percentage points) applicable to percentages at or near these levels
| Total | Unweighted base | Effective base | 10% or 90% | 30% or 70% | 50% | |
|---|---|---|---|---|---|---|
| All businesses | 521 | 407 | ±2.6 | ±3.9 | ±4.3 | |
| Medium businesses | 296 | 278 | ±3.4 | ±5.2 | ±5.7 | |
| Large businesses | 207 | 190 | ±4.1 | ±6.3 | ±6.8 | |
| Charities | 273 | 273 | ±3.6 | ±5.4 | ±5.9 |
Annex C: Longitudinal questions analysed
| Question Code | Question text |
|---|---|
| Q_COMPLY | Which of the following standards or accreditations, if any, does your organisation adhere to? |
| Q_IDENT | Which of the following, if any, have you done over the last 12 months to identify cyber security risks to your organisation? |
| Q_RULES | And which of the following rules or controls, if any, do you have in place? |
| Q_GOV | Does organisation have documentation in place to help manage cyber security risks? |
| Q_INCIDMAN | Do you have any written processes for how to manage a cyber security incident, for example, an incident response plan? |
| Q_SUPPLYHOW | Which have you done with any of your suppliers or partners in the last 12 months? |
| Q_SUPPLYRISK | In the last 12 months, has your organisation carried out any work to formally assess/manage potential cyber security risks presented by any suppliers/partners? |
| Q_INSUREX | Which of the following best describes your situation? |
| Q_BOARDGOVERN | Does your organisation have… One or more board members whose roles include oversight of cyber security risks / A designated staff member responsible for cyber security, who reports directly to the board? |
| Q_BOARDDISCUSS | Over the last 12 months, roughly how often, if at all, has your board discussed or received updates on your organisation’s cyber security? |
| Q_BOARDENGAGE | How much would you agree or disagree with… The board integrates cyber risk considerations into wider business areas? |
| Q_BOARDTRAINFREQ | On average, how often does the board receive cyber security training? |
-
Wide-spread news of attacks were left open to be defined by respondents, often referred to by large-scale news stories or industry related ↩
-
Some references to very large businesses (500+ employees) are included where data is of particular interest. Unless stated otherwise, references to large businesses incorporate all businesses with 250+ employees. ↩
-
The survey was set up predominantly as a telephone survey, but using a multimode (telephone and online) approach aims to maximise response rates, and to reduce non-response bias by allowing respondents the choice of whether to complete the survey by telephone or online. Participants with a valid email address were given the option to complete the survey over the phone or online. ↩
-
The quantitative fieldwork dates were 9 June- 29 August 2025 ↩
-
Some references to very large businesses (500+ employees) are included where data is of particular interest. Unless stated otherwise, references to large businesses incorporate all businesses with 250+ employees. ↩
-
If organisations had been confirmed as eligible and included when first interviewed in Waves One, Two, Three, or Four, but now have fewer than 50 employees (businesses) or an income below £1 million (charities), they are still considered eligible to participate in this wave. ↩
-
Subgroup differences highlighted are either those that emerge consistently across multiple questions or those that evidence a particular hypothesis (i.e. not every single statistically significant finding has been commented on). ↩
-
Some references to very large businesses (500+ employees) are included where data is of particular interest. Unless stated otherwise, references to large businesses incorporate all businesses with 250+ employees. ↩
-
If organisations had been confirmed as eligible and included when first interviewed in Waves One, Two or Three, but now have fewer than 50 employees (businesses) or an income below £1 million (charities), they are still considered eligible to participate in this wave. ↩
-
The five Cyber Essentials controls include 1) A policy to apply software security updates within 14 days; 2) Up-to-date malware protection across all your devices; 3) Firewalls that cover your entire IT network, as well as individual devices; 4) Restricting IT admin and access rights to specific users; 5) Security controls on your organisation’s own devices (e.g. laptops). ↩
-
Variables identa, identc, identd, rules10, incidman, supplyhow6, supplyrisk, bdiscussr ↩