Creative spillovers: do the creative industries benefit firms in the wider economy?
Published 14 June 2023

© Crown copyright 2023
This publication is licensed under the terms of the Open Government Licence v3.0 except where otherwise stated. To view this licence, visit nationalarchives.gov.uk/doc/open-government-licence/version/3 or write to the Information Policy Team, The National Archives, Kew, London TW9 4DU, or email: psi@nationalarchives.gov.uk.
Where we have identified any third party copyright information you will need to obtain permission from the copyright holders concerned.
This publication is available at https://www.gov.uk/government/publications/creative-spillovers-do-the-creative-industries-benefit-firms-in-the-wider-economy/creative-spillovers-do-the-creative-industries-benefit-firms-in-the-wider-economy
Executive summary
This report presents the results of new empirical work conducted by Frontier Economics to estimate the impact of the creative industries (CIs) on wider firms’ innovation and activity. The findings add to the growing body of evidence that there are knowledge spillovers from the CIs that have a beneficial impact on the innovation of firms in the wider economy.
Acknowledgements
This report uses statistical data from the ONS. Specifically, data from the Annual Business Survey (ABS), the Labour Force Survey (LFS) and the UK Innovation Survey (UKIS) were accessed through the ONS’s secure research service. The use of the ONS statistical data in this work does not imply the endorsement of the ONS in relation to the interpretation or analysis of the data. This research produces datasets which may not exactly reproduce ONS aggregates.
Frontier Economic thanks both DCMS and the Creative Industries Policy and Evidence Centre (Creative PEC) as co-commissioners of this research for their input and support with the analysis of spillovers.
If you use this document in your own research and/or writing, it should be cited as follows:
Frontier Economics (2023) “Creative spillovers: do the creative industries benefit firms in the wider economy?” co-commissioned by the Department for Culture, Media and Sport and the Creative Industries Policy and Evidence Centre.
Introduction
The creative industries are a force for innovation in the UK economy. Firms in the CIs are considerably more likely to engage in innovation-generating activities and to have introduced product or process innovations than firms operating in other service sectors.[footnote 1] In addition to these measurable outputs, a significant amount of innovation in the creative industries is believed to be generated through day-to-day activities, rather than as the result of specific investments.
Anecdotal evidence supports the idea that the CIs generate knowledge ‘spillover’ benefits, i.e. that new ideas, innovations or processes created by creative industry firms are picked up by firms in other industries, improving those wider firms’ performance at little or no cost. The existence of such spillovers would imply that the knowledge and innovation generated by CIs is under-valued by the creative businesses themselves. This is important for policymakers, as it implies that creative innovation may be under-produced if creative businesses are left to their own devices.
But solid quantitative evidence of knowledge spillovers from the CIs is still sparse. The main exception is Bakhshi, McVittie and Simmie (2008), which examined how the innovation of firms in the wider economy is associated with how much they buy from or sell to the creative industries.[footnote 2] They found that firms that spent more on creative products were significantly more likely to produce product innovations, supporting the argument that spillovers from the CIs exist.
This report builds on that previous research to estimate the impact of the creative industries on wider firms’ innovation using the most recent data available. We also investigate the mechanisms by which knowledge spillovers occur, and explore whether there is any local dimension to spillovers, given growing interest in creative clusters. Finally, we use additional data to examine whether the CIs have any discernible impact on wider firms’ output.
Approach
The approach taken is informed by an earlier scoping study (Frontier Economics 2022). Based on a review of the economic literature examining spillovers and UK data availability, this suggested producing updated evidence using a similar methodology to Bakhshi, McVittie and Simmie (2008).
We hypothesise three possible mechanisms through which knowledge transfers between the creative industries and other industries could occur:
- Through supply chain links with creative industry suppliers. The hypothesis is that firms that buy from the creative industries are influenced to be more innovative by their suppliers. For example, this could be because they learn about creative innovations that can either directly lead to innovations in their own firm or that encourage them to seek to be more innovative themselves.
- Through supply chain links with creative industry customers. The hypothesis is that firms that sell to the creative industries are influenced by these interactions with creative customers. For example, perhaps they learn about creative innovations from their customers that can increase their own rate or innovation or perhaps their customers motivate them to innovate.
- Through labour turnover. The hypothesis is that people recruited from the creative industries are likely to bring with them either knowledge of innovations from the creative industries or an innovative culture and way of thinking. This could have beneficial impacts on the firms’ own innovation.
For each of these possible transfer mechanisms, we calculate a metric that measures (at an industry level) how strong the relevant connection is between wider firms and CI industries. We then examine whether firms that are more connected to the creative industries in these ways have better outcomes than firms that are less connected, after controlling for other factors that might be expected to affect firms’ outcomes (such as firm size). If there are spillover benefits from the CIs through the mechanisms hypothesised, then we would expect better outcomes for firms that have stronger connections. We also allow the strength of any relationship to vary according to the amount of creative industry activity there is in a local area, to explore whether there is any local dimension to spillover benefits.
Innovation outcomes are examined using firm-level data from the UK Innovation Survey (UKIS), while firms’ output is examined using firm-level data from the Annual Business Survey (ABS). We calculate our metrics for the strength of firms’ connection to the CIs using ONS Input-Output tables and the Labour Force Survey, while data on local CIs activity comes from an ONS publication based on Inter-departmental Business Register data. UKIS only surveys businesses with 10 or more employees: our findings should therefore be interpreted as being relevant for the largest 20% of firms with employees in the economy (which together account for 81% of all UK firms’ turnover).[footnote 3]
Findings
Consistent with the previous evidence of Bakhshi, McVittie and Simmie (2008), our analysis finds evidence of positive spillover benefits from the creative industries onto the innovation of wider firms, for all three of the linkages explored.
1. Firms that are more connected to the CIs produce more product innovations, and there is evidence that this is in large part driven by knowledge spillovers
We find that firms that are more connected to the CIs are more likely to create product innovations (new or significantly improved goods or services) and more likely to create novel innovations (that are new to the market not just the firm), than firms that are less connected to the CIs.
A one standard deviation[footnote 4] increase in connection to the CIs is associated with a 1.7-2.0 percentage point increase in the probability of firms producing product innovations. On average 19% of non-creative firms produce product innovations, so this would represent an increase in that probability of 9-11%.
A one standard deviation increase in connection to the CIs is associated with a 1.2-1.4 percentage point increase in the probability of novel innovations that are new to the market. On average 8% of non-creative firms produce novel innovations, so this would represent an increase in that probability of 15-18%.
The figures imply that firms that buy twice the average amount from the creative industries (4% of their sales value rather than 2%), are 10% more likely to produce product innovations and 15% more likely to produce novel product innovations. Similarly, firms with twice the average proportion of hires that come from the creative industries (6% rather than 3%), are 9% more likely to produce product innovations and an 18% more likely to produce novel product innovations. [footnote 5]
Figure 1: Impact on innovation of 1 standard deviation increase in connection to CIs
Percentage point impact on probability of innovation.
| Type of innovation | Connection to CIs suppliers | Connection to CIs customers | Connection to CIs through hires |
|---|---|---|---|
| Product innovation | 1.8 | 2.0 | 1.7 |
| Novel product innovation | 1.2 | 1.2 | 1.4 |
Note: Figures are the implied percentage point change in the probability of different innovation outcomes from a 1 standard deviation increase in a firms’ connection to the CIs. The estimated effects are derived from probit regressions (see Table 2).
We do not, however, find that any consistent evidence that firms that are more connected to the CIs are more likely to produce process innovations[footnote 6] (new or significantly improved processes for producing or supply goods or services) or wider innovations (new or significantly changed corporate strategies, new management techniques, major changes to organisational structure or changes to market concepts) than less connected firms (see Findings).
This association between firms’ product innovation and the strength of their connection to the CIs is consistent with there being spillover benefits. But there may be other factors that we cannot observe (and therefore cannot control for) that also correlate with both firms’ innovation and their connection.
We suggest that perhaps around half of the association found is due to spillovers, and around half due to other factors.
This is based on our finding that the association between CI connection and innovation is around twice as strong (1.9 percentage points compared to 1.0 percentage points) for firms that self-report that the linkage mechanism is an important source of information for their innovation (see Figure 2 and Section 4.3.2). We find similar results across the other three linkage mechanisms. However, it should be noted that none of these differences are statistically significant due to due to the low precision with which we can estimate these interaction effects. This means that the evidence is only indicative of a spillover effect and not definitive.
Figure 2: Association between innovation and connection to the CIs – by whether mechanism is an important source of information
Percentage point impact on probability of innovation.
| Scenario | Percentage point impact |
|---|---|
| When suppliers are not an important source of information for innovation | 1.0 |
| When suppliers are an important source of information for innovation | 1.9 |
2. More connected firms undertake more innovation activity, leading to additional product innovation
We find that the increased likelihood of innovation for firms more connected to the CIs is driven both by an increase in investment in innovation (specifically, spending on research and development), and by a higher probability of successful innovation conditioning on the amount of investment in innovation.
These different routes through which knowledge transfers impact on wider firms are summarised in Figure 3. The association between connection to the CIs and the probability of innovation occurring that is over and above any effect on firms’ own innovation activities[footnote 7] is indicative that wider firms are picking up new ideas and knowledge created by the CIs.
Figure 3: How knowledge from the CIs benefits the wider economy
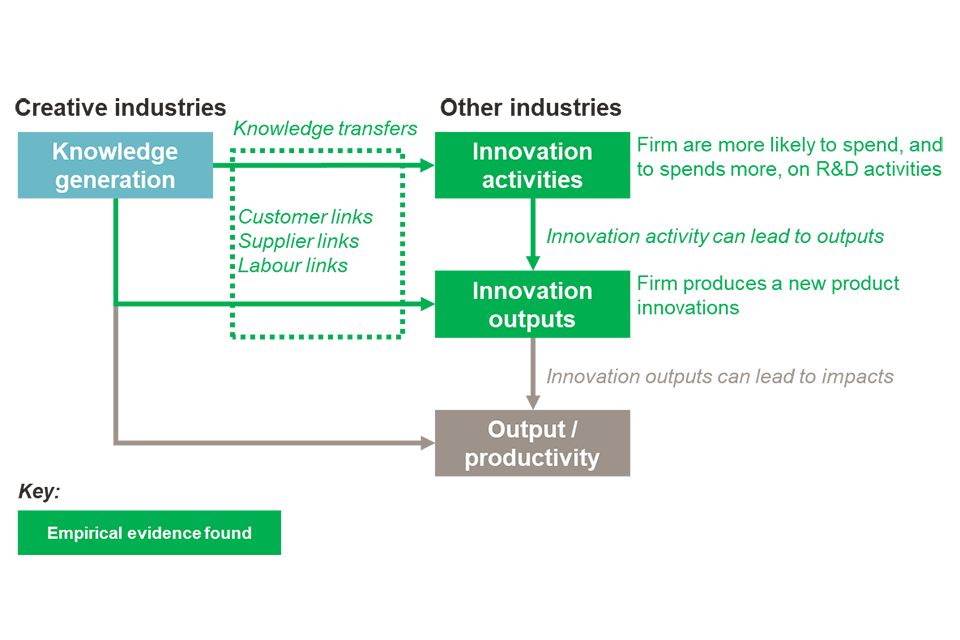
3. The evidence supports the hypotheses that knowledge is transferred to wider firms through their links to CIs customers, links to CIs suppliers, and CIs labour
We find evidence for spillover benefits occurring through all three of our hypothesised transfer mechanisms (CI customers, CI suppliers, and CI labour).
It is worth noting that each of these mechanisms is measured at industry level and the three measures are highly correlated, e.g. industries which tend to purchase a lot of inputs from the CIs also tend to hire a relatively large number of employees from the CIs. The results therefore should not be considered to be separate (i.e. additive) benefit flows – if an industry is already well connected to the CIs through purchasing a lot its inputs from the CIs, it may be unlikely to see as much increase in knowledge transfers from increasing its hiring of employees from the CIs.
The results instead present evidence for the benefits of connections of wider firms to the CIs, and that these connections can be made in a number of different ways.
4. The available data does not suggest that spillovers are locally concentrated
Our methodology allows the estimated strength of the relationship between firms’ connection to the CIs and their innovation to vary according to the importance of the CIs in the local economy. If there were a local dimension to spillovers – for example, if a firm was more likely to learn about an innovation from a creative supplier if that supplier is local to them and they have built up a stronger personal relationship – then we might expect the estimated relationship to be stronger for firms that are located in proximity to more CIs activity.
In practice we do not find any evidence for this. However, since our measures of CIs activity are coarse (measuring all CIs activity in the local travel-to-work-area)[footnote 8] this is an area that is worthy of further exploration in future if more detailed data becomes available.
5. We find spillovers to be similar on average from the IT sub-sector as the other sub-sectors of the CIs
The creative industries are a diverse and heterogenous set of sub-sectors, and so it is natural to ask whether being more connected to some sub-sectors has a greater association with innovation than being more connected to other sub-sectors.
To examine this, we consider separately the association between innovation and connection to the largest sub-divisions of the CIs – the IT sub-sector and the other sub-sectors of the CIs. The results suggest there is no real difference in the estimated relationship overall, though there is some suggestion of a greater local dimension to spillovers from the IT sub-sector than spillovers from the other sub-sectors of the CIs. Again this would be worthy of further exploration in future.
6. With the available data we do not find evidence of spillovers increasing wider firms’ value-added
We also examine whether firms that are more connected to the CIs have higher gross value added once their labour and capital inputs have been controlled for. We do not find evidence to support the argument that the CIs have positive spillover benefits on wider firms’ value-added. However, it would be hard to robustly identify small effects with the micro-data used in this analysis. For more detail, see Annex A.
Interpretation
Overall, the results of this new empirical evidence align with earlier work and paint a consistent picture that firms with greater connections to the CIs are more likely to produce product innovations.
The evidence suggests that at least some of this association is due to knowledge spillover benefits from the CIs which have positive benefits on wider firm innovation. This would be expected to feed through ultimately into firm productivity and growth. Some of the association is likely to be due to other factors that link the CIs and highly innovative sectors, rather than resulting directly from a knowledge transfer, however even for firms that do not benefit from spillovers, the evidence indicates that the CIs play an important supporting role for highly productive sectors – by purchasing their output and supplying inputs of goods and experienced labour.
The main implications of this evidence are two-fold. First, the presence of spillover benefits suggests that innovation in the CIs may be undervalued by creative firms themselves, giving rise to market failure, strengthening arguments for government support for innovation in the sector, and for activities that would generate knowledge in particular. Second, policymakers may wish to consider ways to encourage connections between the CIs and wider firms, so that the innovations and knowledge generated by the CIs can be enjoyed even more widely. Innovation vouchers enabling firms in other sectors to purchase services from creative industries firms are one such example. [footnote 9] Looking again at such ideas, or other ways to showcase the creative industries or increase knowledge exchange, could result in benefits that are felt across the economy.
1. Introduction
The creative industries are a great UK success story. Not only do they make obvious contributions to cultural life, the creative industries have been a driver of economic growth over the past decade - they grew more than twice as fast as the UK economy between 2011 and 2019, and employment increased by 35%.[footnote 10]
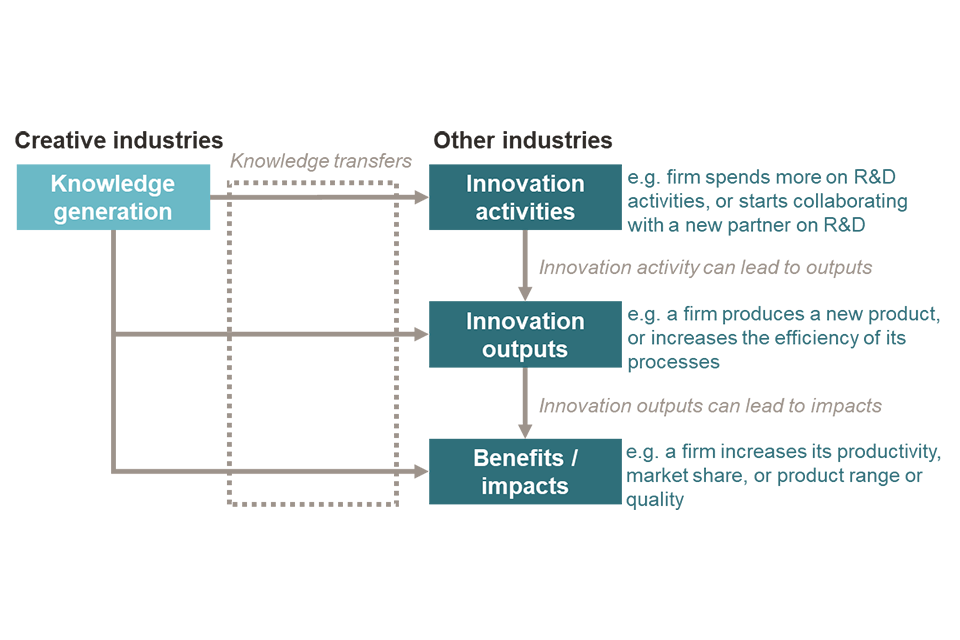
There is also a common perception that the creative industries are a driver of creativity and innovation across the economy. Creative businesses are often argued to be a source of ‘knowledge spillovers’: new ideas or knowledge that are produced by creative businesses that can be absorbed by wider firms at little or no cost. Figure 4 illustrates graphically how these knowledge spillovers could impact on other firms: they could cause firms to invest in innovation, such as undertaking R&D; they could lead to firms producing more innovations (conditional on their investment in innovation);[footnote 11] or they could even potentially impact on firms’ output or productivity without any explicit impact on innovation.
Figure 4: How knowledge spillovers from the CIs could benefit the wider economy
It is beyond doubt that the creative industries are innovative. Data from the UK Innovation Survey (UKIS) conducted by the Office for National Statistics (ONS) reveals that in 2021 36% of firms in the creative industries reported having produced a product innovation over the past three years.[footnote 12] Gkypali and Roper (2018) found that the creative industries are considerably more likely than other service sectors to engage in innovation-generating activities and to have introduced product or process innovations, and to be similar on many of these dimensions to the manufacturing sector. Furthermore, this almost certainly understates how innovative the creative industries are. A high proportion of innovation in the creative industries is believed to be generated through day-to-day activities, rather than the result of specific investments.[footnote 13] This means that creative businesses are likely to underreport their true extent of innovation to a greater extent than other businesses.
What is harder to evidence is the extent to which this innovation in the creative industries has wider spillover benefits on other firms across the economy. There is lots of anecdotal support but recent reviews have pointed out that solid quantitative evidence of these is still sparse.[footnote 14] One of the few notable exceptions is Bakhshi, McVittie and Simmie (2008) which examined how the innovation of firms in the wider economy is associated with how much they buy from or sell to the creative industries. They found that firms that spent more on creative products were significantly more likely to produce product innovations, supporting the argument that spillovers from the CIs exist.[footnote 15]
Better understanding the extent to which there are spillover benefits from the creative industries onto the wider economy is important. The existence of knowledge spillovers would imply that the knowledge and innovation generated by the CIs is under-valued by creative businesses, and that this could lead them to under-invest in innovation. While the government has long supported the creative industries on the basis of their cultural output and contribution to wellbeing in the UK, spillovers could mean there is also a sound economic case for further government support of the creative industries and their innovation generating activities in particular.
This report presents the results of new work to estimate the impact of the creative industries on innovation and firm activity across the wider economy. The approach taken is informed by an earlier scoping study (Frontier Economics 2022). This found that data limitations preclude the normal approaches taken in the economics literature to quantify knowledge spillovers. Instead it recommended updating and expanding on the approach taken in Bakhshi, McVittie and Simmie (2008). This involves hypothesising the mechanisms through which knowledge transfers could occur, identifying metrics that measure how strong the relevant connection is between wider firms and the CIs, and then examining whether firms that are more connected to the CIs in these ways have better outcomes than firms that are less connected. If there are spillover benefits from the CIs through the mechanisms hypothesised, then we would expect better outcomes for firms that have stronger connections.
We hypothesise three possible mechanisms through which knowledge transfers between the CIs and wider firms could occur: through interactions with CIs suppliers, through interactions with CIs customers, and through the hiring of labour that previously worked in the CIs. Connections between industries on these dimensions are estimated using ONS Input-Output analysis and the Labour Force Survey (LFS). We focus primarily on wider firms’ innovation outcomes, and estimate the association with connection to the CIs using firm level micro-data from the UK Innovation Survey (UKIS).[footnote 16] We test for a local dimension to the spillover mechanism by allowing the estimated strength of the relationship between firms’ connection to the CIs and their innovation to vary according to the importance of the CIs in the local economy. We also briefly examine wider firms’ output using firm-level micro-data from the Annual Business Survey (ABS).
Overall the results suggest that there are spillovers from the creative industries on the innovation outcomes of wider firms. A one standard deviation increase in connection to the CIs is estimated to be associated with around a 10% increase in the probability of product innovations, around half of which we believe to be due to knowledge spillovers and around half to other unobservable differences that we cannot control for. This supports the findings of Bakhshi, McVittie and Simmie (2008) and contributes to a robust picture in which firms that interact with the CIs benefit by picking up on knowledge that they can use to produce their own product innovations.
The rest of this report is organised as follows:
Section 2 defines and describes our measures of how connected wider firms are to the creative industries.
Section 3 defines and describes our measures of wider firm innovation and presents descriptive evidence of the relationship between wider firm innovation and their connection to the CIs.
Section 4 presents the results of our econometric approach to quantifying spillovers. We examine the association between wider firm innovation and CI exposure, as well as local CI activity, while controlling for other influencing factors and possible drivers.
Section 5 summarises and offers some brief concluding thoughts.
2. Measuring firm exposure to the creative industries
In this work we seek to quantify whether there are spillovers from the creative industries that affect the innovation of firms in the wider economy.[footnote 17] In other words, are there unintended impacts on wider firms’ innovation that arise from interactions with creative industry firms or workers. We hypothesise three mechanisms through which knowledge transfers could occur from creative industries to wider firms. We then test whether firms in industries where these mechanisms are stronger are more innovative than firms in other industries,[footnote 18] while controlling for other factors that would be expected to affect innovation.
2.1 Defining knowledge transfer mechanisms
We examine three hypotheses for mechanisms through which knowledge spillovers might occur:
Spillovers occur through supply chain connections with creative industry suppliers. The hypothesis is that firms that buy from the creative industries are influenced to be more innovative by their suppliers. For example, this could be because they learn about creative innovations that can either directly lead to innovations in their own firm or that encourage them to seek to be more innovative themselves.
Spillovers occur through supply chain connections with creative industry customers. The hypothesis is that firms that sell to the creative industries are influenced by these interactions with creative customers. For example, perhaps they learn about creative innovations from their customers that can increase their own rate or innovation or perhaps their customers motivate them to innovate.
Spillovers occur through labour turnover. The hypothesis is that people recruited from the creative industries are likely to bring with them either knowledge of innovations from the creative industries or an innovative culture and way of thinking. This could have beneficial impacts on the firms’ own innovation.
If there are spillovers from the creative industries through these mechanisms, then we would expect firms with greater connections to the creative industries through these channels be more innovative. Our empirical analysis is therefore centred around testing whether firms in industries where these connections are stronger are more innovative than firms in other industries, while controlling for other factors that would be expected to affect innovation.
Throughout all our analysis we also allow the strength of these spillover mechanisms to vary according to the amount of creative industry activity there is in a local area. There are two main reasons for this. One is to explore whether there is a local dimension to spillovers.[footnote 19] For example, it might be supposed that a firm is more likely to learn about innovations from a creative supplier if that supplier is local to them and they have built up a stronger personal relationship. The other is because, as will be explained below, our measures of the supply chain and labour turnover connections between firms and the creative industries are only available at the national level. The strength of these spillover mechanisms may in fact vary around the country according to the local industrial composition – for example, a firm may be more likely to employ a design company if there are many such companies in the local area. We can attempt to address this concern by allowing the estimated strength of the examined spillover mechanisms to vary according to the amount of local creative industry activity.
2.2 Data and summary statistics
For each of the hypothesised mechanisms through which knowledge might transfer, we calculate a metric that measures (at an industry level) how strong the relevant connection is between wider firms and the CIs. These are summarised in Table 1.
Table 1: Knowledge transfer mechanisms and metrics for strength of connection
| Possible knowledge transfer mechanism | Metric for strength of connection |
|---|---|
| Supplier connections: Interactions of non-CI firms with their CI suppliers | Industry purchases from CI suppliers (as a proportion of industry output) |
| Customer connections: Interactions of non-CI firms with their CI customers | Industry sales to CI customers (as a proportion of industry output) |
| Labour turnover: Non-CI firms hiring people who previously worked in the CIs | Annual hires to the industry who previously worked in CIs (as a proportion of employment) |
We measure the strength of supply chain connections between the creative industries and other industries across the economy using the ‘input-output accounts’ produced by the ONS. These estimate which industries buy which goods and services and in what amounts.[footnote 20] Specifically we define:
- Supplier connections: the value of goods and services purchased by each non-CI industry from the creative industries, expressed as a proportion of the total non-CI industry output
- Customer connections: the value of goods and services sold by each non-CI industry to the creative industries, expressed as a proportion of the total non-CI industry output
The supply chain connections are estimated for 105 broad industry groups, and at the national level.[footnote 21] They therefore do not reflect how supply chain interactions might vary across the country, nor how connections to the creative industries might differ for particular sub-industries within a broader industry category.
Figure 5 illustrates the average estimated supplier and customer connections for a selection of broad industry groups. Across all ‘non-creative industries’, sales to CI customers amount to 1.6% of total output, and purchases from CI suppliers are equivalent to 2.3% of output.
Figure 5: Estimated supply chain connections to the creative industries
Purchases from/sales to CIs as % total output.
| Industry | Links to CI customers | Links to CI suppliers |
|---|---|---|
| All | 2.5% | 3.6% |
| ‘Non-creative’ industries | 1.6% | 2.3% |
| Creative industries | 15.7% | 21.9% |
| Recreational services (excl. creative) | 1.0% | 4.4% |
| Public admin, education, health | 0.3% | 1.9% |
| Financial and business services | 3.1% | 3.1% |
| Sales, transport accommodation and food | 0.8% | 2.9% |
| Construction | 0.1% | 1.0% |
| Energy and water | 0.6% | 1.0% |
| Manufacturing | 2.3% | 1.5% |
| Agriculture and extraction | 0.0% | 0.9% |
Source: Frontier Economics calculations using ONS input-output tables.
Unsurprisingly, we find the highest degrees of connection within the creative industries themselves: CI firms are relatively much more likely to trade with other CI firms. Of the non-creative industries, recreational services have the highest average connection to the creative industries as suppliers, while the financial and business services, and the sales, transport, accommodation and food sectors also have relatively high purchases from the creative industries as compared with other industries. Unsurprisingly, the agriculture and extraction, construction and energy and water sectors have the lowest connections with the creative industries as a supplier.
In terms of connections to the creative industries as customers, the financial and business services sector still comes out as well connected. The manufacturing sector is the next most connected, with sales to the creative industries equivalent to 2% of total output.
We measure labour turnover between the creative industries and other industries using data from the Labour Force Survey (LFS). We identify all individuals who have changed jobs over the past 12 months, and whether they were employed in the creative industries 12 months ago. For each industry division (defined by 2-digit SIC code) we then calculate the number of new hires who are from the CIs, and express this as a proportion of all job movers entering that industry in that year.[footnote 22]
Figure 6 illustrates the estimated labour links between the creative industries and a selection of broad industry groups. Again, we find the highest degrees of connection within the creative industries themselves. Across all non-creative industries, 2.9% of recruits came from the creative industries. This proportion was highest among the recreational services and financial and business services sector (at 5.1%).
Figure 6: Estimated labour links to the creative industries
Annual hires from the CIs (as % hires from all industries).
| Industry | Percentage |
|---|---|
| All | 6.0% |
| ‘Non-creative industries | 2.9% |
| Creative industries | 45.8% |
| Recreational services (excl. creative) | 5.1% |
| Public admin, education, health | 2.2% |
| Financial and business services | 4.5% |
| Sales, transport accommodation and food | 2.4% |
| Construction | 2.0% |
| Energy and water* | 0 |
| Manufacturing | 3.2% |
Notes: Figures for the energy and water sector are not reported due to small sample sizes.
Source: Frontier Economics calculations using ONS Labour Force Survey 2015-2021.
We measure local creative industry activity as the proportion of employment that is accounted for by the creative industries.[footnote 23] We also test the sensitivity of our results to measuring creative industry activity as the proportion of businesses that are creative business (according to their SIC code). We use annual data on creative industry activity from 2017 to 2021.[footnote 24]
Figure 7 illustrates the variation in creative activity, measured as the proportion of local employment that is accounted for by the creative industries, across the travel-to-work-areas of the UK in 2020. The densest areas of creative activity are in and around London, but there are pockets of relatively high activity around the UK.[footnote 25]
Figure 7: Creative industry activity in 2020 across the travel-to-work-areas of the UK
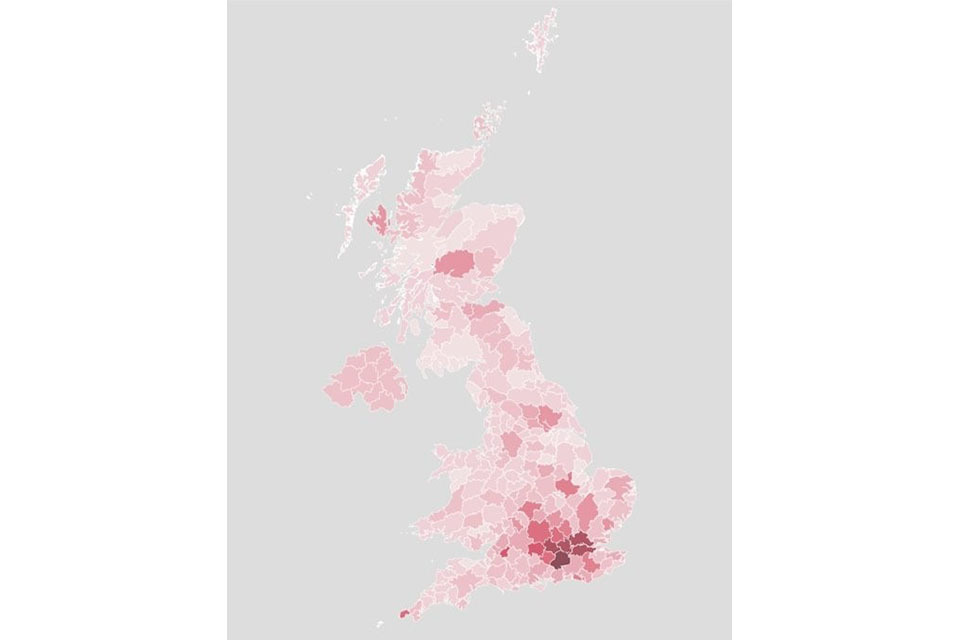
Note: Creative activity is measured as creative industry employment as a share of all employment.
Source: Frontier Economics calculations using ONS.
3. Descriptive evidence on firm innovation
3.1 Defining innovation
We measure the innovation activities and innovation outputs of non-CI firms using data from the UK Innovation Survey (UKIS). Since UKIS only surveys firms with 10 or more employees, we are in practice examining spillovers for the roughly 20% of firms with employees in the economy, that between them account for 81% of all UK output.[footnote 26] We bring together data from the two most recent surveys (conducted in 2019 and 2021), and for each firm-year observation in this data, we match in our measures of exposure to the creative industries, based on their location (travel-to-work-area), industry (roughly their 2-digit SIC code) and year of observation.[footnote 27]
We examine four innovation ‘outputs’ of interest:
-
whether the firm introduced new or significantly improved goods or services over the past three years (‘product innovation’)
-
whether the firm introduced new or significantly improved processes for producing or supplying goods or services over the past three years (‘process innovation’)
-
whether the firm introduced any new goods or service innovations that were new to the market, not just to the firm (‘novel products’)
-
whether the firm was a ‘wider innovator’ – that is, whether they implemented new or significantly changed corporate strategy, new management techniques, major changes to organisational structure or changes to marketing concepts or strategies
In order to understand the routes through which firms’ innovation outputs might be affected (see Figure 3), we also examine firms’ innovation ‘activities’, or investments in innovation. Specifically:
- whether the firm invested in various activities for the purposes of innovation:
- internal R&D
- acquired R&D[footnote 28]
- any design activity
- marketing
- other activities (including acquiring hardware or software, acquiring knowledge or training)
- total spending on any activities for the purposes of innovation
3.2 Descriptive evidence
As an initial analysis, we compare the prevalence of a selection of innovation outputs and activities among firms with greater connection to the creative industries with the prevalence among firms with lesser connection.
Figure 8 divides non-creative firms into two groups on the basis of their connection to suppliers from the CIs. Those firms with above average connection have stronger innovation performance: they are on average more likely to undertake all the listed innovation activities and more likely to produce innovations of all types.
Figure 8: Firm innovation by level of connection to CIs suppliers
Percentage of non-creative firms.
| Outputs and activities | Below median connection | Above median connection |
|---|---|---|
| Output: Product innovation | 18% | 22% |
| Output: Process innovation | 14% | 16% |
| Output: Novel products | 6% | 9% |
| Output: Wider innovator | 29% | 35% |
| Activity: Internal R&D | 14% | 18% |
| Activity: Acquired R&D | 5% | 6% |
| Activity: Design R&D | 11% | 13% |
| Activity: Any innovation activities | 37% | 42% |
Source: Frontier Economics calculations using UK Innovation Survey and ONS Input-Output data.
Figure 9 presents the equivalent analysis with connection to the creative industries defined on the basis of connections to CIs customers. On this basis there is little evidence that firms that are more connected to the creative industries are more innovative – if anything the opposite appears true. This could be indicative that knowledge spillovers occur through interactions with CIs suppliers but not through interactions with CIs customers. However, there may be other differences between these two groups that could drive this relationship, hence the need for more formal econometric analysis that controls for these differences.
Figure 9: Firm innovation by level of connection to CI customers
Percentage of non-creative firms.
| Outputs and activities | Below median connection | Above median connection |
|---|---|---|
| Output: Product innovation | 21% | 19% |
| Output: Process innovation | 16% 13% | |
| Output: Novel products | 9% | 7% |
| Output: Wider innovator | 33% | 30% |
| Activity: Internal R&D | 18% | 13% |
| Activity: Acquired R&D | 6% | 4% |
| Activity: Design R&D | 13% | 10% |
| Activity: Any innovation activities | 42% | 37% |
Source: Frontier Economics calculations using UK Innovation Survey and ONS Input-Output data.
Figure 10 presents the analysis with connection to the creative industries defined according to labour turnover. The picture is very similar to that when connection was measured according to connections to CIs suppliers. Those firms with above average connections have stronger innovation performance, being more likely to undertake innovation activities and more likely to produce innovations.
Figure 10: Firm innovation by level of connection to CIs through labour turnover
Percentage of non-creative firms.
| Outputs and activities | Below median connection | Above median connection |
|---|---|---|
| Output: Product innovation | 16% | 24% |
| Output: Process innovation | 12% | 17% |
| Output: Novel products | 5% | 11% |
| Output: Wider innovator | 29% | 35% |
| Activity: Internal R&D | 11% | 21% |
| Activity: Acquired R&D | 4% | 7% |
| Activity: Design R&D | 9% | 14% |
| Activity: Any innovation activities | 36% | 44% |
Source: Frontier Economics calculations using UK Innovation Survey and Labour Force Survey data.
These patterns are consistent with there being a link between connection to the CIs (through supplier relationships and labour turnover) and firms’ own innovation performance. However, these relationships alone are not enough to prove the existence of spillovers, because of other variables which could drive both innovation performance and CI connections, for example firm size or other characteristics. In the next section we turn to the results of more formal econometric analysis to control for other important influences on the innovation performance of firms.
4. Econometric evidence: Quantifying spillovers
We turn now to quantifying whether the creative industries generate spillover benefits by examining whether firms that are more connected to the creative industries have better innovation outcomes after we control for other factors that would be expected to influence innovation performance.[footnote 29] Innovation has been shown to result in increased growth and productivity, and therefore if creative industry spillovers affect wider firm innovation this would be expected to lead to wider economic benefits over the longer term.[footnote 30]
4.1 Econometric approach
Our econometric methodology explores whether firm innovation is associated with the strength of the hypothesised spillover mechanism, once other key influences on firms’ innovation performance have been controlled for. We estimate the relationship
Pr (yi,t =1) = f (α + βXi,t + γ1Ci + γ2Ci * CIi,t-1)
Where Pr (yi,t = 1) is the probability that a firm i at time t produces an innovation. Xi,t is a set of firm characteristics that may affect innovation. Ci is a measure of the strength of the hypothesised spillover mechanism between firm i and the creative industries (which depends on firm i’s industry) and CIi,t-1 is the level of local creative industry activity in the previous year (t-1). Coefficients γ1 and γ2 the main object of interest, which would reveal whether firm innovation is associated with the hypothesised spillover mechanisms and whether this association varies according to the amount of local creative industry activity.
Given that the innovation measures of interest are binary variables (which take the value 1 when an innovation output or activity occurs and 0 otherwise), we estimate this relationship using probit regressions.[footnote 31]
The additional controls (Xi,t) that we include throughout are:[footnote 32]
- turnover
- region (dummies for the 9 regions of England, and for Scotland, Wales and Northern Ireland)
- company size (a set of dummies for banded number of employees)
- whether the firm collaborated on innovation activities
- employee skills (% of employees with a degree or higher qualification in (i) science or engineering, or (ii) another subject)
- whether the firm received public financial support in the last three years (from UK local or regional authorities or central government, or EU institutions or programmes)
- barriers to innovation (dummies for a range of self-reported constraints on innovation activities, including: perceived economic risks, the cost of innovations, the cost of finance, the availability of finance, a lack of qualified personnel, a lack of information on technology, a lack of information on markets, the market being dominated by established businesses, uncertain demand, UK regulations or EU regulations)
- sources of information (dummies for whether (i) within the business, (ii) suppliers and (iii) customers are an important source of information for business innovation activities)
- intellectual property protection (dummies indicating whether recent innovations were protected using patents, design registration, copyright, trademarks, secrecy or by the complexity of goods or services)
- employment of skills (dummies for whether the business employed (either in house or externally obtained) those with a range of skills: graphic arts/layout/advertising, design of objects or services, multimedia/web design, software development/database management, engineering/applied sciences, mathematics/statistics)
4.2 Identifying spillovers
It is important to acknowledge from the outset that variation in how connected firms are to the creative industries is not the result of a ‘natural experiment’ providing random variation. Firms make location, purchasing or hiring decisions for particular reasons. This means that any association we find between firms’ innovation and the measure of their connections to the creative industries would be consistent with multiple explanations:
‘Causal’ spillover benefits: positive spillovers from the creative industries causing firms to have better outcomes.
‘Reverse causation’: firms that are more innovative may be purchasing the inputs of the creative industries or hiring people from the creative industries for the direct production of that innovation.
‘Other factors’: another factor may correlate both with a firms’ degree of linkage to the creative industries and with firms’ outcomes, leading to a correlation between those that is not causal in either direction.
We attempt to separate between these possible explanations through our use of additional control variables, and examining how our results vary between groups for whom the spillover mechanism is expected to be more or less relevant. This is discussed in more detail alongside our results.
4.3 Findings
4.3.1 Is there an association between innovation and connection to the CIs?
Our results show consistently that firms that are more connected to the creative industries, whether that is through the supply chain or through labour links, are more likely to produce product innovations and novel products. We discuss the detailed results presented in Table 2 in each of the following subsections.
Table 2: Association between innovation and strength of connection to CIs
| Percentage likelihood of… | Implied impact of 1 standard deviation increase in connection to CIs suppliers | Implied impact of 1 standard deviation increase in connection to CIs customers | Implied impact of 1 standard deviation increase in connection to CIs through labour |
|---|---|---|---|
| Product innovation | 1.8*** | 2.0*** | 1.7*** |
| Process innovation | -0.4 | 0.5 | -0.1 |
| Novel product innovation | 1.2*** | 1.2** | 1.4*** |
| Wider innovation | 0.7 | 0.1 | -0.3 |
Note: Figures are the implied percentage point change in the probability of different innovation outcomes from a 1 standard deviation increase in a firms’ connection to the CIs. The estimated effects are derived from probit regressions that additionally control for the additional variables set out in the main text. Each cell corresponds to a different regression; the rows indicate the regression outcome of interest, while the columns indicate the measure of connection to the CIs explored. ***, **, * indicates that the marginal effects are statistically different from zero at the 1%, 5% or 10% level respectively.
Connection to CI suppliers
We start by examining the hypothesis that spillovers occur through the supply chain, from CI suppliers to wider firms that are purchasing their creative products or services as inputs into their production. We use the results of the estimated probit regressions to derive the implied change in innovation that is associated with a one standard deviation increase our metric for connection to CIs suppliers.[footnote 33] The results are shown in the first column of Table 2.
We find a significant positive association between connection to the CIs and whether the firm has produced product innovations. Specifically, a 1 standard deviation increase in connection to CIs suppliers[footnote 34] is associated with a firm being 1.8 percentage points more likely to produce a product innovation (around a 10% increase on a baseline probability of 19%). A 1 standard deviation increase is approximately a 2-percentage point increase in spending on inputs from the CIs expressed as a percentage of total sales, and it happens that this is around the same as the average proportion of total sales spent on inputs from the CIs across non-creative industries. The figures therefore imply that firms that buy twice the average amount from the creative industries (4% of their sales value rather than 2%) are 10% more likely to produce product innovations.
We also find a significant association between connection to CI suppliers and whether the firm has produced novel product innovations (i.e. product innovations that are new to the market not just the firm). Specifically, a 1 standard deviation increase connection to CIs suppliers is associated with a firm being 1.2 percentage points more likely to produce a novel product innovation (around a 15% increase on a baseline probability of 8%). This implies that firms that buy twice the average amount from the creative industries (4% of their sales value rather than 2%) are 15% more likely to produce product innovations.
Connection to CIs customers
The second column presents equivalent analysis for our second hypothesised spillover mechanism: that knowledge transfers occur through interactions with creative industry customers. The results again imply a positive association between connection to the CIs and firm innovation. A 1 standard deviation increase in connection to CIs customers is associated with a firm being 2.0 percentage points more likely to produce a product innovation (around a 11% increase on a baseline probability of 19%) and 1.2 percentage points more likely to produce a novel product innovation (around a 16% increase on a baseline probability of 8%).[footnote 35]
Connection to CIs through labour turnover
The final column presents the results for the final hypothesised spillover mechanism: that spillovers occur through labour turnover. The results are similar: 1 standard deviation increase in connection to the CIs through labour turnover is associated with a firm being 1.7 percentage points more likely to produce a product innovation (around a 9% increase on a baseline probability of 19%) and 1.4 percentage points more likely to produce a novel product innovation (around a 18% increase on a baseline probability of 8%).
A 1 standard deviation increase is approximately a 3 percentage point increase in the number of annual hires in the industry who were previously employed in the CIs expressed as a proportion of all job movers entering that industry. As was the case with the connection to CI suppliers, it happens that this is around the same as the average connection to the creative industries through labour turnover. The figures therefore imply that firms with twice the average proportion of hires that come from the creative industries (6% rather than 3%) are 9% more likely to produce product innovations and an 18% more likely to produce novel product innovations..
Process innovations and wider innovation
For each of three measures we do not find any consistent evidence that firms that are more connected to the CIs are more likely to produce process innovations or wider innovations than less connected firms.[footnote 36]
4.3.2 Is this evidence of spillovers?
The results consistently reveal that firms that are more connected to the creative industries are more likely to produce product innovations and novel products than firms that are less connected. However, the variation in how connected firms are to the creative industries is not random variation; firms make purchasing or hiring decisions for particular reasons, which means that the association we find is theoretically consistent with multiple explanations, as discussed in Section 4.2.
We seek to rule out the possibility that the association is driven by ‘reverse causation’ through the use of the additional controls in our regression analysis. In particular, we control for whether or not firms report employing (either in house or externally obtained) those with a range of creative skills, and in Section 4.3.4 below we control for whether the firm undertakes innovation activities. We still find significant correlations between links to the creative industries and innovation outputs.
To rule out other factors that may drive the association and to identify the causal spillover benefits, we make use of a question asked of firms in the UKIS questionnaire about “how important to this business’ innovation activities was information from…” A variety of agents are asked about, including (amongst others): (i) within your business or enterprise group, (ii) clients or customers, (iii) suppliers of equipment, materials, services or software. If spillovers are driving the association between connection to the CIs and firm innovation, then the association might be expected to be driven by firms who self-report that a particular source of information is important. For example, when we measure connection to CIs suppliers, then we might expect the association to be driven by firms who report that suppliers are an important source of information for their innovation.
The results of exploring this for product innovation are summarised in Figure 11, Figure 12 and Figure 13 (and results for other innovation outcomes are presented in Table 5 in the appendix).[footnote 37] Figure 11 shows the impact on the probability of product innovation from a 1 standard deviation increase in connection to CI suppliers. When suppliers are not thought to be an important source of information the estimated impact is 1.0 percentage points, while when suppliers are thought to be an important source of information the estimated impact is 1.9 percentage points.
A very similar picture is shown in Figure 12 and Figure 13 for the other two hypothesised spillover mechanisms. The relationship between the connection to CIs customers and firm innovation is stronger when firms perceive customers to be an important source of information for innovation. The relationship between the connection to the CIs through labour turnover and firm innovation is stronger when firms believe that an important source of information for innovation is within their own business.
While these differences support the hypothesis of a direct effect of knowledge spillovers, we caveat that none of the differences are found to be statistically significant, due to the low precision with which we can estimate these interaction effects.
Overall the evidence is therefore indicative of knowledge spillovers from the creative industries that benefit wider firms’ innovation and that operate through supply chains and the movement of labour.
Figure 11: Association between innovation and connection to CIs suppliers - by self-reported importance of suppliers for innovation
Probability of product innovation (ppt).
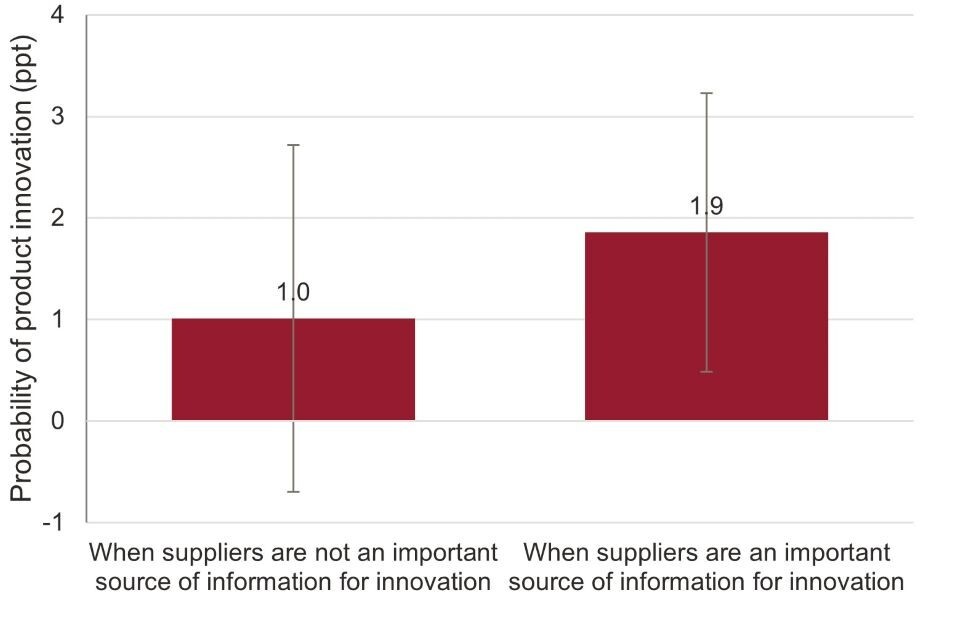
Note: Figures are the implied percentage point change in the probability of product innovation from a 1 standard deviation increase connection to CIs suppliers (approximately a 2 percentage point increase in industry purchases of inputs from the CIs expressed as a percentage of total industry output). The estimated effects are derived from a probit regression that additionally control for the additional variables set out in the main text. Lines indicate 95% confidence intervals.
Figure 12: Association between innovation and connection to CIs customers - by self-reported importance of customers for innovation
Probability of product innovation (ppt).
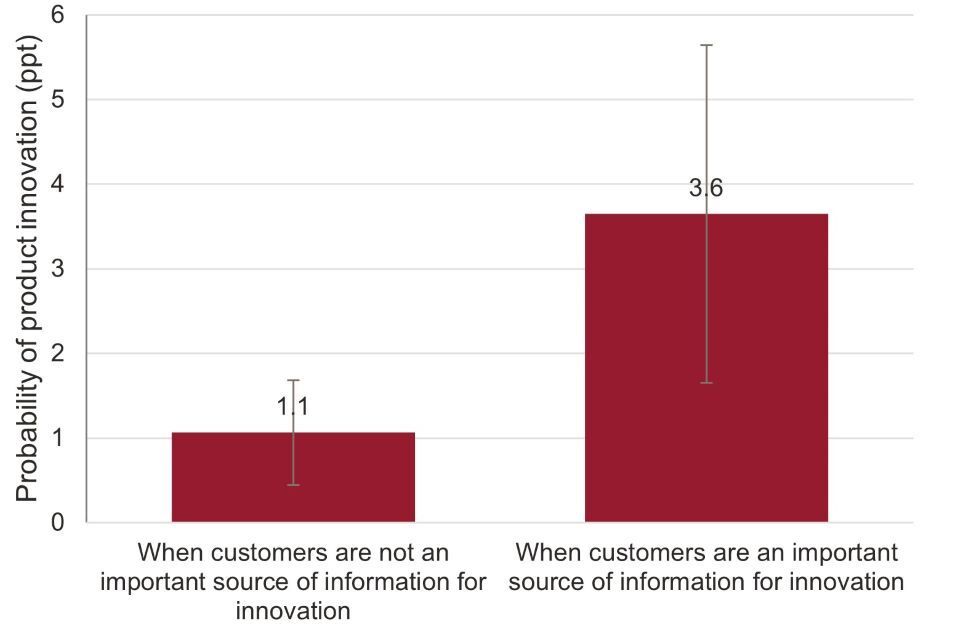
Note: Figures are the implied percentage point change in the probability of product innovation from a 1 standard deviation increase connection to CIs customers (approximately a 5 percentage point increase in industry sales to the CIs as a percentage of total industry output). The estimated effects are derived from a probit regression that additionally control for the additional variables set out in the main text. Lines indicate 95% confidence intervals.
Figure 13: Association between innovation and connection to CIs through labour turnover - by self-reported importance of within business for innovation
Probability of product innovation (ppt).
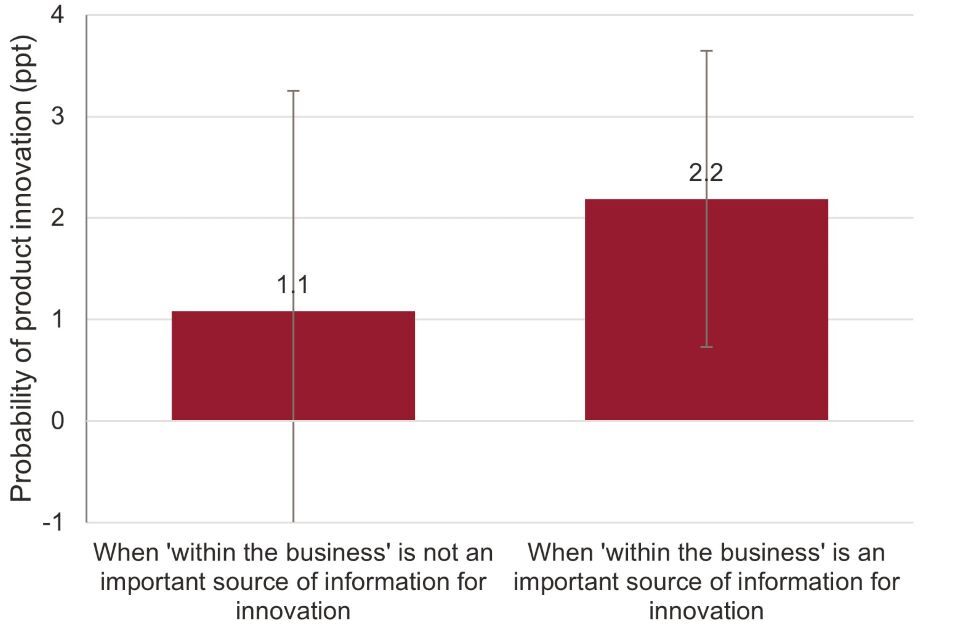
Note: Figures are the implied percentage point change in the probability of product innovation from a 1 standard deviation increase connection to the CIs through labour turnover (approximately a 3 percentage point increase in the annual hires to the industry from the CIs expressed as a percentage of total industry employment). The estimated effects are derived from a probit regression that additionally control for the additional variables set out in the main text. Lines indicate 95% confidence intervals.
4.3.3 Is there evidence for local spillover benefits?
In all our econometric analysis we allow the strength of estimated relationship between innovation and the level of connection to the CIs to vary according to the amount of creative industry activity there is in a local area.[footnote 38] If there was a local component to spillover benefits - for example, if a firm is more likely to learn about innovations from a creative supplier if that supplier is local to them – then one might expect the impact of connection to the CIs on innovation to be greater where there is more local creative industry activity.
In practice, we do not find any evidence of this. In our results, the strength of the relationship between innovation and connection to the CIs does not vary with the level of local CI activity. Taken at face value this suggests that spillovers are not stronger locally – i.e. two firms in the same industry benefit to the same extent from knowledge spillovers from the CIs, even if one is in the same geographical location as lots of CI activity while the other is not. However, since our measures of CI activity are coarse (measuring all CI activity in the local travel-to-work-area)[footnote 39] this is an area that is worthy of further exploration in future with more detailed data.
4.3.4 Do firms that are more connected to the CIs undertake more innovation activities, such as innovation investment?
We have shown that firms that are more connected to the creative industries are more likely to produce product innovations and novel product innovations. It is interesting to ask how this additional innovation comes about, given the potential pathways for knowledge transfers to impact on wider firms that were set out in Figure 4. In particular, whether more connected firms are investing more in innovation activities, whether a similar level of innovation activities are more productive, or whether more connected firms are better able to produce product innovations without directly investing in innovation activities themselves.
We therefore examine (i) the association between firms’ connection to the creative industries and their innovation activities and (ii) the association between firms’ connection to the creative industries and firms’ innovation outputs after controlling for their own innovation activities. The results of this analysis are presented in Table 3.
Greater exposure to the creative industries is associated with a higher probability that a firm undertakes R&D. For example, a 1 standard deviation increase in connection to the CIs through labour turnover is associated with a 1.3 percentage point increase in the probability that a firm undertakes R&D in house. The amount spent internally on R&D is also associated with firms’ connection to the CIs. However, other aspects of innovation activity have no consistent association with connection to the CIs.
This increase in internal R&D undertaken is only part of what drives the association between product innovation and connection to the CIs. There is still a positive association between connection to the CIs and the probability of product innovation (and of novel product innovation) even after innovation activities are undertaken are controlled for. This suggests that knowledge spillovers from the CIs are also impacting directly on wider firms’ innovation outcomes.
Table 3: Association between innovation activities and connection to CIs
| Implied impact of 1 standard deviation increase in connection to CIs suppliers | Implied impact of 1 standard deviation increase in connection to CIs customers | Implied impact of 1 standard deviation increase in connection to CIs through labour | |
|---|---|---|---|
| Probability of innovation activities: | |||
| Internal R&D | 1.3*** | 1.0* | 2.5*** |
| Acquisition of R&D | 0.2 | 0.6* | 0.1 |
| R&D Design | 0.3 | 0.4 | 0.3 |
| R&D Marketing | 0.3 | 0.1 | 0.3 |
| Other R&D | -0.3 | 0.7 | 0.4 |
| Percentage increase in innovation spending: | |||
| Innovation spending | 3.8* | 1.6 | 10.0*** |
| Probability of innovation outputs (controlling for activities): | |||
| Product innovation | 1.6*** | 1.9*** | 1.4** |
| Process innovation | 0.6 | 0.3 | 0.4 |
| Novel products | 1.0*** | 1.1*** | 1.2*** |
| Wider innovation | 0.7 | 0.0 | 0.2 |
Note: Figures are the implied (i) percentage point change in the probability of different innovation activities being undertaken (rows 1-5), (ii) increase in £,000 of innovation spending (row 6), or (iii) percentage point change in the probability of different innovation outcomes occurring (rows 7-10) from a 1 standard deviation increase in connection to the CIs. Each cell reports the results of a different probit regression that additionally control for the additional variables set out in the main text. The rows consider the effect the different outcomes, while the columns refer to different measures of connection to the CIs. ***, **, * indicates that the underlying marginal effects are statistically different from zero at the 1%, 5% or 10% level respectively.
4.3.5 Are firms affected differently by links to different sub-sectors of the CIs?
The creative industries are a diverse and heterogeneous set of sub-sectors. It is therefore natural to ask whether being more connected to some sub-sectors has a greater association with innovation than being more connected to other sub-sectors.
We explore this for two of our hypothesised spillover mechanisms: that knowledge transfers occur through connections with CIs suppliers or through connections with CIs customers.[footnote 40] We use the ONS Input-Output data to separate out our measures of how connected a firm is to the creative industries into how connected a firm is to the ‘IT, software and computer services’ sub-sector and how connected it is to all other sub-sectors of the creative industries. This breakdown is chosen as this is the largest sub-division of the creative industries, and we are able to construct measures of local creative industry activity for each of these sub-sectors.
We then repeat the analysis discussed above, but treating connection to the IT, software and computer services sub-sector and to the rest of the creative industries separately (i.e. controlled for simultaneously in each regression). The main results analogous to those presented in Table 2 are shown in Table 6 in the appendix. Overall the association between probability of product innovation and the level of connection to the IT sub-sector of the CIs is found to be very similar to the association between the probability of product innovation and the level of connection to the other sub-sectors of the CIs. What is somewhat different, however, is that the strength of the association between innovation and connection to the IT sub-sector varies with the level of local IT activity, whereas the strength of the association between innovation and connection to the other sub-sectors of the CIs does not vary with local creative activity. (This is indicated by the implied positive association between local creative industry activity and the probability of product innovation that is set out in Table 7 in the appendix.) This may indicate that for the IT sub-sector there may be some local dimension to spillovers. Given the coarseness of our measure of local activity (discussed in Section 4.3.3) this would be worthy of further investigation in future.
4.3.6 Do spillovers increase wider firms’ value-added?
To examine whether firms that are more connected to the CIs have greater value added we estimate a production function. A production function sets out the relationship between a firms’ inputs and its output. We seek to understand whether a firm’s connection to the CIs has any impact on its output (measured as value added) once the its own inputs (of labour and capital) have been controlled for.
Our analysis does not provide evidence that the creative industries have positive spillovers on wider firms’ value added. However, this is not surprising, given that spillovers from the creative industries are likely to be small in magnitude in the context of overall value added, and therefore would be hard to detect. For detailed results, see Annex A.
5. Conclusions
It is a common perception that the creative industries are a driver of creativity and innovation across the economy. Anecdotal evidence supports the idea that the CIs generate knowledge ‘spillover’ benefits, i.e. that new ideas, innovations or processes created by creative industry firms are picked up by firms in other industries, improving those wider firms’ performance at little or no cost. However, providing solid quantitative evidence of this has long been a challenge.
This report presents the results of new empirical work that has sought to quantify knowledge spillover benefits from the creative industries. Frontier Economics does this by hypothesising mechanisms through which these knowledge transfers could occur, and then asking whether firms with greater such connections to the CIs do have better outcomes than firms that are less connected (after controlling for other factors that would be expected to affect firms’ outcomes).
The results suggest that wider firms’ innovation is affected by spillovers from the creative industries.
Those firms that are more connected to the creative industries are more likely to produce product innovations, and are more likely to produce novel product innovations that are new to the market, than firms that are less connected to the creative industries. This occurs in part through an increase in the probability that firms undertake innovation activities, such as R&D, but largely through an increase in the chances of successful innovation outputs for a given level of R&D activity (for example, a higher chance of product innovation even with the same level of R&D spending).
We explore three different mechanisms through which spillovers from the creative industries might occur: through interactions with CIs suppliers, through interactions with CIs customers, and through the hiring of labour that previously worked in the CIs. All of these are found to be potentially important.
We find little evidence that spillovers are in general concentrated within local travel-to-work-areas, as opposed to being more national in nature, though there is some evidence of local spillovers for the IT, software and computer services sub-sector. The association between firms’ innovation and their connection to the CIs as a whole is no stronger even if they are in an area where a greater proportion of local employment is in the creative industries. Our measures are coarse but this lack of a local dimension to knowledge spillovers is nevertheless perhaps surprising, and is an area that is worthy of further exploration in future if more detailed data becomes available.
We did not find evidence that firms that are more connected to the creative industries have greater value added once other factors are controlled for. However, it would be hard to robustly identify small effects even with the micro-data used in this analysis.
Overall, this new empirical evidence aligns with the earlier work of Bakhshi, McVittie and Simmie (2008). While our estimates of the positive association between CI linkage and firm innovation are somewhat smaller than those found previously, this paints a consistent continued picture that firms with greater connections to the CIs are more likely to produce product innovations. Furthermore, we unpick that this is driven in significant part by knowledge spillovers.
The main implications of this are two-fold. First, the presence of spillover benefits suggests that innovation in the CIs may be undervalued by creative firms themselves, strengthening arguments for government support for the sector, and in particular activities that generate knowledge and innovations. Second, policymakers may wish to consider ways to encourage connections between the CIs and wider firms so that the innovations and knowledge generated by the CIs can be enjoyed even more widely. Innovation vouchers enabling firms in other sectors to purchase services from creative industries firms are one such example.[footnote 41] Looking again at such ideas, or other ways to showcase the industry or increase knowledge exchange, could result in benefits that are felt across the economy.
References
Bakhshi, H., Edwards, J.S., Roper, S., Scully, J., Shaw, D., Morley, L. and Rathbone, N. (2015). ‘Assessing an experimental approach to industrial policy evaluation: Applying RCT+ to the case of Creative Credits’, Research Policy, 44(8), pp.1462-1472.
Bakhshi, H., Lee, N. and Mateos-Garcia, J. (2013), ’Capital of culture? An econometric analysis of the relationship between arts and cultural clusters, wages and the creative economy in English cities’, in Rushton, M. (eds) ‘Creative Communities: Art Works in Economic Development’, Brookings Institution Press.
Bakhshi, H. and McVittie, E. (2009) ‘Creative supply-chain linkages and innovation: Do the creative industries stimulate business innovation in the wider economy?’ Innovation, 11(2), pp.169-189.
Coad, A. (2009) The Growth of Firms: A Survey of Theories and Empirical Evidence. Cheltenham: Edward Elgar Publishing.
Design Council (2008). ‘The Designing Demand Review’.
Department for Business, Energy and Industrial Strategy, released 07 June 2022, ONS SRS Metadata Catalogue, dataset, UK Innovation Survey, 10.57906/bs4h-rh59
Frontier Economics (2022) ‘Quantifying knowledge spillovers from the UK creative industries: A scoping study’
Gkypali, A. and Roper, S. (2018) ‘What can we learn about the innovation performance of the creative industries from the UK Innovation Survey?‘
Gutierrez-Posada, D., Kitsos, T., Nathan, M. and Nuccio, M. (2021) ‘Do creative industries generate multiplier effects? Evidence from UK cities, 1997-2018’, Economic Geography, DOI: 10.1080/00130095.2022.2094237
Harrison, R., J. Jaumandreu, J. Mairesse, and B. Peters. (2014) “Does Innovation Stimulate Employment? A Firm-level Analysis Using Comparable Micro-data from Four European Countries.” International Journal of Industrial Organization 35: 29–43. doi:https://doi.org/10.1016/j.ijindorg.2014.06.001.
Lee, N. (2014) ‘The creative industries and urban economic growth in the UK’ Environment and Planning A 2014, vol. 46 pp455-470.
Miles, I. and Green, L. (2008) ‘Hidden innovation in the creative industries’
Office for National Statistics, released 09 September 2022, ONS SRS Metadata Catalogue, dataset, Annual Business Survey - UK, 10.57906/ks2s-qx24
Office for National Statistics, released 19 December 2022, ONS SRS Metadata Catalogue, dataset, Labour Force Survey Person - UK, 10.57906/ns1n-5z24
TFC Consultancy (2015) ‘Cultural and creative spillovers in Europe: Report on a preliminary evidence review’.
Vivarelli, M. (2014) “Innovation, Employment and Skills in Advanced and Developing Countries: A Survey of Economic Literature.” Journal of Economic Issues 48 (1): 123–154.
Annex A: Examining the association between connection to the CIs and wider firms’ value added
In this appendix we present the results of analysis that explores whether large firms that are more connected to the CIs have higher output (measured by value added).
We do not find strong evidence that wider firms’ gross value added (GVA) is related to how connected they are to the CIs once their own labour and capital inputs have been . Firms with above average connection to the CIs do have higher GVA per employment than firms with below average connection to the CIs, but differences in GVA disappear when we control for other factors such as firms’ capital and labour inputs.
Realistically, the impact of knowledge spillovers from the CIs may be small in the context of overall firm output, and therefore it would be hard to robustly identify these even with the micro-data used in this analysis.
Data
To examine whether firms that are more connected to the CIs have greater GVA we estimate an augmented production function. A production function sets out the relationship between a firms’ inputs and its output. We seek to understand whether a firm’s connection to the CIs has any impact on its output once the its own inputs have been controlled for.
We obtain data on the output and production inputs of a large sample of firms from the Annual Business Survey (ABS). To control for the firms’ own innovation activities, which would be expected to affect productivity (i.e. the amount of output produced for any given level of inputs), we match in data on spending on innovation activities from the UK Innovation Survey (UKIS).
This data is not without limitations. As with all our analysis, we are restricted to considering firms who are in industrial sectors B to N as defined by SIC2007.[footnote 42] We must also focus only on large firms, specifically those with over 250 employees, since for smaller firms there is an inadequate overlap between the UKIS and ABS samples.[footnote 43]
Pooling together ABS data from 2018 and 2019 (and matching this to UKIS data from 2016-2018 or 2018-2020) we have a sample of over 4,000 firms who are between them observed over 9,000 times.
For each firm-year observation in our data, we match our measures of connection to the CIs based on firms’ industry, and our measures of local creative industry activity based on firms’ location and year of observation. As described in Section 2, we explore alternative measures of connection to the CIs to reflect different hypothesised spillover mechanisms.
Descriptive evidence
An initial comparison of average firm GVA (per employment to take account of firm size) is shown in Figure 14, with firms divided into two groups according to their level of connection to the CIs. Firms with the greatest connection to CIs suppliers and to the CIs through labour turnover have greater GVA on average than those with lower levels of connection. The opposite is true when considering connection to CIs customers.
This would be consistent with their being positive spillovers from the creative industries through connections with CIs suppliers and through labour turnover. However, they should not be interpreted as such as the differences are large, and this simple descriptive analysis does not control for other crucial differences between firms – such as their inputs of capital and labour.
Figure 14: Average GVA, by connection to creative industries
Average GVA per employment
| Scenario | Below median connection | Above median connection |
|---|---|---|
| Connection to CIs customers | 78 | 67 |
| Connection to CIs suppliers | 63 | 82 |
| Connection to CIs through labour turnover | 62 | 83 |
Source: Frontier Economics calculations using Annual Business Survey, Labour Force Survey and ONS Input-Output data.
Econometric evidence
To examine evidence for spillovers more formally, we estimate a production function of the form:
lnGVAi,t = α+βlnEi,t + γlnKi,t + ϑlnRi,t + γ1Ci + γ2Ci * CIi,t-1
This examines whether the GVA of firm i (lnGVAi) is associated with the firm’s degree of connection to the creative industries (Ci), once the firm’s own employment (lnEi), capital inputs (lnKi) and innovation investments (lnRi) have been taken into account.[footnote 44] As with our analysis in Section 4, we allow the strength of any association between GVA and connection to the CIs to vary with the amount of local creative industry activity in the previous year (CIi,t-1).
The regression results from estimating this relationship are summarised in Table 4. While we find the expected associations between firms’ labour, capital and innovation inputs and their output, there is no significant association between firms’ connection with the CIs and their output for any of our measures of connection.
Table 4 Association between firm output and connection to CIs
| Connection to CIs suppliers | Connection to CIs customers | Connection to CIs through labour turnover | |
|---|---|---|---|
| Ln(capital) | 0.061*** | 0.061*** | 0.060*** |
| Ln(employment) | 0.879*** | 0.879*** | 0.878*** |
| Ln(Own innovation spend) | 0.007** | 0.007** | 0.007* |
| Implied marginal effect of connection to CIs | -0.598 | 0.402 | 0.392 |
| Implied marginal effect of local CIs activity | 0.505 | 0.261 | 0.24 |
Note: Figures are the estimated marginal effects on ln(GVA). The implied marginal effects of connection to the CIs and of CIs activity are evaluated at the average level of local CIs activity / CO connection respectively. Each column in each panel relates to a different regression. *** , **, * indicates that the marginal effects are statistically different from zero at the 1%, 5% or 10% level respectively.
Our analysis does not therefore provide evidence that the creative industries have positive spillovers on wider firms’ value added. However, this is not surprising, given that spillovers from the creative industries may be small in magnitude in the context of overall GVA, and therefore would be hard to detect.
Annex B: Additional tables and figures
Table 5: Association between innovation and connection to CIs - by self-reported importance of sources of information for innovation
| Implied impact of 1 standard deviation increase in connection to CIs suppliers | Implied impact of 1 standard deviation increase in connection to CIs customers | Implied impact of 1 standard deviation increase in connection to CIs through labour | ||||
|---|---|---|---|---|---|---|
| Supplier not important | Supplier important | Customer not important | Customer important | Within business important | Within business not important | |
| Product innovation | 1.0 | 1.9** | 1.1 | 3.6*** | 1.1 | 2.2*** |
| Process innovation | -0.7 | -0.3 | 0.8 | 0.6 | 0.1 | -0.1 |
| Novel products | 0.3 | 1.4*** | 1.1 | 1.5* | 0.7 | 1.7*** |
| Wider innovation | 0.1 | 1.2 | -0.4 | 1.2 | -1.4 | -0.2 |
Notes: Figures are the implied percentage point change in the probability of different innovation outcomes from a 1 standard deviation increase connection to the CIs. For each innovation outcome and each column-pair the estimated effects are derived from one probit regression that additionally control for the additional variables set out in the main text. ***, **, * indicates that the marginal effects are statistically different from zero at the 1%, 5% or 10% level respectively.
Table 6: Association between innovation and connection to CIs – by CI sub-sector
| Percentage likelihood of… | Implied impact of 1 std dev increase in connection to IT suppliers | Implied impact of 1 std dev increase in connection to other CIs suppliers | Implied impact of 1 std dev increase in connection to IT customers | Implied impact of 1 std dev increase in connection to other CIs customers |
|---|---|---|---|---|
| Product innovation | 1.2** | 1.4** | 0.7 | 0.6** |
| Process innovation | -0.1 | -0.5 | 0.4 | 0.1 |
| Novel product innovation | 0.7* | 1.0** | 0.5* | 0.3** |
| Wider innovation | 0.6* | 0.3 | 0.5 | -0.2 |
Note: Figures are the implied percentage point change in the probability of different innovation outcomes from a 1 standard deviation increase in a firms’ connection to the CIs. The estimated effects are derived from probit regressions that additionally control for the variables set out in the main text. Each row corresponds to a different regression outcome, while the pairs of columns indicate the measure of connection to the CIs explored. ***, **, * indicates that the marginal effects are statistically different from zero at the 1%, 5% or 10% level.
Table 7: Association between innovation and local CI activity – by CI sub-sector
| Percentage likelihood of… | Implied impact of 1 std dev increase in local IT CIs activity | Implied impact of 1 std dev increase in local other CIs activity | Implied impact of 1 std dev increase in local IT CIs activity | Implied impact of 1 std dev increase in local other CIs activity |
|---|---|---|---|---|
| Product innovation | 0.8** | 0.0 | 0.5** | 0.0 |
| Process innovation | -0.2 | 0.8* | 0.0 | 0.6*** |
| Novel product innovation | 0.5* | -0.1 | 0.3 | 0.0 |
| Wider innovation | -0.8* | -0.1 | -0.6** | 0.3 |
Note: Figures are the implied percentage point change in the probability of different innovation outcomes from a 1 standard deviation increase in the proportion of local employment that is accounted for by the IT or other CIs. The estimated effects are derived from the same probit regressions as the results set out in Table 6. Each row corresponds to a different regression outcome. The first two columns are estimated measuring firms’ connection to CIs suppliers, while the final two columns are estimated measuring firms’ connection to CIs customers. ***, **, * indicates that the underlying marginal effects are statistically different from zero at the 1%, 5% or 10% level respectively.
-
Gkypali and Roper (2018) ↩
-
Other papers that have sought to quantify the impact of the creative industries on the wider economy include Gutierrez-Posada et al (2021), Bakhshi, Lee and Mateos-Garcia (2014) and Lee (2013). ↩
-
Authors’ calculations using ONS (2022) Business population estimates for the UK and regions 2022: statistical release ↩
-
We express results in terms of ‘standard deviations’ to account for the different amount of variation within our three different measures of CI linkage. ↩
-
The magnitude of these relationships is smaller than that found for an earlier period by Bakhshi, McVittie and Simmie (2008). They find that a 3 percentage point increase in spending on creative products is associated with a 25% increase in the probability of product innovations or of novel innovations. Our results suggest that a 3% point increase in the equivalent linkage leads to a 15% increase in the probability of product innovations and an 18% increase in the probability of novel innovations. ↩
-
Bakhshi, McVittie and Simmie (2008) similarly did not find a significant effect on process innovations. ↩
-
Represented by the green arrow between “knowledge generation” and “innovation outputs” in Figure 3. ↩
-
Travel to work areas (TTWAs) are a set of geographical boundaries created to approximate labour market areas. TTWAs are defined such that most of the resident population also work within the same area. ↩
-
Bakhshi et al (2013). Design Council (2008) ↩
-
Conditional on their investment in innovation’* means that for a given level of innovation activity, e.g. R&D spending, a firm produces more innovation outputs, e.g. successful product innovations. For example, one possible knowledge transfer mechanism from CIs to other firms would be if CI spillovers made innovation spending more effective, in terms of each £ spent on R&D being more likely to lead to successful innovation. ↩
-
UKIS only surveys firms in Standard Industrial Classification sections B-N, and therefore this figure does not include businesses in the “museums, galleries and libraries” sub-sector of the creative industries, nor most businesses in the “music, performing and visual arts” sub-sector. ↩
-
Miles and Green (2008) ↩
-
TFC Consultancy (2015), Frontier Economics (2022). ↩
-
Other papers that have sought to quantify the impact of the creative industries on the wider economy include Gutierrez-Posada et al (2021), Bakhshi, Lee and Mateos-Garcia (2014) and Lee (2013). ↩
-
UKIS does not sample firms in all sectors. Our definition of ‘wider firms’ therefore excludes firms in: agriculture, forestry and fishing; public administration and defence; education; human health and social work activities; arts, entertainment and recreation; and a small number of other service activities. ↩
-
We also examine whether the creative industries affect firms’ wider productivity, and report results in Annex A. ↩
-
The available data allows connection measures to be calculated only at industry level, and not at firm level. ↩
-
This is commonly assumed in much of the economics literature on spillovers. ↩
-
The creative industries are identified as a list of detailed Standard Industry Classification (SIC) codes. Where a broad industry group contains both creative and non-creative industry sub-sectors (for example, industry group J62: Computer Programming, Consultancy And Related Activities contains both creative and non-creative SIC codes), we assume that both sub-sectors have the same supply chain relationships with other sectors and we estimate the proportion of supply/use that is relevant to each sub-sector based on the CI GVA out of total GVA in that industry group. ↩
-
We do this pooling together data from 8 years of the LFS (2015 to 2022). We calculate labour measures at the 2-digit SIC level, as this is the lowest level of granularity in industry classification for which there is a sufficiently large sample size in a majority of industries. For industries where there is an insufficient sample of industry-joiners observed, we calculate the proportion of joiners from the creative industries at the SIC section (1-digit) level. ↩
-
We normalise the level of creative industry activity by dividing by the total economic activity in the local area to take account of the different sizes of travel-to-work areas. ↩
-
The data on employment and business counts is drawn from the inter-departmental business register, as published by the ONS (for the creative industries specifically) and via Nomis (for the whole economy). ↩
-
A similar picture has previously been illustrated by Nesta (2018) ‘Creative Nation’. ↩
-
The UK has 5.5m private sector businesses, of which 4.1m (74%) have no employees (comprising sole proprietorships and partnerships with only a self-employed owner-manager), and 1.4m (26%) have at least one employee. Firms with 10 or more employees account for 20% of all firms with employees, but only 5% of all firms. Firms with 10 or more employees account for 86% of the turnover of UK firms with employees, and 81% of the turnover of all UK firms. Business population estimates for the UK and regions 2022: statistical release ↩
-
The UKIS survey asks information about the previous three years, and so the 2019 data relate to innovation outcomes over the period 2016-2018 while the 2021 data relate to innovation outcomes over the period 2018-20. For firms in the 2019 data we match in a measure of exposure to the creative industries that is based on local creative activity in 2017 (the earliest data we have available), and so analogously for the firms in the 2021 UKIS data we match in a measure of exposure that is based on local creative activity in 2019. ↩
-
Acquired R&D refers to R&D undertaken by other business and purchased by the business in question. ↩
-
The association between connection to the creative industries and wider firms’ output is examined in the appendix. ↩
-
Coad (2009), Harrison et al (2014), Vivarelli (2014). ↩
-
Probit models are non-linear and therefore the ‘marginal effects’ estimated (i.e. the effect of a change in the probability of an innovation outcome from a change in an explanatory variable) depend on the values of all explanatory variables. We calculate marginal effects at the mean value of variables that are controlled for, taking into account where these are implicitly interaction terms involving the same underlying variable (such as creative industry activity). ↩
-
The inclusion of these controls reduces the number of firms in our sample substantially, due to non-response to various questions in UKIS. We test the sensitivity of our results to only using a limited set of controls. The results are qualitatively similar, so we present results from the analysis on the approximately 12,500 firm-year observations where the desired data are available. ↩
-
Defined in Section 3, this is industry purchases from CI suppliers expressed as a proportion of total industry output. ↩
-
We estimate the impact of a 1 standard deviation increase in each of our linkage measures so that these estimated effects can be meaningfully compared despite the fact that the various linkage measures have quite different distributions. ↩
-
One standard deviation is approximately a 5 percentage point increase in sales to the CIs expressed as a percentage of total industry sales. ↩
-
Bakhshi, McVittie and Simmie (2008) similarly did not find a significant effect on process innovations. ↩
-
Methodologically, we include in our estimating equation additional interaction terms. When connection to the CIs is measured using connection to CIs suppliers, we include additional interaction terms between a dummy for whether firms perceive suppliers as an important source of information and the level of connection to the CIs. When connection to the CIs is measured using connection to CIs customers, we include additional interaction terms between a dummy for whether firms perceive customers as an important source of information and those variables. When connection to the CI is measured using labour turnover, we include additional interaction terms between a dummy for whether firms perceive within the business is an important source of information and the level of connection to the CIs. ↩
-
This comes through the term Ci*CIi,t-1 in our estimation equation. ↩
-
Travel to work areas (TTWAs) are a set of geographical boundaries created to approximate labour market areas. TTWAs are defined such that most of the resident population also work within the same area. ↩
-
We do not have sufficient data to explore this for connections to the CIs through labour turnover. The sample sizes of the Labour Force Survey are not sufficient for us to robustly estimate industry-level new hires from the ‘IT, software and computer services’ sub-sector and industry-level new hires from the CIs excluding this sub-sector separately. ↩
-
Bakhshi et al (2013); Design Council (2008) ↩
-
This is because UKIS only samples firms in those sectors. Our sample therefore excludes firms in: agriculture, forestry and fishing; public administration and defence; education; human health and social work activities; arts, entertainment and recreation; and a small number of other service activities. ↩
-
Around half of large firms in the ABS are also present in the UKIS sample. The match rate is much smaller for smaller firms (around 20% for firms with 50-249 employees and less than 5% for firms with fewer than 50 employees) due to the sampling frame of UKIS which is geared more towards larger innovating firms. ↩
-
Ln indicates the natural logarithm of the variable in question. The coefficients β, γ and ϑ can therefore be interpreted as ‘elasticities’ – the percentage increase in GVA that is associated with a 1% increase in employment, capital or innovation investments. ↩