COVID-19 confirmed deaths in England (to 31 December 2022): report
Updated 28 April 2023

© Crown copyright 2023
This publication is licensed under the terms of the Open Government Licence v3.0 except where otherwise stated. To view this licence, visit nationalarchives.gov.uk/doc/open-government-licence/version/3 or write to the Information Policy Team, The National Archives, Kew, London TW9 4DU, or email: psi@nationalarchives.gov.uk.
Where we have identified any third party copyright information you will need to obtain permission from the copyright holders concerned.
This publication is available at https://www.gov.uk/government/publications/covid-19-reported-sars-cov-2-deaths-in-england/covid-19-confirmed-deaths-in-england-to-31-december-2022-report
Executive summary: disparities in COVID-19 deaths in England
The UK Health Security Agency (UKHSA) has published statistics on deaths in people with a positive SARS-CoV-2 test since 29 April 2020.
In this report we present a retrospective description of deaths in people following a coronavirus (COVID-19) infection, focusing on disparities. The analysis starts with the first COVID-19 death of the pandemic on 2 March 2020 and includes deaths occurring up to 31 December 2022, with a focus on deaths during 2022 which was characterised by circulation of the Omicron variant and changes in the Living with COVID-19 government response.
Main findings
During the pandemic, marked disparities in COVID-19 deaths by age, sex, ethnicity, and deprivation level were consistently observed over the pandemic. Disparities between different geographic regions were observed in the first year of the pandemic but diminished over time.
Deaths were highest among older adults: 92.3% of COVID-19 deaths were in people aged 60 and over; over half (58.3%) were aged 80 and over. Likewise, mortality rates were highest among those aged 80 and over and lowest in children and young people under 20. Deaths were highest among men, particularly during the first wave when the age-standardised mortality rate for males was double that of females.
While people of White ethnic groups comprised 84.1% of COVID-19 deaths, COVID-19 mortality rates were highest for non-white ethnic groups after age-standardising to the population; specifically in Black/Black British, Asian/Asian British and Other ethnic groups. Similarly, there was a clear graded difference by deprivation index of residence, with age-standardised mortality rates highest in the most deprived areas and lowest in the least deprived areas.
Regional disparities in COVID-19 mortality were observed early in the pandemic but dissipated as SARS-CoV-2 spread more widely through the country. These disparities were driven by disproportionately high infection rates in more deprived, more densely populated areas. For example, during the first wave in spring 2020, London’s age-standardised mortality rate was almost double that of other regions. After the first wave, disparities in COVID-19 mortality by region became less clear.
Details on data sources, definitions, and methods can be found at the end of this report.
COVID-19 deaths and mortality rates
In this report, a COVID-19 death is defined as a death in a person within 28 days (equal to or less than) of the first positive SARS-CoV-2 test within their most recent COVID-19 infection.
Deaths are presented for 2 time periods:
- 2020 to 2022: from the first COVID-19 death on 2 March 2020 to 31 December 2022
- 2022: the most recent full calendar year from 1 January to 31 December 2022
COVID-19 deaths following first infection and reinfection
Since the start of the pandemic to end of December 2022, there were 20,453,216 reported cases of COVID-19 in England. In this period, 177,180 people died within 28 days of a positive SARS-CoV-2 test. This represents a crude mortality rate of 313 per 100,000 population.
Since the start of the pandemic, the highest recorded number of daily deaths was 1,255 on 19 January 2021. In 2022, the highest recorded number of daily deaths was 302 deaths on 19 July 2022.
Figure 1a. Deaths within 28 days of a positive COVID-19 test by episode of infection, 2020 to 2022
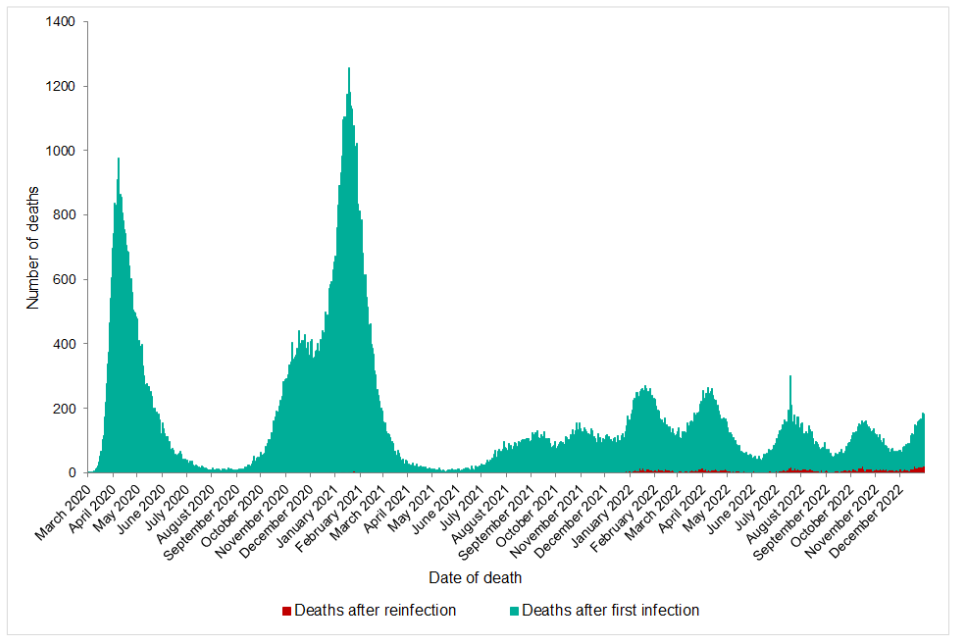
Figure 1b. Deaths within 28 days of a positive COVID-19 test by episode of infection, 2022
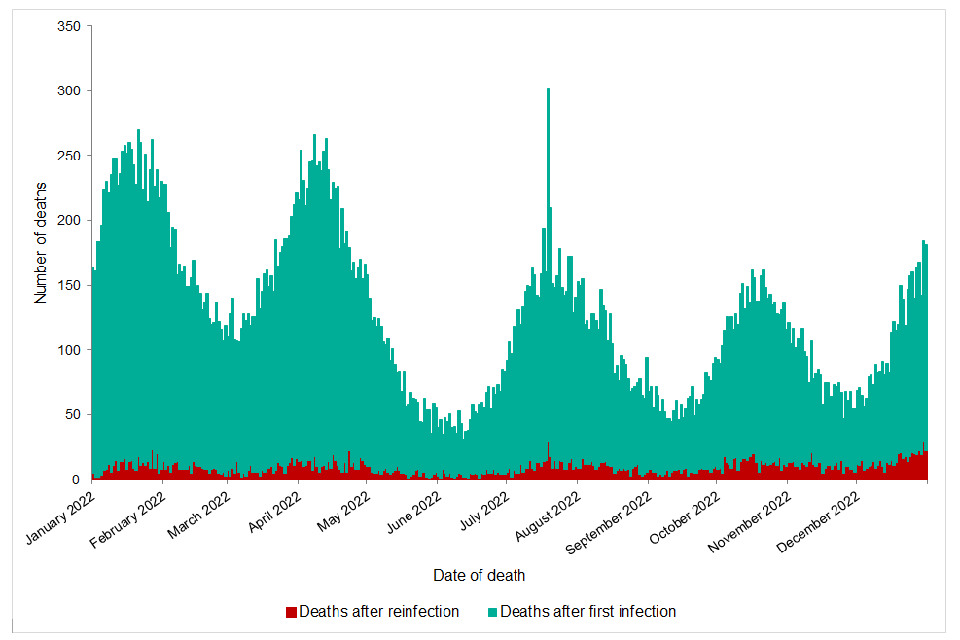
Table 1. Deaths within 28 days of a positive COVID-19 test by first infection and reinfection
| First infection cases (%) | Deaths following first infection (%) | Reinfection cases (%) | Deaths following reinfection (%) | |
|---|---|---|---|---|
| 2020-2022 | 19,036,667 (93.1%) | 172,927 (97.6%) | 1,416,549 (6.9%) | 4,253 (2.4%) |
| 2022 | 7,526,851 (86.9%) | 42,892 (92.5%) | 1,137,482 (13.1%) | 3,475 (7.5%) |
Figure 2a. Age-standardised mortality rate* for deaths within 28 days of a positive COVID-19 test (per 1,000,000 population per year): England, 2020 to 2022
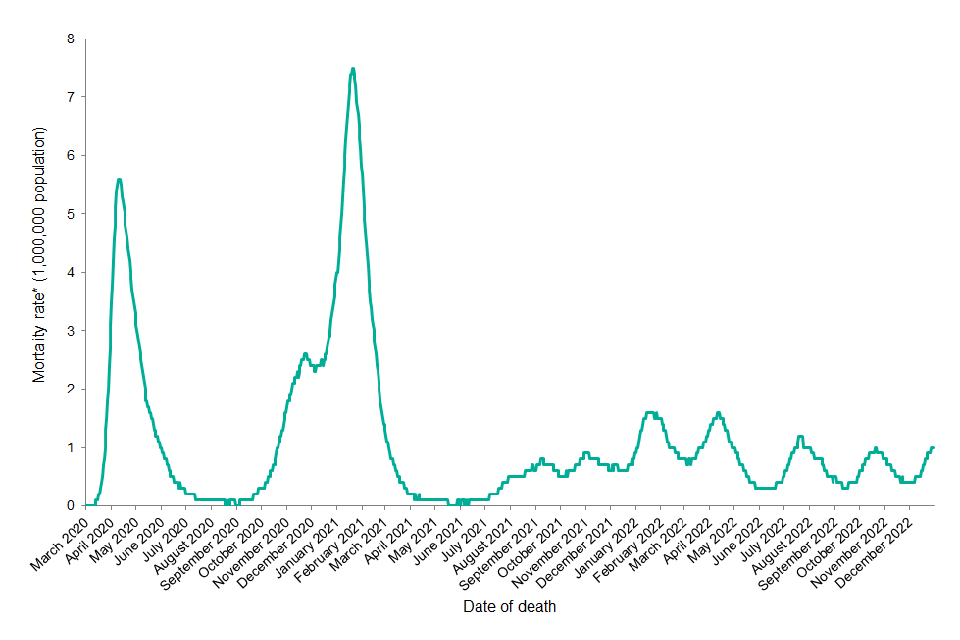
*Rates are annualised and expressed as the number of deaths per 100,000 population per year based on the European Standard Population 2013. Data presented as 7-day rolling rate by date of death.
Figure 2b. Age-standardised mortality rate* for deaths within 28 days of a positive COVID-19 test (per 1,000,000 population per year): England, 2022
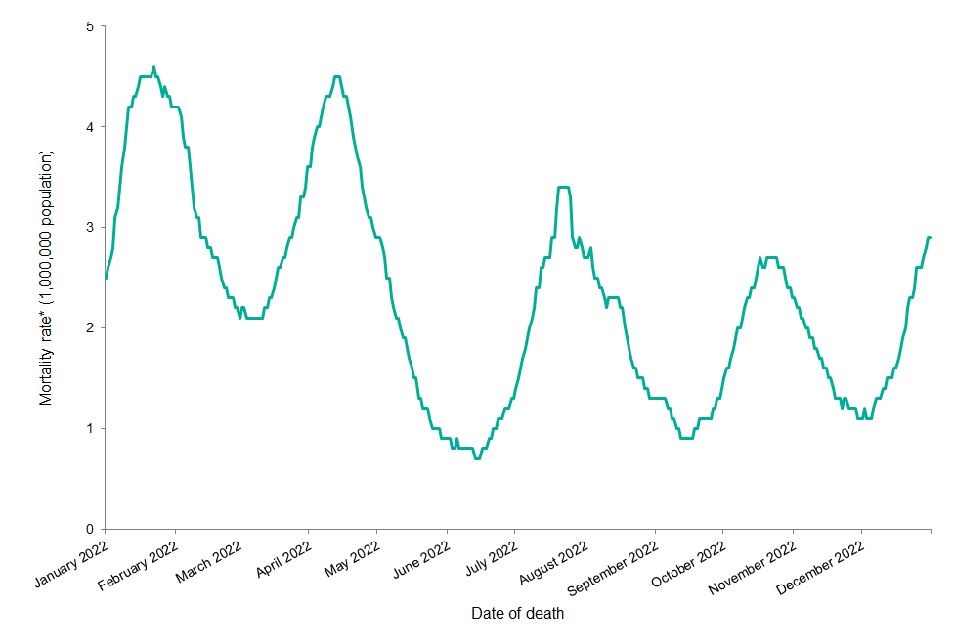
*Rates are annualised and expressed as the number of deaths per 100,000 population per year based on the European Standard Population 2013. Data presented as 7-day rolling rate by date of death.
Sex of COVID-19 deaths
Since the start of the pandemic to end December 2022, deaths were higher in males than females, representing 55.3% of deaths, compared to females who represented 44.7% of deaths. Sex was unknown for less than 0.1% of all deaths.
Age-standardised mortality rates were higher for males throughout the pandemic period, particularly during the first wave when the age-standardised mortality rate for males was double that of females.
Table 2. Deaths within 28 days of a positive COVID-19 test and age-standardised mortality rate* (per 100,000 population per year), by sex
| Sex | Deaths (2020-2022) |
Age-standardised mortality rate (95% CI) (2020-2022) |
Deaths (2022) |
Age-standardised mortality rate* (95% CI) (2022) |
|---|---|---|---|---|
| Female | 79,480 | 89.8 (89.2 - 90.4) | 21,254 | 67.9 (67.0 - 68.8) |
| Male | 97,640 | 142.4 (141.6 - 143.3) | 25,112 | 104.3 (103.0 - 105.6) |
*Rates are annualised and expressed as the number of deaths per 100,000 population per year based on the European Standard Population 2013.
Figure 3a. Age-standardised mortality rates within 28 days of a positive COVID-19 test by sex (per 1,000,000 population per year): England, 2020 to 2022
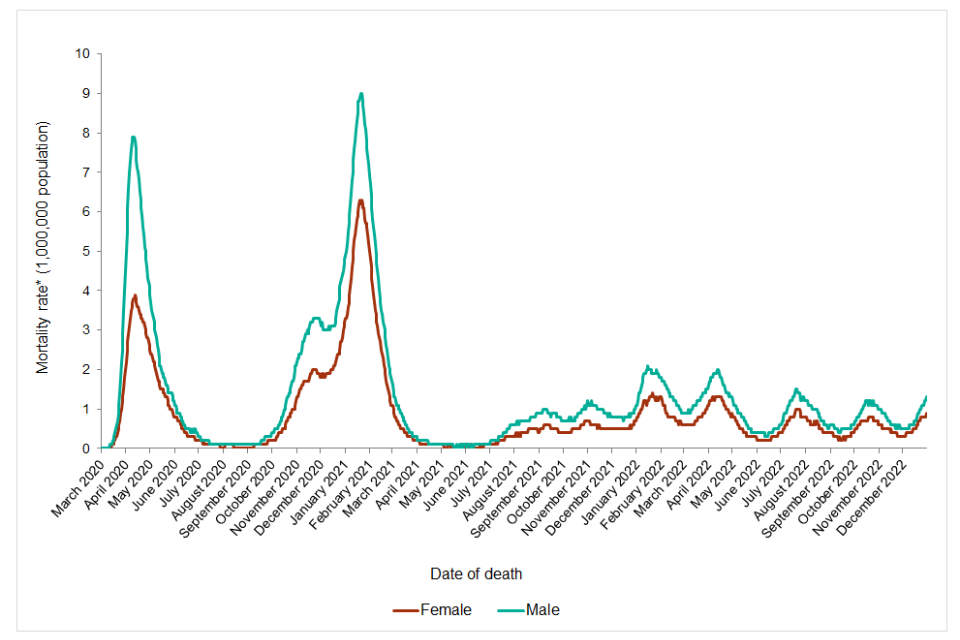
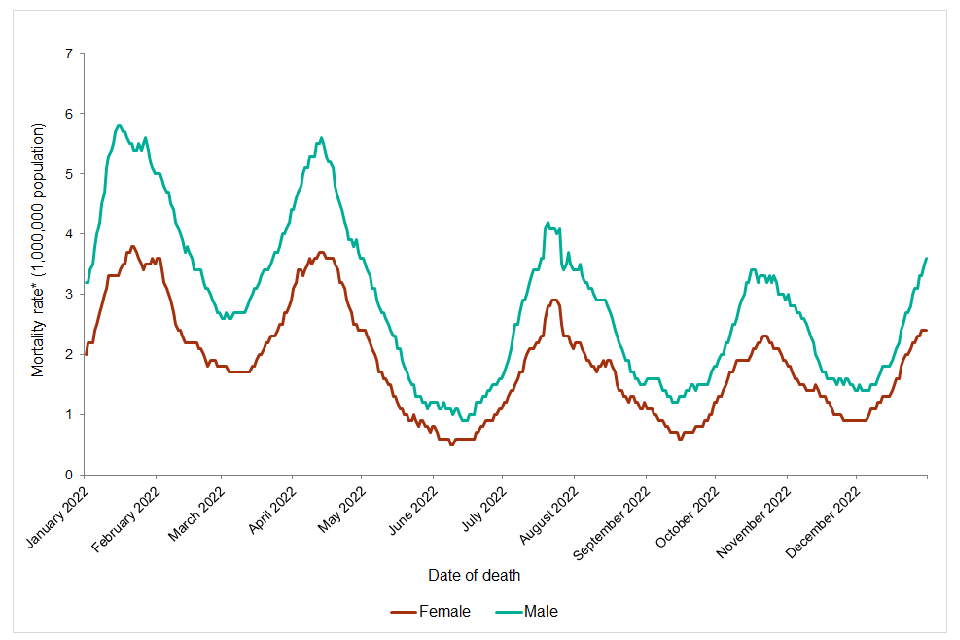
Figure 3b. Age-standardised mortality rates within 28 days of a positive COVID-19 test by sex (per 1,000,000 population per year): England, 2022
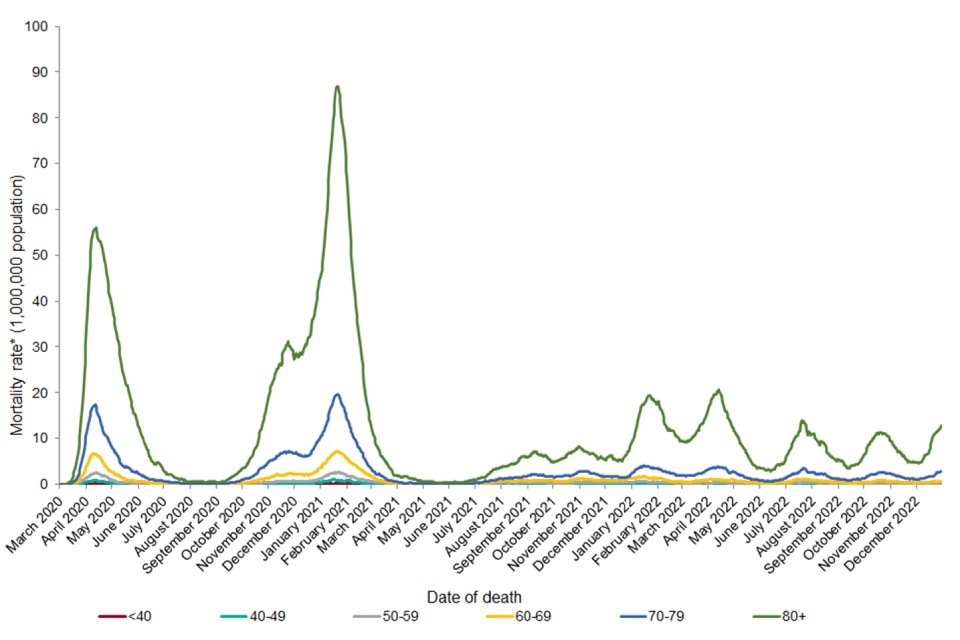
Age of COVID-19 deaths
Deaths were highest among people of older ages, particularly among those aged 60 and over. The 80 and over age group and the 70 to 79-year age group represented over half (58.3%) and just under a quarter (23.3%) of deaths, respectively.
Figures 4a and 4b show age-standardised mortality rates per million population by age group. There is a strong age-risk gradient, with the highest rates in the oldest age groups (70 to 79 and 80 and over). Age-standardised mortality rates were low throughout the period 2020 to 2022 in those aged under 40 with mortality rates less than 20 per 100,000 population per year in each age group, and less than 1 per 100,000 per year among children.
Table 3. Deaths within 28 days of a positive COVID-19 test and age-standardised mortality rates* (per 100,000 population per year) by age group: England, 2020 to 2022
| Age group | Deaths (2020-2022) |
Age-standardised mortality rate (95% CI) (2020-2022) |
Deaths (2022) |
Age-standardised mortality rate * (95% CI) (2022) |
|---|---|---|---|---|
| <5 | 51 | 0.6 (0.4 - 0.7) | 28 | 0.9 (0.6 - 1.2) |
| 5 - 9 | 28 | 0.3 (0.2 - 0.4) | 14 | 0.4 (0.2 - 0.7) |
| 10 - 19 | 126 | 0.7 (0.6 - 0.8) | 42 | 0.6 (0.5 - 0.9) |
| 20 -29 | 422 | 2.1 (1.9 - 2.3) | 137 | 1.9 (1.6 - 2.2) |
| 30 - 39 | 1,228 | 5.7 (5.4 - 6.1) | 350 | 4.6 (4.2 - 5.1) |
| 40 - 49 | 3,095 | 15.4 (14.8 - 15.9) | 750 | 10.5 (9.8 - 11.3) |
| 50 - 59 | 8,728 | 40.3 (39.5 - 41.2) | 1,946 | 25.5 (24.4 - 26.6) |
| 60 - 69 | 18,896 | 111.5 (109.9 - 113.1) | 4,286 | 71.7 (69.5 - 73.8) |
| 70 - 79 | 41,275 | 302.0 (299.1 - 305.0) | 10,402 | 215.6 (211.5 - 219.8) |
| 80+ | 103,273 | 1276.6 (1268.8 - 1284.4) | 28,412 | 995.0 (983.4 - 1006.6) |
*Rates are annualised and expressed as the number of deaths per 100,000 population per year based on the European Standard Population 2013.
Figure 4a. Age-standardised mortality rates* for deaths within 28 days of a positive COVID-19 test by age group (per 1,000,000 population per year): England, 2020 to 2022
*Rates are annualised and expressed as the number of deaths per million population per year based on the European Standard Population 2013. Data presented as 7-day rolling rate by date of death.
Figure 4b. Age-standardised mortality rates* for deaths within 28 days of a positive COVID-19 test by age group (per 1,000,000 population per year): England, 2022
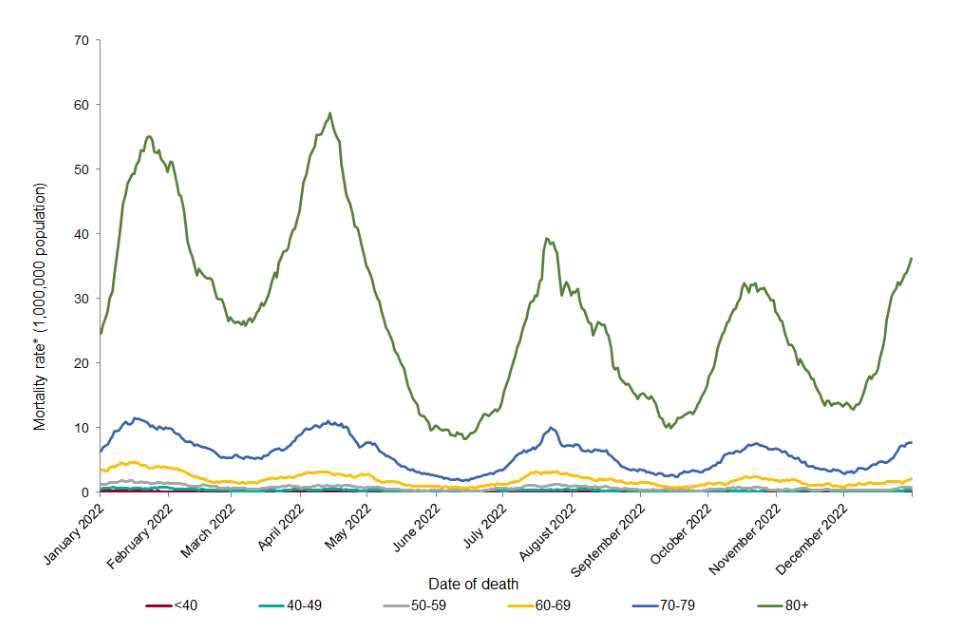
*Rates are annualised and expressed as the number of deaths per million population per year based on the European Standard Population 2013. Data presented as 7-day rolling rate by date of death.
Ethnicity of COVID-19 deaths
From the start of the pandemic to 31 December 2022, the largest number of deaths occurred among those in the White ethnic groups, representing 84.1% of deaths. 6.1%, 3.3%, and 0.5% of deaths occurred in people in the Asian/Asian British, Black/Black British, and the Mixed ethnic groups, respectively.
Mortality rates were consistently highest among people in Black/Black British ethnic groups (225.4. per 100,000 population per year) and Other ethnic groups (271.3 per 100,000 population per year), and lowest in people in White ethnic groups (104.9 per 100,000 population per year).
Rates in the Asian/Asian British ethnic groups were also higher in comparison to other ethnic groups throughout the pandemic. Mortality rates among the Asian/Asian British ethnic groups were generally lower than in the Black/Black British Ethnic group except between September to December 2020 during which mortality rates in the Asian/Asian British group were higher than all other groups. This was not observed again in the pandemic.
Table 4. Deaths within 28 days of a positive COVID-19 test and age-standardised mortality rates* (per 100,000 population) in COVID-19 cases, by ethnicity: England, 2020 to 2022
| Ethnic group | Deaths (2020-2022) |
Age-standardised mortality rate (95% CI) (2020-2022) |
Deaths (2022) |
Age-standardised mortality rate (95% CI) (2022) |
|---|---|---|---|---|
| White | 149,610 | 104.9 (104.4 - 105.4) | 40,172 | 79.7 (78.9 - 80.5) |
| Black / Black British | 5,510 | 225.4 (219.1 - 231.8) | 904 | 106.9 (99.7 - 114.4) |
| Asian / Asian British | 10,280 | 199.0 (195.0 - 203.1) | 1,443 | 82.6 (78.2 - 87.2) |
| Mixed / Multiple ethnic groups | 900 | 117.3 (109.1 - 125.8) | 235 | 90.6 (78.6 - 103.7) |
| Other† | 1,493 | 271.3 (256.7 - 286.3) | 285 | 148.0 (130.0 - 167.3) |
*Rates are annualised and expressed as the number of deaths per 100,000 population per year based on the European Standard Population 2013.
† Rates in the Other ethnic group are likely to be an overestimate due to differences in the method used to allocate ethnicity to death records and the population data used to calculate the rates.
Figure 5a. Age-standardised mortality rates* for deaths within 28 days of a positive COVID-19 test by ethnicity† (per 1,000,000 population per year): England, 2020 to 2022
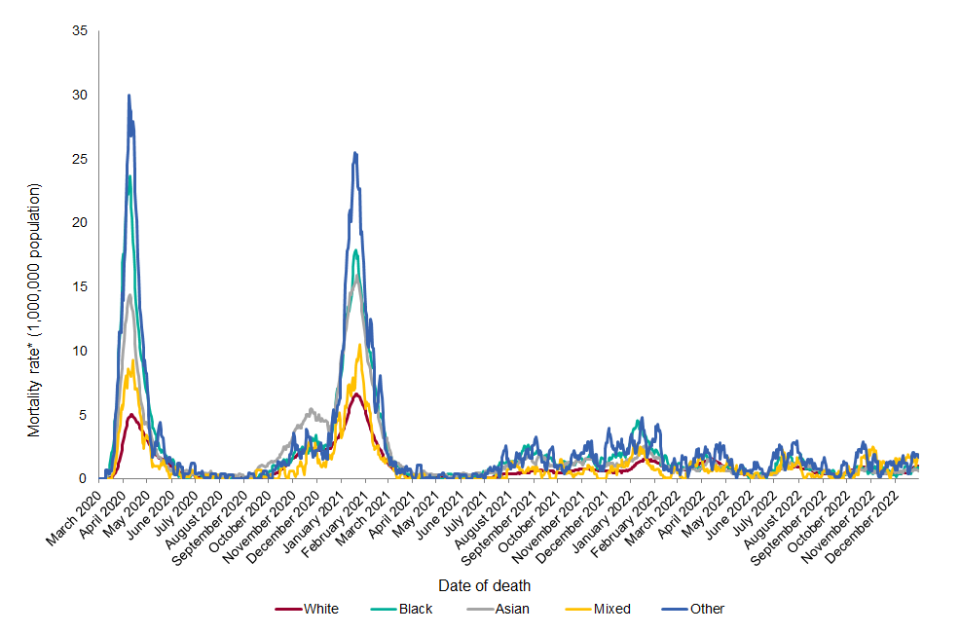
*Rates are annualised and expressed as the number of deaths per million population per year based on the European Standard Population 2013. Data presented as 7-day rolling rate by date of death.
†Rates in the Other ethnic group are likely to be an overestimate due to differences in the method used to allocate ethnicity to death records and the population data used to calculate the rates.
Figure 5b. Age-standardised mortality rates* for deaths within 28 days of a positive COVID-19 test by ethnicity† (per 1,000,000 population per year): England, 2022
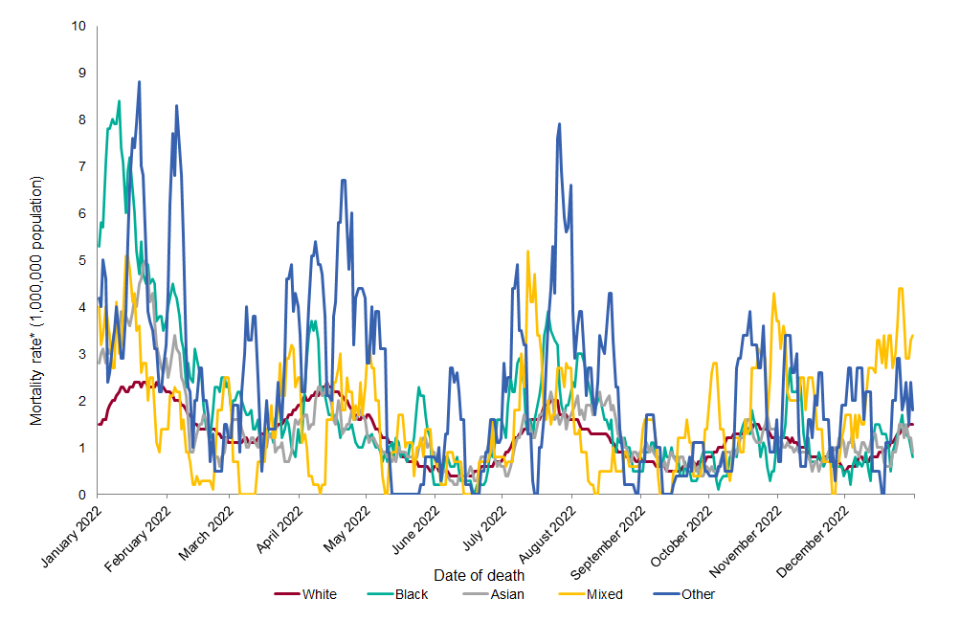
*Rates are annualised and expressed as the number of deaths per million population per year based on the European Standard Population 2013. Data presented as 7-day rolling rate by date of death.
†Rates in the Other ethnic group are likely to be an overestimate due to differences in the method used to allocate ethnicity to death records and the population data used to calculate the rates.
Deprivation level of COVID-19 deaths
Relative deprivation was assessed using quintiles of the Index of Multiple Deprivation (IMD) linked to residential lower super output area level of geographic residence. An IMD quintile of 1 represents the most deprived areas and IMD of 5 represents the least deprived areas.
Since the start of the pandemic, the age-standardised mortality rate was consistently highest among those living in the most deprived areas, with a clear gradient of increasing mortality with increasing deprivation. This trend was consistent over the entire pandemic period.
Between 2020 and 2022, the most deprived quintile (Quintile 1) represented 23.3% of deaths. The least deprived quintile (Quintile 5) represented 16.9% of deaths.
Table 5. Deaths within 28 days of a positive COVID-19 test and age-standardised mortality rate* (per 100,000 population) in COVID-19 cases, by deprivation index
| IMD Quintile (1 most deprived) | Deaths (2020-2022) |
Age-standardised mortality rate (95% CI) (2020-2022) |
Deaths (2022) |
Age-standardised mortality rate (95% CI) (2022) |
|---|---|---|---|---|
| 1 | 40,810 | 178.4 (176.6 - 180.1) | 9,463 | 117.4 (115.0 - 119.8) |
| 2 | 37,129 | 135.4 (134.1 - 136.8) | 9,065 | 93.6 (91.7 - 95.5) |
| 3 | 34,645 | 105.8 (104.7 - 106.9) | 9,272 | 80.1 (78.5 - 81.8) |
| 4 | 32,888 | 92.8 (91.8 - 93.8) | 8,939 | 71.3 (69.8 - 72.8) |
| 5 | 29,563 | 79.9 (79.0 - 80.9) | 8,313 | 63.6 (62.2 - 65.0) |
*Rates are annualised and expressed as the number of deaths per 100,000 population per year based on the European Standard Population 2013.
Figure 6a. Age-standardised mortality rates* for deaths within 28 days of a positive COVID-19 test by deprivation index (per 1,000,000 population per year): England, 2020 to 2022
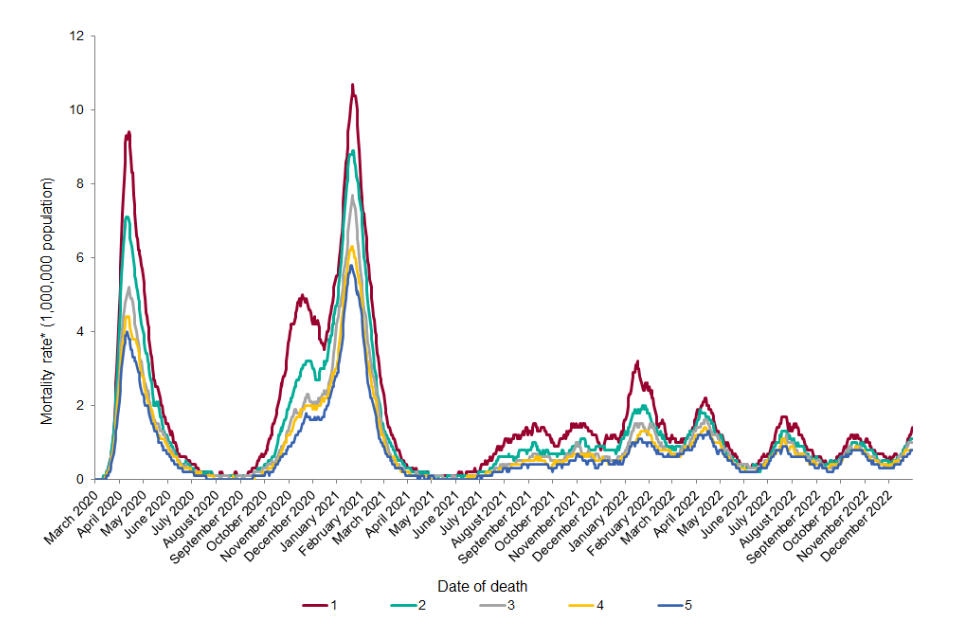
*Rates are annualised and expressed as the number of deaths per million population per year based on the European Standard Population 2013. Data presented as 7-day rolling rate by date of death.
Figure 6b. Age-standardised mortality rates* for deaths within 28 days of a positive COVID-19 test by deprivation index (per 1,000,000 population per year): England, 2022
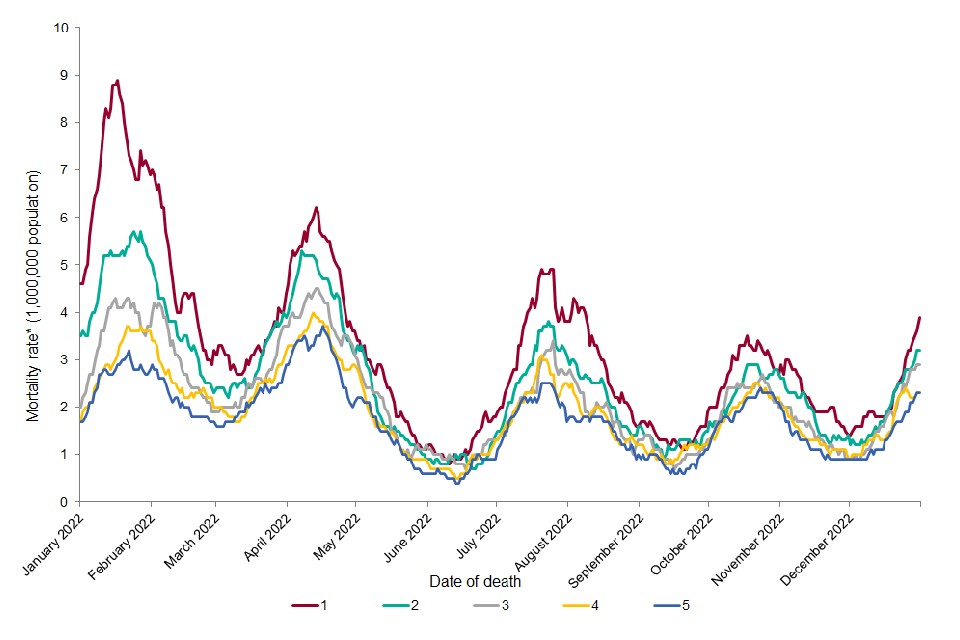
*Rates are annualised and expressed as the number of deaths per million population per year based on the European Standard Population 2013. Data presented as 7-day rolling rate by date of death.
Regional breakdown of COVID-19 deaths
Table 6 shows the cumulative number of COVID-19 deaths by UKHSA region. From the start of the pandemic to end December 2022, the North West region had the highest number (27,996) and age-standardised rate (137.5 per 100,000 per year) of COVID-19 deaths, representing 16.0% of all deaths.
The South West had the lowest age-standardised mortality rate at 69.6 per 100,000 per year, half that of the North West and representing 7.5% of the all deaths.
During the first wave in spring 2020, age-standardised mortality rates were highest in London, and lowest in the South West. At the end of 2020, rates were highest in the North West and Yorkshire and Humber, and lowest in the South West. During the Alpha wave in January 2021, mortality rates were highest in London, followed by the East of England and South East. From summer 2021 the difference in mortality rates by region was no longer clear with each regions having high rates at different time points.
Table 6. Deaths within 28 days of a positive COVID-19 test and age-standardised mortality rates* (per 100,000 population) in COVID-19 cases, by English region†
| UKHSA Centre | Deaths (2020 to 2022) | Age-standardised mortality rate (95% CI) (2020 to 2022) | Deaths (2022) | Age-standardised mortality rate (95% CI) (2022) |
|---|---|---|---|---|
| East Midlands | 16,329 | 117.5 (115.7 - 119.3) | 4,379 | 89.3 (86.7 - 92.0) |
| East of England | 21,099 | 108.6 (107.2 - 110.1) | 5,395 | 78.5 (76.5 - 80.7) |
| London | 22,199 | 129.9 (128.2 - 131.6) | 4,453 | 73.9 (71.7 - 76.1) |
| North East | 9,822 | 125.4 (122.9 - 127.9) | 2,600 | 94.0 (90.4 - 97.7) |
| North West | 27,996 | 137.5 (135.9 - 139.1) | 6,843 | 95.2 (92.9 - 97.5) |
| South East | 25,379 | 93.7 (92.5 - 94.8) | 6,564 | 68.4 (66.8 - 70.1) |
| South West | 13,192 | 69.6 (68.4 - 70.8) | 4,798 | 71.8 (69.7 - 73.8) |
| West Midlands | 20,903 | 125.6 (123.9 - 127.3) | 5,250 | 89.1 (86.8 - 91.6) |
| Yorkshire and Humber | 18,116 | 117.6 (115.9 - 119.4) | 4,770 | 87.7 (85.3 - 90.3) |
*Rates are annualised and expressed as the number of deaths per 100,000 population per year based on the European Standard Population 2013.
Figure 7a. Age-standardised mortality rates* for deaths within 28 days of a positive COVID-19 test by region (per 1,000,000 population per year): England, 2020 to 2022
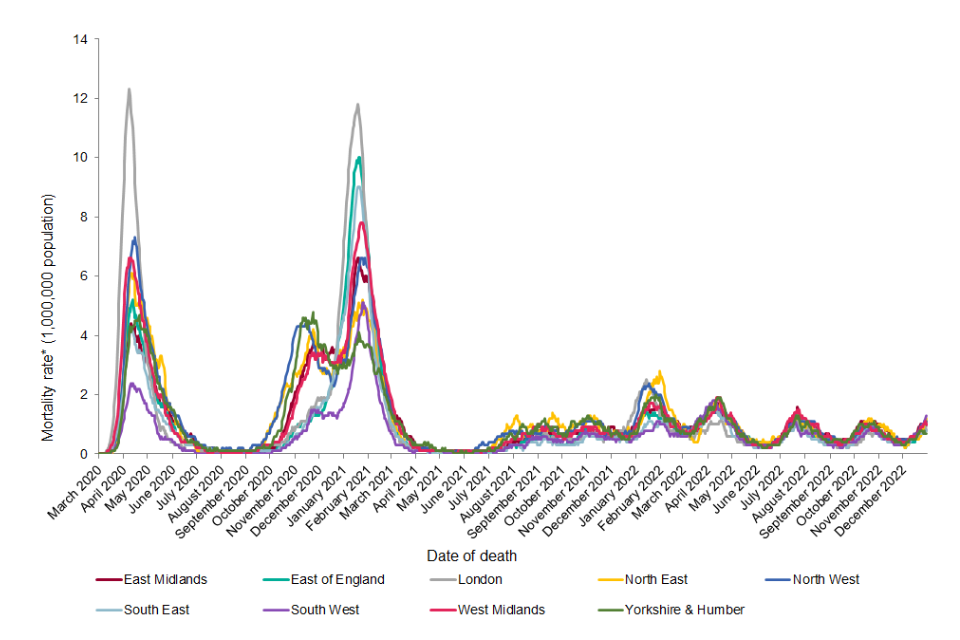
*Rates are annualised and expressed as the number of deaths per million population per year based on the European Standard Population 2013. Data presented as 7-day rolling rate by date of death.
Figure 7b. Age-standardised mortality rates* for deaths within 28 days of a positive COVID-19 test by region (per 1,000,000 population per year): England, 2022
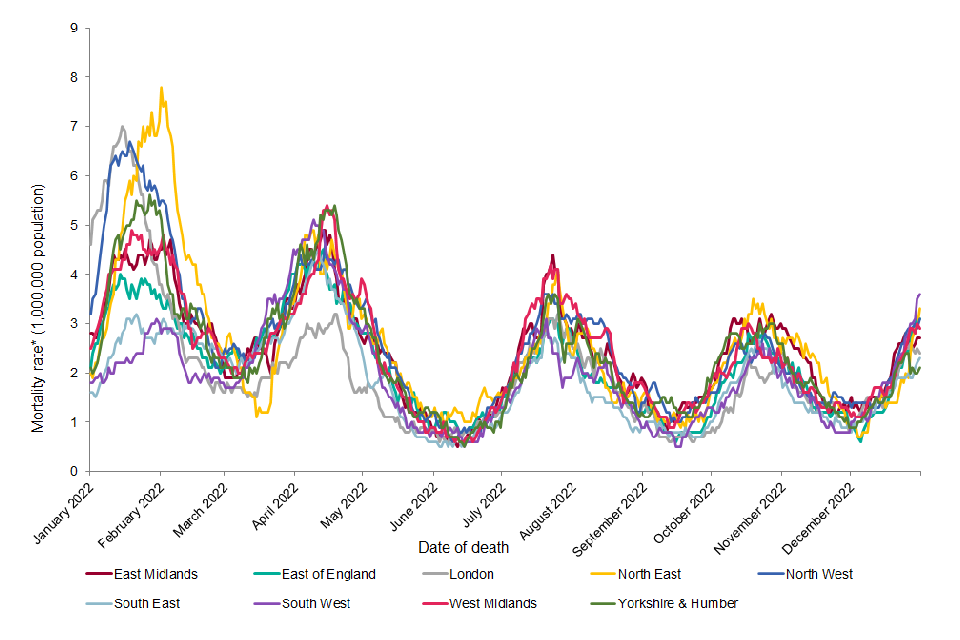
*Rates are annualised and expressed as the number of deaths per million population per year based on the European Standard Population 2013. Data presented as 7-day rolling rate by date of death.
Figure 8a. Map of age-standardised mortality rates* for deaths within 28 days of a positive COVID-19 test by upper-tier local authority (per 100,000 population per year): England, 2020 to 2022
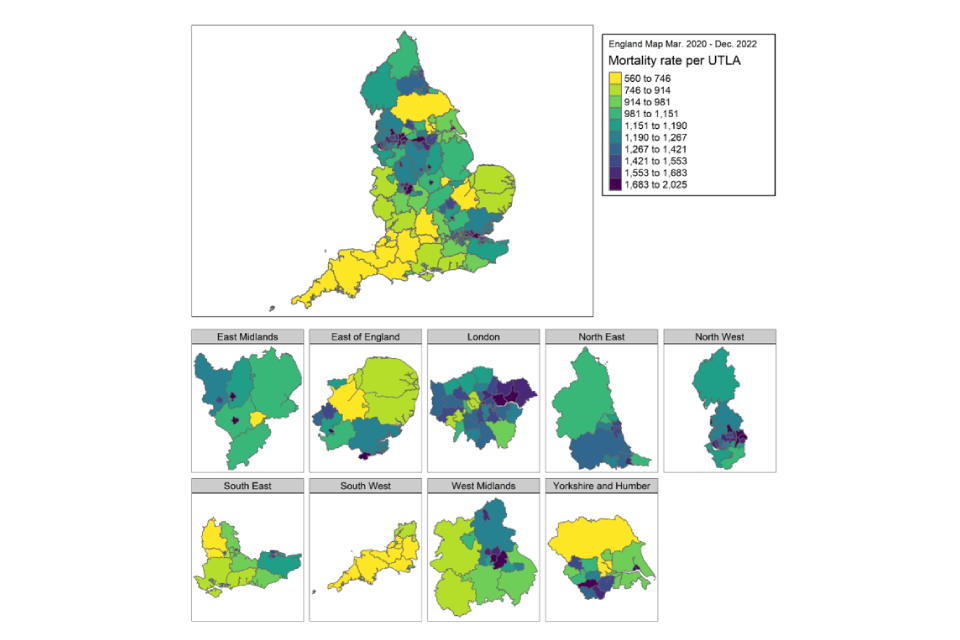
Figure 8b. Map of age-standardised mortality rates* for deaths within 28 days of a positive COVID-19 test by upper-tier local authority (per 100,000 population per year): England, 2022
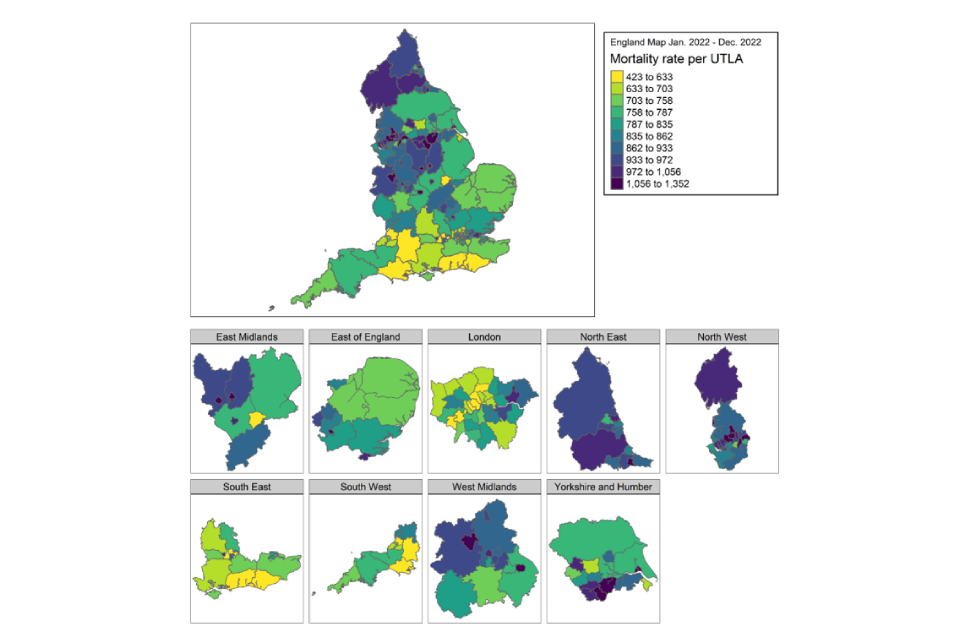
Figures 8a and 8b:
- contain Ordnance Survey data © Crown copyright and database right 2020
- contain National Statistics data © Crown copyright and database right 2020
Sources of COVID-19 deaths data
UKHSA combines mortality data from 4 sources:
- deaths occurring in hospitals among individuals tested positive for COVID-19, notified to NHS England by NHS trusts
- deaths notified to local health protection teams in the course of outbreak management
- death reports from NHS electronic hospital records
- Office for National Statistics (ONS) death registrations mentioning COVID-19
Death reports are deduplicated and linked to laboratory records of positive SARS-CoV-2 tests from the Second Generation Surveillance System (SGSS). Time between first positive specimen date and date of death is calculated to determine if the death occurred within the defined 28 day interval.
See full methodology for calculating 28-day deaths. Further investigation into this measure (SSRN) has suggested that from early 2022, the number of 28-day deaths may be inflated due to some deaths being captured in this measure where COVID-19 has not been included on the death certificate. However, the trend of 28-day deaths reflects the trend in deaths where COVID-19 is stated as a cause of death on the death certificate (UKHSA blog).
Definitions
In this report deaths are defined as a death in a person with a positive SARS-CoV-2 test who died within 28 days of the positive specimen.
Note that data does not report cause of death, and as such represents deaths in people with COVID-19, and not necessarily caused by COVID-19.
In this report, data is reported from 2 March 2020 to 31 December 2022, extracted on 14 February 2023.
Methods
All figures displaying mortality rates have been calculated using a 7-day rolling average, to smooth minor fluctuations in data.
Age-standardised mortality rates
Time trends are presented as 7-day rolling age-standardised mortality rates per 1 million population. This adjusts for differences in the age structure in the underlying population. The standard used throughout this report is the European Standard Population 2013.
Mortality rates are calculated using 2020 mid-year population estimates from ONS for age, sex, region, and IMD. 2019 estimates were used for ethnicity.
Annualisation
Mortality rates presented for different time periods have been annualised to allow for comparisons (for example the period 2020 to 2022, compared to the year 2022). This method involves adjusting the population rate for the period of interest, and is expressed as mortality rate per million population per year. These rates cannot be compared with rates that do not have this adjustment.
Demographic breakdowns
Age
For cases, age is calculated as the difference, in years, between date of birth and the specimen collection date of the positive test. For deaths, age is calculated as the difference, in years, between date of birth and date of death. Age is presented in 10 year age groups.
Sex
Information on sex is obtained from the test request or registration form. Where missing or incomplete, sex information is further enriched by tracing against the Demographic Batch Service.
Ethnic group
Information on ethnicity is primarily obtained from self-reported ethnicity at the time of test. Where information on ethnicity is missing or incomplete, ethnicity information is further enriched via linkage to healthcare records for COVID-19 surveillance purposes. Ethnic categories are based on ONS classifications.
Region
Information on residential address is obtained from the test request or registration form. Where missing or incomplete, residential address information is further enriched via linkage to healthcare records for COVID-19 surveillance purposes. Residential postcode is used to derive geographical groupings and mapped to UKHSA regions, through linking to ONS regional classifications.
Index of multiple deprivation
Using residential address (as described above), residential lower super output area (LSOA) of residence is linked to 2019 IMD produced by Ministry of Housing, Communities and Local Government (MHCLG).
Report prepared by UKHSA COVID-19 Vaccines and Epidemiology Division.