COVID-19 confirmed deaths in England (to 28 February 2021): report
Updated 28 April 2023

© Crown copyright 2023
This publication is licensed under the terms of the Open Government Licence v3.0 except where otherwise stated. To view this licence, visit nationalarchives.gov.uk/doc/open-government-licence/version/3 or write to the Information Policy Team, The National Archives, Kew, London TW9 4DU, or email: psi@nationalarchives.gov.uk.
Where we have identified any third party copyright information you will need to obtain permission from the copyright holders concerned.
This publication is available at https://www.gov.uk/government/publications/covid-19-reported-sars-cov-2-deaths-in-england/covid-19-confirmed-deaths-in-england-to-28-february-2021-report
COVID-19 deaths
Public Health England (PHE) has published statistics on deaths in people with laboratory-confirmed COVID-19 since 29 April 2020. In this report we present the latest data on COVID-19 mortality. Further information on the data series can be found here.
Data sources
Cases of laboratory diagnosed COVID-19 resident in England were identified from the Second Generation Surveillance System (SGSS).
Fact and date of death were derived from combined sources: NHS England hospital deaths, Office for National Statistics (ONS) death registrations, PHE Health Protection Team direct reporting and Demographic Batch Service tracing of laboratory-confirmed cases.
Definitions
In this report deaths are defined as a death in a person with a laboratory-confirmed positive COVID-19 test and either:
- died within 60 days of the first specimen date
or
- died more than 60 days after the first specimen date with COVID-19 mentioned on the death certificate
This data does not include deaths in people where COVID-19 is suspected but not confirmed by testing (SARS-CoV-2 PCR either negative or not tested).
This data does not report cause of death, and as such represents all deaths in people with laboratory-confirmed COVID-19, not just those caused by COVID-19.
In this report, data is reported from 29 June 2020 to 28 February 2021.
Mortality rates are calculated using 2019 ONS population estimates data.
Age-standardised rates adjust for differences in the age structure of populations. The standard used throughout this report is the European Standard Population 2013.
Methods
Mortality rates presented for different time periods have been annualised in order to enable comparisons. This method involves adjusting the population data used to calculate rates for the time period covered, these are expressed as mortality rates per 100,000 population per year. These rates cannot be compared with rates that do not have this adjustment.
Mortality rates by region, local authority, sex, ethnic group and Index of Multiple Deprivation (IMD) have been age-standardised to account for the different age distributions within different populations.
All figures displaying mortality rates have been calculated using a 7-day rolling average, to allow for smoothing of fluctuating data.
COVID-19 mortality rates
Within the period 29 June 2020 to 28 February 2021, 3,425,333 cases of COVID-19 were detected in England.
In the same period, there have been 83,848 deaths in persons with laboratory-confirmed COVID-19. This represents a crude mortality rate of 222.8 per 100,000 population. From 29 June 2020 onwards, the highest recorded number of daily deaths was 1,370 deaths on 19 January 2021.
Table 1. Number of laboratory-confirmed cases, deaths and crude mortality rate (per 100,000 population) in laboratory-confirmed cases of COVID-19, by month*†
| Month | Cases | Deaths | Crude mortality rate (95% CI) |
|---|---|---|---|
| July 2020 | 19,341 | 1,187 | 3.2 (3.0-3.3) |
| August 2020 | 29,834 | 513 | 1.4 (1.2-1.5) |
| September 2020 | 127,799 | 817 | 2.2 (2.0-2.3) |
| October 2020 | 483,101 | 4,542 | 12.1 (11.7-12.4) |
| November 2020 | 526,784 | 11,633 | 30.9 (30.4-31.5) |
| December 2020 | 862,745 | 15,831 | 42.1 (41.4-42.7) |
| January 2021 | 1,080,882 | 33,241 | 88.3 (87.4-89.3) |
| February 2021 | 293,596 | 15,943 | 42.4 (41.7-43.0) |
*Data are presented from 1 July 2020 to 28 February 2021. Due to continuous data quality improvements, reported number of cases and deaths may be subject to fluctuations. These numbers represent a snapshot of the number of cases and deaths at the time of report production.
†Deaths within 60 days of a positive COVID-19 test or where COVID-19 is mentioned on the death certificate.
Figure 1. Number of deaths in laboratory-confirmed cases of COVID-19 by date of death, from week 27 onwards*†
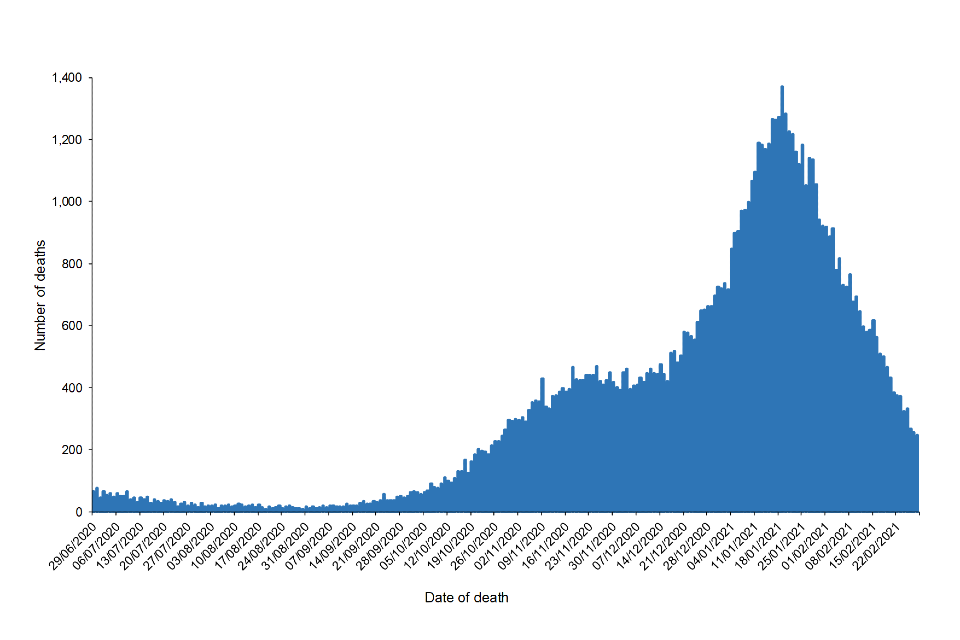
Figure 1
*Data are presented from 29 June 2020 to 28 February 2021.
†Deaths within 60 days of a positive COVID-19 test or where COVID-19 is mentioned on the death certificate.
Age and sex distribution
Since 29 June 2020, the mortality rate was highest among those aged over 80 (annualised rate of 2,618.2 per 100,000 population per year). The mortality rate in each age group in February 2021 was higher than the rate for the total period 29 June 2020 to 28 February 2021.
Table 2. Number of deaths and annualised mortality rate** (per 100,000 population per year) in laboratory-confirmed cases of COVID-19, by age group†
| Age group | Deaths (week 27 onwards*) | Mortality rate** (95% CI) (week 27 onwards*) | Deaths (February 2021) | Mortality rate ** (95% CI) (February 2021) |
|---|---|---|---|---|
| <5 | <10 | 0.2 (0.1-0.5) | <10 | 0.0 (0.0-0.0) |
| 5-9 | <10 | 0.2 (0.0-0.4) | <10 | 0.0 (0.0-0.0) |
| 10-19 | 27 | 0.6 (0.4-0.9) | <10 | 1.6 (0.7-3.2) |
| 20-29 | 122 | 2.5 (2.1-3.0) | 28 | 5.0 (3.3-7.2) |
| 30-39 | 444 | 8.8 (8.0-9.7) | 100 | 17.3 (14.1-21.0) |
| 40-49 | 1,295 | 27.2 (25.7-28.7) | 292 | 53.4 (47.4-59.9) |
| 50-59 | 3,984 | 78.6 (76.2-81.1) | 940 | 161.7 (151.5-172.4) |
| 60-69 | 8,910 | 225.6 (220.9-230.3) | 2,033 | 448.5 (429.2-468.5) |
| 70-79 | 19,404 | 615.0 (606.3-623.7) | 3,647 | 1007.2 (974.8-1040.5) |
| 80+ | 49,653 | 2618.2 (2595.2-2641.3) | 8,895 | 4087.2 (4002.7-4173.0) |
Note: Numbers of deaths fewer than 10 have been excluded to minimise the risk of deductive disclosure.
*Data are presented from 29 June 2020 to 28 February 2021
**Rates are annualised and expressed as the number of deaths per 100,000 population per year.
†Deaths within 60 days of a positive COVID-19 test or where COVID-19 is mentioned on the death certificate.
From week 27 onwards, 44,812 (annualised rate of 228.0 per 100,000 population per year) deaths have occurred in males and 39,036 (137.0 per 100,000 per year) in females. The mortality rate in both sexes in February was higher than the average for the total period 29 June 2020 to 28 February 2021.
Table 3. Number of deaths and age-adjusted annualised mortality rate ** (per 100,000 population) in laboratory-confirmed cases of COVID-19, by sex*†
| Sex | Deaths (week 27 onwards*) | Age-adjusted mortality rate** (95% CI) (week 27 onwards*) | Deaths (February 2021) | Age-adjusted mortality rate** (95% CI) (February 2021) |
|---|---|---|---|---|
| Female | 39,036 | 137.0 (115.0-162.0) | 7,534 | 232.0 (203.1-263.9) |
| Male | 44,812 | 228.0 (199.4-259.6) | 8,409 | 375.0 (338.0-414.9) |
*Data are presented from 29 June 2020 to 28 February 2021.
**Rates are annualised and expressed as the number of deaths per 100,000 population per year.
†Deaths within 60 days of a positive COVID-19 test or where COVID-19 is mentioned on the death certificate.
Figure 2.a. Seven-day rolling average annualised mortality rates** (per 100,000 population per year) in laboratory-confirmed cases of COVID-19 by age group, from week 27 onwards*†
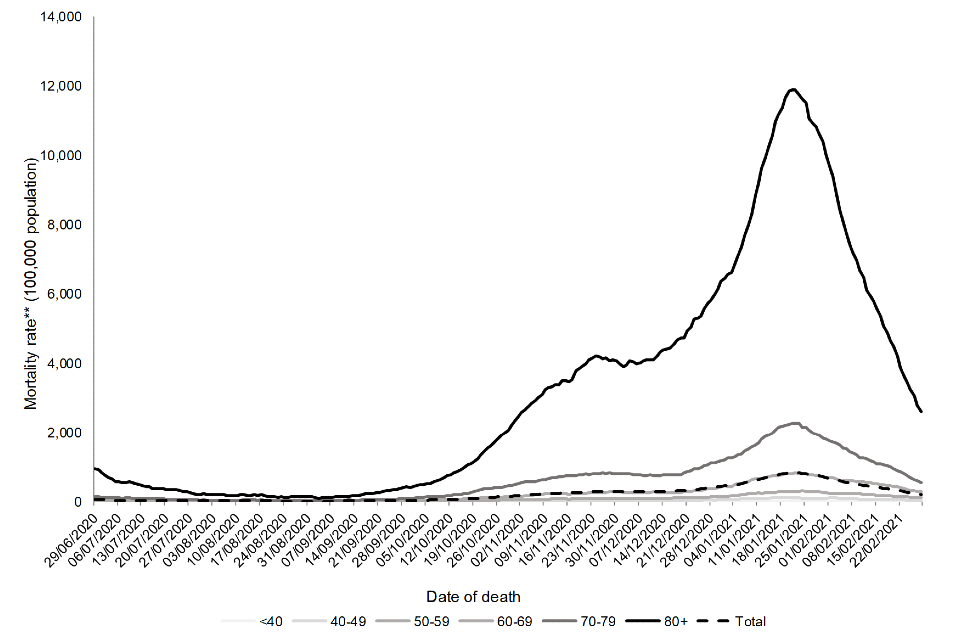
Figure 2a
*Data are presented from 29 June 2020 to 28 February 2021.
**Rates are annualised and expressed as the number of deaths per 100,000 population per year.
†Deaths within 60 days of a positive COVID-19 test or where COVID-19 is mentioned on the death certificate.
Figure 2.b. Seven-day rolling average annualised mortality rates** (per 100,000 population) in laboratory-confirmed cases of COVID-19 by age group, February 2021*†
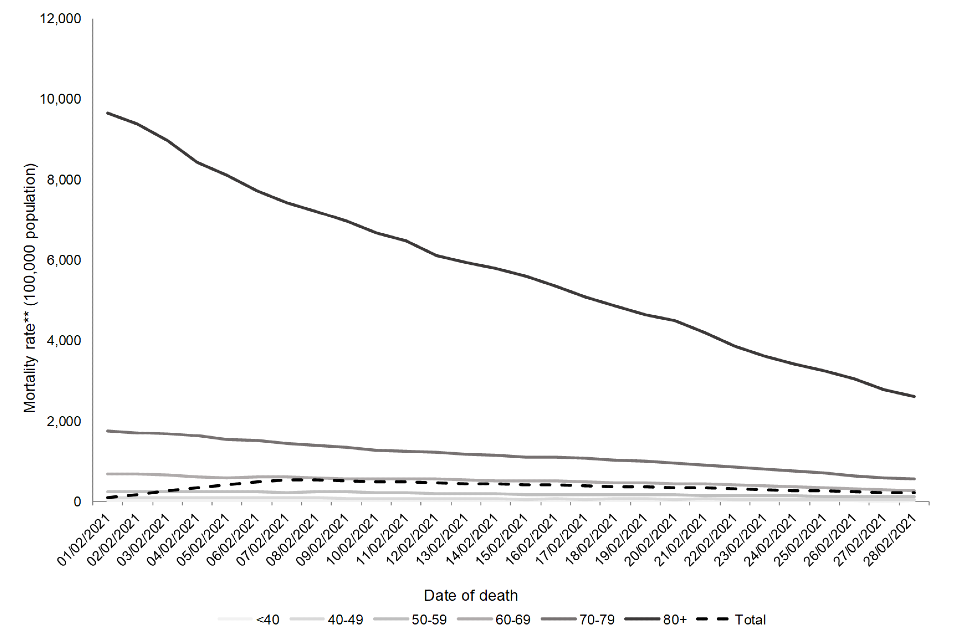
Figure 2b
*Data are presented from 1 February to 28 February 2021.
**Rates are annualised and expressed as the number of deaths per 100,000 population per year.
†Deaths within 60 days of a positive COVID-19 test or where COVID-19 is mentioned on the death certificate.
Ethnicity
Overall, the age-adjusted annualised mortality rate from 29 June 2020 onwards was highest among those of Other ethnic groups followed by those of Asian or Asian British ethnic groups. Although 87.2% deaths have been reported among those of White or White British ethnic groups, the age-adjusted mortality rate is lowest among those of White or White British ethnic groups.
Table 4. Number of deaths and age-adjusted annualised mortality rate** (per 100,000 population) in laboratory-confirmed cases of COVID-19, by ethnicity†
| Ethnic category *** | Deaths (week 27 onwards* ) | Age-adjusted mortality rate** (95% CI) (week 27 onwards*) | Deaths (February 2021) | Age-adjusted mortality rate** (95% CI) (February 2021) |
|---|---|---|---|---|
| White / White British | 73,082 | 160.0 (136.2-186.8) | 13,809 | 265.0 (234.1-298.9) |
| Black / Black British | 2,062 | 299.0 (266.1-334.9) | 444 | 561.0 (515.5-609.4) |
| Asian / Asian British | 5,631 | 406.0 (367.5-447.5) | 1,071 | 633.0 (584.6-684.3) |
| Mixed | 410 | 186.0 (160.2-214.7) | 81 | 292.0 (259.5-327.5) |
| Other± | 1,295 | 790.0 (735.9-847.1) | 259 | 1,337.0 (1,266.3-1,410.6) |
| Unknown | 1,368 | – | 279 | – |
*Data are presented from 29 June 2020 to 28 February 2021.
**Rates are annualised and expressed as the number of deaths per 100,000 population per year.
***Ethnic categories are based on ONS classifications
±The rates in the Other ethnic group are likely to be an overestimate due to the difference in the method of allocating ethnicity codes to the deaths data and the population data used to calculate the rates.
†Deaths within 60 days of a positive COVID-19 test or where COVID-19 is mentioned on the death certificate.
Figure 3.a. Seven-day rolling average age-adjusted annualised mortality rates** (per 100,000 population) in laboratory-confirmed cases of COVID-19 by ethnicity, from week 27 onwards*†
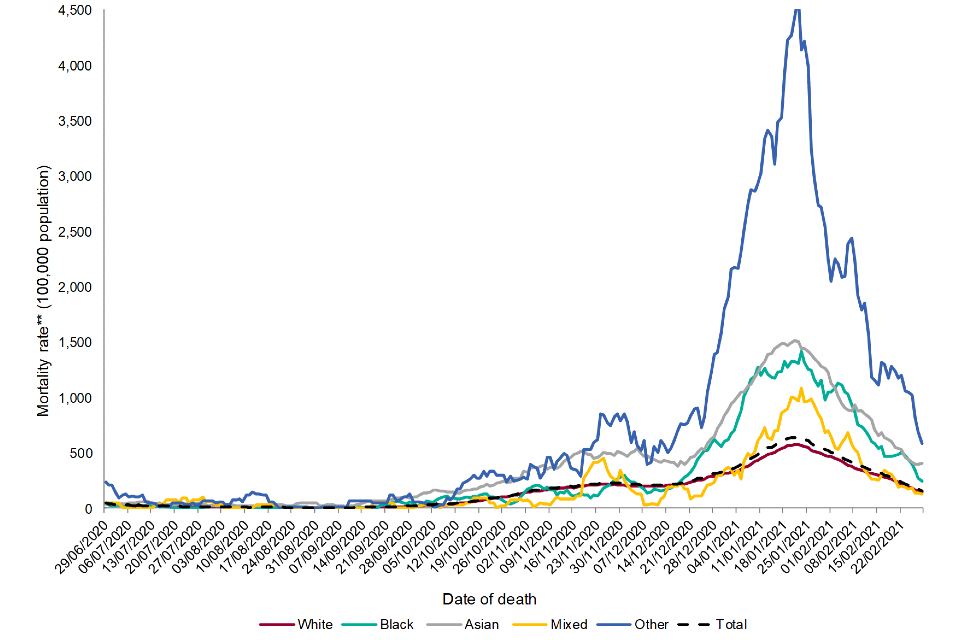
Figure 3a
*Data are presented from 29 June 2020 to 28 February 2021.
**Rates are annualised and expressed as the number of deaths per 100,000 population per year.
***Ethnic categories are based on ONS classifications.
±The rates in the Other ethnic group are likely to be an overestimate due to the difference in the method of allocating ethnicity codes to the cases data and the population data used to calculate the rates.
†Deaths within 60 days of a positive COVID-19 test or where COVID-19 is mentioned on the death certificate.
Figure 3.b. Seven-day rolling average age-adjusted mortality rates** (per 100,000 population) in laboratory-confirmed cases of COVID-19 by ethnicity, February 2021*†
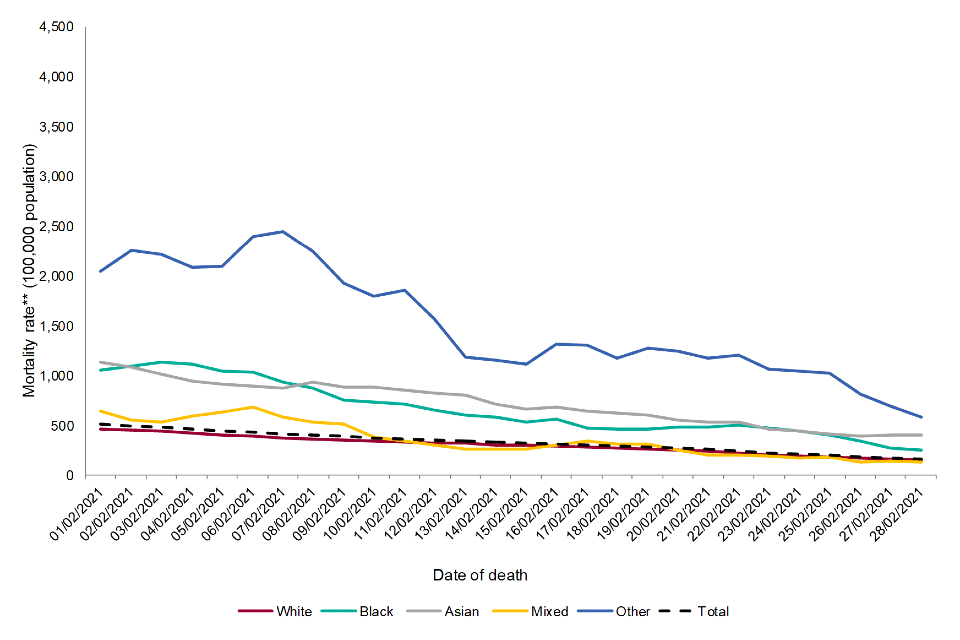
Figure 3b
*Data are presented from 1 February to 28 February 2021.
**Rates are annualised and expressed as the number of deaths per 100,000 population per year.
±The rates in the Other ethnic group are likely to be an overestimate due to the difference in the method of allocating ethnicity codes to the cases data and the population data used to calculate the rates.
†Deaths within 60 days of a positive COVID-19 test or where COVID-19 is mentioned on the death certificate.
Deprivation
Relative deprivation was assessed using quintiles of the IMD linked to residential lower super output area, with IMD 1 representing the most deprived. Overall, the age-adjusted annualised mortality rate is highest among those living in the most deprived areas, with a gradual decrease in mortality rate seen with decreasing deprivation. The mortality rate in all deprivation groups in February was higher than the adjusted rate for the total period 29 June 2020 to 28 February 2021.
Table 5. Number of deaths and age-adjusted annualised mortality rate** (per 100,000 population) in laboratory-confirmed cases of COVID-19, by IMD quintile*†
| IMD Quintile (1 = most deprived) | Deaths (week 27 onwards*) | Age-adjusted mortality rate** (95% CI) (week 27 onwards*) | Deaths (February 2021) | Age-adjusted mortality rate** (95% CI) (February 2021) |
| 1 | 19,538 | 370.0 (333.3-409.7) | 3,570 | 409.0 (370.3-450.6) |
| 2 | 17,975 | 261.0 (230.3-294.7) | 3,363 | 294.0 (261.4-329.6) |
| 3 | 16,555 | 184.0 (158.4-212.6) | 3,242 | 215.0 (187.2-245.7) |
| 4 | 15,418 | 150.0 (127.0-176.0) | 2,948 | 175.0 (150.0-202.9) |
| 5 | 13,889 | 121.0 (100.4-144.6) | 2,678 | 138.0 (115.9-163.0) |
| Unknown | 473 | – | 142 | – |
*Data are presented from 29 June 2020 to 28 February 2021.
**Rates are annualised and expressed as the number of deaths per 100,000 population per year.
†Deaths within 60 days of a positive COVID-19 test or where COVID-19 is mentioned on the death certificate.
Figure 4.a. Seven-day rolling average age-adjusted annualised mortality rate** (per 100,000 population) in laboratory-confirmed cases of COVID-19 by IMD quintile, from week 27 onwards*†
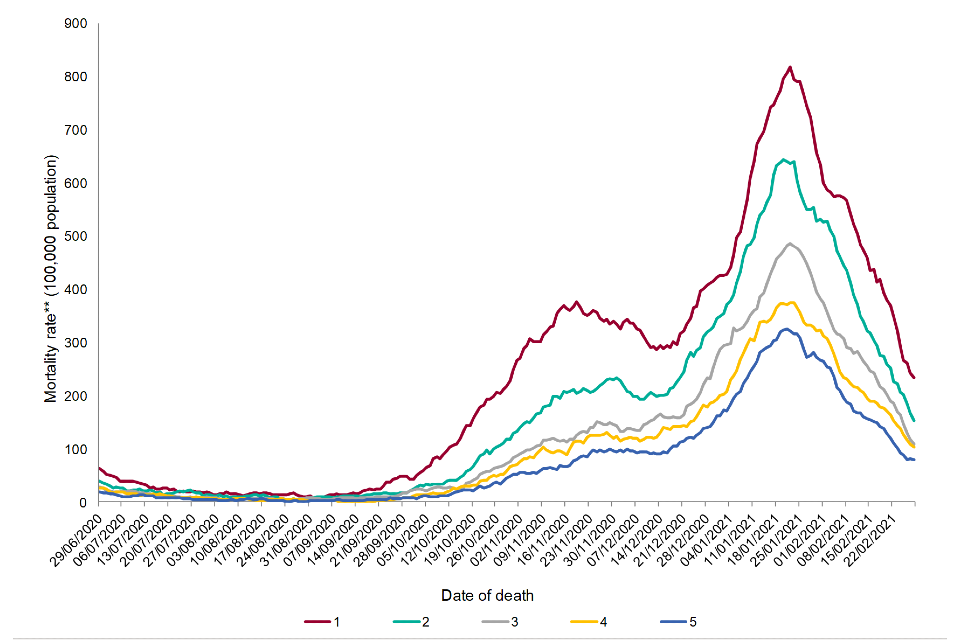
Figure 4a
*Data are presented from 29 June 2020 to 28 February 2021.
**Rates are annualised and expressed as the number of deaths per 100,000 population per year.
†Deaths within 60 days of a positive COVID-19 test or where COVID-19 is mentioned on the death certificate.
Figure 4.b. Seven-day rolling average age-adjusted annualised mortality rate** (per 100,000) population in laboratory-confirmed cases of COVID-19 by IMD quintile, February 2021*†
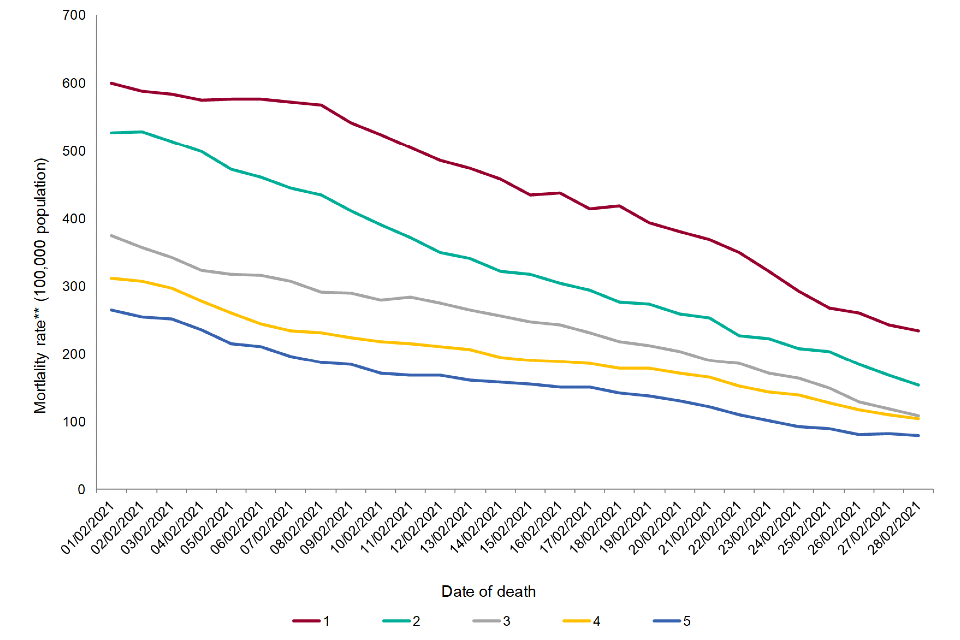
Figure 4b
*Data are presented from 1 February to 28 February 2021.
**Rates are annualised and expressed as the number of deaths per 100,000 population per year.
†Deaths within 60 days of a positive COVID-19 test or where COVID-19 is mentioned on the death certificate.
Regional breakdown
Since 29 June 2020, the annualised mortality rate was highest in the North West (224.0 per 100,000 population per year), followed by London (217.0 per 100,000 population per year). The lowest mortality rate was seen in the South West (80.0 per 100,000 population per year). In February the highest annualised mortality rate was seen in the West Midlands (360.0 per 100,000 population per year).
Table 6. Number of deaths and age-adjusted annualised mortality rate** (per 100,000 population) in laboratory-confirmed cases of COVID-19, by PHE centre*†
| PHE centre | Deaths (week 27 onwards*) | Age-adjusted mortality rate** (95% CI) (week 27 onwards*) | Deaths (February 2021) | Age-adjusted mortality rate** (95% CI) (February2021) |
|---|---|---|---|---|
| East Midlands | 7,870 | 181.0 (155.6-209.4) | 1,550 | 326.0 (291.6-363.4) |
| East of England | 10,685 | 176.0 (151.0-204.0) | 2,211 | 307.0 (273.6-343.3) |
| London | 10,460 | 217.0 (189.1-247.9) | 1,891 | 337.0 (302.0-375.0) |
| North East | 4,292 | 174.0 (149.1-201.9) | 707 | 254.0 (223.7-287.2) |
| North West | 13,229 | 224.0 (195.6-255.3) | 2,331 | 348.0 (312.4-386.6) |
| South East | 13,415 | 153.0 (129.7-179.3) | 2,538 | 259.0 (228.4-292.5) |
| South West | 5,376 | 80.0 (63.4-99.6) | 1,224 | 151.0 (127.9-177.1) |
| West Midlands | 9,913 | 196.0 (169.5-225.4) | 2,092 | 360.0 (323.8-399.2) |
| Yorkshire and Humber | 8,135 | 168.0 (143.6-195.4) | 1,257 | 237.0 (207.8-269.2) |
| Unknown | 473 | – | 142 | – |
*Data are presented from 29 June 2020 to 28 February 2021.
**Rates are annualised and expressed as the number of deaths per 100,000 population per year.
†Deaths within 60 days of a positive COVID-19 test or where COVID-19 is mentioned on the death certificate.
Figure 5.a. Seven-day rolling average age-adjusted annualised mortality rates** (per 100,000 population) in laboratory-confirmed cases of COVID-19 by PHE centre, from week 27 onwards*†
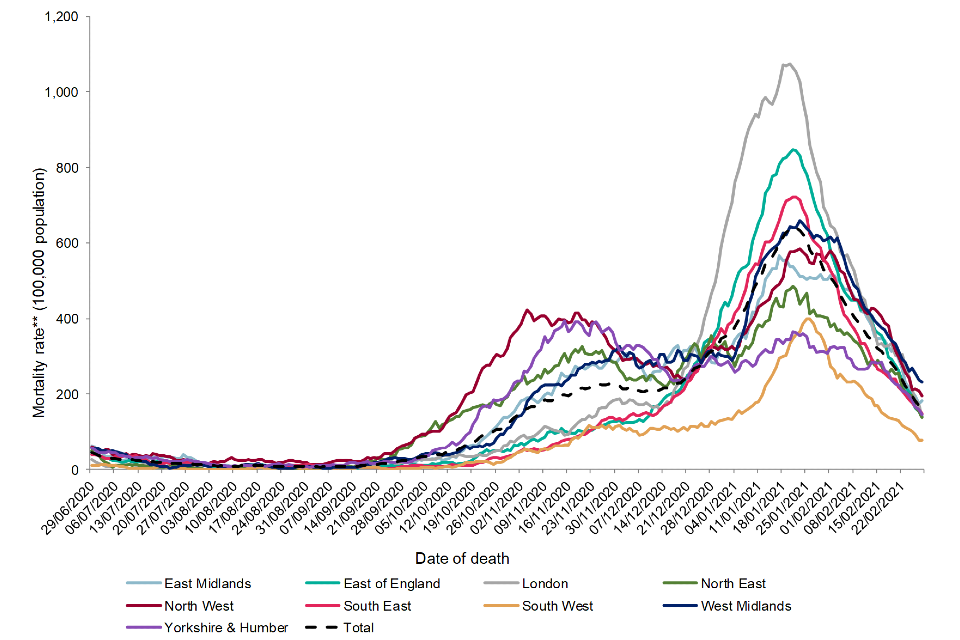
Figure 5a
*Data are presented from 29 June 2020 to 28 February 2021.
**Rates are annualised and expressed as the number of deaths per 100,000 population per year.
†Deaths within 60 days of a positive COVID-19 test or where COVID-19 is mentioned on the death certificate.
Figure 5.b. Seven-day rolling average age-adjusted annualised mortality rates** (per 100,000 population) in laboratory-confirmed cases of COVID-19 by PHE centre, February 2021*†
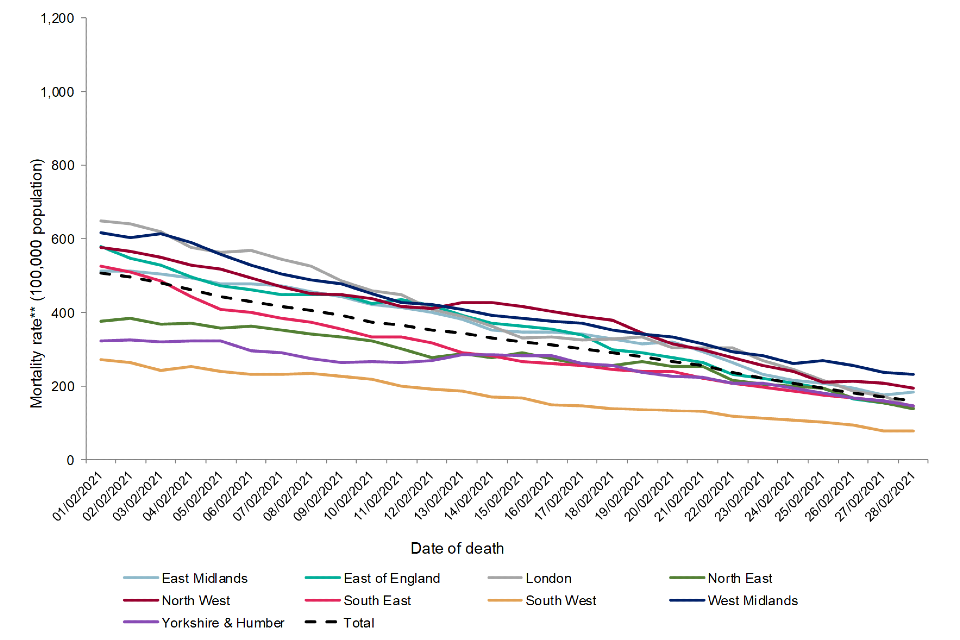
Figure 5b
*Data are presented from 1 February 2021 to 28 February 2021.
**Rates are annualised and expressed as the number of deaths per 100,000 population per year.
†Deaths within 60 days of a positive COVID-19 test or where COVID-19 is mentioned on the death certificate.
Figure 6.a. Age-adjusted annualised mortality rates** (per 100,000 population) in laboratory-confirmed cases of COVID-19 by upper-tier local authority, week 27 onwards*†
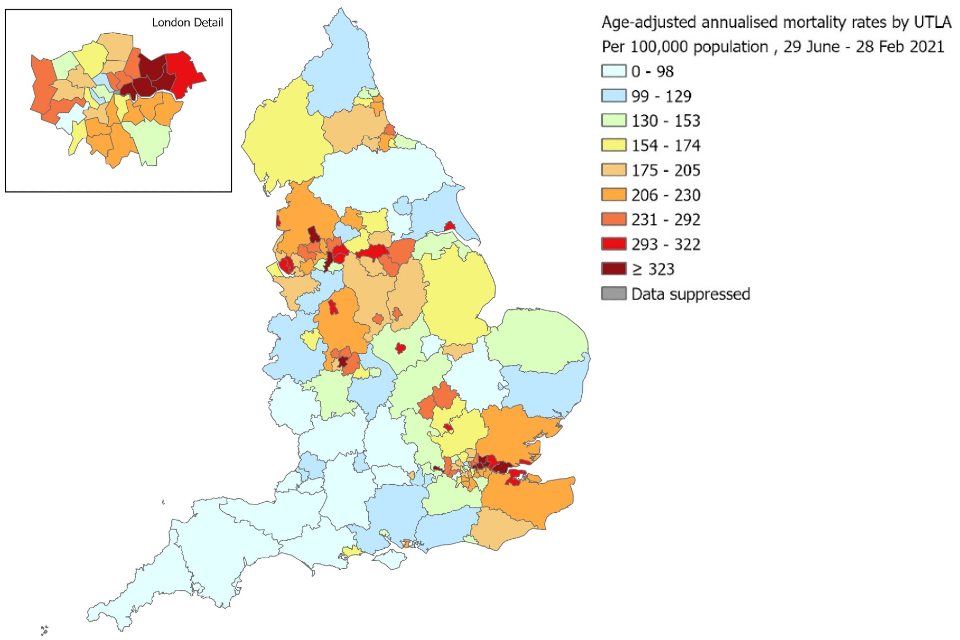
Figure 6a
*Data are presented from 29 June 2020 to 28 February 2021.
**Rates are annualised and expressed as the number of deaths per 100,000 population per year.
†Deaths within 60 days of a positive COVID-19 test or where COVID-19 is mentioned on the death certificate.
Figure 6.b. Age-adjusted annualised mortality rates** (per 100,000 population) in laboratory-confirmed cases of COVID-19, by upper-tier local authority, February 2021*†
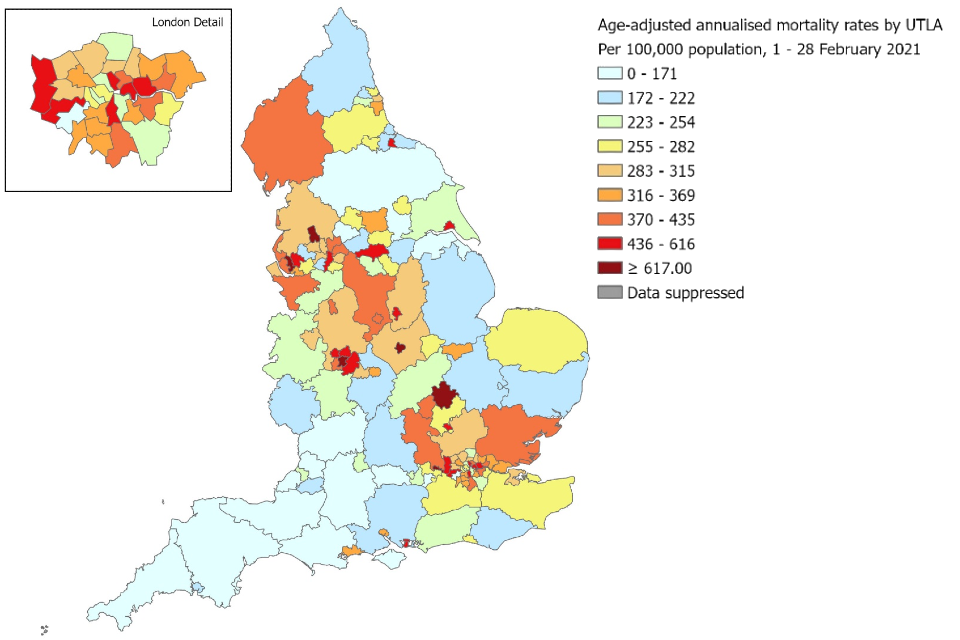
Figure 6b
*Data are presented from 1 February to 28 February 2021.
**Rates are annualised and expressed as the number of deaths per 100,000 population per year.
†Deaths within 60 days of a positive COVID-19 test or where COVID-19 is mentioned on the death certificate.
Figures 6a and 6b:
- contain Ordnance Survey data © Crown copyright and database right 2020
- contain National Statistics data © Crown copyright and database right 2020
Case fatality risk
Case fatality risk (CFR) describes the risk of death following a laboratory-confirmed positive COVID-19 test. For this report, CFR has been calculated within 60 days of an individual’s first positive specimen. CFR is reported on data from week 27 (29 June 2020) up to and including 3 January 2021. Cases diagnosed in the last 60 days were excluded from this analysis, due to incomplete follow-up period. Deaths are excluded from the CFR calculation if they cannot be linked to laboratory-confirmed COVID-19 case data.
CFR is sensitive to:
- changes in testing coverage and detection rate of COVID-19 infections (Dudel et al., 2020; Wu et al., 2020; Harman et al., 2021)
- changes in the demographics of the infected population
- changes in the effectiveness of treatment and the health system’s ability to care for severe COVID-19 cases
Table 7. Number of laboratory-confirmed cases, deaths and case fatality risk in laboratory-confirmed cases of COVID-19, from week 27 onwards*†
| Cases | Deaths† | Case fatality risk (%) | |
|---|---|---|---|
| Week 27 onward* | 2,182,094 | 46,835 | 2.1 |
*Data are presented from 29 June 2020 to 3 January 2020. Figures differ from Table 1 based on CFR calculation inclusion criteria.
†Deaths within 60 days of a positive COVID-19 test and linked to the confirmed COVID-19 case data.
Figure 7. Number of laboratory-confirmed cases, deaths and case fatality risk in laboratory-confirmed cases of COVID-19, from week 27 onwards*†
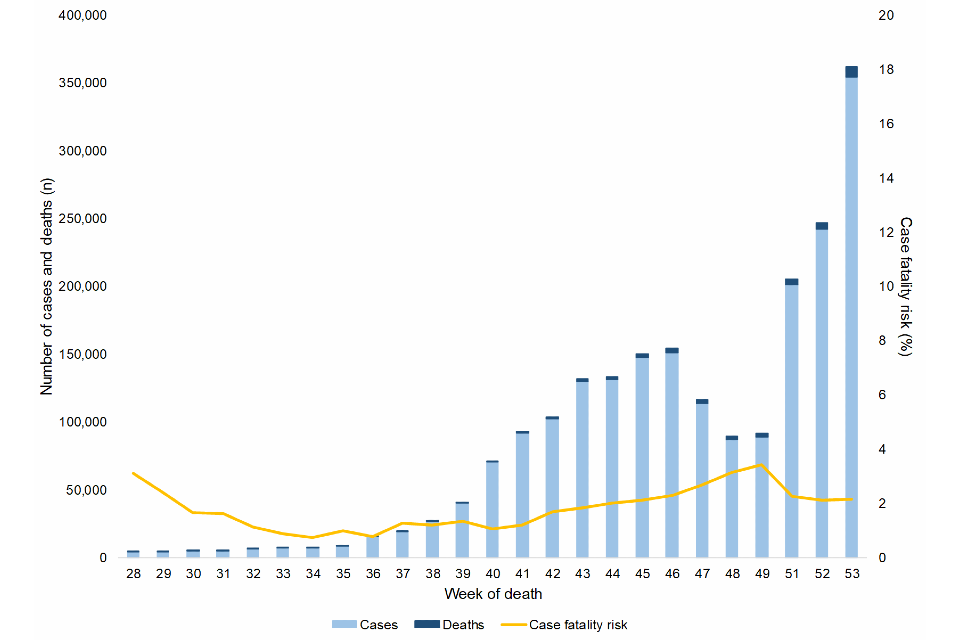
Figure 7
Note: The time period presented covers a period where there has been improved testing availability, therefore apparent changes in estimated case fatality should be interpreted with caution. Numbers of cases and deaths are stacked by week. Cases are presented by week of specimen date. Deaths are presented by week of death.
*Data from 29 June 2020 to 3 January 2021.
†Deaths within 60 days of a positive COVID-19 test and linked to the confirmed COVID-19 case data.
Place of death
This analysis describes the setting in which deaths in persons with laboratory-confirmed COVID-19 have occurred. The place of occurrence of each death has been determined using information provided from death registrations from ONS, supplemented by reports of hospital deaths by NHS trusts using the COVID-19 Patient Notification System.
Place of death has been classified into:
- hospital – deaths that have occurred in a hospital setting
- care home – deaths that have occurred within care homes, including:
- homes for the chronic sick
- nursing homes
- homes for people with mental health problems
- non-NHS multi-function sites
- home – deaths that have occurred at the usual residence of the deceased‚ where this is not a communal establishment
- other settings – deaths that have occurred in other communal establishments, including:
- hospices
- schools for people with learning disabilities
- holiday homes and hotels
- common lodging houses
- aged persons’ accommodation
- assessment centres
- schools
- convents and monasteries
Deaths among individuals with unknown place of death have not been presented in demographic breakdown figures but have been included in calculations of proportion of deaths by place of death.
In this section of the report, data is reported from 29 June 2020 (week 27) to 14 February 2021 (week 6) to account for reporting delay in death registrations.
Figure 8.a. Number of deaths in laboratory-confirmed cases of COVID-19 by place of death, from week 27 onwards*†
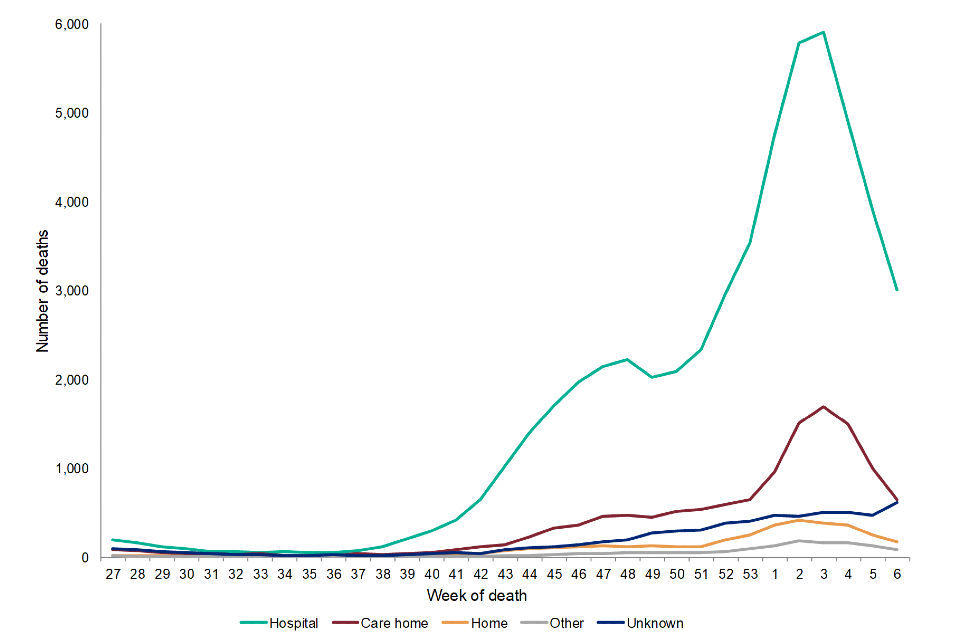
Figure 8a
*Data are presented from 29 June 2020 to 14 February 2021.
†Deaths within 60 days of a positive COVID-19 test or where COVID-19 is mentioned on the death certificate.
From week 27 onwards, the majority of deaths (54,350; 69.5%) have occurred in a hospital setting, with peaks in September 2020 and January 2021 (Figure 8.a.). 12,823 (16.4%) deaths occurred in a care home setting, with a peak in January 2021 (week 3). This corresponded with an increase in COVID-19 outbreaks observed in care home and increased pressures on NHS services. During the same period there were 3,619 deaths at home and 1,419 deaths in other settings.
In Figure 8.b., the proportion of deaths in each setting varied during Summer 2020 (week 27-week 36) when the total number of deaths were low. From September 2020 onward (week 37), the proportion of COVID-19 deaths in hospitals remained stable between 65-75%, and the proportion of deaths at home and in care homes were comparatively low.
Figure 8.b. Proportion of deaths in laboratory-confirmed cases of COVID-19 by place of death, from week 27 onwards*†
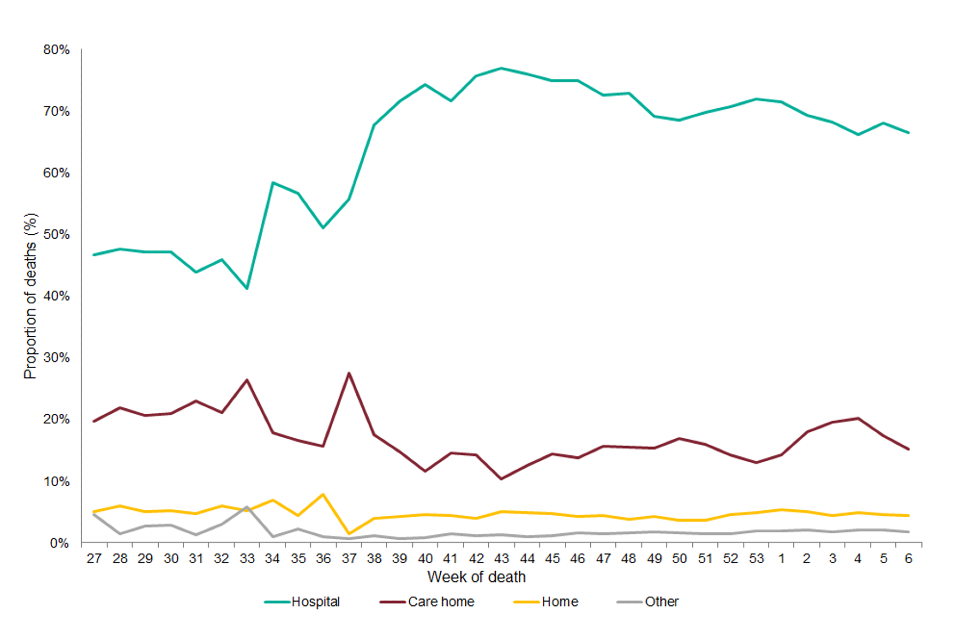
Figure 8b
*Data are presented from 29 June 2020 to 14 February 2021.
†Deaths within 60 days of a positive COVID-19 test or where COVID-19 is mentioned on the death certificate.
From week 27 onwards, the majority of deaths among both males and females have occurred in hospital. A higher proportion of care home deaths occurred in females compared to males (22.4% and 11.0%, respectively) (Table 8). Figure 9 shows that hospital was the most common setting of death across all age groups.
One in 9 (11.1%, 538/4,843) people aged under 60 died at home, and 1 in 4 (25.9%, 11,118/42,981) people aged 80 and over died in a care home.
Table 8. Proportion of deaths in laboratory-confirmed cases of COVID-19 by sex and place of death, from week 27 onwards*†
| Hospital | Care home | Home | Other | Unknown | Total (n) | |
|---|---|---|---|---|---|---|
| Female | 62.6% | 22.4% | 4.2% | 1.8% | 9.0% | 36,368 |
| Male | 75.5% | 11.0% | 4.8% | 1.8% | 6.8% | 41,735 |
*Data are presented from 29 June 2020 to 14 February 2021.
†Deaths within 60 days of a positive COVID-19 test or where COVID-19 is mentioned on the death certificate.
Figure 9. Proportion of deaths in laboratory-confirmed cases of COVID-19 by age group and place of death, from week 27 onwards*†
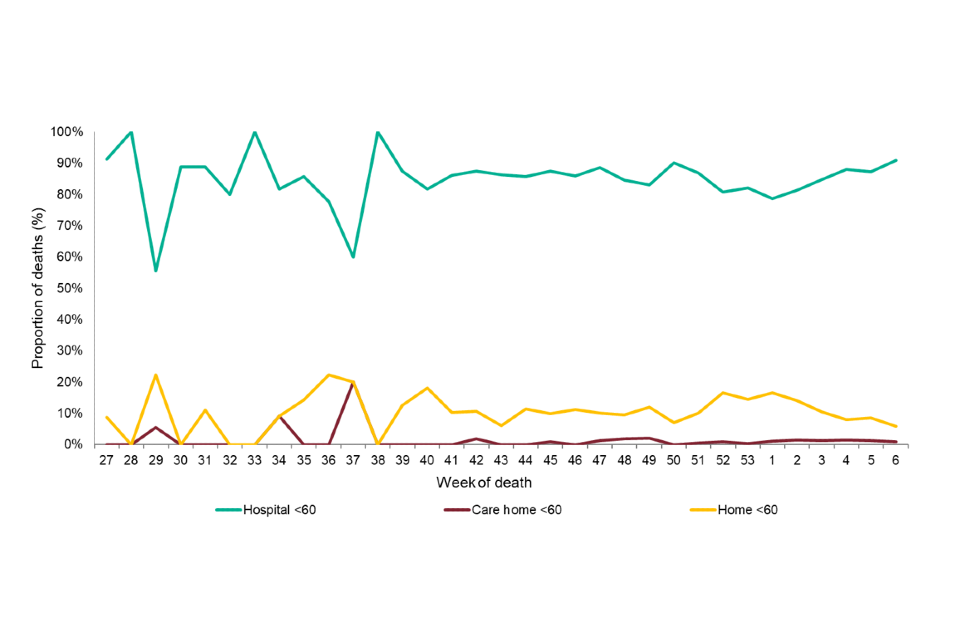
Figure 9-1
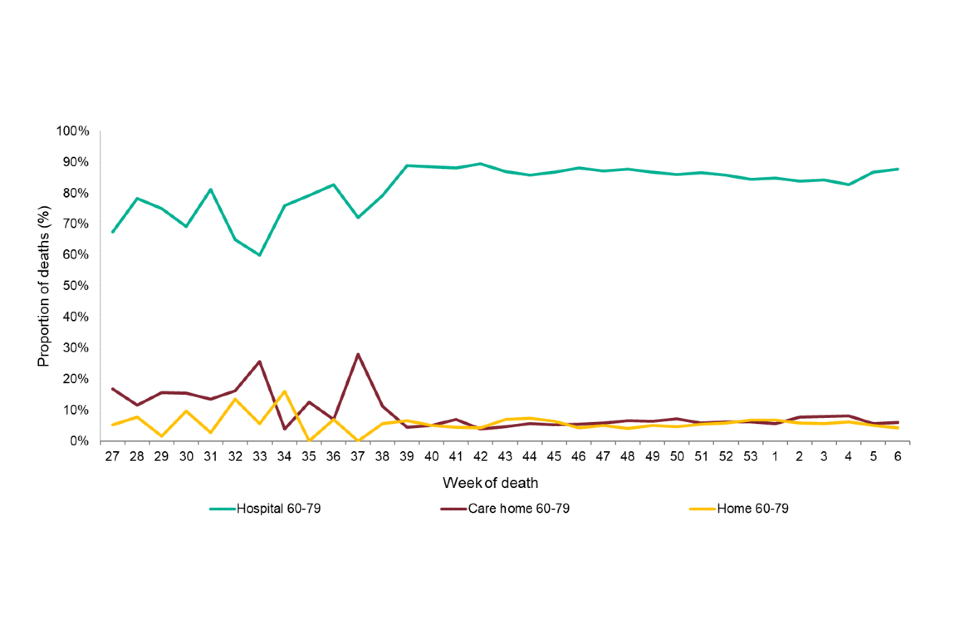
Figure 9-2
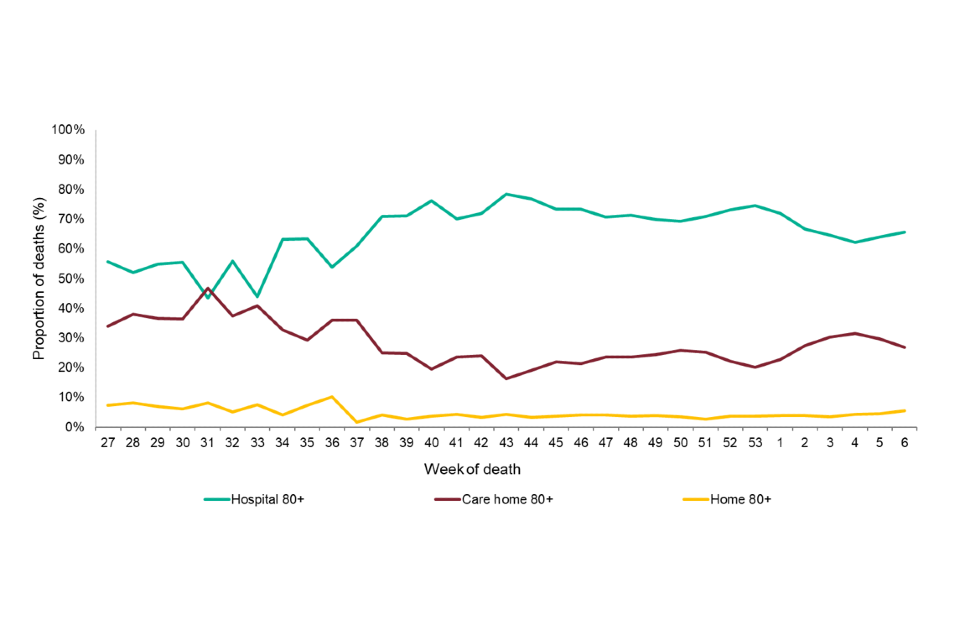
Figure 9-3
*Data are presented from 29 June 2020 to 14 February 2021.
†Deaths within 60 days of a positive COVID-19 test or where COVID-19 is mentioned on the death certificate.
From week 27 onwards, the proportion of deaths that occurred in hospital were highest among those of Asian or Asian British ethnic groups (85.1%), followed by those of Other ethnic groups (79.5%) and those of Black or Black British ethnic groups (78.2%). The highest proportion of care home deaths was seen among those of White or White British ethnic groups (18.2%) followed by those of Mixed ethnic groups (11.7%) the smallest proportion of care home deaths is seen among those of Other ethnic groups (6.9%).
Figure 10. Proportion of deaths in laboratory-confirmed cases of COVID-19 by ethnicity and place of death, from week 27 onwards*†
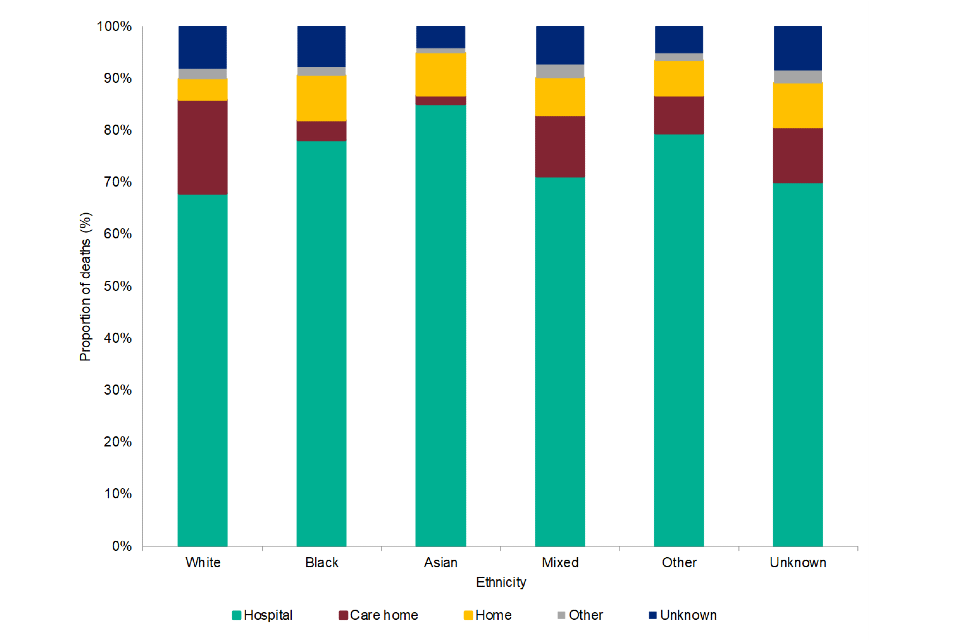
Figure 10
*Data are presented from 29 June 2020 to 14 February 2021.
†Deaths within 60 days of a positive COVID-19 test or where COVID-19 is mentioned on the death certificate.
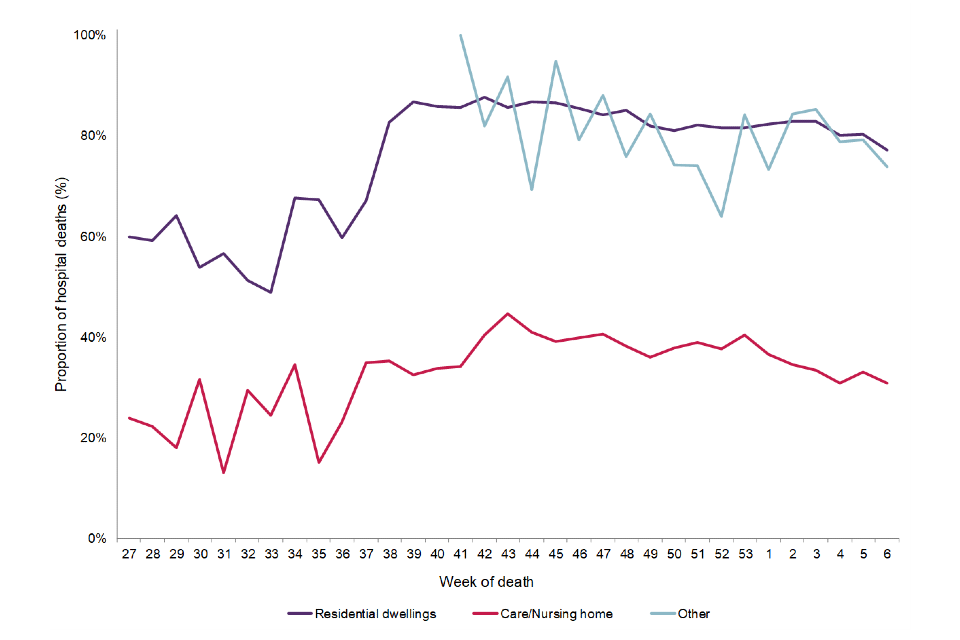
Residential property type categorisation was obtained though address matching against national reference databases (Ordnance Survey Address Base Premium) to assign a Unique Property Reference Number (UPRN). In this report, residential property type is categorised to: Residential dwelling, care/nursing home and other property classifications (including prisons, residential institutions, and homeless). Deaths without residential property categories have been included in the calculation of the proportion of deaths in hospital.
From week 27 onwards, among care home residents who died with COVID-19, 1 in 3 (35.3%) died in hospital and 2 in 3 (64.7%) died outside the hospital setting. In comparison, 81.7% of deaths in people who lived in residential dwellings occurred in hospital.
Figure 11. Proportion of deaths in hospital in laboratory-confirmed cases of COVID-19 by residential category and place of death, from week 27 onwards*†
*Data are presented from 29 June 2020 to 14 February 2021.
†Deaths within 60 days of a positive COVID-19 test or where COVID-19 is mentioned on the death certificate.
**Data prior to week 41 (5 October 2020) has been excluded for those classified as residing in Other residential categories due to small number of deaths, to minimise the risk of deductive disclosure.