Companies register activities 2017 to 2018
Published 28 June 2018

© Crown copyright 2018
This publication is licensed under the terms of the Open Government Licence v3.0 except where otherwise stated. To view this licence, visit nationalarchives.gov.uk/doc/open-government-licence/version/3 or write to the Information Policy Team, The National Archives, Kew, London TW9 4DU, or email: psi@nationalarchives.gov.uk.
Where we have identified any third party copyright information you will need to obtain permission from the copyright holders concerned.
This publication is available at https://www.gov.uk/government/statistics/companies-register-activities-statistical-release-2017-to-2018/companies-register-activities-2017-to-2018
Introduction
This release provides information about the population of companies and corporate bodies in the United Kingdom. Companies and corporate bodies are specific legal forms of business that are registered at Companies House. Companies form a subset of corporate bodies and are formed under the Companies Act 2006. Companies and corporate bodies are registered at Companies House regardless of whether they go on to trade actively.
Full definitions of both companies covered by the Companies Act 2006 and corporate bodies are provided in the separate Companies House official statistics: definitions to accompany statistical releases document. This document also explains the incorporation, dissolution and restoration processes.
This release complements the quarterly Incorporated Companies in the UK release by providing information on both companies to which the Companies Act 2006 relates, and on wider corporate body types. Sections 2-4 of the release focus specifically on companies, while sections 5 and 6 cover all corporate body types. Some figures in this release may differ to those provided in the quarterly Incorporated Companies in the UK publications due to the timing of the analysis. Analyses for the figures in this release are undertaken later in the year, allowing more information to be processed and added to the register.
The statistics in this release include the total number of incorporated companies, newly incorporated companies, and the number of companies that were dissolved. The release focusses on the headline messages for the United Kingdom: figures for the constituent countries are contained in the supplementary tables that accompany the release.
Key points
-
There were 620,285 company incorporations in the 12 months to March 2018. This is a decrease of 3.8% when comparing with the 12 months to March 2017 and is the first time there has been a decrease in company incorporations since 2008/09. However, compared with the 12 months to March 2016, there was an increase of 1.5%.
-
In the same period, there were 490,738 dissolutions in the UK. This increased by 12.4% when comparing with the 12 months to March 2017. This is the first time there has been such an increase in dissolutions since the register became the UK companies register in 2009.
-
The number of companies on the register at the end of the period surpassed four million for the first time, reaching 4,033,355. This is an increase of 3.5% when comparing with the end of March 2017. This is the slowest growth rate since 2008/09 to 2009/10.
-
The average age of a company on the total register at the end of March 2018 was 8.5 years, an increase of 0.2 years when comparing with the end of March 2017. Although the average age of a company has always been relatively young, it has gradually declined from 10.7 years since the year 2000.
-
Since 2004, private limited companies have consistently accounted for over 96% of all corporate body types. During this time, the three corporate bodies accounting for the highest proportion of all corporate bodies remained unchanged, being private limited companies, limited liability partnerships (LLPs) and limited partnerships. These three corporate body types consistently accounted for around 98% of all corporate body types.
-
At the end of March 2018, the number of overseas corporate bodies on the register with a physical presence in the UK reached 11,503. Corporate bodies incorporated in the USA accounted for around 22%.
Incorporated companies
During 2017/18, there were 620,285 incorporations and 490,738 dissolutions. The total register size – including those in the process of dissolution and liquidation (263,333) - at the end of March 2018 reached 4,033,355. This was the first time the total register size exceeded four million, a 3.5% increase compared with the end of March 2017. The effective register size for the UK stood at 3,770,022 at the end of March 2018, which is a 3.3% increase when compared with the end of March 2017.
The number of incorporations in 2017/18 decreased by 3.8% compared with the 2016/17. Between 2016/17 and 2017/18, there were decreases in the number of incorporations across all the constituent countries, although larger decreases were seen in England and Wales (3.9%) and Northern Ireland (4.7%) compared with Scotland (0.6%). This is the first time that the number of incorporations have decreased since 2008/09.
From 2012/13 to 2016/17, the total and effective register growth was steady, ranging from 6% to 8%. However, this growth has significantly decreased between 2016/17 and 2017/18, dropping to just 3.5% for the total register and 3.3% for the effective register. When accounting for the peak in incorporations in 2016/17, the growth rate between 2015/16 and 2017/18 has slowed. The growth rate averaged at 4.8% between 2015/16 and 2017/18. This is due to the increase in dissolutions over the same period.
Figure 1: Total register size of each registry, 31 March 2018
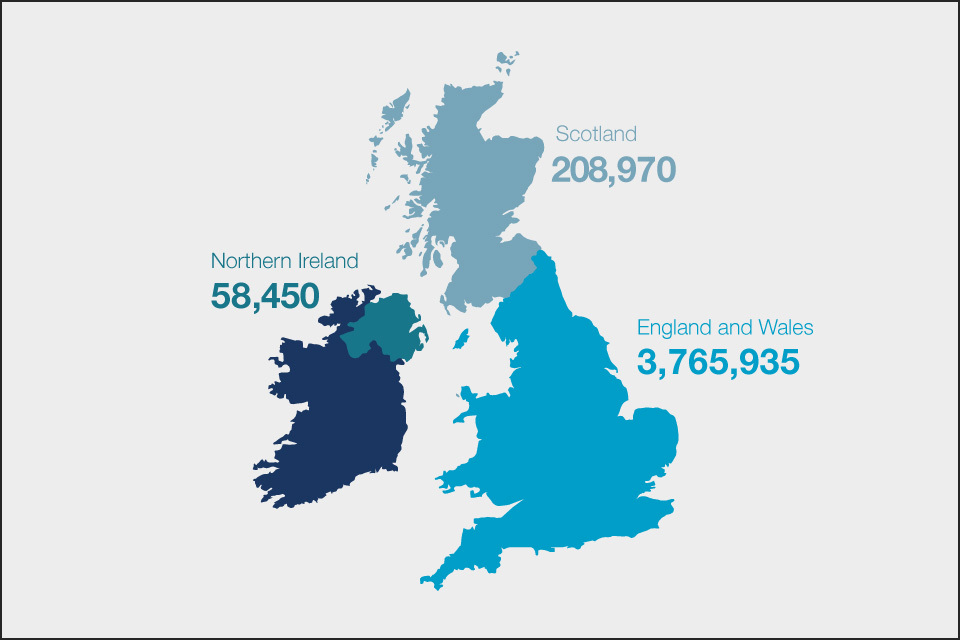
Total register size of each registry, 31 March 2018 [Source: Companies Register Activities 2017/18, Companies House]
A full breakdown of figures for England and Wales, Scotland, Northern Ireland and the UK as a whole is provided in Table A1 in the Excel workbook that accompanies this release. Figures are provided for the years 2012-13 through to 2017-18. Separate figures for private companies and public limited companies are provided in Tables A2 and A3 respectively.
The growth in the register size over time
Between 1979 and 2018, the total register has increased by 3.2 million companies whilst the effective register has increased by 3.0 million companies[footnote 1] [footnote 2].
During this time, the total register has seen 35 annual increases, whilst the effective register has increased 33 times over the same period. The most recent declines in the Great Britain effective register occurred in 2008/09, with a decrease of 157,700 companies. The UK total register declined a year later in 2009/10, with a decrease of 88,300 companies.
In the late 2000s, it was anticipated that the register size would increase due to the introduction of Northern Ireland companies to the UK register. However, this may have been offset by the global financial crisis at a similar period to lead to a slight decrease in the register size overall.
During the period 2009 to 2010 there were also several significant changes to the register:
- The Northern Ireland register was included to create a UK register, as mentioned above;
- There was a change in the administrative system that forms the register;
- There was a purge on the register to remove defunct companies that had spent an extended period in the process of dissolution or liquidation;
- Legislative changes were introduced under the Companies Act 2006, which reduced the time taken to dissolve companies and remove them from the register.
These changes in combination are likely to have contributed to a sharp increase in the number of dissolutions between 2009 and 2010. This may in turn have had an impact on the sizes of the total and effective registers overall.
Since 2010/11, both registers have continued to increase in size in a steady fashion, albeit at a slower rate in recent years.
Chart 1: Total and effective register sizes, 1979-2018, UK
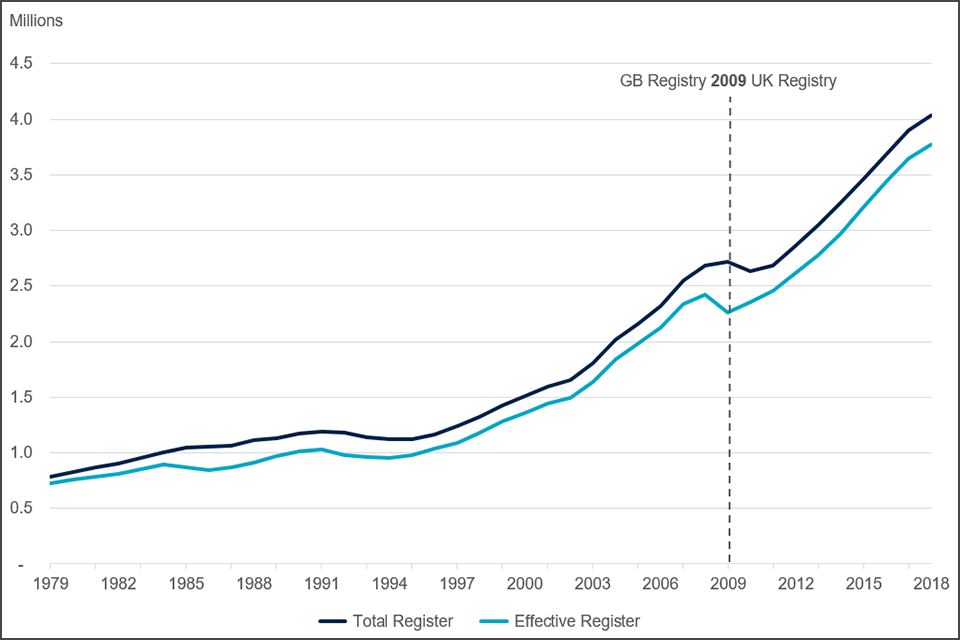
Total and effective register sizes, 1979-2018, UK [Source: Companies Register Activities 2017/18, Companies House]
Despite fluctuations in the data, the number of incorporations and dissolutions have increased over time. The number of incorporations has increased by 553,785 between 1979 and 2017/18, whilst the number of dissolutions has increased by 465,066 over the same period.
The number of incorporations peaked in 2016/17. Although the number of incorporations decreased this year for the first time since 2008/09, there was still an increase of 1.5% when comparing 2017/18 with 2015/16. The increase in incorporations between 2015/16 and 2017/18 was higher in Scotland (5.3%) and England and Wales (1.3%) compared with Northern Ireland (0.6%). Over the last five years, the number of incorporations has increased by 28.5%.
The number of dissolutions in the period 2017/18 increased by 12.4% compared with 2016/17. This was mainly driven by an increase in the number of dissolutions in England and Wales (13.2%) and Scotland (1.6%) offset by a decrease in the number of dissolutions in Northern Ireland (2.7%). This has been the highest increase in the number of dissolutions since 2009.
Chart 2: Incorporations and dissolutions, 1979-2018, UK
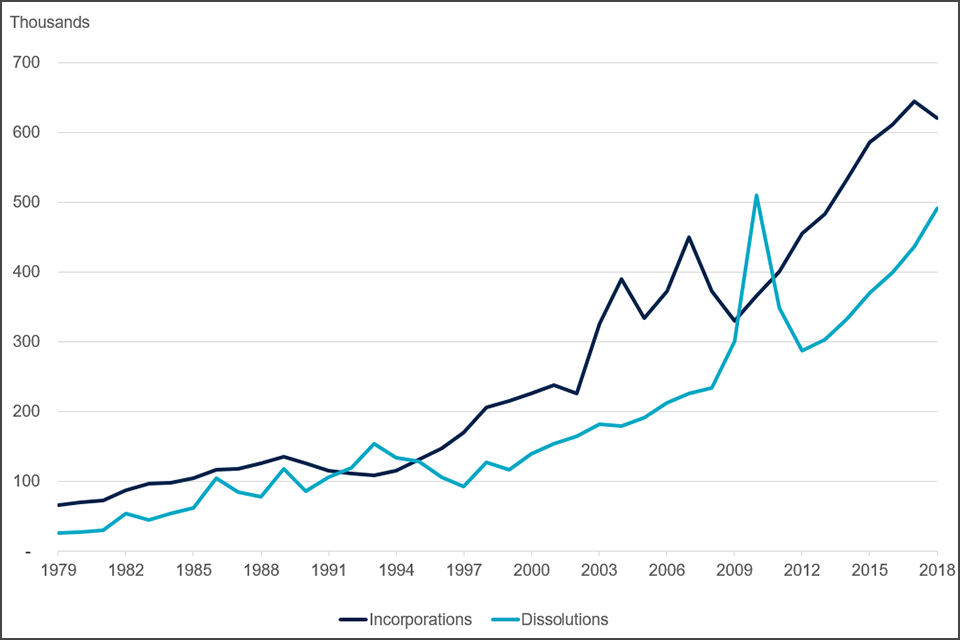
Incorporations and dissolutions, 1979-2018, UK [Source: Companies Register Activities 2017/18, Companies House]
Table A8, in the workbook that accompanies this publication, shows the total and effective register sizes from 1939 to 2017/18, as well as the annual number of incorporations, dissolutions, liquidations and insolvencies.
Age of companies on the register
The average age of UK companies on the total register in 2017/2018 was 8.5 years. For both the total and effective registers, just under half (49.3%) of companies were aged under 5 years, over two-thirds (70.6%) were aged under 10 years and only one-tenth (10.2% and 10.1% respectively) were over 20 years old.
Chart 3: Age profile of companies on the total register, 2018, UK
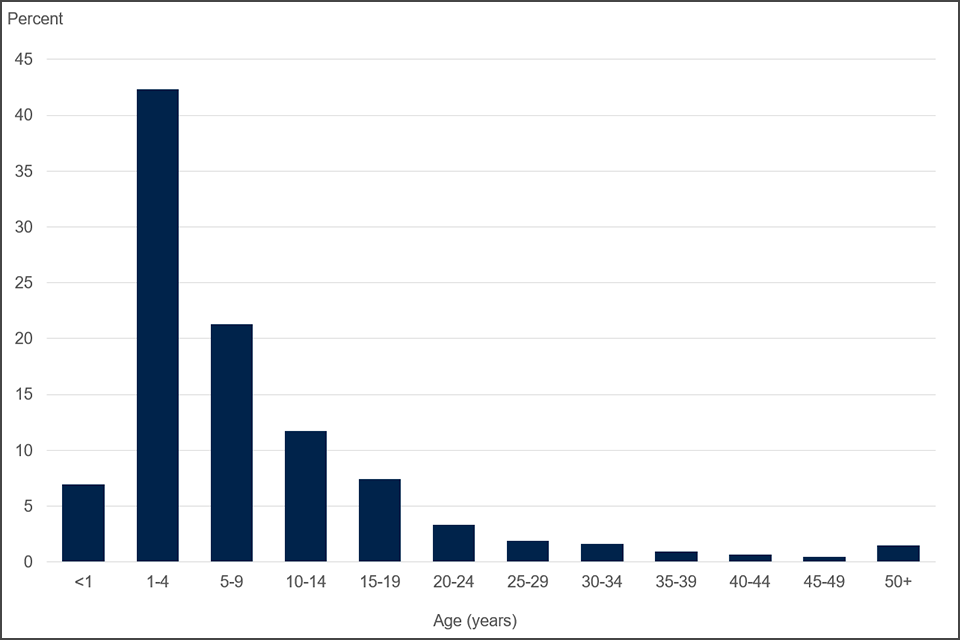
Age profile of companies on the total register, 2018, UK [Source: Companies Register Activities 2017/18, Companies House]
Historically, the average age of companies has always been relatively young, but it has gradually declined from 10.7 years in 2000 to 8.5 years in 2018. Between 2008/09 and 2010/11 the average age of companies fluctuated, corresponding with fluctuations in the numbers of incorporations and dissolutions, and declines in the overall register size.
Since 2000/01, the steady decline in the average age of companies could be due to the general increasing trend we have seen in the number of incorporations and dissolutions. It is likely that the increasing number of incorporations has led to a greater number of younger companies on the register, which has served to lower the average age of companies overall. It seems that the register is increasingly characterised by young companies: the average age of dissolved and closed companies has declined from 5.7 years in 2012/13 to 4.8 years in 2017/18. The slight increase in average age in 2017/18 (and for the first time since 2009/10) could be due to the decrease of incorporations in the same year.
Chart 4: Average age of companies on the total register, 2000-2018, UK

Average age of companies on the total register, 2000-2018, UK [Source: Companies Register Activities 2017/18, Companies House]
Table A5, in the workbook that accompanies this release, shows the age profile of companies on the total and effective registers at 31 March 2018, as well as those in liquidation or the course of dissolution. The table also shows the average age of companies from 2000/01 to 2017/18. Table A11 shows the average age of dissolved and closed companies from 2012/13 to 2017/18, while Table C3 shows average ages at closure and dissolution across all corporate body types.
Types of corporate body on the register
There are over 23 types of corporate body held on the register. These include a number of corporate body types in addition to those companies covered by the Companies Act 2006. Each corporate body type has its own requirements to provide information to Companies House, as outlined in various pieces of legislation and royal acts. Further information on the different company types can be found on the Companies House pages of the gov.uk website.
Since 2004, private limited companies have consistently accounted for over 96% of all corporate body types on the register. During this time, the top three corporate body types were private limited companies, limited liability partnerships and limited partnerships, collectively accounting for over 98% of all corporate body types each year.
Table 1: Breakdown of corporate body types on the total register, 2017/18, UK
| Corporate body type | Number | Percentage of all corporate bodies |
|---|---|---|
| Private Limited | 3,874,968 | 92.7 |
| Private Limited by Guarantee/No Share Capital | 105,092 | 2.5 |
| Limited Liability Partnership (LLPs) | 53,848 | 1.3 |
| Limited Partnership | 49,287 | 1.2 |
| Private Limited by Guarantee/No Share Capital/ (Use of Limited Exemption) | 42,174 | 1.0 |
| Charitable Incorporated Organisation (CIO) | 13,682 | 0.3 |
| Overseas Company | 11,941 | 0.3 |
| Industrial and Provident Society | 9,697 | 0.2 |
| Public Limited Company | 6,756 | 0.2 |
| Private Unlimited | 4,374 | 0.1 |
| Scottish Charitable Incorporated Organisation | 3,310 | 0.1 |
| Other Company Types | 4,770 | 0.1 |
| Total | 4,179,899 | 100.0 |
| Source: Companies Register Activities 2017/18, Companies House |
Although the composition of the register overall has remained stable, there have been some minor fluctuations within the individual company types:
- Charitable Incorporated Organisations (CIOs) were introduced in late 2017. The Charity Commission allowed charitable companies to convert to CIOs. This is an incorporated structure designed for charities and needs to be registered with the Charity Commission. For the financial year of 2017/18, there were 13,682 CIOs in England, Wales and Northern Ireland (0.3% of all corporate bodies) and 3,310 Scottish CIOs (0.1% of all corporate bodies).
- Limited liability partnerships (LLPs) were introduced in 2001. They gradually increased in number to make up 1.8% of the register in the years 2012-2014. The proportion of LLPs has since gradually declined, and they now account for 1.3% of the register.
- Limited partnerships have grown from 0.5% of the register at the end of 2004 to 1.2% at the end of March 2018. This has been primarily due to large increases in the numbers of limited partnerships in Scotland between 2012 and 2013.
- Public limited companies have been declining in number since 2008. They now make up only 0.2% of the register overall.
Although these changes are small, they show the subtle ways in which the composition of the register is changing outside of private limited companies.
Table C1, in the workbook that accompanies this publication, displays numbers and percentages of all corporate body types on the register from 2004 to 2018. Further information on public limited companies, limited partnerships and limited liability partnerships is available in tables A3, B2 and B4 respectively.
Overseas corporate bodies with a physical presence in the UK
At the end of March 2018, there were 11,503 overseas corporate bodies on the total register. Overseas corporate bodies are incorporated outside of the UK but have a physical presence in the UK (such as a place of business or branch) through which they carry out their business. Since 2013/14, the number of overseas corporate bodies on the total register has increased by 1,085.
Corporate bodies incorporated in the USA accounted for 2,511 (21.8%) of all overseas companies, with the Republic of Ireland, the second highest originating country, accounting for just 964 (8.4%). Last year, the top 10 countries changed. This year the makeup of the top 10 countries returned to contain those that created the top 10 between 2014 and 2016. These 10 countries accounted for 63.5% of all overseas corporate bodies on the total register at the end of March 2018.
Figure 2: Top 10 originating countries for overseas corporate bodies, 31 March 2018
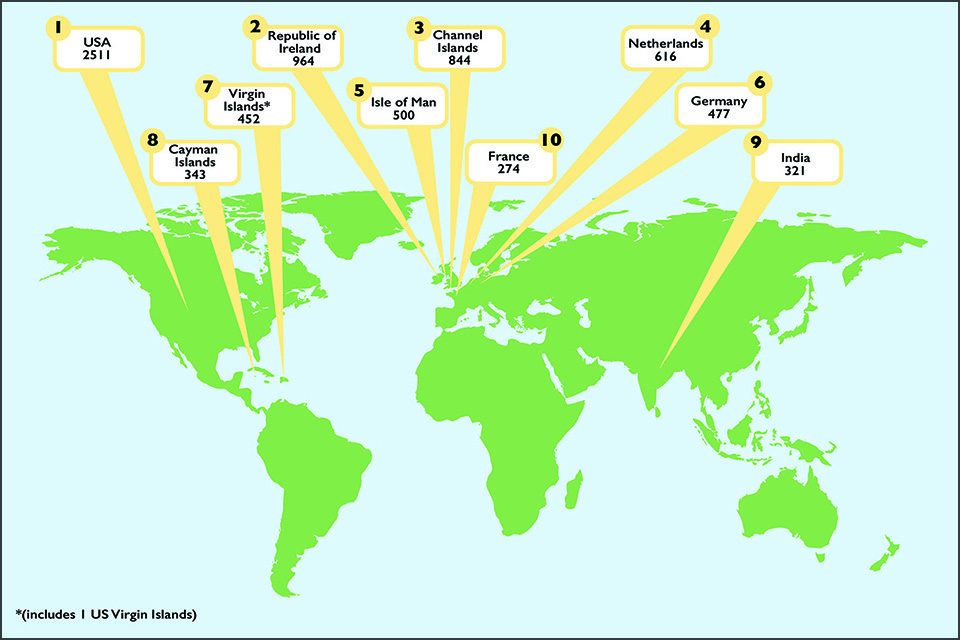
Top 10 originating countries for overseas corporate bodies, 31 March 2018 [Source: Companies Register Activities 2017/18, Companies House]
There were 807 new incorporations for overseas corporate bodies in 2017/18. Of these,127 (15.7%) originated in the Channel Islands, 95 (11.8%) in the USA and 86 (10.7%) in the Republic of Ireland. These three countries have consistently had the highest numbers of new incorporations since 2013/14.
Table 2: Registrations of corporate bodies incorporated outside the United Kingdom in 2017/18 – top 10 originating countries
| Country of incorporation | New incorporations | Percentage of all incorporations |
|---|---|---|
| Channel Islands | 127 | 15.7 |
| USA | 95 | 11.8 |
| Republic of Ireland | 86 | 10.7 |
| Virgin Islands (includes 1 US Virgin Islands) | 64 | 7.9 |
| Netherlands | 42 | 5.2 |
| Germany | 31 | 3.8 |
| Cayman Islands | 30 | 3.7 |
| Isle of Man | 22 | 2.7 |
| Luxembourg | 18 | 2.2 |
| France | 17 | 2.1 |
| Total | 532 | 65.9 |
| Source: Companies Register Activities 2017/18, Companies House |
Full figures on registrations of corporate bodies incorporated outside the United Kingdom from 2013/14 to 2017/18, as well as numbers on the register at 31 March 2018, are provided in table B1.
Other statistics in this release
A range of other statistics are included in the tables that accompany this release, including:
- analysis of companies on the register by period of incorporation
- removals of companies from the register
- other corporate bodies administered at Companies House, including limited partnerships and limited liability partnerships
A range of management information tables are due to be published later in the summer, providing the following information:
- civil penalties for late filing of annual accounts
- disqualification orders notified to the Secretary of State in the United Kingdom
- prosecutions by the department under the Companies Act 2006
- number of documents filed at Companies House
- annual accounts registered at Companies House by accounts type
Background notes
This section provides a range of information designed to provide the user with more information about the statistics.
Definitions
A separate document is available providing definitions for the main terms used in Companies House official statistics publications.
Quality
Information relating to the quality of the statistics is provided in a separate quality document. This document provides information on the quality of Companies House’s official statistics, to enable users to judge whether or not the data are of sufficient quality for their intended use. The information is structured in terms of the quality dimensions of the European Statistical System. The document also provides information on how these statistics relate to selected other business statistics.
Coverage
This release provides information on the size of the company population and the changes that have occurred within the year. The release includes statistics for the United Kingdom, England and Wales, Northern Ireland, and Scotland. The statistics cover companies and corporate bodies, both of which are specific legal forms of businesses that are registered at Companies House. They do not include information on sole proprietorship businesses, partnerships, and charities.
Use and users
Companies House statistics are used extensively by government, the public, public bodies and businesses. For example, they are used by:
- government in understanding the likely impact of policy changes and monitoring the impact of economic changes on companies
- businesses in understanding their market share and planning marketing strategies
- banks in developing an understanding of their customer base
- foreign firms in making UK location decisions
- academics to inform research into businesses at local and national level
- a range of public bodies in decision making and evaluating business-related policies
Revisions to these statistics
Revisions to these statistics will be mainly due to changes in methodologies and source data. The statistics are derived from administrative data, and changes to the underlying methods will cause revisions. These include changes in statistical methods, definitions, classifications, and geographic coverage.
Although Companies House has robust procedures in place to minimise errors in the methods used to create these statistics, errors may occasionally occur. If errors are found after the publication, their impact will be assessed. If the changes are significant, a corrigendum will be issued as soon as possible. Minor corrections will be included in the next planned release.
Any misleading or incorrect figures will be amended and a footnote added to indicate that the figures have been corrected. The nature and reason for the correction will be explained.
Date of next release
Statistics for the 12 months to 31 March 2019 will be published in summer 2019. The publication date will be announced on the gov.uk release calendar.
-
Statistics for 1979 to 2008 are for Great Britain. In October 2009, the Northern Ireland register merged with the register for Great Britain to create a UK register. Figures from 2009/10 onwards are for the UK as a whole. ↩
-
Figures for 1979 to 1986 are for the calendar year 1 January to 31 December. Those for 1986/87 to 2016/17 are for the financial year 1 April to 31 March. ↩