Companies register activities 2016 / 2017
Updated 24 July 2017

© Crown copyright 2017
This publication is licensed under the terms of the Open Government Licence v3.0 except where otherwise stated. To view this licence, visit nationalarchives.gov.uk/doc/open-government-licence/version/3 or write to the Information Policy Team, The National Archives, Kew, London TW9 4DU, or email: psi@nationalarchives.gov.uk.
Where we have identified any third party copyright information you will need to obtain permission from the copyright holders concerned.
This publication is available at https://www.gov.uk/government/statistics/companies-register-activities-statistical-release-20162017/companies-register-activities-2016-2017
1. Introduction
This release provides information about the population of companies and corporate bodies in the United Kingdom. Companies and corporate bodies are specific legal forms of business that are registered at Companies House. Companies form a subset of corporate bodies and are formed under the Companies Act 2006. Companies and corporate bodies are registered at Companies House regardless of whether they go on to trade actively.
Full definitions of both companies covered by the Companies Act 2006 and corporate bodies are provided in the separate Companies House official statistics: definitions document. This document also explains the incorporation, dissolution and restoration processes.
This release complements the quarterly Incorporated Companies in the UK release by providing information on both companies to which the Companies Act 2006 relates, and on wider corporate body types. Sections 2-4 of the release focus specifically on companies, while sections 5 and 6 cover all corporate body types. Some figures in this release may differ to those provided in the quarterly Incorporated Companies in the UK publications due to the timing of the analysis. Analyses for the figures in this release are undertaken later in the year, allowing more information to be processed and added to the register.
The statistics in this release include the total number of incorporated companies, newly incorporated companies, and the number of companies that were dissolved. The release focusses on the headline messages for the United Kingdom: figures for the constituent countries are contained in the supplementary tables that accompany the release.
1.1 Key points
- In the United Kingdom in the 12 months to 31 March 2017, there were 644,750 company incorporations and 436,526 dissolutions. The number of companies on the total register at the end of the period reached 3,896,755. This was an increase of 5.9% compared with the end of March 2016.
- The average age of companies on the total register in 2016/2017 was 8.3 years. The average age of companies on the register has historically been relatively young, but it has declined gradually from 10.7 years in 2000.
- Since 2007, private limited companies have consistently accounted for over 96% of all corporate body types. During this time, the top 3 corporate body types of private limited companies, limited liability partnerships (LLPs), and limited partnerships have remained unchanged, accounting each year for around 99% of all corporate bodies.
- At the end of March 2017, there were 11,291 overseas corporate bodies on the register with a physical presence in the UK. Corporate bodies incorporated in the USA accounted for 22% of all overseas companies.
2. Incorporated companies
In the United Kingdom in the 12 months to the end of March 2017, there were 644,750 company incorporations and 436,526 dissolutions. At the end of the period, the number of companies on the total register – including those in the process of dissolution or liquidation (248,277) – reached 3,896,755.
This was an increase of 217,895 companies (5.9%) compared with the end of March 2016. This change was largely driven by an increase of 206,304 companies in England and Wales, with changes in Northern Ireland and Scotland between them adding 11,591 companies.
The effective register, which excludes companies in the process of liquidation or dissolution, stood at 3,648,478 at the end of March 2017, an increase of 214,698 companies (6.3%) since the same date in 2016. Private companies dominated the register, accounting for 99.8% of all companies on the effective register at the end of the period.
Figure 1: Total register size of each registry, 31 March 2017
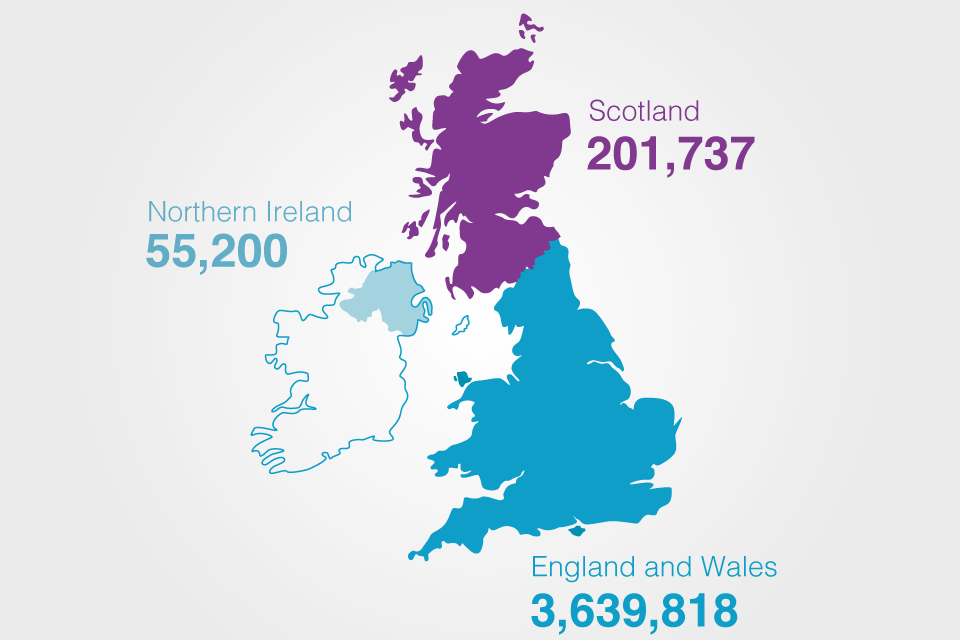
Total register size of each registry 31 March 2017
Source: Companies Register Activities 2016/17, Companies House
A full breakdown of figures for England and Wales, Scotland, Northern Ireland and the UK as a whole is provided in Table A1 in the Excel workbook that accompanies this release. Figures are provided for the years 2012-13 through to 2016-17. Separate figures for private companies and public limited companies are provided in Tables A2 and A3 respectively.
3. The growth in incorporated companies
Between 1979 and 2017 the total register for the United Kingdom increased by just over 3.1 million companies, while the effective register increased by just over 2.9 million companies [footnote 1][footnote 2].
Over this time, the total register has increased annually for 34 of the 38 years, while the effective register has increased for 32 of the 38 years. The most recent declines in the Great Britain effective register occurred in 2008/09, with a decrease of 157,700 companies; the UK total register declined a year later in 2009/10, with a decrease of 88,300 companies. These coincided with the global financial crisis in the late 2000s. Since 2010/11 both registers have continued to increase in size in a steady fashion.
Chart 1: Total and effective register sizes, 1979-2017, UK
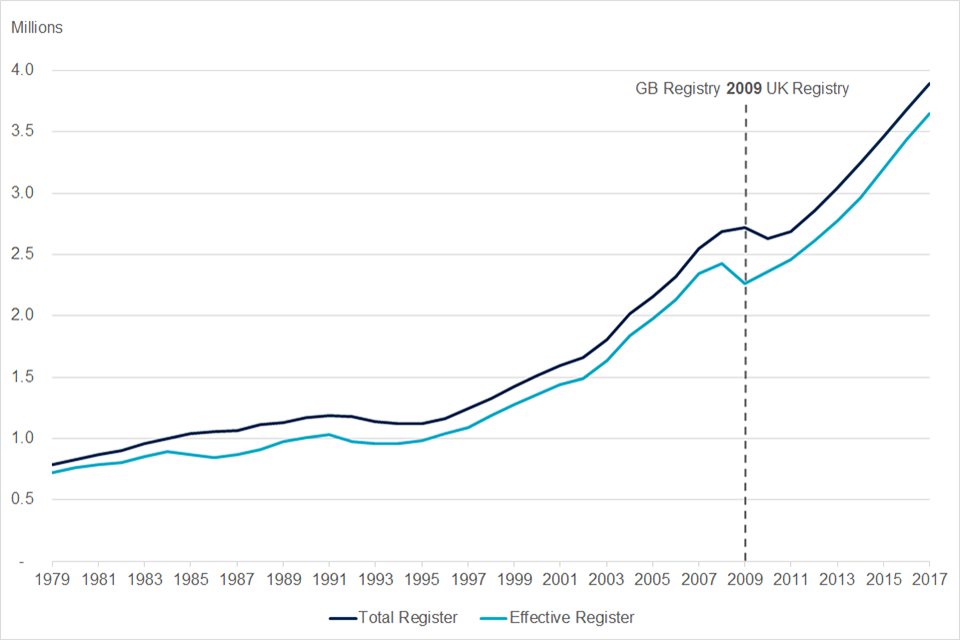
Total and effective register sizes 1979-2017 UK
Source: Companies Register Activities 2016/17, Companies House
Despite some annual fluctuations, the numbers of incorporations and dissolutions have also increased over time: incorporations have increased from 66,500 in 1979 to 644,750 in 2016/17 and dissolutions have increased from 25,700 to 436,526. As with the overall register, both incorporations and dissolutions have increased in a consistent manner over the last 5 years.
Chart 2: Incorporations and dissolutions, 1979-2017, UK
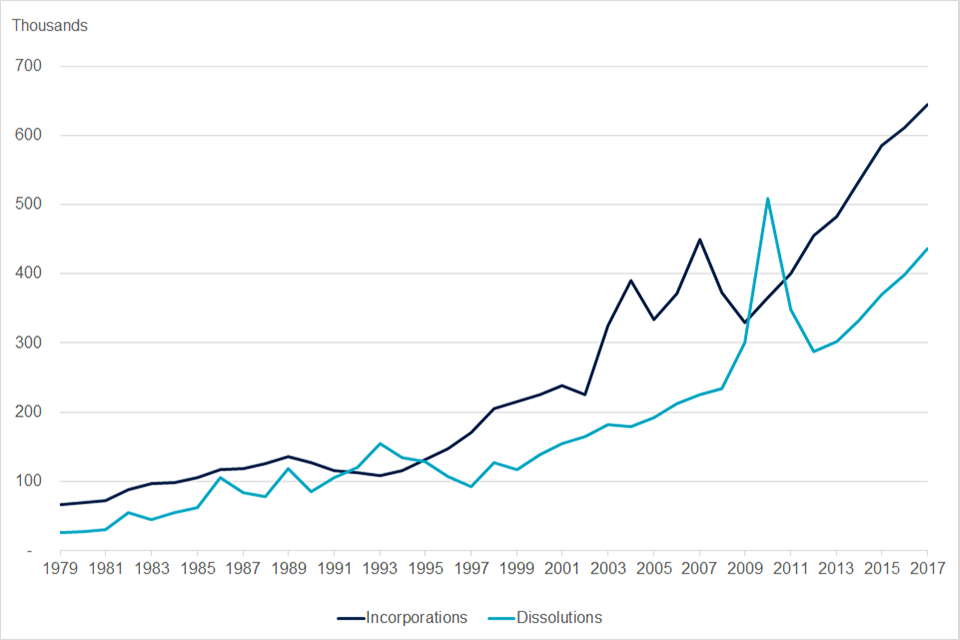
Incorporations and dissolutions 1979-2017 UK
Source: Companies Register Activities 2016/17, Companies House
During the period 2009 to 2010 there were a number of significant changes to the register:
- The Northern Ireland register was included to create a UK register.
- There was a change in the administrative system that forms the register.
- There was a purge on the register to remove defunct companies that had spent an extended period in the process of dissolution or liquidation.
- Legislative changes were introduced under the Companies Act 2006, which reduced the time taken to dissolve companies and remove them from the register.
These changes in combination are likely to have contributed to the sharp increase in the number of dissolutions between 2009 and 2010. They may also have had an impact on both the numbers of incorporations, and on the sizes of the total and effective registers.
Table A8, in the workbook that accompanies this publication, shows the total and effective register sizes from 1939 to 2016/17, as well as the annual number of incorporations, dissolutions, liquidations and insolvencies.
4. Age of companies on the register
The average age of UK companies on the total register in 2016/2017 was 8.3 years. Over half (50.5%) of companies were aged less than 5 years and just over two thirds (70.8%) were aged less than 10 years. Only one-tenth (10.1%) of companies were aged 20 years or above. The age profile of companies differed very little between the total and effective registers.
Chart 3: Age profile of companies on the total register, 2017, UK
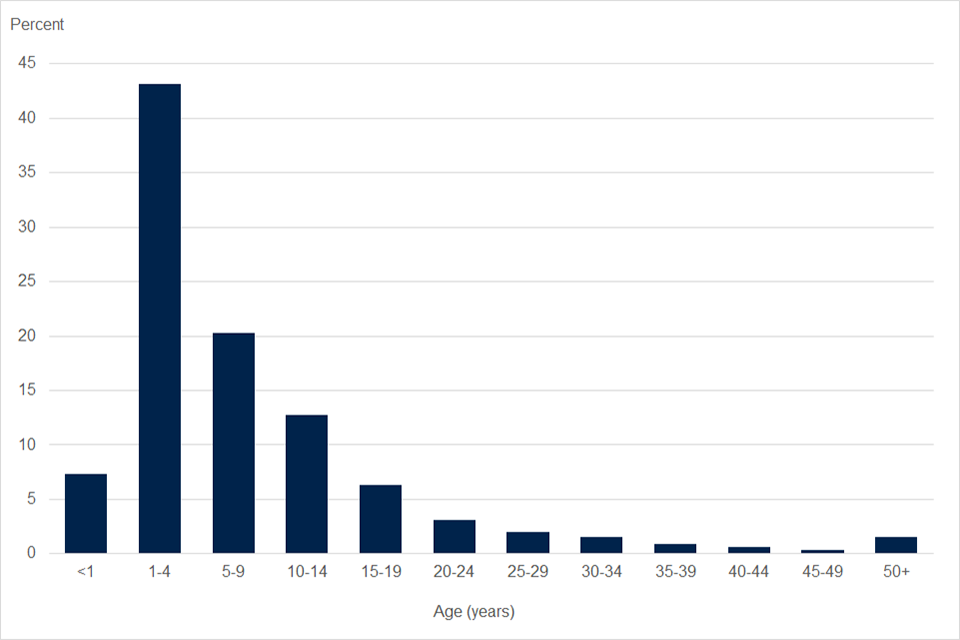
Age profile of companies on the total register 2017 UK
Source: Companies Register Activities 2016/17, Companies House
Historically, the average age of companies has always been relatively young, but it has gradually declined from 10.7 years in 2000 to 8.4 years in 2016. Between 2008 and 2010 the average age of companies fluctuated, corresponding with fluctuations in the numbers of incorporations and dissolutions, and declines in the overall register size.
There has been a consistent steady decline in the average age since that time, which corresponds with the increases in the numbers of incorporations and dissolutions. It is likely that the increasing number of incorporations has led to a greater number of younger companies on the register, which has served to lower the average age of companies overall. Indeed it seems that the register is increasingly characterised by young companies: the average age of dissolved and closed companies has declined from 5.7 years in 2012/13 to 5.0 years in 2016/17.
The digital era in which we live may have led to a change in the profile of companies. Transacting electronically has considerably sped up the process of incorporating a company at relatively low cost. As the number of private limited companies has continued to grow, the numbers of more traditional public limited companies have been gradually declining. Public limited companies tend to be older on average than private limited ones. The average of closed public limited companies was 13.6 years in 2016/17, compared with just 5.0 years for private limited companies.
Chart 4: Average age of companies on the total register, 2000-2017, UK
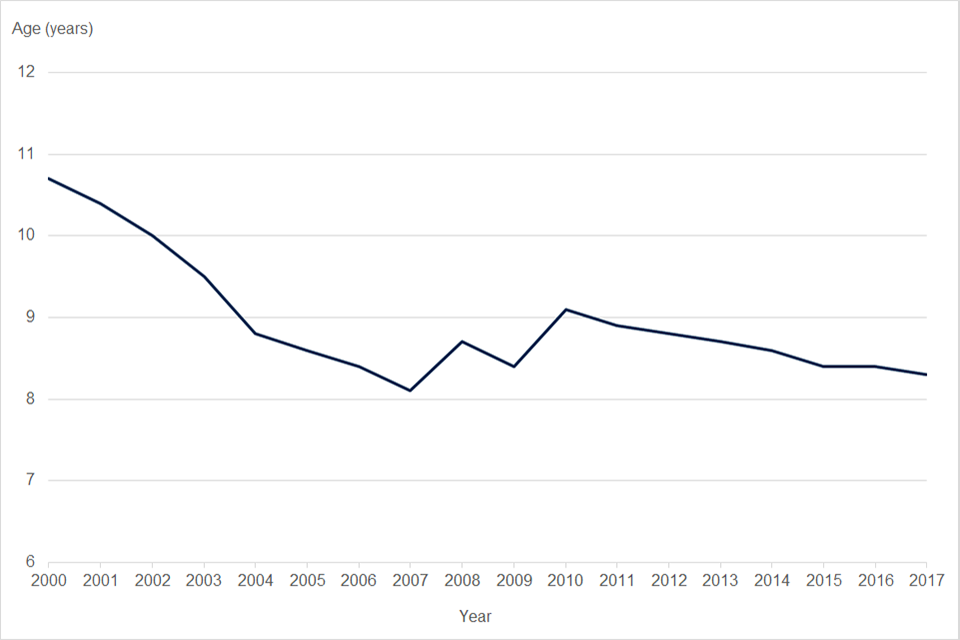
Average age of companies on the total register 2000-2017 UK
Source: Companies Register Activities 2016/17, Companies House
Table A5, in the workbook that accompanies this release, shows the age profile of companies on the total and effective registers at 31 March 2017, as well as those in liquidation or the course of dissolution. The table also shows the average age of companies from 2000 to 2017. Table A11 shows the average age of dissolved and closed companies from 2012/13 to 2016/17, while Table C3 shows average ages at closure and dissolution across all corporate body types.
5. Types of corporate body on the register
There are over 23 types of corporate body held on the register. These include a number of corporate body types in addition to those companies covered by the Companies Act 2006. Each corporate body type has its own requirements to provide information to Companies House, as outlined in various pieces of legislation and royal acts. Further information on the different company types.
The composition of the register, in terms of corporate body types, has remained relatively stable in recent years. Since 2004, private limited companies have dominated the register, consistently accounting for over 96% of all corporate bodies. During this time, the top 3 corporate body types of private limited companies, limited liability partnerships (LLPs), and limited partnerships have remained unchanged, accounting for around 99% of the register each year.
Table 1: Breakdown of corporate body types on the total register, 2017, UK
| Corporate body type | Number | Percentage of all corporate bodies |
|---|---|---|
| Private Limited | 3,737,487 | 92.8 |
| Private Limited by Guarantee/No Share Capital | 105,429 | 2.6 |
| Limited Liability Partnership | 60,778 | 1.5 |
| Limited Partnership | 45,250 | 1.1 |
| Private Limited by Guarantee/No Share Capital/(Exempt from using ‘Ltd’) | 42,482 | 1.1 |
| Overseas Company | 11,720 | 0.3 |
| Industrial and Provident Society | 9,939 | 0.2 |
| Public Limited Company | 6,939 | 0.2 |
| Private Unlimited | 4,420 | 0.1 |
| Other corporate body types | 3,940 | 0.1 |
| Total of corporate body types | 4,028,384 | 100 |
Source: Companies Register Activities 2016/17, Companies House
Although the composition of the register overall has remained stable, there have been some minor fluctuations within the individual company types:
- Limited liability partnerships were introduced in 2001. They gradually increased in number to make up 1.8% of the register in the years 2012-2014. The proportion of LLPs has since gradually declined, so that they now make up 1.5% of the register.
- Limited partnerships have grown from 0.5% of the register in 2004 to 1.1% in 2017. This is primarily due to large increases in the numbers of limited partnerships in Scotland in recent years.
- Public limited companies have been declining in number since 2008. They now make up only 0.2% of the register overall.
Although these changes are small, they show the subtle ways in which the composition of the register is changing outside of private limited companies.
Table C1, in the workbook that accompanies this publication, shows numbers and percentages of all corporate body types on the register from 2004 to 2017. Further information on public limited companies, limited partnerships and limited liability partnerships is available in tables A3, B2 and B4 respectively.
6. Overseas corporate bodies with a physical presence in the UK
At the end of March 2017, there were 11,291 overseas corporate bodies on the total register. Overseas corporate bodies are incorporated outside of the UK and have a physical presence in the UK (such as a place of business or branch) through which they carry out their business. The profile of overseas corporate bodies has remained largely stable since 2012, increasing by just 775 corporate bodies in that time.
Corporate bodies incorporated in the USA accounted for 2,488 (22.0%) of all overseas companies, with the Republic of Ireland, the second highest originating country, accounting for just 920 (8.1%). The 10 highest originating countries remained unchanged between 2014 and 2016, but in 2017 Canada replaced France as the tenth highest originating country. Over this period, the top 10 originating countries have consistently accounted for 63-64% of all overseas corporate bodies on the total register.
Figure 2: Top 10 originating countries for overseas corporate bodies, 31 March 2017
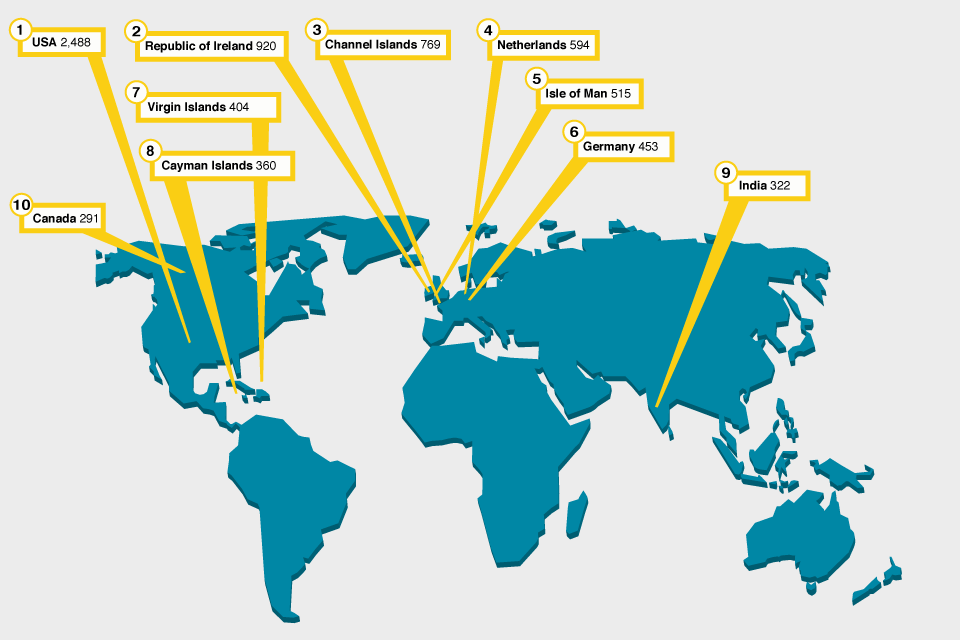
Top 10 originating countries for overseas corporate bodies 31 March 2017
Source: Companies Register Activities 2016/17, Companies House
There were 766 incorporations of new overseas corporate bodies in 2016/17. Of these, 94 (12.3%) originated in the Channel Islands, 88 (11.5%) in the Republic of Ireland, and 82 (10.7%) in the USA. These 3 countries have consistently had the highest numbers of new incorporations since 2013/14.
Table 2: Registrations of corporate bodies incorporated outside the United Kingdom in 2016/17 – top 10 originating countries
| Country of incorporation | New incorporations | Percentage of all incorporations |
|---|---|---|
| Channel Islands | 94 | 12.3 |
| Republic of Ireland | 88 | 11.5 |
| USA | 82 | 10.7 |
| Canada | 42 | 5.5 |
| Virgin Islands (includes 1 US Virgin Island) | 32 | 4.2 |
| Cayman Islands | 30 | 3.9 |
| Germany | 29 | 3.8 |
| Isle of Man | 28 | 3.7 |
| Netherlands | 28 | 3.7 |
| Luxembourg | 24 | 3.1 |
| Total | 477 | 62.3 |
Source: Companies Register Activities 2016/17, Companies House
Full figures on registrations of corporate bodies incorporated outside the United Kingdom from 2013/14 to 2016/17, as well as numbers on the register at 31 March 2017, are provided in table B1.
7. Other statistics in this release
A range of other statistics are included in the tables that accompany this release, including:
- analysis of companies on the register by period of incorporation
- removals of companies from the register
- other corporate bodies administered at Companies House, including limited partnerships and limited liability partnerships
A range of management information tables are due to be published later in the summer, providing the following information:
- civil penalties for late filing of annual accounts
- disqualification orders notified to the Secretary of State in the United Kingdom
- prosecutions by the department under the Companies Act 2006
- number of documents filed at Companies House
- annual accounts registered at Companies House by accounts type
8. Background notes
This section provides a range of information designed to provide the user with more information about the statistics.
8.1 Definitions
A separate document is available providing definitions for the main terms used in Companies House official statistics publications.
8.2 Quality
Information relating to the quality of the statistics is provided in a separate quality document. This document provides information on the quality of Companies House’s official statistics, to enable users to judge whether or not the data are of sufficient quality for their intended use. The information is structured in terms of the quality dimensions of the European Statistical System. The document also provides information on how these statistics relate to selected other business statistics.
8.3 Coverage
This release provides information on the size of the company population and the changes that have occurred within the year. The release includes statistics for the United Kingdom, England and Wales, Northern Ireland, and Scotland. The statistics cover companies and corporate bodies, both of which are specific legal forms of businesses that are registered at Companies House. They do not include information on sole proprietorship businesses, partnerships, and charities.
8.4 Use and users
Companies House statistics are used extensively by government, the public, public bodies and businesses. For example, they are used by:
- government in understanding the likely impact of policy changes and monitoring the impact of economic changes on companies
- businesses in understanding their market share and planning marketing strategies
- banks in developing an understanding of their customer base
- foreign firms in making UK location decisions
- academics to inform research into businesses at local and national level
- a range of public bodies in decision making and evaluating business-related policies
8.5 Revisions to these statistics
Revisions to these statistics will be mainly due to changes in methodologies and source data. The statistics are derived from administrative data, and changes to the underlying methods will cause revisions. These include changes in statistical methods, definitions, classifications, and geographic coverage.
Although Companies House has robust procedures in place to minimise errors in the methods used to create these statistics, errors may occasionally occur. If errors are found after the publication, their impact will be assessed. If the changes are significant, a corrigendum will be issued as soon as possible. Minor corrections will be included in the next planned release.
Any misleading or incorrect figures will be amended and a footnote added to indicate that the figures have been corrected. The nature and reason for the correction will be explained.
9. Date of next release
Statistics for the 12 months to 31 March 2018 will be published in summer 2018. The publication date will be announced on the GOV.UK release calendar.
-
Statistics for 1979 to 2008 are for Great Britain. In October 2009, the Northern Ireland register merged with the register for Great Britain to create a UK register. Figures from 2009/10 onwards are for the UK as a whole. ↩
-
Figures for 1979 to 1986 are for the calendar year 1 January to 31 December. Those for 1986/87 to 2016/17 are for the financial year 1 April to 31 March. ↩