Civil Service sickness absence, 2021: report
Published 31 March 2022

© Crown copyright 2022
This publication is licensed under the terms of the Open Government Licence v3.0 except where otherwise stated. To view this licence, visit nationalarchives.gov.uk/doc/open-government-licence/version/3 or write to the Information Policy Team, The National Archives, Kew, London TW9 4DU, or email: psi@nationalarchives.gov.uk.
Where we have identified any third party copyright information you will need to obtain permission from the copyright holders concerned.
This publication is available at https://www.gov.uk/government/publications/civil-service-sickness-absence-2021/civil-service-sickness-absence-2021-report
Contacts
Statistical Enquiries: aandi-socialresearch@cabinetoffice.gov.uk
Press enquiries: wayne.bontoft@cabinetoffice.gov.uk
Next publication to be confirmed
Download data tables (ods, 17.2 KB)
Overview
This bulletin presents headline information on sickness absence in the UK Civil Service workforce, including by gender, age, length of absence, absence cause, location and department, for the year ending 31 March 2021.
Key Highlights from Management Information:
Overall Average Working Days Lost (AWDL) per staff year in the Civil Service is 6.1 days in the year ending 31 March 2021, down from 7.4 days in the year ending 31 March 2020.
Of these average working days lost (AWDL) per staff year:
- 3.6 days per staff year were lost to long term sickness, and 2.5 days to short term sickness. Both decreased on the previous year from 4.3 and 3.1 respectively.
- Mental Ill-Health is the largest cause of long term sickness absence (41%), followed by Musculoskeletal System Disorders (13%).
- COVID-19 is the largest cause of short term absence (32%) followed by Mental Ill-Health (17%).
- London has the lowest level of sickness absence (4.3 days), compared to Scotland and the West Midlands (7.3 days).
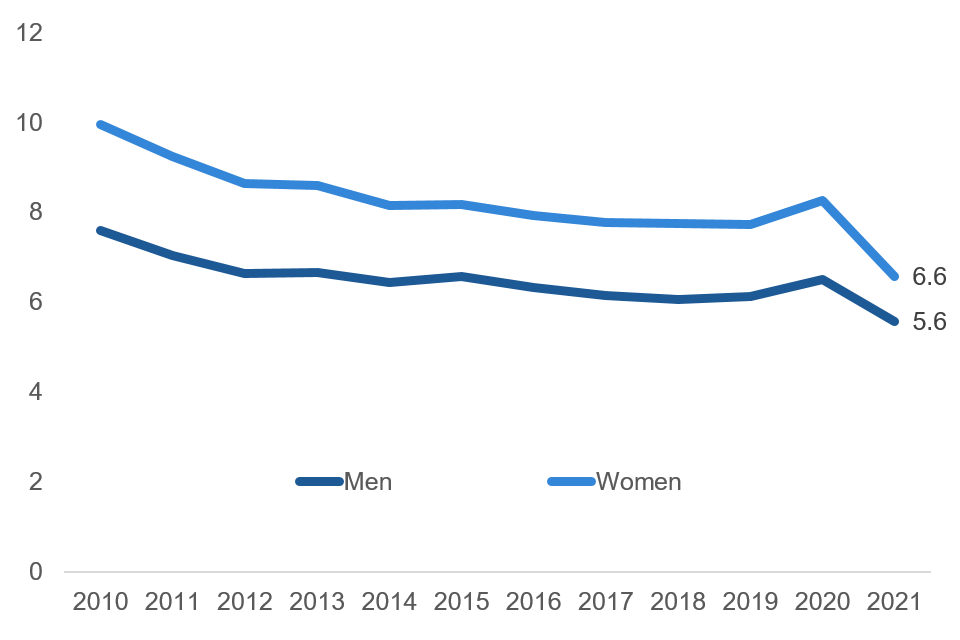
- Women took 6.6 days on average compared to 5.6 days for men.
- Sickness absence tends to increase with age, with those over 60 taking 8.3 days compared to 5.5 days for those aged 16-29 years.
- Two thirds (66%) of civil servants took no sickness absence in the year to 31 March 2021, this is 25 percentage points higher than a decade earlier (41% took no absence in 2011).
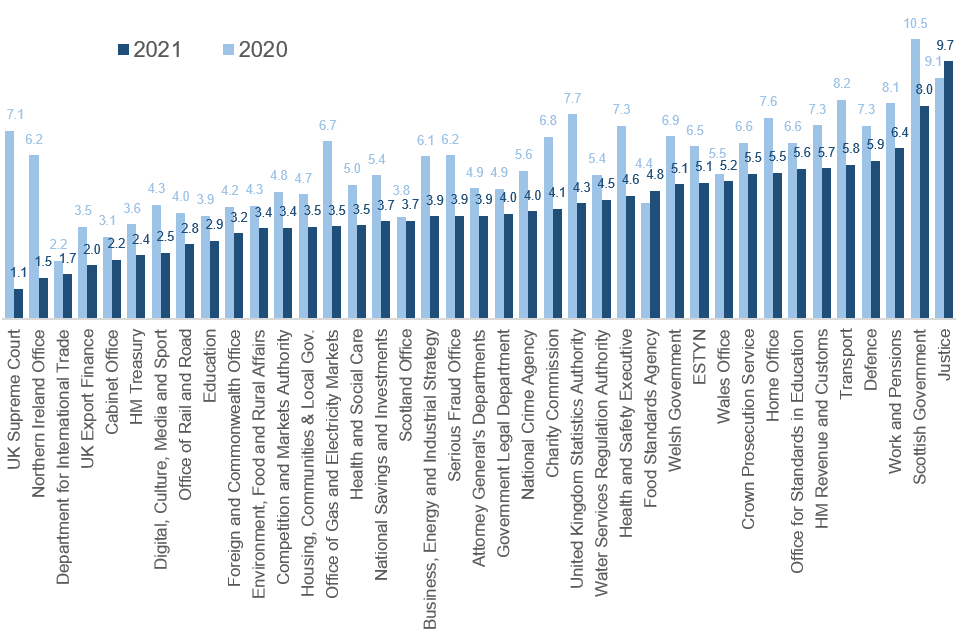
- Absence rates differ by department, ranging from 1.1 days at the UK Supreme Court to 9.7 days at the Ministry of Justice.
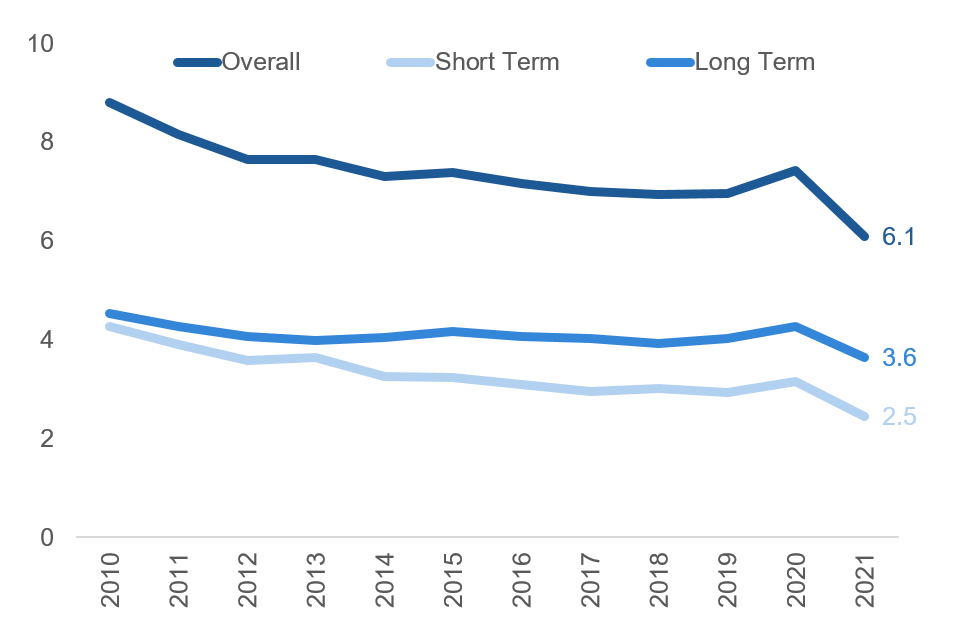
Line chart time series showing the average working days lost per staff year: 2020 – 2021
Methodology
Sickness Absence in the Civil Service is an annual report describing sickness absence across the UK Civil Service workforce in terms of departments, grade, location, age, gender, length of absence and reasons for absence.
These figures incorporate home Civil Service departments and staff, including those based in Northern Ireland and overseas. Not included are the Northern Ireland Civil Service, other Crown servants and employees of the wider public sector, for example, employees of non-departmental public bodies (NDPBs) and the National Health Service (NHS). There are a small number of Civil Service organisations not currently covered as part of these statistics. A listing of all Civil Service organisations contained in these statistics and those not currently included is provided.
Sickness absence figures are derived from management information
All data presented in this report are sourced and collated from Departmental Quarterly Sickness Absence Management Information returns to Cabinet Office. The data presented in this bulletin are not Official Statistics.
Notes on measures of sickness absence
These statistics present the headline measure for sickness absence in the Civil Service, Average Working Days Lost (AWDL) per staff year. This measure is used because it is the most accurate measure available and accounts for part-time workers and workers that have not worked for the entire year i.e. leavers and new entrants during the reporting period.
Organisations outside the Civil Service mainly report their sickness rates using the Average Working Days Lost per person measure. This measure could under-report the true levels of sickness absence in an organisation as it gives equal weighting in the AWDL calculation to individuals that are part-time or have only worked part of the year and have therefore worked fewer days during the course of the year than full-time staff that have worked the entire year.
Sector comparisons
Caution should be used when comparing data from this bulletin with other sectors of the economy due to differences in measurement definitions. The Office for National Statistics publishes sickness absence statistics including comparisons between different industry sectors and the public sector.
Calculations
Average Working Days Lost per staff year is calculated as follows:
AWDL per staff year =
Working Days Lost during the year at organisation / Total Staff Years at organisation
Where Total Staff Years at organisation =
Total Working Days Available at organisation / Working Days available for 1 full-time employee employed for the entire year
For consistency purposes, working days available over a year for a typical full-time employee is assumed to be 225 working days.
Collection time periods
All data is annual in order to remove seasonality. However, departments report their annual data on a quarterly basis. For this report we focus on data collected ending in March every year. So the latest data for 2021 covers the time period 1 April 2020 to 31 March 2021. Data for the preceding year (2020) covers the period 1 April 2019 to 31 March 2020 and so forth. Unless otherwise stated, all the data reported in the bulletin refer to time periods ending 31 March 20xx.
Definitions
Short-Term sickness absence: All absences less than or equal to 20 working days or 28 calendar days.
Long Term sickness absence: All absences greater than or equal to 21 working days or 29 calendar days.
Request for feedback
If you would like to provide feedback on any aspect of this publication, please contact us at: aandi-socialresearch@cabinetoffice.gov.uk
By organisation
Average Working Days Lost (AWDL) per staff year by department ranges from 1.1 days at the UK Supreme Court to 9.7 days at the Ministry of Justice. Sickness absence increased in only two organisations between 2020 and 2021:
- The Ministry of Justice; AWDL increased to 9.7 days in the year ending 31 March 2021 from 9.1 in the year ending 31 March 2020.
- The Food Standards Agency reported an increase from 4.4 days in the year ending 31 March 2020 to 4.8 in the year ending 31 March 2021.
Departmental breakdowns of overall sickness absence and the leading cause of absence, Mental Ill-Health, can be found in data Tables 3a and 3b (ods, 17.2 KB) respectively.
Bar chart showing the average working days lost per staff year by department: 2020 – 2021
Statistical Note
Major trends in overall Civil Service absence levels are often due to changes in the five largest departments (DWP, MoJ, HMRC, MoD, HO). These departments account for 67% of working days in the Civil Service and 76% of sickness absence taken.
The data presented in all the charts in this report can be found in the accompanying data tables (ods, 17.2 KB) file published alongside this report.
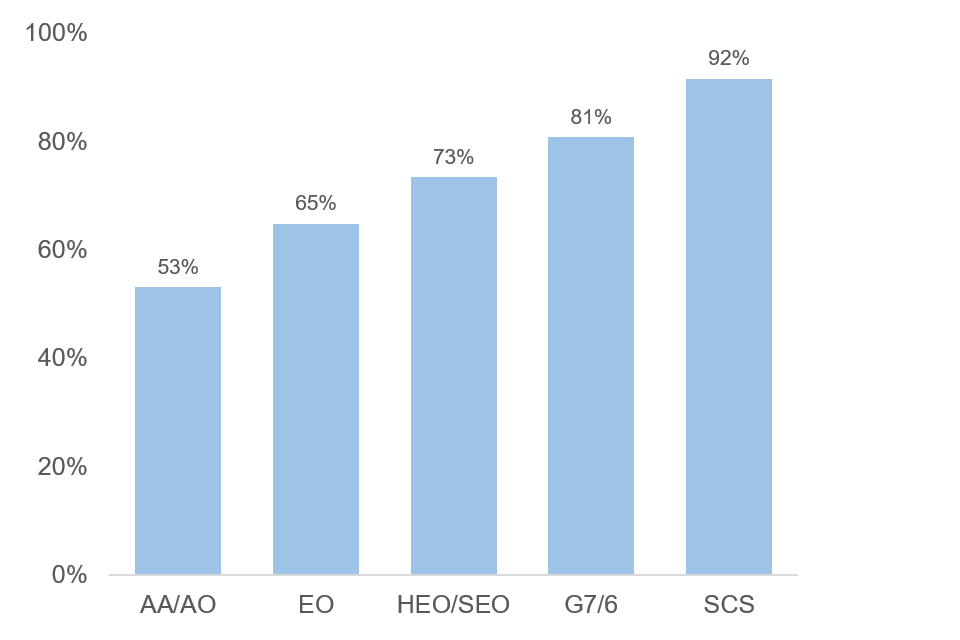
By grade
Sickness absence levels decrease with seniority, with AWDL per staff year at the most junior grades (AA/AO) at 9.4 days compared to SCS levels that stand at 1.6 days. The percentage of days lost to long term sickness absence is broadly similar across grades outside of the SCS (between 58% and 59%). In the SCS this increases to 62% of all days lost to sickness. The proportion of staff taking no sickness absence increases with grade, and for SCS is 38 percentage points higher than for AA/AO grades.
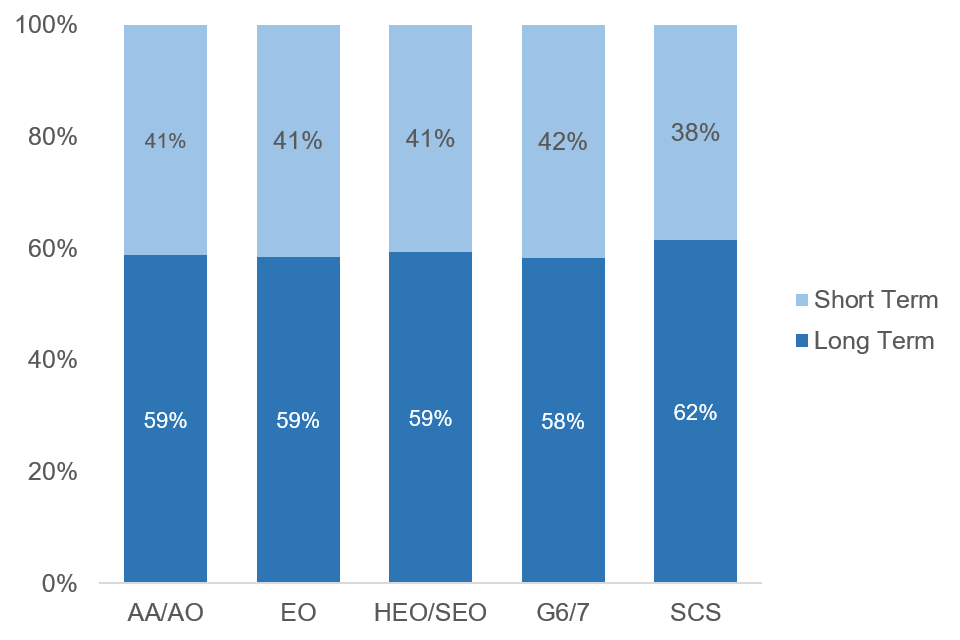
Percentage of working days lost to long term and short term sickness absence by grade, 2021
Percentage of staff with no reported sickness absence during the year by grade, 2021
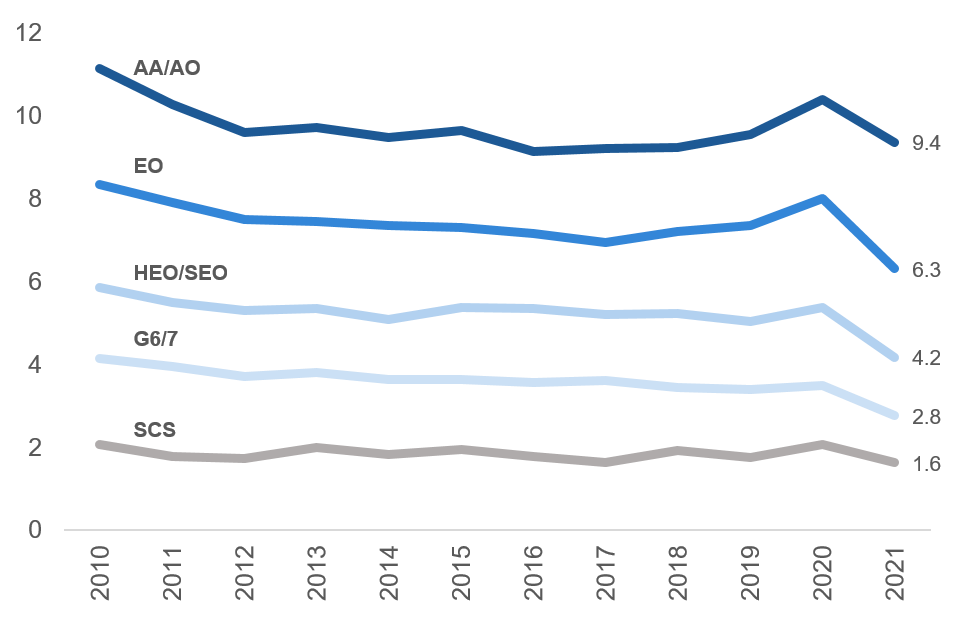
Line chart showing average working days lost by grade over time from 2010 to 2021
By region
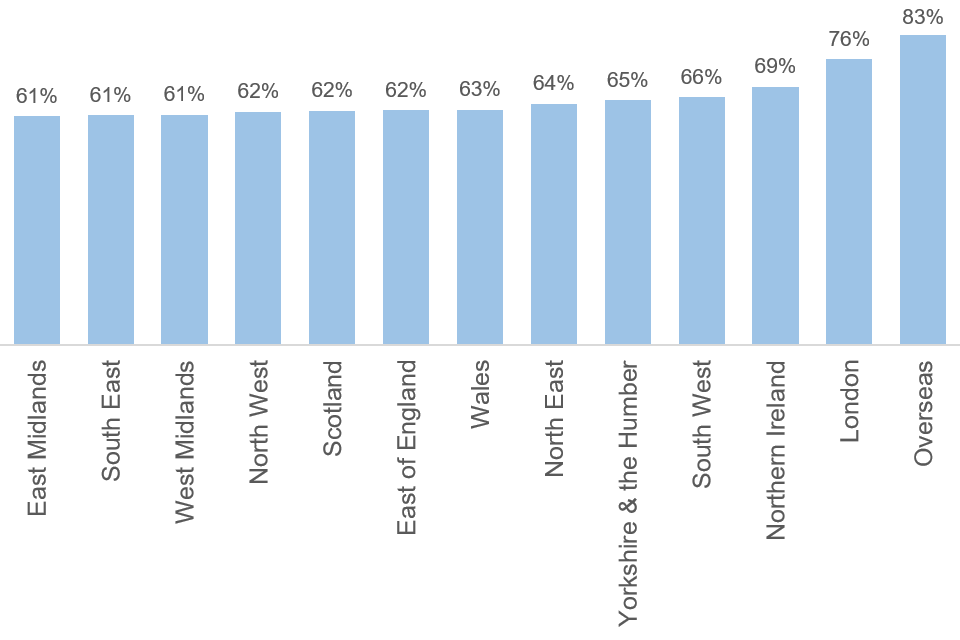
Average working days lost per staff year varies across the regions. The regions with the highest levels of sickness absence are Scotland and West Midlands (7.3 days). After overseas, the regions with the lowest levels of sickness absence are London (4.3 days) and the South West (5.3 days). There is also variation in the percentage of staff with no reported sickness absence, after overseas (83%) ranging from 76% in London to 61% in the Midlands, and South East.
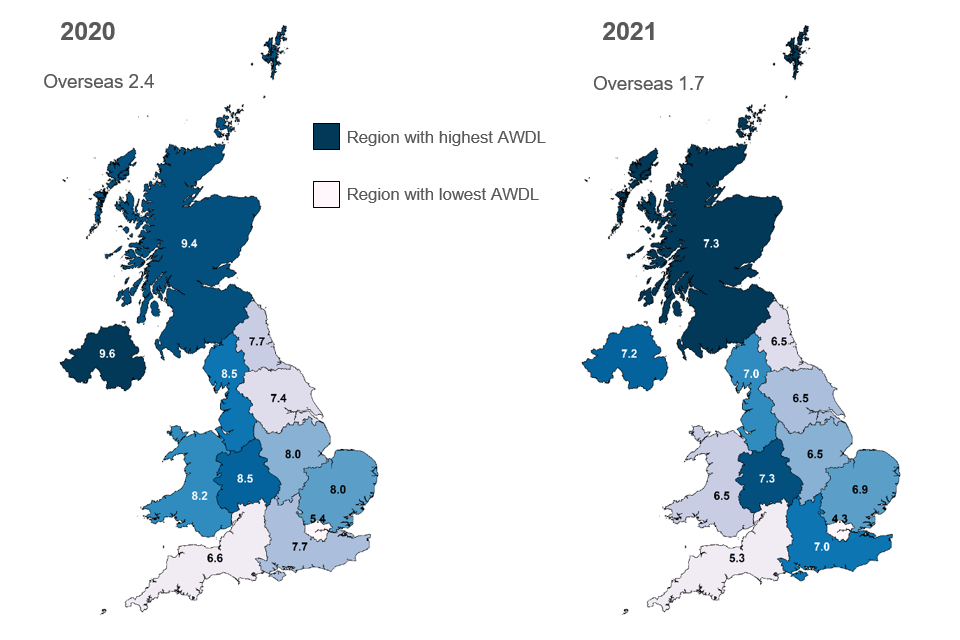
Average working days lost per staff year by region for 2020 and 2021
Bar chart showing percentage of staff by region with no reported sickness absence in 2021
By sex
Sickness absence levels for women (6.6 days) are higher than men (5.6 days). There is little difference between the long term and short term split of sickness for men and women. The percentage of staff with no sickness absence is five percentage points higher for men (69%) than for women (64%). In the year ending 31 March 2021 the number of days of sickness absence decreased for men and for women by 0.9 and 1.7 days respectively, compared to the year ending 31 March 2020. Over the last 10 years sickness absence rates for both men and women have been declining. The number of days absence taken by women has fallen by 2.7 days since 2011. During the same period the number of sickness absence days taken by men fell by 1.5 days.
Line chart showing days lost per staff year by sex over time, from 2010 to 2021
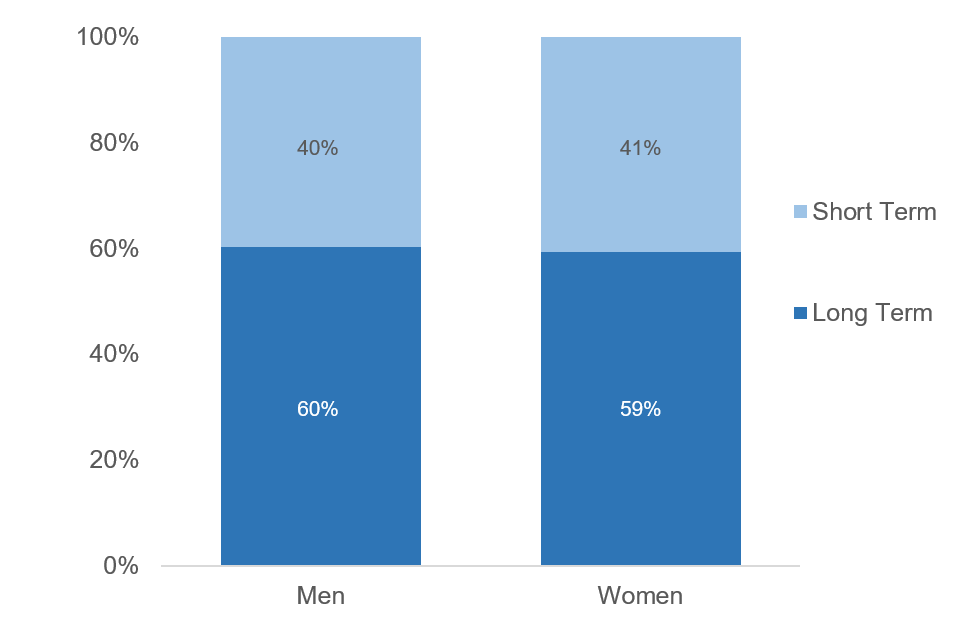
Percentage of working days lost to long term and short term sickness absence by sex
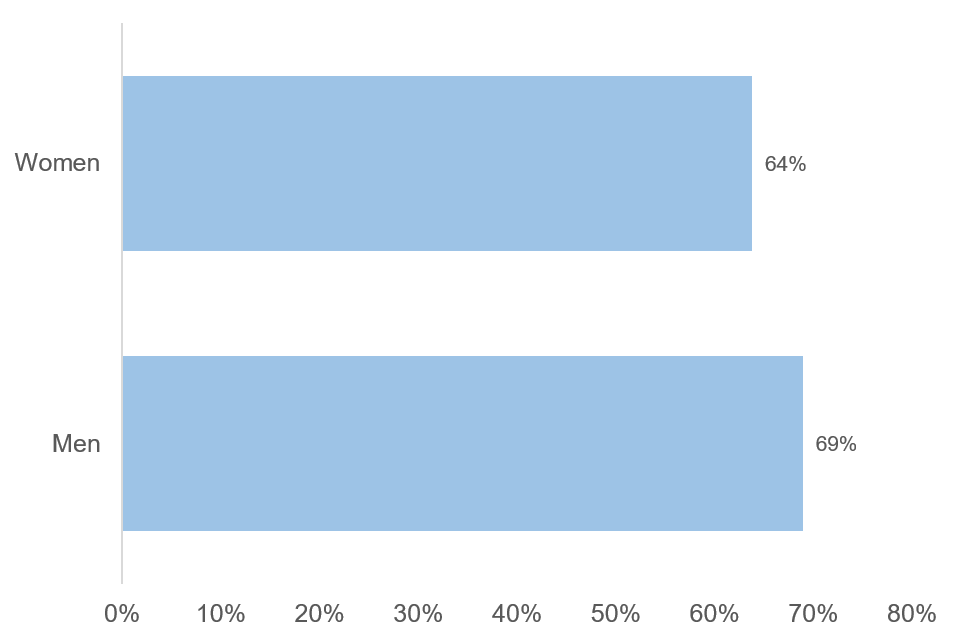
Percentage of staff with no reported sickness absence during the year by sex, 2021
By age
Sickness absence tends to increase with age, increasing from 5.4 days for those aged 30-39 to 8.3 days for those aged 60 and over. The youngest age band, 16-29 report similar levels of sickness absence to those aged 30-39 in the most recent period. The percentage of absence that is long term also increases with age, from 51% in the under thirties to 68% in the over sixties. There is very little variation between age categories in the percentage of staff with no reported sickness absence, with all figures lying within a two percent range.
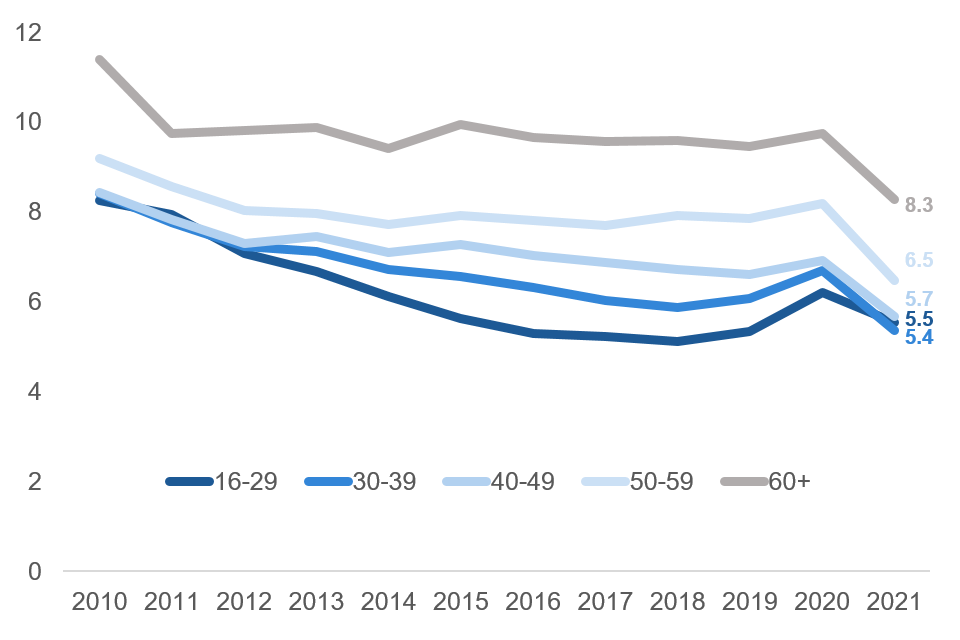
Line chart showing average days lost by age over time, from 2010 to 2021
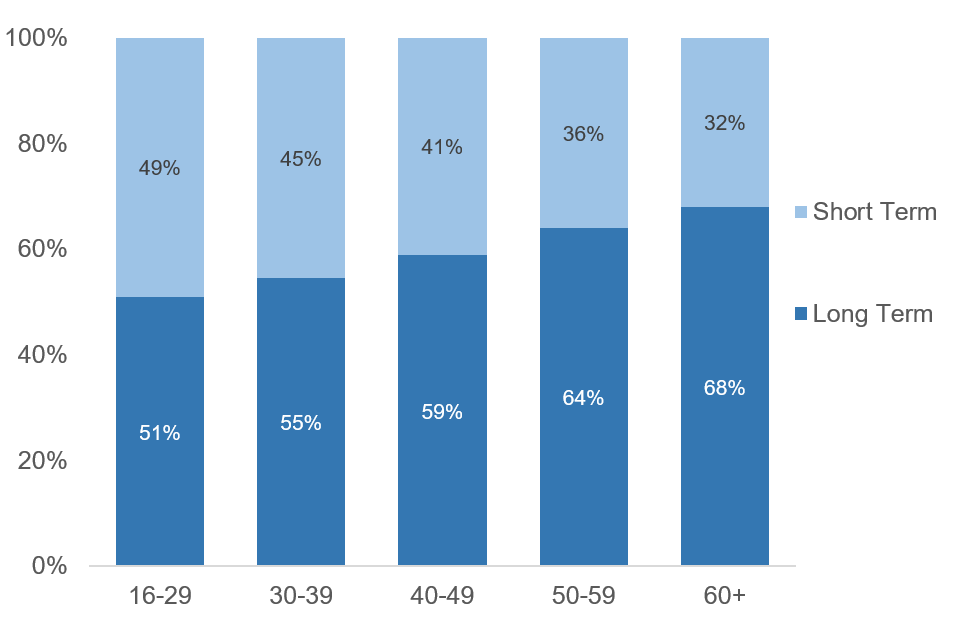
Percentage of working days lost to long term and short term sickness absence by age, 2021
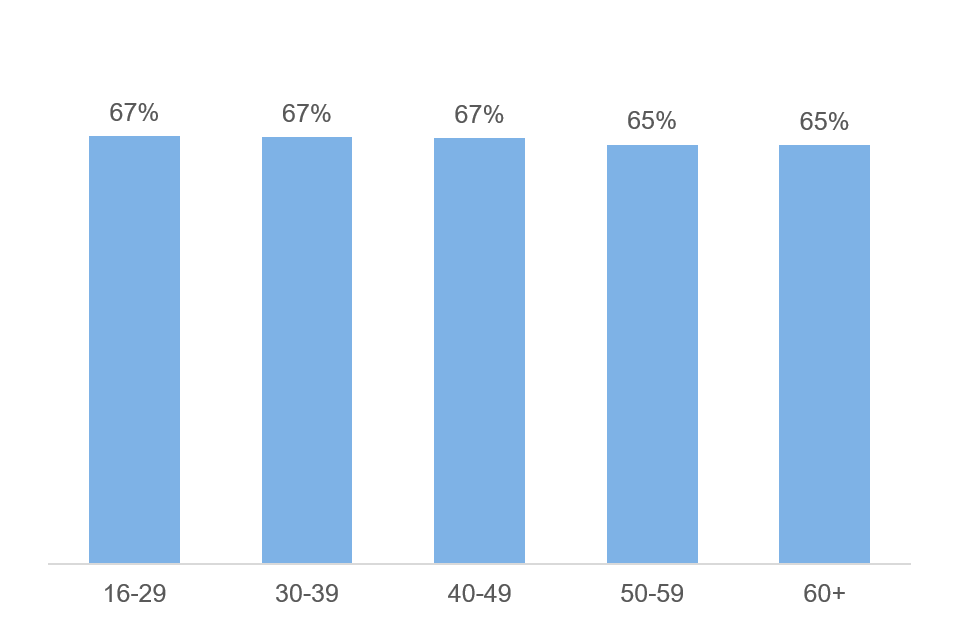
Bar chart showing the percentage of staff with no reported absence by age for 2021
By absence reason
Mental Ill-Health is the leading cause of sickness absence, with an average of 1.9 days lost during the year. 1.2 days are lost on average to COVID-19. Mental Ill-Health and Musculoskeletal System Disorders are the largest causes of long term sickness absence at 40.8% and 13.1% respectively. COVID-19 accounts for 11.9% of long term absences. 31.7% of all short term sickness absence is due to COVID-19, followed by Mental Ill-Health (17%) and Musculoskeletal System Disorders (8.7%).
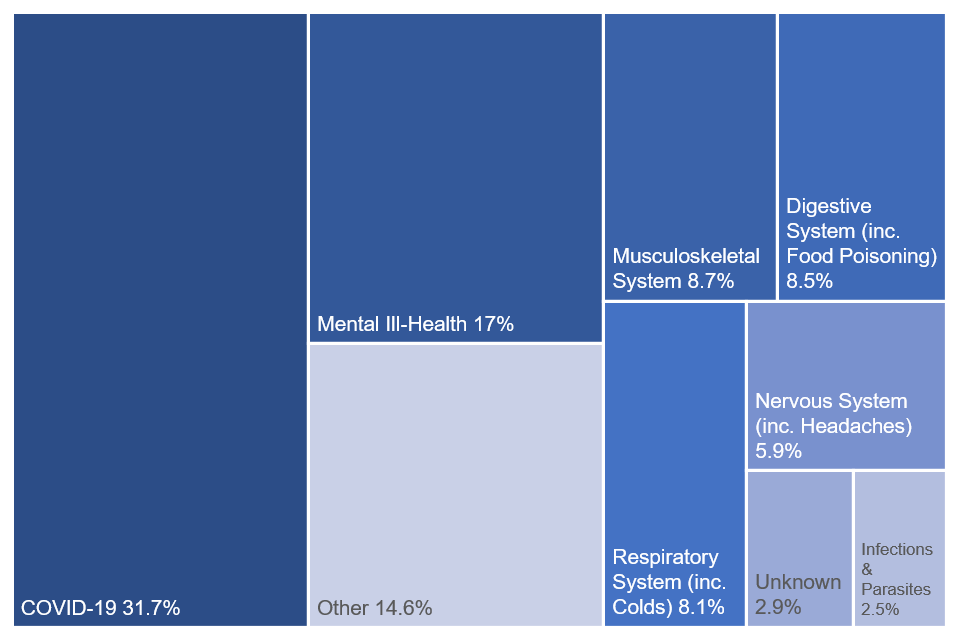
TreeMap chart showing the percentage of short term absences by reason in 2021
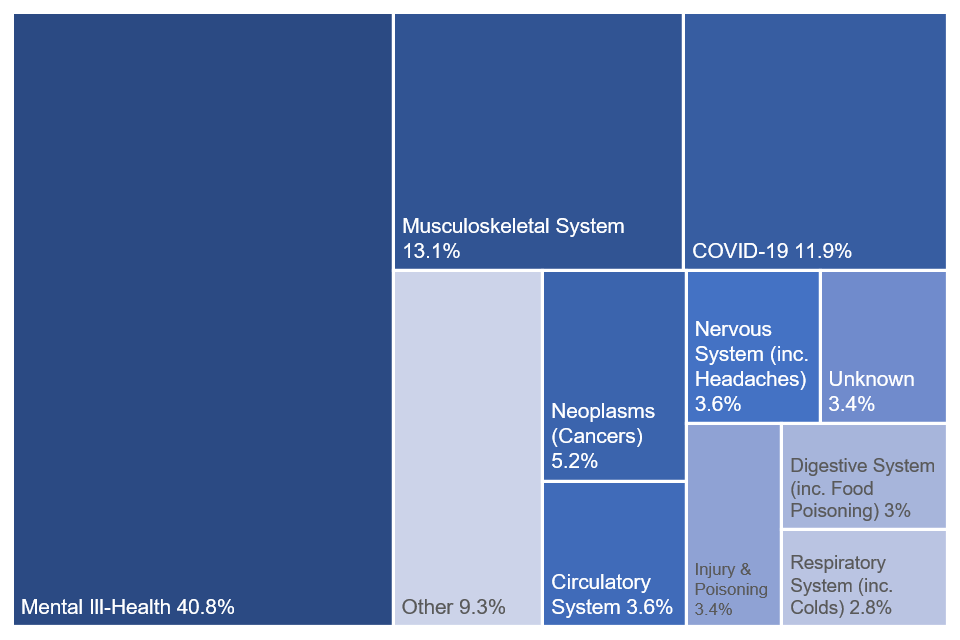
TreeMap chart showing the percentage of long term absences by reason in 2021
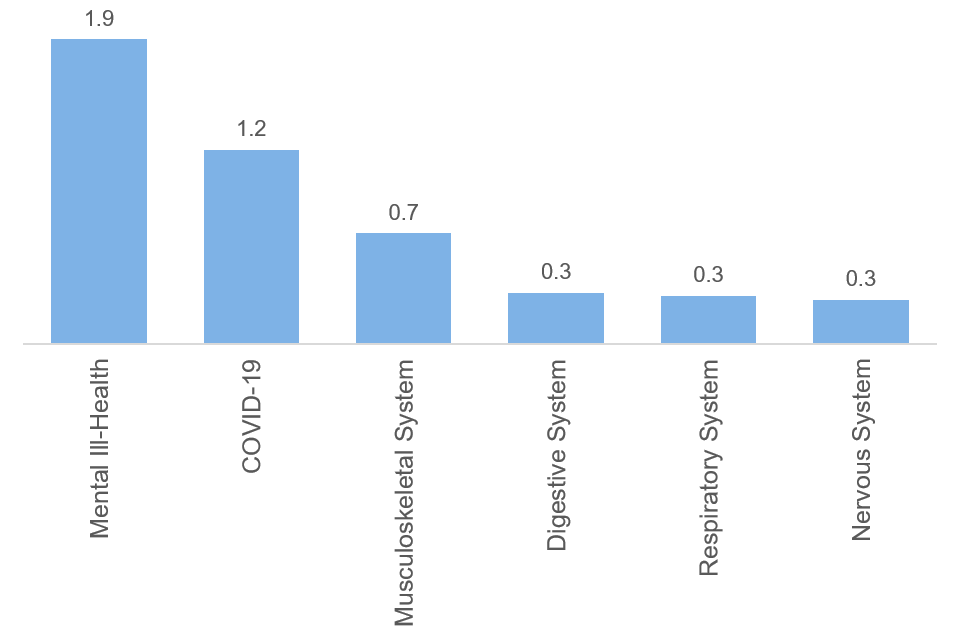
Bar chart showing average working days lost per staff year by reason in 2021
Civil Service Coverage
Parent departments being reported, with their Executive Agencies or Crown NDPBs included and reported in the parent department for year ending 31 March 2021:
Attorney General’s Departments
Attorney General’s Office
Government Legal Department
HM Crown Prosecution Service Inspectorate
Business, Energy & Industrial Strategy
Companies House
HM Land Registry
The Insolvency Service
Met Office
UK Intellectual Property Office
UK Space Agency
Cabinet Office
Crown Commercial Service
Government in Parliament
Government Property Agency
Charity Commission
Competition and Markets Authority
Crown Prosecution Service
Defence
Defence Equipment & Support
Defence Science and Technology Laboratory
Submarine Delivery Agency
UK Hydrographic Office
Digital, Culture, Media & Sport
The National Archives
Education
Education and Skills Funding Agency
Institute for Apprenticeships and Technical Education
Standards and Testing Agency
Teaching Regulation Authority
Environment, Food & Rural Affairs
Animal and Plant Health Agency
Centre for Environment, Fisheries and Aquaculture Science
Rural Payments Agency
Veterinary Medicines Directorate
ESTYN
Food Standards Agency
Foreign, Commonwealth & Development Office
FCDO Services
Wilton Park Executive
Health and Safety Executive
Health and Social Care
Medicines and Healthcare Products Regulatory Agency
Public Health England
HM Revenue & Customs
Valuation Office Agency
HM Treasury
Government Internal Audit Agency
National Infrastructure Commission
Office for Budget Responsibility
UK Debt Management Office
Home Office
Housing, Communities and Local Government
Planning Inspectorate
Queen Elizabeth II Conference Centre
Department for International Trade
Justice
Criminal Injuries Compensation Authority
HM Courts and Tribunals Service
HM Prison and Probation Service
Legal Aid Agency
Office of the Public Guardian
National Crime Agency
National Savings and Investments
Northern Ireland Office
OFSTED
OFGEM
Office of Rail and Road
OFWAT
Scotland Office
Scottish Government
Accountant in Bankruptcy
Crown Office and Procurator Fiscal Service
Disclosure Scotland
Education Scotland
Food Standards Scotland
Forestry and Land Scotland
National Records of Scotland
Office of the Scottish Charity Regulator
Registers of Scotland
Revenue Scotland
Scottish Courts and Tribunal Service
Scottish Fiscal Commission
Scottish Forestry
Scottish Housing Regulator
Scottish Prison Service
Scottish Public Pensions Agency
Social Security Scotland
Student Awards Agency for Scotland
Transport Scotland
Serious Fraud Office
Transport
Driver and Vehicle Licensing Agency
Driver and Vehicle Standards Agency
Maritime and Coastguard Agency
Vehicle Certification Agency
Wales Office
Welsh Government
Welsh Revenue Authority
Work and Pensions
UK Export Finance
UK Statistics Authority
UK Supreme Court
Organisations not currently being reported on:
Advisory Conciliation and Arbitration Service (BEIS)
Government Actuary’s Department
OFQUAL
Machinery of Government Changes
The Foreign and Commonwealth Office became the Foreign, Commonwealth & Development Office in September 2020 during the collection of data for this report.
The Ministry of Housing, Communities & Local Government became the Department for Levelling Up, Housing and Communities in September 2021 after the collection of data for this report.
Public Health England was replaced by UK Health Security Agency and Office for Health Improvement and Disparities in April 2021 after the collection of data for this report.