Civil Service People Survey 2025 - Results Highlights
Updated 28 May 2026

© Crown copyright 2026
This publication is licensed under the terms of the Open Government Licence v3.0 except where otherwise stated. To view this licence, visit nationalarchives.gov.uk/doc/open-government-licence/version/3 or write to the Information Policy Team, The National Archives, Kew, London TW9 4DU, or email: psi@nationalarchives.gov.uk.
Where we have identified any third party copyright information you will need to obtain permission from the copyright holders concerned.
This publication is available at https://www.gov.uk/government/publications/civil-service-people-survey-2025-results/civil-service-people-survey-2025-results-highlights
Civil Service People Survey 2025
Note: The 2025 Civil Service People Survey was shorter with fewer questions compared to the 2024 survey. Some questions used to calculate five of the nine summary themes were removed. ‘My work’, ‘My manager’, ‘My team’, ‘Pay and benefits’ and ‘Leadership and managing change’ are the five themes that have changed. The scores of these five themes should not be compared with those published in previous publications. ‘Pay and benefits’ is no longer a summary score for multiple questions but the percent positive score for B36 only. In this report and the benchmark results file (ods), the scores of the affected five themes have been recalculated to take into account the question removal for comparison with this year. In the accompanying benchmark results file (ods), the theme scores have been re-calculated back to the previous year for the organisation level scores (Table 1) and back to 2009 for the Civil Service scores (Tables 2 and 3). More information can be found in the Quality and Methodology Information Guide.
Contents
- People Survey response rate and overview
- Employee engagement and theme scores
- Discrimination
- Bullying and harassment
- Cross government priorities
- Employee wellbeing
- Future intentions
- Annex: Background information
People Survey response rate and overview
The annual Civil Service People Survey (CSPS) measures civil servants’ attitudes to, and experience of working in government organisations.
This report is an overview of the headline findings of the 2025 Civil Service People Survey for the purpose of providing commentary on the results. It is composed of six sections; (i) Employee engagement and theme scores, (ii) Discrimination, (iii) Bullying and harassment, (iv) Cross government priorities, (v) Employee wellbeing and (vi) Future intentions. The results from these sections and more questions can be found in the Civil Service People Survey 2025 Benchmark Results file.
Percentages are rounded to whole numbers in this report for ease of reading. Discrepancies may be seen when adding and subtracting the rounded figures compared with the unrounded figures. Please refer to the explanatory notes in the annex below for more information.
59% of civil servants, across 102 organisations, participated in the 2025 Civil Service People Survey
343,961 civil servants from 102 organisations responded to the 2025 Civil Service People Survey, down from 354,962 in 2024. The overall response rate in 2025 was 59%, down compared with 2024 (61%).
The individual response rates for each of the 102 participating organisations can be found in Table 1 of the accompanying benchmark results file.
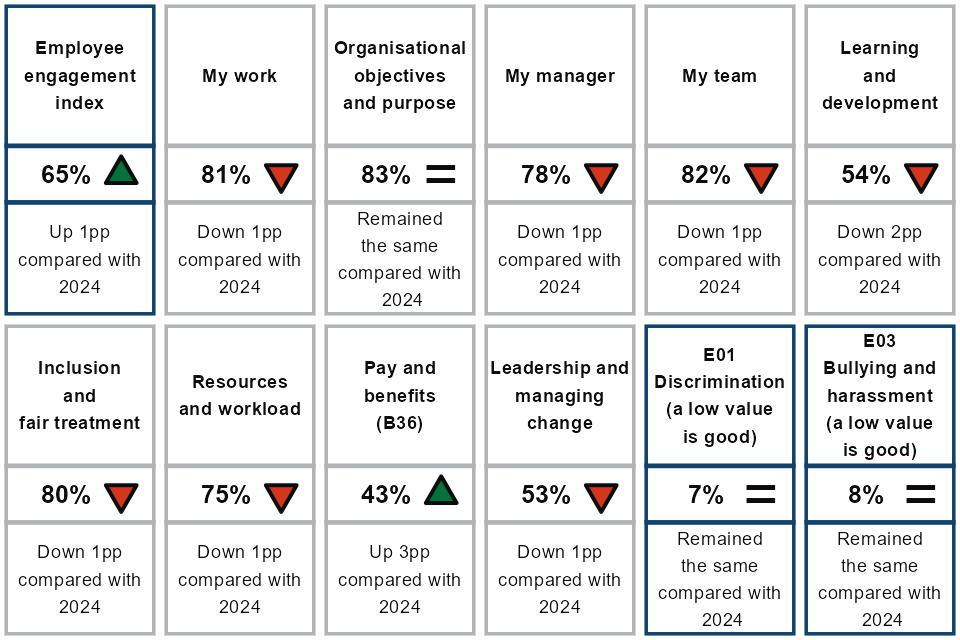
Figure 1: Summary of Civil Service People Survey 2025 Results (access Table 1 (ODS,17KB))
For the Civil Service as a whole, the median benchmark scores are used in this report (unless stated otherwise). The median benchmarks are the ‘average organisation’ scores, the scores for each participating organisation are calculated first, arranged from lowest to highest and the median (middle organisation value) is used. Theses median scores are used as the benchmarks for the Civil Service as they are less swayed by the scores of the larger departments.
The mean scores are the aggregate calculation of all responses to the People Survey. Question mean scores relate to the civil servants who answered the question, and the proportion who answered certain response options. For example, for the Civil Service as a whole (CSPS 2025), of the civil servants who answered ‘I am interested in my work’ (B01), 88% responded ‘Strongly agree’ or ‘Agree’.
The mean scores for the 17 main Whitehall departments plus the Devolved Administrations (Scottish Government and Welsh Government) are presented in this report (referred to as the ‘main organisations’ going forward). The main organisations account for just over three quarters (76%) of all civil servants responding to the survey. The mean scores for the Civil Service as a whole and all 102 participating organisations can be found in Tables 1 and 3 of the accompanying benchmark results file.
The Northern Ireland Civil Service (NICS) conducts their own separate NICS People Survey. A small number of civil servants responding to this survey have workplaces based in Northern Ireland.
Note: Scores for the Cabinet Office corporate group (CO_GROUP) and Ministry of Justice (MOJ_GROUP) presented in this report are the group scores for multiple participating organisations. The individual organisation scores within the corporate groups and more information can be found in the benchmark results file. Also, the Department for Education (DFE) scores include their respective agencies.
Further information about the survey can be found in the Quality and Methodology Information Guide, including the full list of participating organisations, development of the questionnaire over time and detail about how the scores and the indices are calculated.
Employee engagement and theme scores
Index and theme scores are summary measures for groups of questions within the People Survey.
The employee engagement index for the Civil Service was up compared to 2024 at 65%.
A key measure in the People Survey is the employee engagement index (EEI). This is a summary of five questions in the survey (B47 to B51) relating to engagement which cover: how proud staff feel working for their organisation, whether they would recommend their organisation as a great place to work, whether they feel a strong personal attachment to it, and whether they feel their organisation inspires and motivates them to do the best in their job and achieve their organisation’s objectives.
Figure 2: CSPS median benchmark scores 2009 to 2025 for the Employee Engagement Index (access Table 2 (ODS,17KB))
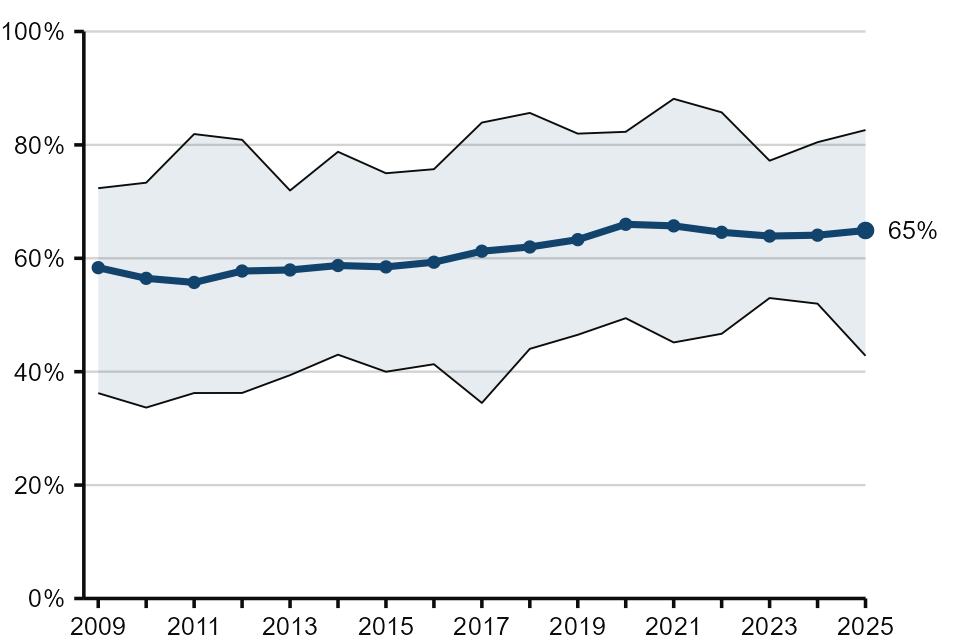
Note: The shaded area shows the range from the lowest score to the highest score of all participating organisations.
There are nine theme scores derived from the People Survey results, each used to measure a different element of employee experience at work. A theme score is a summary measure for civil servants answering positively (“Strongly agree” or “Agree”) across a similarly themed group of questions. As stated in the note at the top of this report, the themes ‘My work’, ‘My manager’, ‘My team’, ‘Pay and benefits’ and ‘Leadership and managing change’ changed in 2025 and should not be compared with the scores in previous publications.
Figure 3: CSPS median benchmark scores 2009 to 2025 for the nine summary themes (access Table 3 (ODS,17KB))
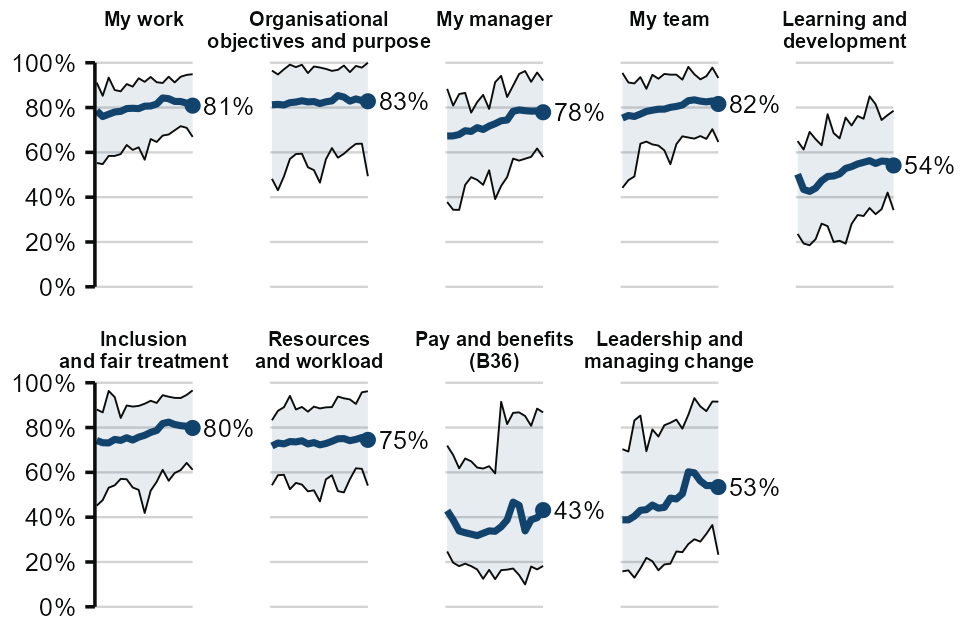
Note: The shaded area shows the range from the lowest score to the highest score of all participating organisations.
The index and theme measures are calculated differently. More information about the measures, the questions used to derive them and how the mean scores are calculated can be found in the Annex below and in the Quality and Methodology Information Guide.
Compared to 2024:
- ‘Employee engagement index’ was up 1pp
- ‘Pay and benefits’ (percent positive score for B36) was the only theme to increase (up 3pp)
- ‘Organisational objectives and purpose’ remained the same
- All other theme scores went down with ‘Learning and development’ having the largest decrease (down 2pp)
Employee engagement index ranged from 57% to 71% across the main organisations
Table 1: 2025 EEI and theme scores by organisation with the percentage point (pp) change compared to 2024
| Organisation | Employee engagement index | My work theme | Organisational objectives and purpose theme | My manager theme | My team theme | Learning and development theme | Inclusion and fair treatment theme | Resources and workload theme | Pay and benefits theme (B36) | Leadership and managing change theme |
|---|---|---|---|---|---|---|---|---|---|---|
| CO_GROUP | 61% (0) |
81% (0) |
73% (+3) |
77% (0) |
84% (0) |
53% (-1) |
79% (0) |
75% (+1) |
48% (+8) |
51% (0) |
| DBT | 60% (-3) |
79% (-2) |
79% (-2) |
78% (-1) |
80% (-2) |
54% (-4) |
79% (-4) |
74% (-1) |
36% (+4) |
49% (-6) |
| DCMS | 71% (0) |
83% (+1) |
82% (+1) |
79% (+1) |
84% (0) |
57% (-2) |
83% (0) |
76% (0) |
40% (+5) |
60% (-3) |
| DEFRA | 60% (-2) |
79% (-1) |
77% (-2) |
76% (-2) |
82% (-3) |
52% (-4) |
79% (-3) |
71% (-2) |
37% (+2) |
48% (-4) |
| DESNZ | 67% (0) |
81% (-2) |
87% (+2) |
80% (0) |
81% (-3) |
49% (-5) |
84% (-1) |
75% (0) |
38% (-1) |
60% (-1) |
| DFE | 65% (+1) |
82% (+1) |
81% (+1) |
82% (0) |
85% (-1) |
56% (0) |
83% (0) |
77% (-1) |
48% (+3) |
56% (+1) |
| DFT | 60% (-1) |
80% (+1) |
79% (-1) |
78% (-1) |
81% (-2) |
53% (-5) |
80% (0) |
75% (-1) |
36% (+3) |
48% (-4) |
| DHSC | 57% (-6) |
78% (-4) |
73% (-4) |
79% (-1) |
83% (-2) |
46% (-11) |
79% (-3) |
73% (-3) |
37% (-3) |
40% (-13) |
| DSIT | 58% (-4) |
78% (0) |
63% (-12) |
76% (-3) |
82% (-1) |
47% (-5) |
79% (-2) |
70% (-1) |
38% (+5) |
49% (-8) |
| DWP | 61% (-1) |
78% (-2) |
86% (-1) |
77% (-1) |
81% (-2) |
62% (-1) |
79% (-3) |
76% (-1) |
40% (+3) |
53% (-1) |
| FCDO | 65% (0) |
83% (0) |
79% (-3) |
75% (+1) |
81% (+1) |
56% (0) |
76% (0) |
76% (+1) |
36% (+8) |
49% (0) |
| HMRC | 60% (+3) |
76% (+1) |
87% (+3) |
78% (+1) |
80% (0) |
60% (+4) |
80% (+1) |
75% (+2) |
42% (+8) |
52% (+4) |
| HMT | 65% (-4) |
79% (-4) |
77% (-6) |
77% (-4) |
79% (-4) |
47% (-6) |
77% (-4) |
72% (-2) |
31% (0) |
53% (-3) |
| HO | 57% (-2) |
74% (-2) |
81% (-1) |
74% (-2) |
77% (-3) |
52% (-5) |
74% (-3) |
72% (-2) |
37% (-1) |
46% (-2) |
| MHCLG | 61% (-2) |
81% (0) |
79% (+2) |
81% (-1) |
83% (-2) |
55% (-5) |
80% (-3) |
76% (0) |
32% (-3) |
51% (-7) |
| MOD | 64% (+1) |
81% (0) |
82% (+1) |
73% (0) |
78% (-2) |
54% (+1) |
76% (-1) |
70% (-1) |
41% (+4) |
46% (+2) |
| MOJ_GROUP | 61% (0) |
78% (-1) |
83% (0) |
73% (0) |
77% (-1) |
54% (-2) |
75% (-1) |
72% (0) |
34% (+2) |
50% (0) |
| SG | 60% (-4) |
80% (-3) |
81% (-1) |
79% (-2) |
81% (-3) |
51% (-5) |
77% (-6) |
72% (-3) |
56% (-9) |
43% (-7) |
| WG | 68% (+2) |
86% (+1) |
86% (+3) |
83% (+2) |
86% (0) |
62% (+3) |
86% (0) |
80% (0) |
66% (+2) |
63% (+3) |
Note: The full names for the department codes used in this and other tables are at the bottom of this page in the Coverage section.
Across main organisations in 2025 (Table 1), the Department for Culture, Media and Sport (DCMS) had the highest employee engagement index (EEI) score (71%), while the Department of Health and Social Care (DHSC) had the lowest (57%), followed by HO (also 57%, when rounded).
The Welsh Government (WG) had the highest scores for eight of the nine themes, while the Department for Energy Security and Net Zero (DESNZ) had the highest score for ‘Organisational objectives and purpose’ (87%).
Of the main organisations, HM Revenue and Customs (HMRC) had the largest increase in EEI compared to 2024 (up 3pp) (Table 1), while the Department of Health and Social Care (DHSC) had the largest reduction (down 6pp).
For seven of the nine themes, HMRC had the largest increase compared to 2024, including for ‘Pay and benefits’ (up 8pp). The largest decrease in any one theme score by a main organisation was ‘Leadership and managing change’ in DHSC (down 13pp).
Discrimination
Discrimination is when an individual is treated differently or less favourably than someone else because of their personal characteristics, or when a working condition, policy, procedure or rule disadvantages one group of people more than another.
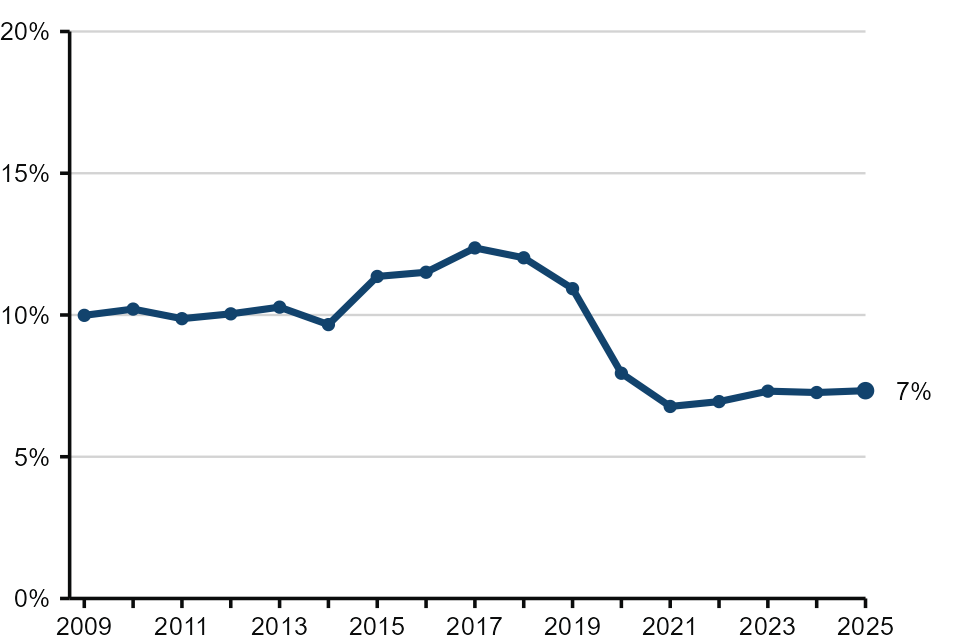
Reports of discrimination remained stable at their lowest recorded level
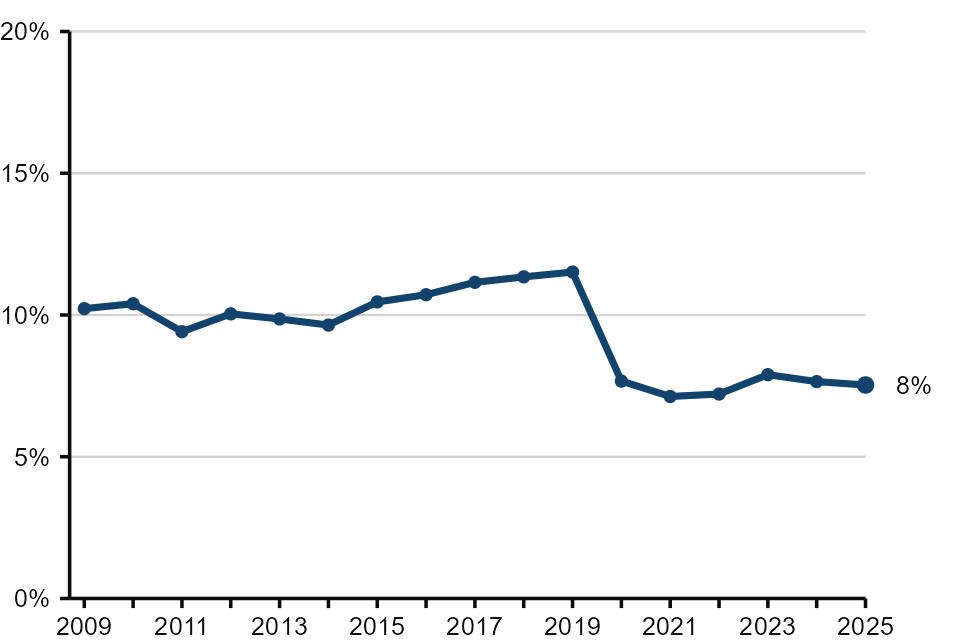
In the People Survey, civil servants were asked ‘Have you been discriminated against at work in the last 12 months?’ (E01). The Civil Service benchmark score for discrimination (those who answered ‘Yes’ to E01) was 7% (Figure 4), the same when compared with 2024.
Figure 4: Experienced discrimination (E01) trend, CSPS median benchmark 2009 to 2025 (access Table 4 (ODS,17KB))
Of the main organisations, the Welsh Government (WG) had the lowest rate of discrimination (5%), while the Foreign, Commonwealth and Development Office (FCDO) had the highest (13%) (Figure 5). HM Treasury (HMT) had the largest increase in respondents answering they had experienced discrimination compared to 2024 (up 2pp).
Figure 5: Experienced discrimination for the main organisations and the percentage point (pp) change compared to 2024 (access Table 5 (ODS,17KB))
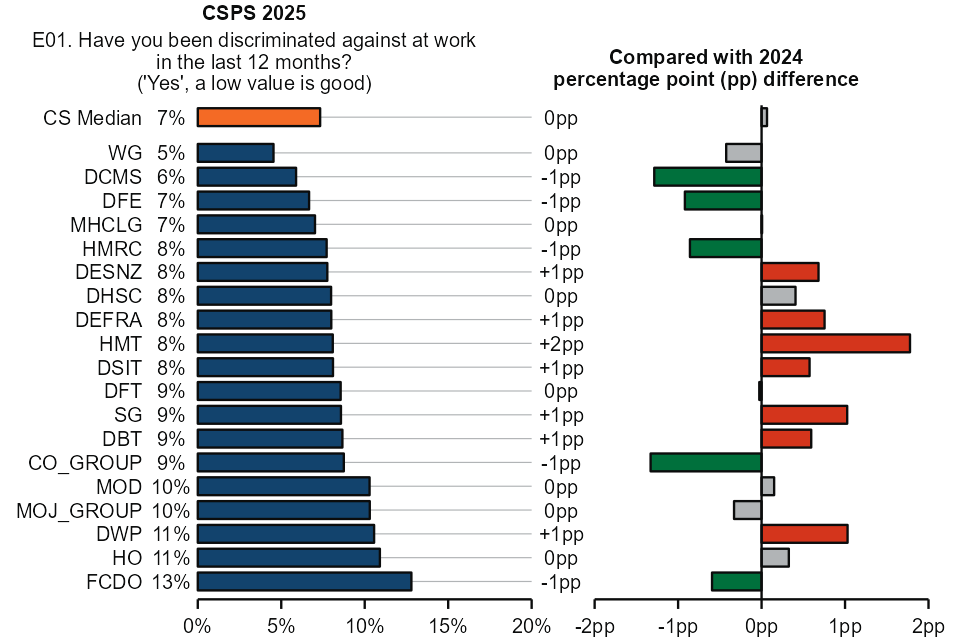
Note: The bars in the chart above are the unrounded values, while the text labels are the rounded values for ease of reading.
Civil servants who reported experiencing discrimination (‘Yes’ to E01) were further asked ‘On which of the following grounds were you discriminated against?’ (E02). The three most common grounds of discrimination, for the Civil Service (median benchmark scores), were ‘Grade or responsibility level’ (25%), ‘Disability’ (19%) and ‘Age’ (16%) (Table 2).
Table 2: 2025 Civil Service median benchmark scores, grounds of discrimination (E02) and the percentage point (pp) change compared to 2024
| Grounds of Discrimination (E02) | CSPS 2025 | Change compared to 2024 (pp) |
|---|---|---|
| ‘Grade or responsibility level’ | 25% | 0 |
| ‘Disability’ | 19% | 0 |
| ‘Age’ | 16% | -1 |
| ‘Gender’ | 15% | 0 |
| ‘Working pattern’ | 15% | 0 |
| ‘Working location’ | 13% | -1 |
| ‘Mental health’ | 13% | 0 |
| ‘Prefer not to say’ | 12% | 0 |
| ‘Ethnic background’ | 11% | +2 |
| ‘Caring responsibilities’ | 10% | -1 |
| ‘Any other grounds’ | 9% | -1 |
| ‘Pay’ | 6% | -1 |
| ‘Social or educational background’ | 6% | +1 |
| ‘Sex’ | 4% | 0 |
| ‘Main spoken, written language or language ability’ | 4% | 0 |
| ‘Pregnancy, maternity or paternity’ | 2% | 0 |
| ‘Religion or belief’ | 2% | 0 |
| ‘Sexual orientation’ | 2% | 0 |
| ‘Marital status or civil partnership’ | 1% | +1 |
| ‘Gender reassignment or perceived gender’ | 0% | 0 |
Bullying and harassment
Bullying can be characterised as:
- Offensive, intimidating, malicious or insulting behaviour
- Abuse or misuse of power in ways that undermine, humiliate, denigrate or injure the recipient
- Bullying can also cover a broad spectrum of covert behaviours that may be more difficult to detect. It can include ill-treatment, interpersonal conflict, unwanted and unacceptable or counter-productive workplace behaviours.
Harassment is unwanted actions or comments that are demeaning and unacceptable to the recipient. It may be related to any personal characteristic of the individual, and may be persistent or an isolated incident.
Reported rates of bullying and harassment continues to stand at 8%
In the People Survey, respondents were asked ‘Have you been bullied or harassed at work, in the past 12 months?’ (E03). The Civil Service median benchmark score for bullying and harassment (for those who answered ‘Yes’ to E03) was 8%, the same when compared to 2024 (Figure 6).
Figure 6: Experienced bullying and / or harassment (E03) trend, CSPS median benchmark 2009 to 2025 (access Table 6 (ODS,17KB))
Of the main organisations, the Welsh Government (WG) had the lowest rate of bullying and harassment (5%), while the Foreign, Commonwealth and Development Office (FCDO) had the highest (12%) (Figure 7). HM Treasury (HMT) had the largest increase in respondents answering they had experienced bullying and harassment compared to 2024 (up 1pp), followed by WG and DWP (also up 1pp, when rounded).
Figure 7: Experienced bullying and / or harassment for the main organisations and the percentage point (pp) change compared to 2024 (access Table 7 (ODS,17KB))
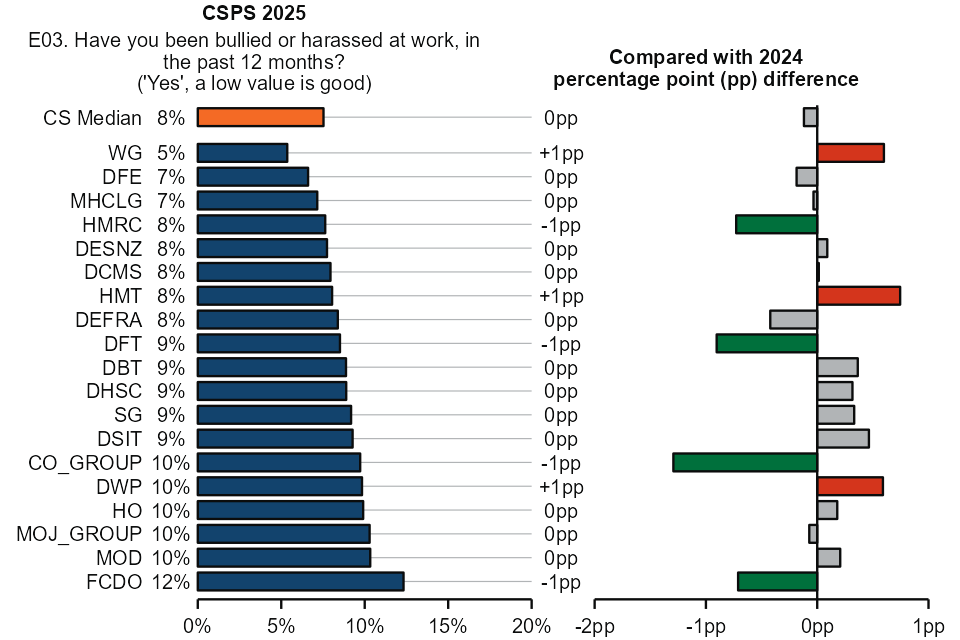
Note: The bars in the chart above are the unrounded values, while the text labels are the rounded values for ease of reading.
The civil servants who reported experiencing bully and harassment (‘Yes’ to E03) were further asked ‘How would you describe the nature of the bullying and or harassment you experienced?’ (E03A). The three most common types of bullying and / or harassment indicated for the Civil Service (median benchmark scores) were ‘Negative micromanagement (for example, excessive control, made to feel incompetent)’ (53%), ‘Treated less favourably to others’ (40%) and ‘Ignored, excluded, marginalised’ (38%) (Table 3).
Table 3: 2025 Civil Service median benchmark scores, types of bullying and harassment (E03A) and the percentage point (pp) change compared to 2024
| Grounds of Discrimination (E03A) | CSPS 2025 | Change compared to 2024 (pp) |
|---|---|---|
| ‘Negative micromanagement (for example, excessive control, made to feel incompetent)’ | 53% | +2 |
| ‘Treated less favourably to others’ | 40% | +1 |
| ‘Ignored, excluded, marginalised’ | 38% | +1 |
| ‘Humiliated in front of team or others’ | 37% | +1 |
| ‘Intimidation, or verbal or written aggression (for example, shouting, making threats, sending aggressive emails)’ | 36% | 0 |
| ‘Removal of job responsibilities, unconstructive criticism, or changing expectations’ | 31% | +1 |
| ‘Undermining or taking credit for my work’ | 29% | +2 |
| ‘Spreading gossip or making false accusations about me’ | 24% | -1 |
| ‘Unhelpful comments about my mental health or being off sick’ | 10% | -1 |
| ‘Disclosure of personal or sensitive information to colleagues without my consent’ | 9% | 0 |
| ‘Comments about my personal appearance or accent’ | 7% | 0 |
| ‘Something else not listed here’ | 7% | 0 |
| ‘Prefer not to say’ | 3% | 0 |
| ‘Sexual harassment (for example, sexual comments or jokes, unwelcome sexual advances, touching or assault)’ | 3% | +1 |
| ‘Denied time off for family or caring responsibilities’ | 2% | -1 |
| ‘Denied time off for personal ill health’ | 2% | 0 |
| ‘Physical assault (for example, object thrown at me, pushed, hit)’ | 0% | 0 |
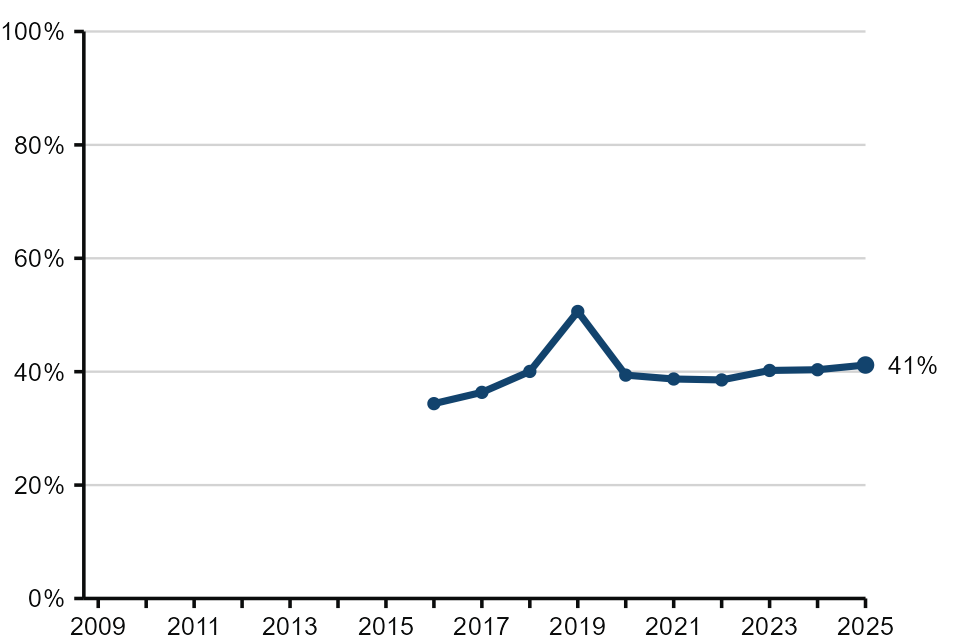
The Civil Service benchmark score for staff that reported their experience of bullying or harassment was 41%
Civil servants who indicated they experienced bullying and / or harassment (‘Yes’ to E03) were further asked ‘Did you report your experience of bullying and harassment?’ (E05). The Civil Service benchmark (median) for staff who said they reported their experienced bullying and / or harassment (41%) was up 1pp when compared to 2024 (Figure 8).
Figure 8: Reported bullying and or harassment (E05) trend, median benchmark score 2016 to 2025 (access Table 8 (ODS,17KB))
Of the civil servants who indicated they reported their experience (‘Yes’ to E05), ‘I reported it in another way, through less formal means’ was the most common response for the way they reported the experience (57%, median benchmark Table 4).
Table 4: 2025 Civil Service median benchmark scores, reporting bullying and harassment (E05A) and the percentage point (pp) change compared to 2024
| How did you report your experience of bullying and harassment? | CSPS 2025 | Change compared to 2024 (pp) |
|---|---|---|
| ‘I reported it in another way, through less formal means’ | 57% | -2 |
| ‘I confided in someone (for example, a colleague)’ | 35% | -1 |
| ‘I raised a formal complaint’ | 20% | +2 |
| ‘In another way’ | 6% | +1 |
Civil servants who reported their experience of bullying and / or harassment (‘Yes’ to E05) were further asked questions focusing on what happened after.
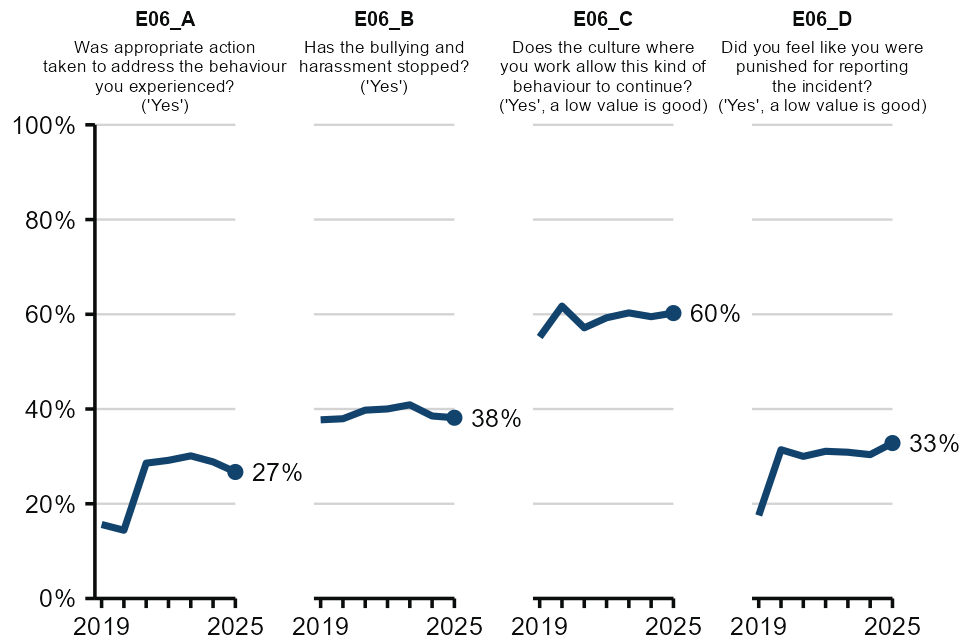
The Civil Service benchmark score for staff indicating that appropriate action was taken to address the behaviour was 27% (down 2pp compared to 2024, Figure 9) and 38% indicated that the behaviour had stopped at the time of completing the survey (the same compared to 2024). The proportion of those who said they felt the culture in their area allowed this behaviour to continue was up 1pp compared with 2024 at 60%. Also, the proportion of those that felt punished for reporting the incident was up 2pp compared with 2024 at 33%.
Figure 9: Civil Service median benchmark scores 2019 to 2025, questions focussed on experiences after bullying and / or harassment was reported (access Table 9 (ODS,17KB))
Cross government priorities
The Civil Service Code sets out how civil servants are expected to carry out their roles with dedication and a commitment to the Civil Service and its core values: integrity, honesty, objectivity and impartiality. In 2025, civil servants were asked three questions relating to the Civil Service code (D01A, D02 and D03).
Civil servants indicated they had a high understanding of the Civil Service code
Civil servants were asked if they agreed with the statement ‘I understand the Civil Service Code and what it means for my conduct’ (D01A). The Civil Service benchmark score was 93% (Table 6) indicating that the vast majority of staff have a good understanding of the Civil Service code. Also the score for knowing how to raise a concern under the code (D02) was 72% (up 3pp compared to 2024). In addition, the benchmark score for confidence that if they raise a concern, it would be investigated properly (D03) was 76%.
Table 6: 2025 Civil Service median benchmark scores for questions relating to the Civil Service Code and the percentage point (pp) change compared to 2024
| Question | CSPS 2025 | Change compared to 2024 (pp) |
|---|---|---|
| D01A. I understand the Civil Service Code and what it means for my conduct (‘Strongly agree’ or ‘Agree’) | 93% | +1 |
| D02. Are you aware of how to raise a concern under the Civil Service Code? (‘Yes’) | 72% | +3 |
| D03. Are you confident that if you raised a concern under the Civil Service Code in [my organisation] it would be investigated properly? (‘Yes’) | 76% | -1 |
One of the priorities for the Civil Service is delivering effectively for the UK citizens, by being open to innovation, ideas and positive transformation. 52% of civil servants believe their senior leaders have a clear vision of the future to transform, modernise and create a citizen-focused tech-enabled organisation; similarly, 74% believe that they would be supported if they tried a new idea to transform how things are done in their organisations.
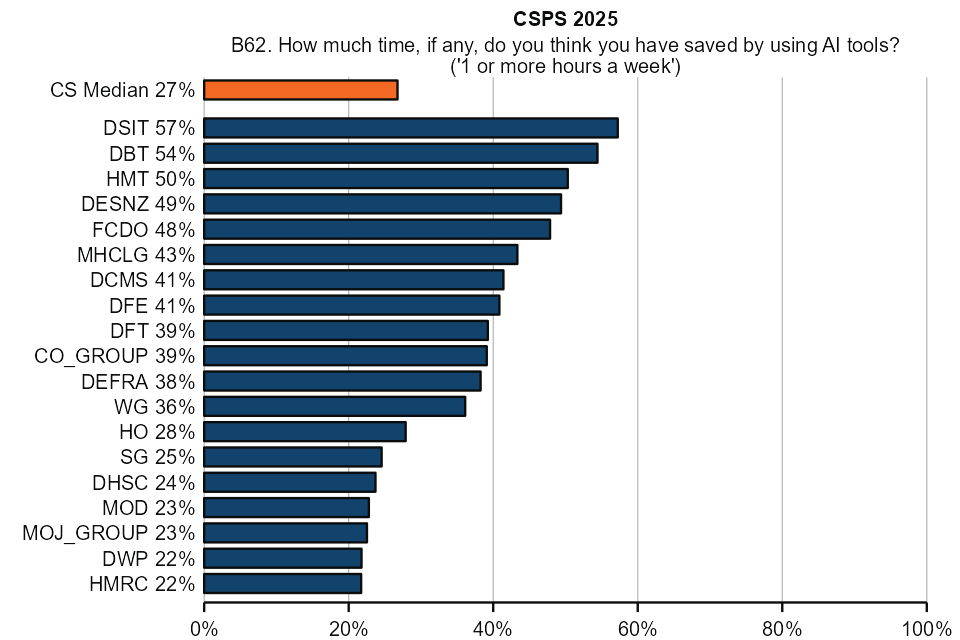
In 2025, civil servants were asked two questions relating to the use of Artificial Intelligence at work (B62 and B63). Staff were asked ‘How much time, if any, do you think you have saved by using AI tools?’ (B62), the benchmark score for staff who indicated one or more hours a week was 27% (Figure 10). Across the main organisations scores varied: the Department for Science, Innovation and Technology (DSIT) had the highest rate for an hour or more a week saved (57%), while HMRC had the lowest (22%), followed by DWP (also 22%, when rounded) (Figure 10) . Civil servants were also asked ‘How likely, if at all, do you think it is that AI will change how you do your current job in the next five years?’ (B63), a high proportion of staff agreed this would be likely (76%, Civil Service median).
Figure 10: Civil Service median benchmark and main organisation scores for ‘one hour or more’ time saved at work through using AI (access Table 10 (ODS,17KB))
Employee wellbeing
The Proxy stress index measures the conditions that contribute to a stressful environment including: demands, control over own work, support, relationships, role in the organisation, and change. A low score is favourable.
The PERMA index measures the extent to which employees are flourishing at work and it is based on five dimensions: positive emotion, engagement, relationships, meaning, and accomplishment. A high score is favourable.
More information about how these indices are calculated can be found in the Quality and Methodology Information Guide.
The wellbeing benchmark scores in 2025 remained stable compared with 2024
While there was no change for the PERMA Index compared to 2025 (74%, Figure 11), there was, however, a 1 percentage point increase for the Proxy stress index (27%) compared to 2024.
Figure 11: PERMA and Proxy stress indexes trend 2009 to 2025, Civil Service median benchmark scores (access Table 11 (ODS,17KB))
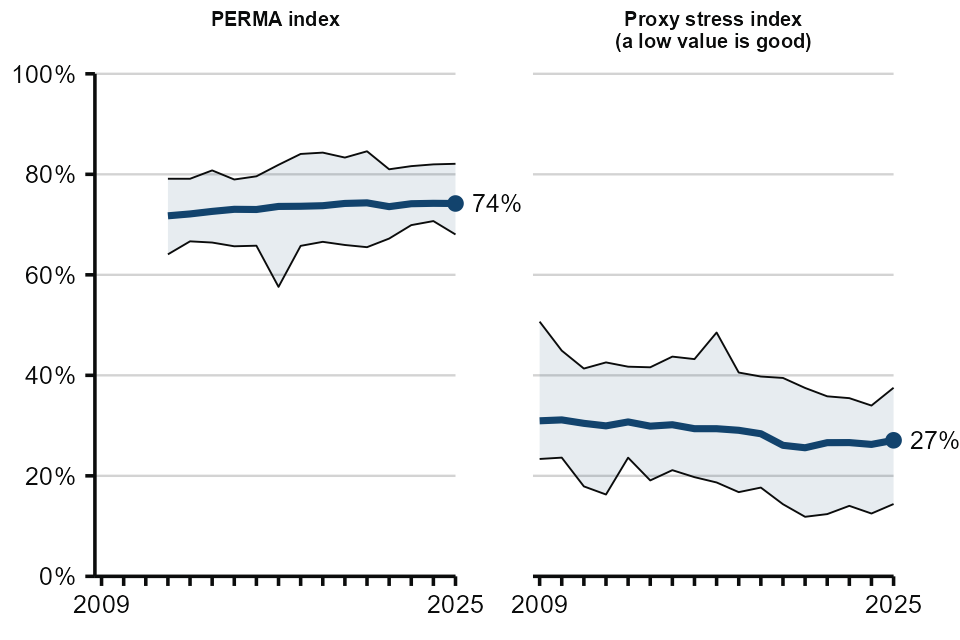
Note: The shaded area shows the range from the lowest score to the highest score of all participating organisations. Also, the PERMA index was first used from 2012.
Employee wellbeing is measured in the Civil Service People Survey via two subjective wellbeing questions, aligned to the Office for National Statistics (ONS), Labour Force and Annual Population Surveys. They cover life satisfaction (W01) and feeling that things in life are worthwhile (W02). The Civil Service People Survey also includes questions on self-assessed ratings of mental (J04B) and organisation support for employee health and wellbeing (W09).
Three of the Civil Service benchmark scores for the personal wellbeing indicators remained stable compared to 2024: self-reported mental health (J04B, 73%), life satisfaction (W01, 68%), and agreeing that the organisation provides good support for employee health, wellbeing and resilience (W09, 60%). The only personal wellbeing indicator that increased compared to last year (up 1pp) was feeling things in life are worthwhile (W02, 72%).
Figure 12: CSPS median benchmark scores 2012 to 2025 for the staff wellbeing questions (access Table 12 (ODS,17KB))
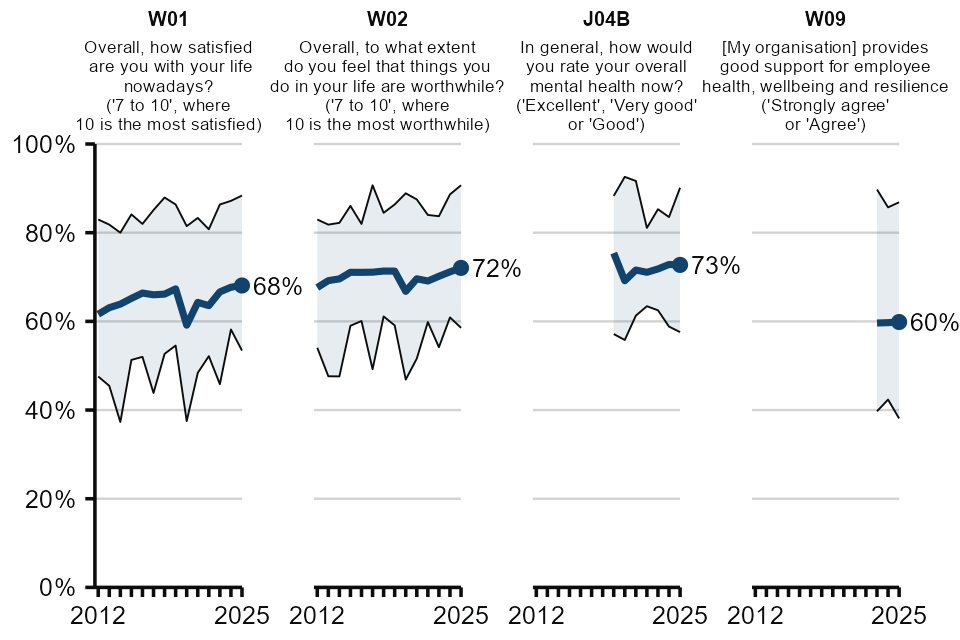
Note: The shaded area shows the range from the lowest score to the highest score of all participating organisations. Also, question J04B was introduced to the survey in 2020 and the question W09 in 2023.
Future intentions
This section covers employees’ intentions in relation to continue working in or leaving their organisation (question C01). This question asked respondents about their future intentions in relation to their current organisation in which they are working and not the Civil Service as a whole. Reasons as to why they would leave (question C02) are also included.
The Civil Service benchmark score for staff saying they would like to leave their organisation was 19%
The Civil Service median benchmark for civil servants’ intention to leave as soon as possible or within the next 12 months was 19%, compared with 2024 (1pp). A full break down of response options for C01 can be found in Figure 13. The means scores for the Civil Service and each participating organisation can be found in Tables 1 and 3 of the Civil Service People Survey 2025 Benchmark Results.
Figure 13: Civil Service median benchmark scores for intention to leave or stay in the organisation (C01) (access Table 13 (ODS,17KB))
| Year | Stay for at least the next 3 years | Stay for at least the next year | Leave within the next 12 months | Leave as soon as possible |
|---|---|---|---|---|
| 2025 | 46% | 35% | 13% | 6% |
| 2024 | 45% | 35% | 14% | 6% |
For civil servants who declared they intend to leave their organisation either as soon as possible or within the next 12 months, the most common reasons for doing so were ‘For a better pay and benefit package’ (39%), ‘A promotion or career progression within the Civil Service’ (36%) and ‘For more interesting work’ (30%) (Table 7). Whilst ‘For a better pay and benefit package’ was the most common reason it did see the largest decrease compared to 2024 (down 5pp).
Table 7: 2025 Civil Service median benchmark score for reasons for intention to leave (C02)
| Reason | Percentage | Change compared to 2024 (pp) |
|---|---|---|
| ‘For a better pay and benefit package’ | 39% | -5 |
| ‘A promotion or career progression within the Civil Service’ | 36% | -1 |
| ‘For more interesting work’ | 30% | -1 |
| ‘Due to poor leadership’ | 30% | +1 |
| ‘Don’t like organisational culture’ | 29% | +2 |
| ‘A promotion or career progression outside of the Civil Service’ | 22% | -1 |
| ‘For a better work-life balance’ | 20% | 0 |
| ‘Due to poor line management’ | 18% | +1 |
| ‘Just want a change’ | 17% | -1 |
| ‘Due to unmanageable workload’ | 17% | 0 |
| ‘Lack of inclusion and fair treatment’ | 15% | -1 |
| ‘Due to poor work relationships’ | 8% | +1 |
| ‘Other’ | 8% | 0 |
| ‘Personal circumstances (for example, caring responsibilities, ill health)’ | 7% | -1 |
| ‘Retiring’ | 7% | 0 |
| ‘End of my current contract or loan’ | 3% | 0 |
Demographic background
The Civil Service People Survey (CSPS) includes demographic questions to explore how the staff experience at work varies by demographic group. This section presents key results for CSPS 2025 by the demographics: sex and gender identity, ethnicity, health status, sexual orientation and socio-economic background (see the five focus files published on our hub). CSPS results by other demographics can be found in the ‘Civil Service People Survey 2025: Results by all demographic groups’ ODS file also published on our hub.
Note: Since this section of the publication presents survey results by the demographic breakdowns of staff, the Civil Service mean scores (all civil servants) are shown in the tables for comparison instead of the Civil Service median benchmark scores (average organisation).
The demographic response counts shown in the tables (‘N’ in the headers) are not workforce statistics and should not, therefore, be used to comment on the composition of the Civil Service workforce. The sum of the demographic response counts will not add up to the total number of staff participating in the survey (343,961). Staff can choose not to answer questions in the survey and the ‘Prefer not to say’ options are not presented in this publication.
Ethnicity
Staff were asked ‘What is your ethnic group?’ (J03). Key survey results by the grouped responses to J03 (‘Ethnic Minority’ and ‘White’) are presented in Table 8.
Table 8: CSPS 2025 summary measures by ethnicity and percentage points (pp) difference compared with 2024
| Demographic group / Measure |
All civil servants (mean) N = 343,961 |
Ethnic Minority N = 47,432 |
White N = 252,576 |
|---|---|---|---|
| Employee engagement index |
61% (0pp) |
68% (+1pp) |
62% (0pp) |
| My work | 79% (-1pp) |
80% (0pp) |
80% (-1pp) |
| Organisational objectives and purpose |
82% (0pp) |
87% (+1pp) |
83% (0pp) |
| My manager | 76% (-1pp) |
79% (0pp) |
78% (-1pp) |
| My team | 80% (-1pp) |
82% (0pp) |
82% (-2pp) |
| Learning and development |
56% (-1pp) |
63% (+1pp) |
57% (-1pp) |
| Inclusion and fair treatment |
78% (-1pp) |
80% (0pp) |
81% (-1pp) |
| Resources and workload |
74% (0pp) |
79% (+1pp) |
75% (-1pp) |
| Pay and benefits (B36) |
40% (+3pp) |
37% (+5pp) |
43% (+3pp) |
| Leadership and managing change |
50% (0pp) |
57% (+2pp) |
51% (0pp) |
| Discrimination (a low value is good) |
9% (0pp) |
11% (-1pp) |
8% (0pp) |
| Bullying and harassment (a low value is good) |
9% (0pp) |
9% (-1pp) |
8% (0pp) |
Compared to 2024:
- The employee engagement index score went up by one percentage point for Ethnic Minority staff (68%) and remained the same for White staff (62%).
- The pay and benefits score (B36) went up 5 percentage points for Ethnic Minority staff (37%) and went up 3 percentage points for White staff (43%).
- The proportion of Ethnic Minority staff who indicated they had been discriminated (responded ‘Yes’ to E01) and bullied and harassed (responded ‘Yes’ to E03) at work went down by 1 percentage point. While the scores for White staff remained the same (both 8% respectively).
More CSPS results by ethnicity can be found in the ‘Civil Service People Survey 2025: Results by ethnicity’ file published on our hub.
Sex and gender identity
Staff were asked ‘What is your sex?’ (J01A) with the response options ‘Female’, ‘Male’ and ‘Prefer not to say’. Key survey results by responses to J01A (‘Female’ and ‘Male’) are presented in Table 9. These data are self reported and may not fully align with the definition of ‘sex’ in The Equality Act 2010.
Staff were also asked ‘Is the gender you identify with the same as your sex registered at birth?’ (J01) with the response options ‘Yes’, ‘No (please enter your gender identity)’ and ‘Prefer not to say’. Key results by ‘Cisgender’ and ‘Transgender / other’ survey respondents are presented in Table 9. For more information about the gender identity classification methodology from the responses to J01, see the Quality and Methodology Information Guide.
Table 9: CSPS 2025 summary measures by sex and gender identity and percentage points (pp) difference compared with 2024
| Demographic group / Measure |
All civil servants (mean) N = 343,961 |
Sex - Female N = 169,003 |
Sex - Male N = 135,281 |
Gender identity - Cisgender N = 308,888 |
Gender identity - Transgender / other N = 1,444 |
|---|---|---|---|---|---|
| Employee engagement index |
61% (0pp) |
64% (0pp) |
62% (0pp) |
63% (0pp) |
56% (-2pp) |
| My work | 79% (-1pp) |
81% (0pp) |
80% (0pp) |
80% (0pp) |
71% (-2pp) |
| Organisational objectives and purpose |
82% (0pp) |
86% (0pp) |
81% (0pp) |
84% (0pp) |
76% (-1pp) |
| My manager | 76% (-1pp) |
78% (-1pp) |
79% (0pp) |
78% (0pp) |
75% (-2pp) |
| My team | 80% (-1pp) |
82% (-1pp) |
81% (-1pp) |
81% (-1pp) |
75% (-2pp) |
| Learning and development |
56% (-1pp) |
59% (-1pp) |
57% (-1pp) |
58% (-1pp) |
54% (-2pp) |
| Inclusion and fair treatment |
78% (-1pp) |
80% (-1pp) |
80% (-1pp) |
80% (-1pp) |
70% (-3pp) |
| Resources and workload |
74% (0pp) |
76% (0pp) |
75% (0pp) |
75% (0pp) |
69% (-1pp) |
| Pay and benefits (B36) |
40% (+3pp) |
45% (+3pp) |
38% (+2pp) |
42% (+3pp) |
34% (0pp) |
| Leadership and managing change |
50% (0pp) |
53% (0pp) |
52% (0pp) |
52% (0pp) |
43% (-2pp) |
| Discrimination (a low value is good) |
9% (0pp) |
9% (0pp) |
7% (0pp) |
8% (0pp) |
20% (0pp) |
| Bullying and harassment (a low value is good) |
9% (0pp) |
9% (0pp) |
7% (0pp) |
8% (0pp) |
16% (0pp) |
Compared to 2024:
- The employee engagement index score remained the same for Female staff (64%) and Male staff (62%).
- The pay and benefits theme (B36) went up three percentage points for Female staff (45%) and up 2 percentage points for Male staff (38%).
- The proportion of Female staff and Male staff who said they had been discriminated against at work (responded ‘Yes’ to E01) remained the same (9% and 7% respectively).
- The proportion of Female staff and Male staff who said they had been bullied and/or harassed at work (responded ‘Yes’ to E03) remained the same (9% and 7% respectively).
- The employee engagement index score remained the same for Cisgender staff (63%) and went down two percentage points for Transgender / other staff (56%).
- The Inclusion and fair treatment theme score went down three percentage points for Transgender / other staff (70%) and down one percentage point for Cisgender staff (80%).
- The proportion of Cisgender staff and Transgender / other staff who said they had been discriminated against at work (responded ‘Yes’ to E01) remained the same (8% and 20% respectively).
- The proportion of Cisgender staff and Transgender / other staff who said they had been bullied and / or harassed against at work (responded ‘Yes’ to E03) remained the same (8% and 16% respectively).
More CSPS results by sex and gender identity can be found in the ‘Civil Service People Survey 2025: Results by sex and gender identity’ file published on our hub.
Health Status - Long-term Limiting Condition (LTLC)
Staff were asked ‘Do you have any physical or mental health conditions or illnesses lasting or expected to last 12 months or more?’ (J04). If staff members responded ‘Yes’ to J04, they were invited to answer ‘Do any of your conditions or illnesses reduce your ability to carry out day-to-day activities?’ (J04A).
- A respondent to the survey was classed as having a LTLC when they indicated they had a physical or mental health conditions or illnesses lasting or expected to last 12 months or more (‘Yes’ to J04) and the health condition(s) or illness(es) affected day to day activities (a ‘Yes’ option to J04A).
- A respondent to the survey was classed as not having a LTLC when they answered ‘No’ to J04 or answered ‘Yes’ to J04 but then indicated the health condition(s) or illness(es)did not affect day to day activities (‘Not at all’ to J04A).
Table 10: CSPS 2025 summary measures by health status (LTLC) and percentage points (pp) difference compared with 2024
| Demographic group / Measure |
All civil servants (mean) N = 343,961 |
Has long term limiting condition, illness or disability N = 65,383 |
No long term limiting condition, illness or disability N = 232,816 |
|---|---|---|---|
| Employee engagement index |
61% (0pp) |
57% (0pp) |
64% (0pp) |
| My work | 79% (-1pp) |
74% (0pp) |
82% (-1pp) |
| Organisational objectives and purpose |
82% (0pp) |
80% (+1pp) |
85% (0pp) |
| My manager | 76% (-1pp) |
73% (0pp) |
80% (-1pp) |
| My team | 80% (-1pp) |
76% (-1pp) |
83% (-1pp) |
| Learning and development |
56% (-1pp) |
51% (-1pp) |
60% (-1pp) |
| Inclusion and fair treatment |
78% (-1pp) |
71% (-1pp) |
83% (-1pp) |
| Resources and workload |
74% (0pp) |
68% (0pp) |
77% (0pp) |
| Pay and benefits (B36) |
40% (+3pp) |
33% (+3pp) |
44% (+3pp) |
| Leadership and managing change |
50% (0pp) |
44% (0pp) |
54% (0pp) |
| Discrimination (a low value is good) |
9% (0pp) |
17% (0pp) |
6% (0pp) |
| Bullying and harassment (a low value is good) |
9% (0pp) |
15% (0pp) |
6% (0pp) |
Compared to 2024:
- The employee engagement index score remained the same for staff that have a LTLC (57%) and for staff that do not have a LTLC (64%).
- The proportion of staff who have a LTLC and staff who do not have a LTLC said they had been discriminated against at work (responded ‘Yes’ to E01) remained the same (17% and 6% respectively).
- The proportion of staff who have a LTLC and staff who do not have a LTLC said they had been bullied and / or harassed at work (responded ‘Yes’ to E03) remained the same (15% and 6% respectively).
More CSPS results by health status can be found in the ‘Civil Service People Survey 2025: Results by health status’ file published on our hub.
Sexual Orientation
Staff were asked ‘Which of the following options best describes how you think of yourself?’ (J07). Key survey results by the grouped responses (‘Lesbian, gay, bisexual or other’ and ‘Straight or Heterosexual’) are presented in Table 11.
Table 11: CSPS 2025 summary measures by sexual orientation and percentage points (pp) difference compared with 2024
| Demographic group / Measure |
All civil servants (mean) N = 343,961 |
Lesbian, gay, bisexual or other N = 24,609 |
Straight or Heterosexual N = 275,315 |
|---|---|---|---|
| Employee engagement index |
61% (0pp) |
59% (-1pp) |
63% (0pp) |
| My work | 79% (-1pp) |
76% (-1pp) |
81% (0pp) |
| Organisational objectives and purpose |
82% (0pp) |
81% (0pp) |
84% (0pp) |
| My manager | 76% (-1pp) |
77% (-1pp) |
78% (0pp) |
| My team | 80% (-1pp) |
78% (-2pp) |
82% (-1pp) |
| Learning and development |
56% (-1pp) |
56% (-2pp) |
58% (-1pp) |
| Inclusion and fair treatment |
78% (-1pp) |
77% (-1pp) |
80% (-1pp) |
| Resources and workload |
74% (0pp) |
72% (0pp) |
76% (0pp) |
| Pay and benefits (B36) |
40% (+3pp) |
39% (+1pp) |
42% (+3pp) |
| Leadership and managing change |
50% (0pp) |
48% (-1pp) |
53% (0pp) |
| Discrimination (a low value is good) |
9% (0pp) |
12% (0pp) |
8% (0pp) |
| Bullying and harassment (a low value is good) |
9% (0pp) |
12% (0pp) |
8% (0pp) |
Compared to 2024:
- The employee engagement index score went down by one percentage point for lesbian, gay, bisexual or other (LGBO) staff (59%) and remained the same for heterosexual staff (63%).
- The proportion of LGBO staff and heterosexual staff who said they had been discriminated against at work (responded ‘Yes’ to E01) remained the same (12% and 8% respectively).
- The proportion of LGBO and heterosexual staff that said they had been bullied and / or harassed at work (responded ‘Yes’ to E03) remained the same (12% and 8% respectively).
More CSPS results by sexual orientation can be found in the ‘Civil Service People Survey 2025: Results by sexual orientation’ file published on our hub.
Socio-economic Background - National Statistics Socio-Economic Classification (NSSEC)
Staff were asked a series of questions about the main income-earner in their household when they were 14 years old (S03 to S06). Based on these questions the National Statistics Socio-Economic Classification (NSSEC) were calculated as the official framework used in the UK to measure socio-economic background.
Table 12: CSPS 2025 summary measures by socio-economic background (NSSEC) and percentage points (pp) difference compared with 2024
| Demographic group / Measure |
All civil servants (mean) N = 343,961 |
Never worked or long term unemployed N = 7,316 |
Routine N = 73,438 |
Intermediate N = 34,016 |
High N = 133,166 |
|---|---|---|---|---|---|
| Employee engagement index |
61% (0pp) |
61% (0pp) |
62% (0pp) |
63% (0pp) |
63% (0pp) |
| My work | 79% (-1pp) |
77% (0pp) |
80% (-1pp) |
81% (0pp) |
81% (0pp) |
| Organisational objectives and purpose |
82% (0pp) |
83% (0pp) |
84% (0pp) |
84% (0pp) |
84% (0pp) |
| My manager | 76% (-1pp) |
76% (0pp) |
78% (-1pp) |
79% (-1pp) |
79% (-1pp) |
| My team | 80% (-1pp) |
78% (-1pp) |
81% (-1pp) |
82% (-1pp) |
82% (-1pp) |
| Learning and development |
56% (-1pp) |
56% (-1pp) |
58% (-1pp) |
59% (-1pp) |
58% (-1pp) |
| Inclusion and fair treatment |
78% (-1pp) |
76% (-1pp) |
80% (-1pp) |
81% (-1pp) |
81% (-1pp) |
| Resources and workload |
74% (0pp) |
72% (-1pp) |
75% (-1pp) |
75% (-1pp) |
75% (0pp) |
| Pay and benefits (B36) |
40% (+3pp) |
38% (+3pp) |
42% (+3pp) |
43% (+3pp) |
43% (+3pp) |
| Leadership and managing change |
50% (0pp) |
50% (-1pp) |
52% (0pp) |
53% (-1pp) |
52% (-1pp) |
| Discrimination (a low value is good) |
9% (0pp) |
14% (+1pp) |
8% (0pp) |
8% (0pp) |
8% (0pp) |
| Bullying and harassment (a low value is good) |
9% (0pp) |
12% (0pp) |
8% (0pp) |
8% (0pp) |
8% (0pp) |
Compared to 2024:
- The employee engagement index scores for staff classed in all NSSEC categories remained the same (ranging 61% to 63%).
- The proportion of staff who said they had been discriminated against at work (responded ‘Yes’ to E01) classed in the ‘Never worked or long term unemployed’ NSSEC category (14%) went up one percentage point. The scores remained the same across all other NSSEC categories (ranging 8% to 13%).
- The proportion of staff classed in all NSSEC categories who said they had been bullied and/or harassed at work (responded ‘Yes’ to E03) remained the same (12% for ‘Never worked or long term unemployed’ and 8% for the other categories).
More CSPS results by socio-economic background can be found in the ‘Civil Service People Survey 2025: Results by socio-economic background’ file published on our hub.
Annex: Background information
Explanatory notes
Rounding
Percentages are displayed as rounded whole numbers for the ease of reading in this report. To ensure the figures are as accurate as possible, rounding takes place at the last stage of any calculation. This does mean you may see the sum of the rounded response options percentages for a question not add up exactly to 100% (plus / minus 1pp). Also, the comparisons between this year and the previous year were calculated using the unrounded percentages and then the percentage point (pp) difference values were rounded. As a result, you may see the rounded percentages for this year and the previous year are both the same but the pp difference plus / minus 1pp. If a percentage point difference was rounded to zero, the percentages being compared were described as being the same in this report. When the percentage scores of the main organisations were ranked from lowest to highest, the unrounded percentages were used. Therefore you may see an organisation ranked lower / higher than another organisation, when the rounded percentages were the same. To find all the percentage scores of this report rounded to three decimal places please see the accompanying Civil Service People Survey 2025 Benchmark Results file.
Civil Service Benchmark
The Civil Service Benchmark is the median score across the 102 organisations who participated in the 2025 survey. We use this measure as our benchmark because it prevents the results from being skewed by a small number of organisations who contribute the largest number of respondents. A small number of question results here, where respondents can choose more than one option, are based on the results for all respondents.
Employee engagement index
The employee engagement index is calculated as a weighted average of the responses to the five employee engagement questions (measuring pride, inspiration, attachment, advocacy, and motivation) and ranges from 0% to 100%. A score of 0% represents all respondents giving a rating of ‘strongly disagree’ to all five questions. A score of 100% represents all respondents giving a rating of ‘strongly agree’ to all five questions.
Theme scores
There are nine core theme scores within the People Survey. Each theme score is based on the average percentage of ‘Strongly agree’ or ‘Agree’ responses to all questions in that theme.
Coverage
Where we refer to the ‘main organisations’, this is the 17 main Whitehall departments plus the Devolved Administrations (Scottish Government [SG] and Welsh Government [WG]). Results are for the core department excluding any agencies, except for the Cabinet Office corporate group, the Ministry of Justice and the Department for Education where the scores are inclusive of staff in executive agencies. The full names for the department codes used in tables are below:
CO_GROUP - Cabinet Office corporate group
DBT - Department for Business and Trade
DCMS - Department for Culture, Media and Sport
DEFRA - Department for Environment, Food and Rural Affairs
DESNZ - Department for Energy Security and Net Zero
DFE - Department for Education
DFT - Department for Transport
DHSC - Department for Health and Social Care
DSIT - Department for Science, Innovation and Technology
DWP - Department for Work and Pensions
FCDO - Foreign, Commonwealth and Development Office
HMRC - HM Revenue and Customs
HMT - HM Treasury
HO - Home Office
MHCLG - Ministry of Housing, Communities and Local Government
MOD - Ministry of Defence
MOJ_GROUP - Ministry of Justice
SG - Scottish Government
WG - Welsh Government