Charitable Giving Indicators 2013/14
Published 27 November 2014

© Crown copyright 2014
This publication is licensed under the terms of the Open Government Licence v3.0 except where otherwise stated. To view this licence, visit nationalarchives.gov.uk/doc/open-government-licence/version/3 or write to the Information Policy Team, The National Archives, Kew, London TW9 4DU, or email: psi@nationalarchives.gov.uk.
Where we have identified any third party copyright information you will need to obtain permission from the copyright holders concerned.
This publication is available at https://www.gov.uk/government/statistics/charitable-giving-indicators-201314/charitable-giving-indicators-201314
1. Indicators
1.1 Background
This release presents both the DCMS impact indicator “Total amount of charitable giving[footnote 1] to DCMS funded cultural institutions” and the input indicator of the “ratio of charitable giving to Grant-in-Aid received by DCMS funded institutions”. The cultural institutions included in this measure are, Arts Council England and their National Portfolio Organisations, British Film Institute, British Library, English Heritage, and the National Museums and Galleries[footnote 2].
1.2 Key Findings
- The impact indicator in 2013/14, which measures total fundraising, was £476m, an increase of £128m from £348m in 2012/13.
- When donated objects are excluded from the impact indicator, the total fundraising was £455m in 2013/14, an increase of £162m from £293m in 2012/13.
- The input indicator in 2013/14, which measures the ratio of fundraising to Grant-in-Aid, was 48.8%, an increase from 33.7% in 2012/13.
- When donated objects are excluded from the input indicator, the ratio of fundraising to Grant-in-Aid was 46.7%, an increase from 28.4% in 2012/13.
To note, the value of donated objects is usually dependent on a small number of high value objects and can vary substantially between years. Figures excluding donated objects show the more stable underlying trend in fundraising.
1.3 Impact Indicator 2013/14
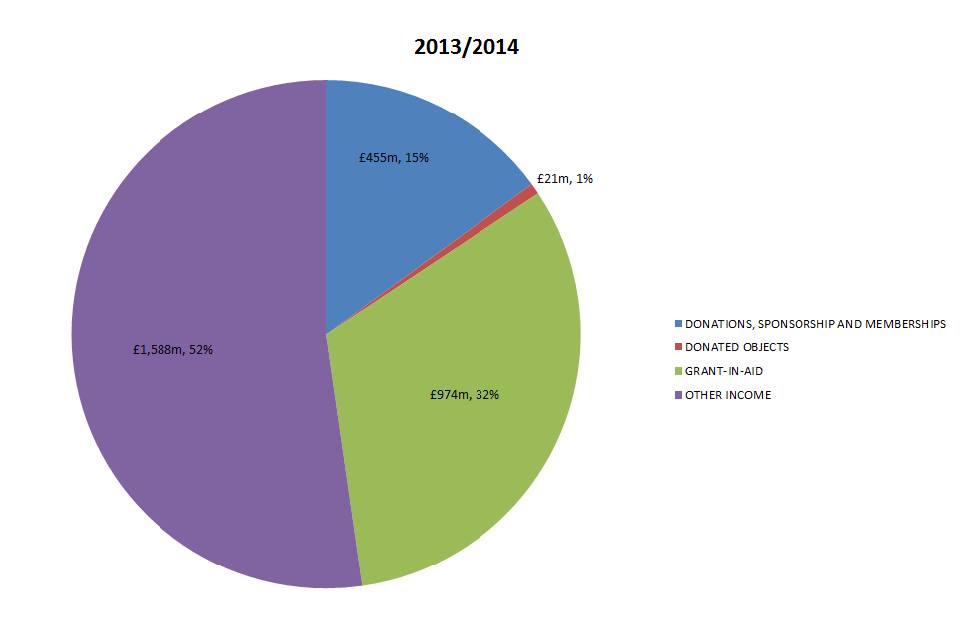
In 2013/14, the cultural institutions funded by DCMS collectively raised £476m in contributed income (as defined in Annex A). £21m of this was from donated objects (4% of all contributed income). A breakdown of this in the context of the total income of these cultural institutions is shown in the chart below. The total income of these bodies in 2013/14 was £3,038m (see Figure 1).
Figure 1: Total income breakdown for DCMS-funded cultural institutions, 2013/14
1.4 Input Indicator 2013/14
The percentage of charitable giving to Grant-in-Aid (input indicator) was 49%. This means for every £1 of Grant-in-Aid received by cultural institutions DCMS fund, these institutions generated around 49 pence in fundraising/contributed income. The significant increase in the input indicator is due to a significant rise in fundraising /contributed income in 2013/14.This may be due to a number of cultural institutions running major fundraising campaigns such as for the British Museums’ new World Conservation and Exhibition Centre or the redevelopment of Tate Modern’s Bankside Power Station redevelopment. Excluding donated objects, the percentage of charitable giving to Grant-in-Aid was 47% (i.e. around 47 pence) in 2013/14.
1.5 Use of Independent Trusts
For some institutions included in this indicator a percentage of donations will be gifted by donors directly into Independent Trusts. Some Trusts then donate to institutions upon receiving a successful grant application. In these cases the indicator captures the donation when a Trust donates to an institution.
1.6 Change since 2008/09
Table 1: Charitable Giving Input and Impact indicators 2008/09 to 2013/14
| 2008/09 | 2009/10 | 2010/11 | 2011/12 | 2012/13 | 2013/14 | |
|---|---|---|---|---|---|---|
| Total Fundraising (Impact indicator) | £304m | £236m | £250m | £357m | £348m | £476m |
| Total Fundraising (Excluding donated objects) | £204m | £218m | £234m | £274m | £293m | £455m |
| Total DCMS Grant-in-Aid | £1,064m | £1,077m | £1,047m | £994m | £1,032m | £974m |
| Ratio of Fundraising to Grant-in-Aid (Input indicator) | 28.6% | 21.9% | 23.9% | 35.9% | 33.7% | 48.8% |
| Ratio of Fundraising to Grant-in-Aid (Excl. donated objects) | 19.1% | 20.2% | 22.3% | 27.6% | 28.4% | 46.7% |
To note, data are in current prices and have not been adjusted for inflation.
The value of donated objects has had a substantial variation over time. Previously, it contributed up to almost a third of total fundraising in 2008/09, but in 2013/14 contributed 4%, the lowest proportion since 2008/09. This variation is largely due to a small number of high value donations (see Figure 2 & Figure 3 below).
Therefore the percentage of funding to Grant-in-Aid (Impact indicator) has fluctuated over time. The percentage of Fundraising to Grant-in-Aid excluding donated objects has increased steadily over time but this year has seen a sharp increase, and is currently at its highest level (46.7%) (see Table 1 above).
1.7 Further Detail
A published table with individual breakdowns by cultural institutions accompanies this report. Individual breakdowns have been included for transparency purposes, to show how the totals were calculated, and are not reported for comparisons between cultural institutions.
Figure 2: Total income breakdown for DCMS-funded cultural institutions over time (current prices)
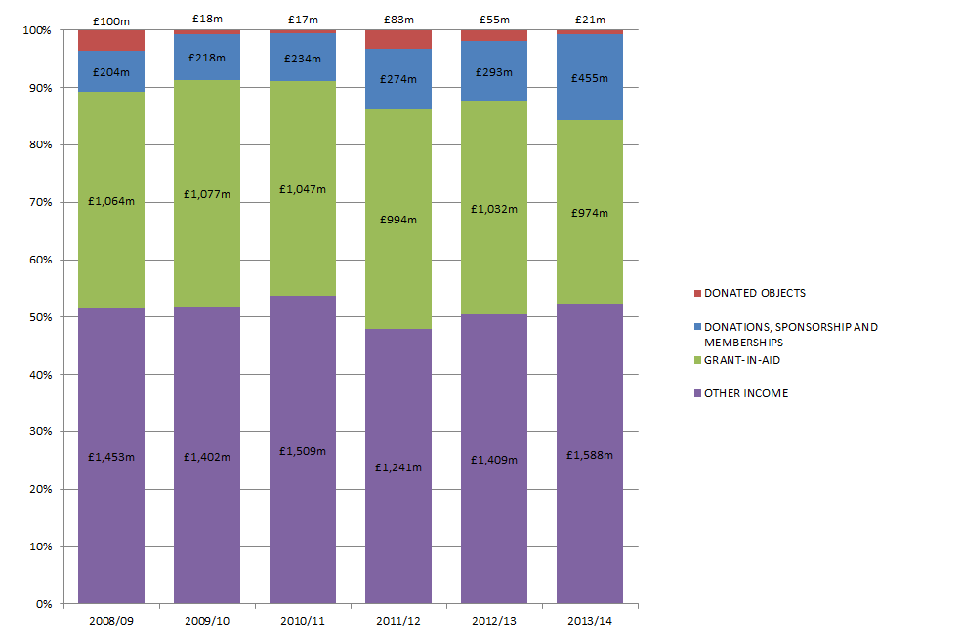
Figure 3: Total charitable giving for DCMS-funded cultural institutions 2008/09 - 2013/14 (current prices)
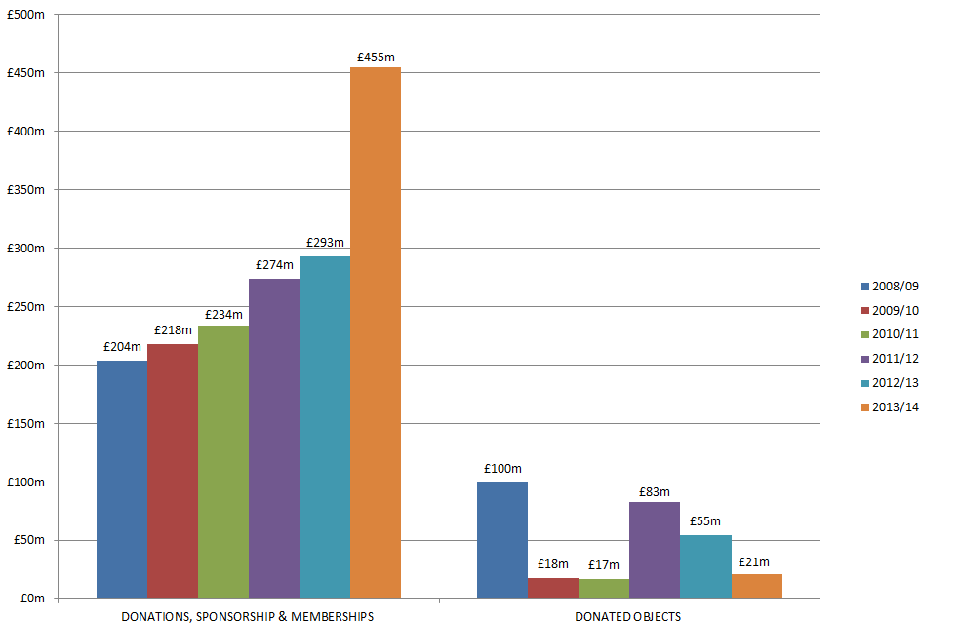
Since 2008/09 to 2013/14, cultural institutions DCMS fund have collectively raised £1,494m in fundraising/contributed income.
2. Annex A: Technical Note
Charitable Giving Indicators is an Official Statistic and has been produced to the high professional standards set out in the Code of Practice for Official Statistics. For more information, see the Code of Practice.
Charitable Giving Indicators are part of a series of DCMS Performance Indicators. These are split into input and impact indicators. Impact indicators give information on the outcomes of our work.
Input indicators show what is being ‘bought’ with public money, ie the resources being invested into delivering the results that we and our partners are aiming to achieve. They reflect the quality and effectiveness of the programmes and priorities set out in our business plan. See our performance.
2.1 Definition
Fundraising/contributed income is defined as any money or gift received from an individual, charity or private company in one of the following forms: bequests, legacies, donations and capital grants from individuals, charities, foundations, trusts and private companies; income raised through sponsorship and income from membership schemes. This does not include any money received from a publicly funded organisation, central government grants, investment income or lottery grant funding. We have summarised this in the table below:
| Donations, legacies, bequests and similar income | Included |
| Donated objects | Included, but identified separately |
| Trading income | Not Includeda |
| Sponsorship | Included |
| Investment income | Not Includeda |
| Admissions & exhibition fees | Not Includeda |
| Other income | Not Includeda |
| Development funds | Not Includeda |
| Donations from connected charities + Other donations | Included |
| Capital grants and donations (not from public bodies) | Included |
| Membership schemes | Included |
| Activities for generating funds | Not Includeda |
Notes
a All “not included” would be categorised as other income in Figure 1.
Cultural Institutions Included in the Indicator
| British Museum | Royal Armouries |
| Geffrye Museum | Sir John Soane’s Museum |
| Horniman Museum | Tate Gallery |
| Imperial War Museum | Victoria and Albert Museum |
| National Gallery | Wallace Collection |
| National Maritime Museum | English Heritage |
| National Museums Liverpool | British Library |
| Science Museum Group | Arts Council England Regularly Funded Organisations |
| National Portrait Gallery | Arts Council England |
| Natural History Museum | British Film Institute |
2.2 Sources
The data used to calculate these indicators are from submissions made by relevant cultural institutions and individual statutory accounts. DCMS Annual Report and Accounts is used for figures relating to Grant-in-Aid funding. This excludes other public funding such as Strategic Commissioning, the Wolfson Foundation fund, and grants to the National Historic Ships Committee.
The data source used for the Arts Council England’s National Portfolio Organisations (NPO) (formerly known as Regularly Funded Organisations) is based on the NPO annual submission. The figures reported are from the full sample in 2008/09 (850 RFOs), 2009/10 (836 RFOs), 2010/11 (829 RFOs), 2011/12 (832 RFOs), 2012/13 (696 NPOs) and 2013/14 (701 NPOs) for “Contributed income, which includes sponsorship, trusts and donations”.
2.3 Caveats
For a full list of caveats please see the notes under the published data table that accompanies this release.
The responsible policy officer for this release is Catherine Mardell, catherine.mardell@culture.gsi.gov.uk, and the responsible statistician is Madeleine May, madeleine.may@culture.gsi.gov.uk.
Next Release: the next release is scheduled for Autumn 2015 and will present the annual estimates for 2014/15.
Department for Culture Media and Sport
4th Floor, 100 Parliament Street
London
SW1A 2BQ