Changes to Ofsted’s statistical reporting of inspection outcomes for state-funded schools: main findings
Updated 18 August 2020

© Crown copyright 2020
This publication is licensed under the terms of the Open Government Licence v3.0 except where otherwise stated. To view this licence, visit nationalarchives.gov.uk/doc/open-government-licence/version/3 or write to the Information Policy Team, The National Archives, Kew, London TW9 4DU, or email: psi@nationalarchives.gov.uk.
Where we have identified any third party copyright information you will need to obtain permission from the copyright holders concerned.
This publication is available at https://www.gov.uk/government/statistics/changes-to-ofsteds-statistical-reporting-of-inspection-outcomes-for-state-funded-schools-an-analysis-of-the-changes/changes-to-ofsteds-statistical-reporting-of-inspection-outcomes-for-state-funded-schools-main-findings
This release contains details of the impact of the changes to the statistical reporting of inspection outcomes. We held a public consultation on the changes from November 2017 to January 2018.
The inspection outcomes of around 700 extra schools have been added to the most recent dataset.
The latest inspection details of 702 extra schools have been added into the most recent datasets. These are mostly new sponsor-led academies that have not yet been inspected as academies.
There is a clear trend of improvement in the sector since 2010, with the new methodology resulting in a slightly lower proportion of good and outstanding schools in each year
Back series have been re-calculated on a like-for-like basis and the pattern of a yearly increase in the proportion of good and outstanding schools remains. The proportion of schools currently judged good or outstanding has reduced from 88% with the previous methodology to 86% with the new methodology. The impact is greatest for secondary schools and pupil referral units (see Figure 1).
Figure 1: Proportion of schools judged good and outstanding as at 31 March 2018, before and after the methodology change

Secondary schools and pupil referral units have seen the biggest changes with the proportion of good and outstanding secondary schools dropping from 80% to 76% and the proportion of good and outstanding pupil referral units dropping from 87% to 83%
1. Introduction
From 30 November 2017 to 18 January 2018, Ofsted consulted on changes to our statistical reporting of school inspection outcomes. The full consultation document provides an analysis of the responses. The aim of the changes was to make Ofsted’s school inspection outcomes data more comprehensive and accessible.
The proposed changes were:
- to include in our data, where possible, the grades (from the predecessor schools) of schools that have not yet been inspected in their current form
- to present grades from the predecessor schools (of schools that have not yet been inspected in their current form) as a new row in the chart that shows outcomes by type of school (chart 6 of the Excel file accompanying the official statistics for state-funded schools)
- to remove university technical colleges and studio schools from the ‘sponsor-led academy’ category, creating 2 new categories for these types of schools, and keeping them in the general ‘all academies’ and ‘all types of school’ categories
- to change the name of future official statistics and management information releases to refer to ‘state-funded schools’ rather than ‘maintained schools and academies’
The responses to the consultation supported the proposals so we have implemented the proposed changes in full. These changes affect the official statistics publications from June 2018, and the management information publications from July 2018.
This document and the Excel file accompanying this release analyse the impact that the methodology changes have had on the data. We have analysed the data to 31 March 2018, under both the previous and new methodologies. This allows us to see the impact of the methodology changes separately to the impact of any changes in the sector and the outcomes of recent inspections.
This analysis of the impact of the changes is a one-off publication; it contains analysis of the impact on current data as well as data at the end of each academic year going back to 31 August 2010. It is being published on 26 June alongside the standard official statistics publication State-funded schools inspections and outcomes as at 31 March 2018. The standard publication is also based on the new statistical methodology. It includes details of the outcomes of inspections carried out between 1 September 2017 and 31 March 2018, and changes since the previous publication.
2. The inspection outcomes added in to the dataset
The main change following the consultation is to include the inspection outcomes of predecessor schools in our statistical reporting, where schools have not yet been inspected in their current form (under their current URN).
Under the old methodology the inspection outcomes of predecessor schools were only included for schools that kept the same LAESTAB when they became the new school, but not for schools that had a new LAESTAB. In general this meant that academy converters kept their inspection history while sponsor-led academies did not. Inspection outcomes were included in the dataset once the new school had its first inspection as the new school.
The official statistics dataset included a list of all open schools (around 22,000 schools), but the latest inspection outcomes were missing for around 1,000 of these schools. Following the methodology change the latest inspection outcomes of 702 schools have now been added into the dataset. This means that 3% more schools now have a latest inspection outcome reported, both in the underlying dataset and in all associated analysis.
Ninety-three per cent of these additional schools are sponsor-led academies. Eighty-five per cent of the schools were judged to require improvement or to be inadequate at their most recent inspection.
There are still 276 schools in the dataset that have no inspection details available. Most of these are entirely new schools (such as free schools) that have been open for less than 3 years.
3. Inspection outcomes for all schools
As a result of the methodology change the proportion of schools judged good or outstanding at their most recent inspection is now slightly lower. Before the changes and under the previous methodology, 88% of all schools were good or outstanding (conducted by 31 March 2018 and published by 30 April 2018). Bringing in the inspections of predecessor schools not yet inspected in their current form reduces this to 86% of schools judged good or outstanding. The proportion of schools judged inadequate has increased from 2% to 4%, while the proportion judged to require improvement has remained at 10%.
Figure 2: Most recent overall effectiveness of schools (percentage), as at 31 March 2018

Most recent overall effectiveness of schools shows the same general pattern both before and after the methodology changes
4. Inspection outcomes by phase
In terms of school phase, the changes have the most impact on secondary schools and pupil referral units. The proportion of secondary schools judged good or outstanding drops by 4 percentage points from 80% to 76%, and for pupil referral units it reduces from 87% to 83%. Secondary schools and pupil referral units are also the phases that have had proportionally the most schools added in to the dataset (6% and 4% more schools added respectively).
Table 1 shows the impact of the changes on the proportion of good and outstanding schools by phase.
Table 1: impact of the changes on the proportion of good and outstanding schools by phase
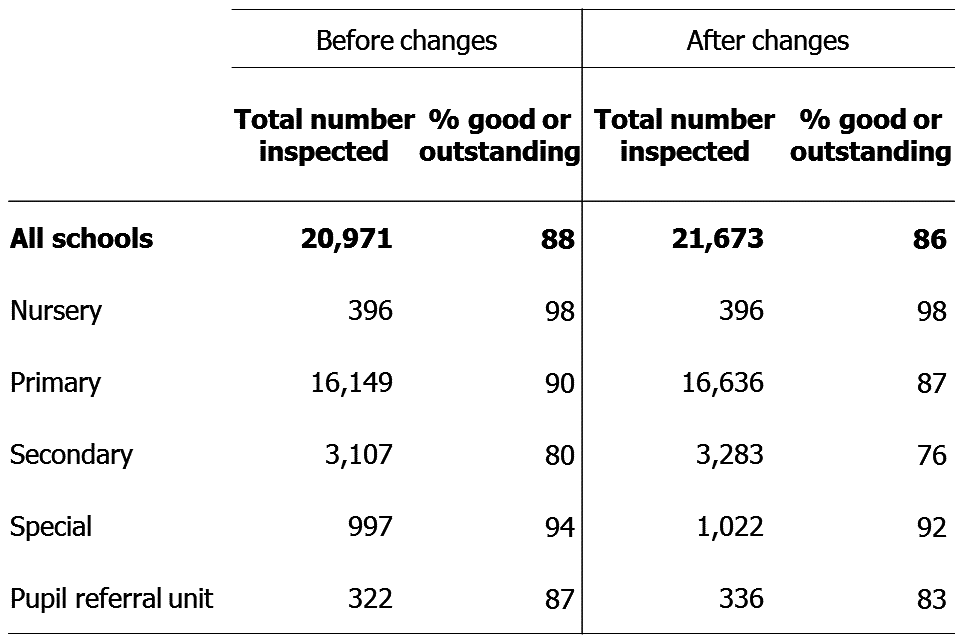
Changes impact on all school phases with the exception of nurseries
5. Inspection outcomes by type of school
Looking at the impact by school type shows little difference in the grades by school type before and after the methodology changes. The ‘all types of education’ summary figure (shown in Table 2) sees a drop in the percentage judged good and outstanding, as this now includes the schools not yet inspected in their current form.
Table 2: Impact of the changes on the proportion of good and outstanding schools by type of school

Three new school types are now shown - studio schools, university technical colleges and schools not inspected in their current form
You can view the new groupings of school types in Table 2 within chart 6 of the Excel file accompanying this release. A mock-up of this chart was included in the consultation, which proposed that the additional schools added to the data were shown as a new group. The consultation also proposed showing studio schools and university technical colleges as separate groups. The inspection outcomes of the predecessor schools of converter academies were already included in the converter group (as these schools usually keep the same leadership, site, and pupils when they convert), and the consultation did not propose to change that.
Removing studio schools and university technical colleges from the sponsor-led academy group, to show them as separate groups, means the number of schools in the sponsor-led category is smaller.
Within the academy converter group, a small number of schools that had changed their LAESTAB when they were rebrokered in to a new multi academy trust have now been added in to the data. Over 2,900 of the inspection judgements for converter academies are of the predecessor local authority maintained school. Around 850 of these are outstanding judgements for primary and secondary schools, which are exempt from routine inspection and will only be inspected if there are concerns about the school.
6. Inspection outcomes across the country
The impact of the changes varies around the country. The scale of the change is generally due to a combination of the number of schools that were missing from the data before the changes and the grades of the schools that have now been added to the data. The number of schools missing from the data is in turn largely related to how many sponsor-led academies there are in the area, and how many have opened in the last few years.
When looking at the impact by Ofsted region, the East of England sees the biggest change. This region had the highest number of schools added in (164 schools). In the East of England the proportion of good and outstanding schools drops by 4 percentage points to 86% (rounded proportions). The smallest impact is seen in the North West where the proportion of good and outstanding schools falls by just one percentage point and the fewest schools were added in (52 schools).
Table 3 shows the impact of the changes on the proportion of good and outstanding schools by region.
Table 3: Impact of the changes on the proportion of good and outstanding schools by region

All regions have been affected by the changes, with the East of England being most and the North West being least affected
Looking at the impact by local authority area shows more pronounced differences due to the lower numbers of schools in each area. In some areas there have been large percentage changes to the proportion of the schools judged good or outstanding, but they are driven by changes within a small numbers of schools, and should be viewed with caution.
Fourteen local authority areas have seen a fall in the percentage of schools judged good or better by at least 5 percentage points. For secondary schools (where the number in each area is often fairly small), 49 areas have seen a fall of 5 percentage points or more.
The local authority area with the largest reduction in the proportion of good and outstanding schools following these changes is Wolverhampton, where the proportion drops by 10 percentage points, to 80%. This is due to the inspection judgement of thirteen additional schools being brought through, twelve of which are less than good.
The local authorities with the highest number of school inspection outcomes brought through are Essex with 40 schools and Norfolk with 44. As these are large local authorities with many schools, the changes are not as pronounced as in some smaller local authority areas (4% drop in good and outstanding in Essex and 6% in Norfolk).
A table showing the numbers of schools inspected and the proportion good and outstanding before and after the changes can be found in the Excel file accompanying this release.
7. Historical data and the trend over time
Chart 5 of the official statistics for state-funded schools contains details of the most recent inspections at 31 August of previous years. As part of the changes, we have updated the historical datasets to reflect the position at the end of each year using the new methodology. This has been completed for each year from 31 August 2010 to 31 August 2017. This revised data will also be used to update Ofsted’s data visualisation tool Data View.
The number of inspections added into the datasets decreases each year from the current dataset, going back to 31 August 2010 (see Table 4). This is due to the increase in the number of academies over time, plus Ofsted’s policy on the timing of the first inspection of new schools. These factors led to a growing number of schools being missing from the datasets.
Table 4: Inspections added into datasets at each point in time
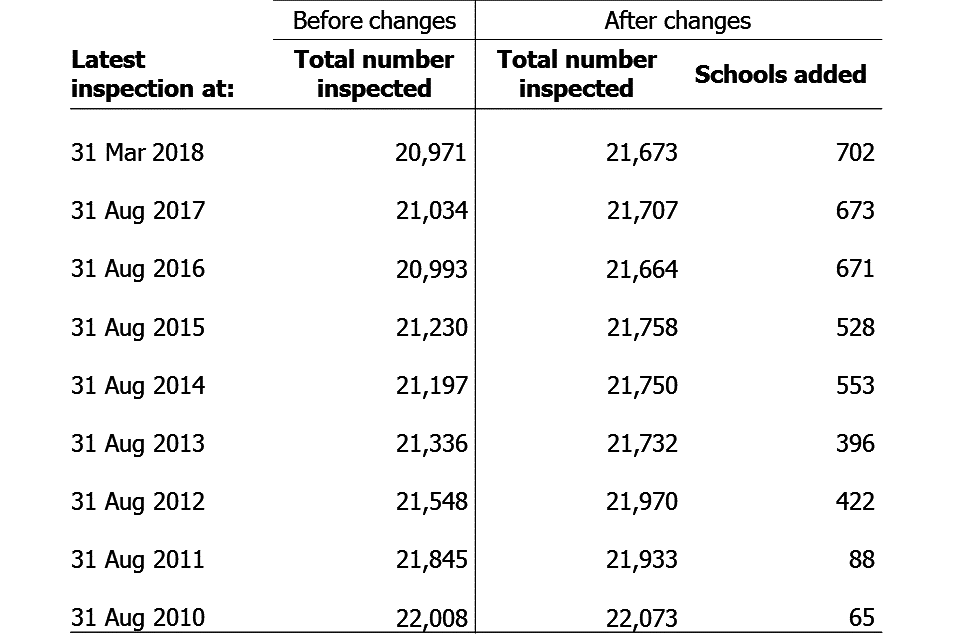
65 additional schools have been added to the data from 2010, increasing to 702 schools added in to the most recent data at March 2018
The overall picture of a steady increase in the proportion of good and outstanding schools over time seen before the changes has remained consistent after the changes (see Figure 3).
Figure 3: Proportion of schools judged good and outstanding, at the end of each academic year

The proportion of schools judged good and outstanding from 31 August 2010 to 31 March 2018 has increased steadily under both previous and new methodologies
8. Contextual information on the schools with inspections added in to the datasets
There are 702 schools that have had their latest inspection details added into our reporting as a result of these changes. Previously the latest inspection details will have displayed as ‘NULL’ in our datasets and had therefore been omitted from any reporting at any aggregated levels and in any charts or tables.
As suggested in the consultation, the overwhelming majority (93%) of these are sponsor-led academies that have not yet been inspected as academies. The next largest school type is academy converters which make up 6% of the 702 schools. The vast majority of these are converter academies that have rebrokered between academy trusts and changed LAESTAB and URN in the process. The changes mean that the previous inspection judgements of these converters before being rebrokered are now displayed.
The remaining one per cent of these schools is made up of 4 free schools, one studio school, one university technical college and 4 local authority maintained schools.
The 702 schools are not distributed evenly across the 8 Ofsted regions. Nearly a quarter (23%) are in the East of England with just 7% in the North West and 9% in the South West. This will largely reflect the distribution of schools that have become sponsor-led academies within the last 3 years.
Over two-thirds of the 702 schools are primaries (69%), a further quarter are secondaries and the remainder are pupil referral units and special schools. Secondary schools are slightly over-represented when compared to the national picture where 77% of schools are primary and 15% are secondary. This is likely to be due to the higher proportion of secondary schools that are sponsor-led academies (20% of secondaries are sponsor-led compared to 8% of primary schools).
Over half (371) of the 702 latest inspections brought into the datasets have an overall effectiveness judgement of inadequate, with an additional 32% being requires improvement. Just 15% of the judgements brought in are good, and only 3 outstanding judgements have been added in. This is consistent with the fact that a high proportion of the outcomes added in are for the predecessor schools of sponsor-led academies, which had generally been weak local authority schools in the past.
The changes also add in the previous full inspection and short inspection details for schools where the previous or short inspections were not of the school in the current form. Ninety five short and 1,497 previous full inspection details have now been brought through to the underlying dataset.
The short inspections have been brought through where schools that have had a short inspection have since closed and academised. We normally only refer to short inspections in the current academic year in our analysis, and the short inspection details newly brought through are from before the 2017 to 2018 academic year, so this should have little impact on our reporting.
There are a higher number (1,497) of previous inspections brought through than latest inspections (702). This is because there were new schools that have been inspected once since becoming the new school (so had a latest inspection in our dataset already), but have not been inspected twice (and therefore did not have a previous inspection as a sponsor-led academy in our data). These inspection details are now shown in the underlying school level data.
9. Further detail of how the changes were made
The schools that are not sponsor-led academies that have had the inspection details of a predecessor school brought in as a result of these changes will usually be where schools have lost their inspection history due to a change in their LAESTAB and URN. Schools can be assigned a new LAESTAB and/or URN when they undergo a significant change, such as adding a key stage or changing their religious denomination. Any inspection history linked with these LAESTABs and URNs will therefore be lost. The changes made will re-establish the link between these schools and their previous inspections.
There are still circumstances where schools will not have their inspection history brought through. These will usually be where multiple schools merge to form a new school and acquire a new LAESTAB and/or URN in the process. In these instances as there are multiple predecessor schools, and no clear ‘lead’ school, it is not possible to return a single inspection history for the new school. However if schools merge and the new school inherited the URN of one of the predecessor schools, then this is an indication that the new school shares key characteristics of that school, and the inspection history of that school has been pulled through.
10. Notes
These statistics have been produced to explain the changes in Ofsted’s methodology in the presentation of schools inspection outcomes in our statistical reporting. The statistics explain the process and the impact of the changes. They are important in cataloguing this change in Ofsted’s statistical reporting on schools inspection from June 2018 onwards.
The statistics are released alongside Ofsted’s official statistics on state-funded schools as at 31 March 2018, which is the first schools official statistics release incorporating the change in methodology.
Ofsted’s quality and methodology report for schools official statistics includes more detailed information about methods, quality and any sources of error and bias, and assurance arrangements.
The supporting datasets for this publication include:
- two versions of the ‘Latest inspections as at 31 March 2018’ school level dataset – one from before and one after the methodology changes
- copies of the affected official statistics charts and tables, showing the position before and after the changes
- updated datasets for the end of each academic year from 31 August 2010 to 31 August 2017, recalculated using the new methodology
- additional analysis showing the impact of the changes at regional and local authority level, over time.
11. Glossary
11.1 Academies
Academies are publicly funded independent schools. Academies do not have to follow the national curriculum and can set their own term times. They still have to follow the same rules on admissions, special educational needs and exclusions as other state schools.
Academies get money directly from the government, not the local authority. They are run by an academy trust, which employs the staff. Some academies have sponsors such as businesses, universities, other schools, faith groups or voluntary groups. Sponsors are responsible for improving the performance of their schools.
Academies include converter and sponsor-led academies, free schools, university technical colleges and studio schools.
11.2 Academy converters
Academy converters are schools which have opted to become an academy, most of which were good or outstanding local authority maintained schools before they became an academy.
Academy converters retain their latest inspection grade, even if the most recent inspection was of the predecessor school.
11.3 Sponsor-led academies
Sponsor-led academies are academies which have sponsors such as businesses, universities, other schools, faith groups or voluntary groups. Sponsors are responsible for improving the performance of their schools.
Sponsor-led academies are viewed as new legal entities and do not retain their inspection history.
11.4 Free schools
Free schools are funded by the government which are not run by the local authority. They are set-up on a not-for-profit basis by charities, universities, and community and faith groups, among others.
Free schools are ‘all-ability’ schools, so cannot use academic selection processes like a grammar school. They can set their own pay and conditions for staff and change the length of school terms and the school day. Free schools do not have to follow the national curriculum.
11.5 Local authority maintained schools
Maintained schools are funded by the government and run by the local authority. They must follow the national curriculum.
11.6 Short inspections
Most good schools now receive short inspections, as do outstanding nursery, pupil referral units and special schools. Short inspections are a one-day inspection visit and take place approximately every three years. A short inspection determines whether the school continues to provide the same good or outstanding standard of education for pupils. A short inspection does not result in individual graded judgements nor does it change the overall effectiveness grade of the school. If the school shows significant decline, a short inspection is converted to a full inspection, where inspectors will make the full set of graded judgements required under section 5.
From November 2017, around 20% of previously good schools are now subject to a full section 5 inspection instead of a short inspection, where our risk assessment tells us that a short inspection would be highly likely to convert. For example where a school underwent significant change, such as changing its age range, or where the quality of provision may have deteriorated significantly.
From January 18 short inspections are only converted to a full inspection where there are serious concerns. Where a short inspection does not convert, there are additional outcomes where the school remains either good or outstanding but the next inspection will be a section 5 inspection.
12. Further information
If you have any comments or feedback on this publication, please contact Louise Butler on 03000 131 457 or inspection.insight@ofsted.gov.uk.
12.1 Acknowledgements
Thanks to the following for their contribution to this statistical release: Oli Bayntun, Austen Norris, James Jordan, Lorena Ojeda Gomez.