Annual report on the operation of the UK internal market 2023 to 2024
Published 20 March 2024

© Crown copyright 2024
This publication is licensed under the terms of the Open Government Licence v3.0 except where otherwise stated. To view this licence, visit nationalarchives.gov.uk/doc/open-government-licence/version/3 or write to the Information Policy Team, The National Archives, Kew, London TW9 4DU, or email: psi@nationalarchives.gov.uk.
Where we have identified any third party copyright information you will need to obtain permission from the copyright holders concerned.
This publication is available at https://www.gov.uk/government/publications/annual-report-on-the-operation-of-the-uk-internal-market-2023-to-2024/annual-report-on-the-operation-of-the-uk-internal-market-2023-to-2024
OIM Panel Chair’s foreword
I am pleased to present the OIM’s second annual report, covering developments in the UK internal market from April 2023 to March 2024.
I am particularly delighted to welcome the appointment of the OIM Panel, to join our work in considering the effective operation of trade between the UK nations. The Panel members have a wealth of experience from across the UK and I very much look forward to working with them. Appointment of the Panel coincided with the development of this report, and we are grateful for their input and insight into our statutory reporting.
In my foreword to last year’s report, I noted the importance of gathering evidence from a wide range of stakeholders to inform our work. Over the past year, the OIM has implemented a regular programme of bilateral and multilateral meetings, to strengthen our relationships with officials in the four governments. I continue to be impressed with the constructive and collaborative approach of officials in the governments and their generosity in providing information and participating in discussions. We remain committed to supporting decision making in the governments with even-handed advice and insight. We look forward to completing further reports for the governments at their request in due course.
Also notable this year is the OIM’s engagement with the legislatures. In June 2023, I was pleased to be invited to give evidence on the OIM’s work to the Legislation, Justice and Constitution Committee of the Senedd Cymru. This was followed in September by an evidence session on the OIM’s first annual report with the Constitution, Europe, External Affairs and Culture Committee of the Scottish Parliament. Most recently, we provided written evidence on the OIM’s remit to the House of Lords Sub-Committee on the Windsor Framework. In June 2023, OIM officials provided an informal in-person briefing to Northern Ireland Assembly Members, and separately briefed Northern Ireland Assembly staff. The OIM is grateful for opportunities to engage with the four legislatures and stands ready to assist with their work.
This report reflects the continued evolution of our thinking in relation to the effective operation of the UK internal market. Alongside our engagement with the governments and legislatures, I have engaged extensively with business groups across the UK. In 2023, I held in-person meetings with business groups in Northern Ireland in January and September, in Wales in March, and Scotland in June. We are also grateful to the many businesses and trade bodies who contributed to the evidence presented in this report. This helpful and open approach by businesses is particularly reflected in the business strategy case studies included in the report. These examine responses to four areas of significant current and emerging regulatory difference between the nations.
Our focus on stakeholder engagement has assisted us to develop our statutory reporting. We noted in last year’s report the emphasis on regulatory developments in relation to goods and the relative lack of change in relation to services sectors or regulated professions. This report includes expanded analysis of both of these areas, to broaden the scope of our work to understand the impacts of the UK Internal Market Act 2020.
Alongside last year’s reports we published our Data Strategy Road Map, setting out initiatives to improve intra-UK trade data. Through the year we have continued to engage with the Office for National Statistics, experts in the devolved nations, the academic community and colleagues working with trade data in other countries, to explore new sources of data and techniques to improve our analysis. We will publish an update to our Data Strategy Road Map in Spring 2024.
We will continue to develop our view of the factors that underpin the effective operation of the UK internal market and welcome feedback on this report.
I would like to extend my thanks to the staff at the OIM and in the wider CMA for their expert and informed work to develop this report and their ongoing support to ensure that the OIM Panel members can contribute effectively to our understanding of the UK internal market.

Murdoch MacLennan, Chair of the Office for the Internal Market Panel
Executive summary
This report is the Office for the Internal Market’s second annual report on the operation of the internal market. It covers the period from April 2023 to March 2024 and builds on our previous work.
Key findings
Drawing on the available data we find little evidence that, over the last year, there has been a substantial change in the functioning of the internal market across the UK. Notwithstanding this, certain sectors, especially food and drink, have seen a more significant build-up of proposed and actual regulatory difference than other sectors.
Trade between Great Britain and Northern Ireland will continue to develop in light of the Windsor Framework, although the nature of these developments remains unclear as the Framework was only partially implemented over the last year, and none of the available trade data covers the period it has been in operation. Furthermore, on 31 January 2024, the UK Government published a Command Paper, “Safeguarding the Union”, that make certain adjustments to the Windsor Framework. We will work with the governments to understand the implications of the Command Paper (and related Statutory Instruments) for our work.
Trade data
Chapter 2 of this report presents our updated analysis on the intra-UK trade data. The trends set out in the 2022 to 2023 annual report remain relatively stable. The internal market continues to be important to the UK nations. Our analysis of trade data produced by the devolved nations shows that intra-UK trade, in 2021, represented roughly between two-fifths and two-thirds of the external sales and purchases of Scotland, Wales and Northern Ireland. Intra-UK trade remains less important for England because of the size of its economy relative to the other nations.
In our 2022 to 2023 annual report, we found that the majority of businesses that trade within the UK do not experience challenges when selling to other UK nations. This is still the case, with the majority of firms responding to the ONS Business Insights and Conditions Survey (BICS) saying that they have not encountered challenges with intra-UK trade.
BICS evidence indicates that businesses in the manufacturing and wholesale and retail trade sectors as well as larger businesses are generally more likely to trade with other UK nations.
In this year’s report, we make use of additional data from BICS and from HMRC, to better understand trade flows between Great Britain and Northern Ireland. BICS data suggests an average of 4.5% of businesses stated they had sent goods from Great Britain to Northern Ireland in the last 12 months. Although this is only a small proportion of all businesses, the value of the trade involved was more significant; the 2021 value of customs declarations associated with these trade flows represented around 24% of Northern Ireland’s GDP. BICS data also shows that less than 2% of businesses sent goods from Northern Ireland to Great Britain in the last 12 months.
We are required to report on the effective operation of the internal market. We noted in the 2022 to 2023 annual report that we use intra-UK trade data as a key indicator, to help understand how the market is working. Data on intra-UK trade remains limited and our analysis provides a comparative overview, using available sources. We remain committed to supporting better trade data, including through the initiatives in our data strategy roadmap. We expect estimates of intra-UK trade covering all four UK nations to be available by autumn 2024. We continue to explore other indicators and will publish an update to our data strategy roadmap later in spring 2024.
Regulatory developments in goods, services and the regulated professions
Chapter 3 considers regulatory developments over the preceding 12 months in relation to goods, services and regulated professions. Over the last year we have seen an increase in the number of potentially differing regulations compared with the previous year in relation to each of goods, services and the regulated professions. Over the last year, the goods sector has seen the most significant developments in regulatory difference within the scope of the UK internal market regime. The goods sector is proportionately more likely to see regulatory difference than the services sector and the regulated professions. This is reflected in a greater number of differing regulations than in services or in relation to regulated professions. Notwithstanding this, the impacts on the internal market of these changes remain modest, in part because of the decisions businesses have made regarding how they respond to differing regulations, which we explore in more detail in the case studies in this report.
Regulatory difference in relation to services is starting to emerge, though not to the same extent as in goods. It is too early to identify any clear internal market effects in relation to services. In particular, the localised provision of many services complicates an assessment of how regulatory difference might affect trade; differences that affect locally provided services and that are rarely traded cross-border are unlikely to have a substantial impact on the internal market. Despite these points, the much greater scale of the services sector means that there is, at least in principle, scope for regulatory difference in relation to services to be as important in terms of the value of the affected activities as regulatory difference in relation to goods.
There have been only a small number of differing regulations proposed over the previous year in relation to regulated professions; all arising through the creation of new regulated professions (as opposed to changes to the regulations governing currently regulated professions). The current proposals for new regulated professions largely concern professions with limited scope for cross-border trade. We conclude that there has been little change to the functioning of the internal market for professionals since the UK Internal Market Act took effect, and this does not appear likely to change in the near future, given the historically slow pace of regulatory change in the regulated professions.
Case studies of businesses’ adaptations to differing regulations
Chapter 4 presents business strategy case studies. These look at four areas where regulatory difference has occurred or may occur in the near future. The case studies examine the approaches that businesses have adopted in response to the differences. The four case studies are: bans on single use plastic (SUP) items, deposit return schemes (DRS), restrictions on the retail promotion of products high in fat, salt, or sugar (HFSS), and regulations relating to the use of precision breeding (PB) techniques. We have chosen these areas because of the degree of regulatory difference they are anticipated to create and because they provide a broad spread of regulations that affect different stages of the supply chain.
A notable finding from our case studies of SUP, PB and DRS is a clear view, particularly among the larger businesses in those sectors with significant operations in the devolved nations, that the Market Access Principles are unlikely to be used as the preferred approach to address regulatory differences. Businesses preferred other approaches including: adopting a high standard that is compliant across all nations where possible; having 2 supply chains (and perhaps reducing the number of product lines to manage the costs of this); and withdrawing from a particular nation. If businesses in other sectors and in relation to other regulations take a similar view, this potentially has significant implications for the internal market regime. We note, however, that we would need to examine this across a broader range of businesses, including SMEs, and a broader range of sectors before we could establish if this was a widespread effect.
We also observed that differing regulations that have effects earlier in the supply chain (such as PB and DRS) appear to be more challenging for businesses to address than differing regulations that have their effects later in the process (such as SUP and HFSS). This may be a helpful finding for policy makers who have some flexibility in how they intend to achieve a particular policy goal; some regulatory differences may have a much lower impact on businesses than others, even if the policy goals are broadly similar.
Linked to this is the high degree to which businesses aim for simplicity in their supply chains. Businesses spoke of adopting a highest common denominator approach (for example, a high standard that is compliant in every nation), often moving ahead of anticipated regulatory change. While this was partly in response to consumer expectations, it was also to ensure that any changes to products or distribution could be made on a timescale and in a way that worked with supply chain requirements. In general, businesses preferred not to tailor products to regulations in one nation, but to offer a product that was compliant everywhere across the UK. In this way, businesses could be said to take an active role in establishing regulatory norms.
We note in the case studies that a significant number of businesses identified range reduction as a possible consequence of regulatory difference, with the important observation that in some cases the reduction in range might occur in a nation not directly affected by the regulations in question. We think this is a credible response to the increased costs and complexity of duplicating product lines. However, none of the businesses we spoke with had yet made firm decisions about which items to withdraw from which markets. Products likely to be withdrawn will be low volume and may not account for much cross-border trade. There may be also strategic and brand-related reasons for keeping certain products available even if they are marginally profitable. Given the high level of uncertainty in these considerations, we conclude it likely that businesses would delay making decisions about product withdrawal until strictly necessary.
The place of the UK internal market within global supply chains will have a powerful bearing on business decisions arising from regulatory difference. For example, developments in the use of precision bred grains are likely to be shaped by policy and consumer sentiment in the EU and more widely, as well as by domestic considerations. Outcomes within the UK might need to adapt to international changes and/or accept the cost implications of diverging from international norms.
In gathering evidence for these case studies, we identified the important role of consumer preferences. Arguably, policy developments in relation to SUP and DRS have been introduced at a time when a significant body of consumer opinion understood and supported the policy objectives behind these initiatives (we also identified a similar situation in our study of Defra’s regulations banning the sale of horticultural peat products). In some areas, policy development may lag consumer attitudes. Consumer preferences influence the confidence businesses have in designing a response to regulatory developments, perhaps especially in taking the highest common denominator approach mentioned by stakeholders in the food and drink industry. By contrast, precision bred crops is, arguably, an area where there is not yet widespread consumer understanding or demand. The uncertainty this creates for businesses accentuates the difficulties of addressing regulatory difference. We are of the view that where regulatory difference emerges ahead of consumer acceptance, this is less likely to lead to a UK-wide response by businesses.
In developing this report, we have identified common themes in relation to differential regulation between the nations, which we hope will assist policymakers when considering the potential impacts of future regulatory change on the UK internal market. The case studies, in particular, indicate a number of ways in which policy makers might be able to adjust policy design in order to minimise internal market impacts. These include: considering designing differential regulations so that they permit a highest-common-denominator response, which will require coordination and cooperation between governments; paying close attention to the point in the supply chain that a regulation has its effects, as the closer to the final consumer that a regulation has its effects the easier difference may be to manage; and recognising that the effects of a differential regulation may arise outside of the nation into which it has been introduced, which is more likely when supply chains cross national borders.
Conclusion
The emerging picture of the internal market is that regulatory difference is starting to build up, albeit slowly and with goods affected more than services, especially in food and drink. However, businesses are adapting creatively to the new regulatory realities in ways that often preserve existing trade flows and supply chains. The relative strength of these forces is yet to become clear and policy makers can make choices that, even if they pursue differential regulation, may assist businesses in keeping existing trade flows open. This is a dynamic environment, and we will undertake further work through 2024 to better understand the impacts of regulatory difference on the UK internal market.
The UK Internal Market
Purpose and approch
This is the second annual report to be published by the Office for the Internal Market (OIM), which is a part of the Competition and Markets Authority (CMA). It discharges the CMA’s statutory responsibility under the UK Internal Market Act (‘UKIMA’) that the CMA must, no later than 31 March 2023 and at least once in every relevant 12 month period, prepare a report on:
-
the operation of the internal market in the United Kingdom, and
-
developments as to the effectiveness of the operation of that market.[footnote 1]
This chapter explains the OIM’s role, describes the approach we have taken in preparing this report.
OIM’s role
Our role is to assist the four governments across the UK by applying economic and other technical expertise to support the effective operation of the UK internal market. We have an advisory, not a decision-making role. This report focuses on the effective operation of the UK internal market in relation to goods, services and the regulated professions.
Governments may make policy interventions for a number of reasons which may, in turn, lead to differences in regulation emerging between the UK nations. Given our focus on the economic impacts of different regulatory choices across the UK nations, we recognise that the findings and issues raised in our reports are likely to constitute one consideration, among others, when a government or legislature determines its preferred policy and regulatory approaches.
Differences in regulation can lead to valuable innovations in policy making, which give other governments in the UK an opportunity to see policies in action before making their own decisions.
Approach to assessing developments in the internal market
To make sense of the internal market we need to use a variety of sources of information, each with its own strengths and weaknesses. The internal market comprises the combined activities of a very large number of businesses engaged in a wide range of economic activities, which are influenced by policy developed by governments across the UK. Furthermore, federal states and states with powers devolved to territories within them must typically undertake the task of managing an internal market, which involves balancing frictionless trade against the right of the territorial jurisdictions to set their own rules. While management of the UK internal market gives rise to similar challenges, there are particularities in a UK context, including the population size of England relative to the other nations and Northern Ireland’s land border with the EU. This complexity means there is no single dataset or methodology that would provide a fully accurate picture of the operation and developments as to the effectiveness of the UK internal market. We can, however, start to build a picture by considering: (i) total business activity; (ii) the actions of individual businesses (or businesses in a particular sector); and (iii) changes to government regulations across the four nations of the UK.
This report uses macro-level data on cross-border sales and purchases, which are good for providing an overall picture on the importance of trade and identifying macro trends but are less revealing in terms of why certain changes are taking place. To fill that gap in our understanding we must look at other data and indicators. One of the additional indicators we examine is the sectors of the economy that are experiencing regulatory difference and to what degree. We set out this data in Chapter 2.
For that purpose, and for the first time, we have attempted to map the proportion of each of the national economies that is exposed to regulatory difference and/or the Market Access Principles (‘the MAPs’)[footnote 2] using data on employment. As we did for the 202 to 2023 annual report, we also examine individual regulatory developments, as this provides a sense of the diversity and the nature of regulatory differences across the economy. In doing so, we take into account that the recent developments in relation to Common Frameworks[footnote 3], the Windsor Framework[footnote 4] and the process for excluding regulations from the MAPs[footnote 5] will have a bearing on how the internal market develops. We present this analysis in Chapter 3.
In order to understand how individual businesses might respond to regulatory difference, in Chapter 4 we have also examined how businesses are likely to adjust how they trade in response to regulatory changes.
Data on intra-UK trade
Key findings
-
analysing current intra-UK trade flows remains challenging, with only 3 of the four UK nations publishing intra-UK trade statistics, and methodological differences between the existing trade statistics. However, methodological improvements are underway
-
the most recent figures value intra-UK trade at £190billion, or around 10% of total UK GDP
-
intra-UK trade represented between 43% to 65% of the external sales and purchases of Scotland, Wales and Northern Ireland, with this accounting for between 25% and 54% of the GDP of Scotland, Wales and Northern Ireland
-
15% of businesses report selling to other UK nations. This is a higher proportion of businesses than for international trade – 10% of businesses report exporting internationally. 10% of businesses report purchasing from other UK nations
-
businesses in manufacturing, wholesale and retail sectors are most likely to trade intra-UK. In Wales and Northern Ireland, businesses in manufacturing account for the largest value of intra-UK sales, while in Scotland, businesses supplying business and other services account for the largest value
-
larger businesses are more likely to trade intra-UK
-
of businesses that trade intra-UK, less than 10% report difficulties doing so due to rules and regulations, with more than half reporting no difficulties
This Chapter provides an overview of the trade-based evidence on the operation of the internal market and draws upon a number of sources, as outlined in Chapter 1. The Chapter provides an update on the value of intra-UK trade, who undertakes that trade, and discusses businesses’ experiences of trading within the UK. The data in this chapter presents one part of the picture of the internal market, by providing a high-level view of aggregate trade flows between the UK’s nations. It should be read in conjunction with the information in Chapters 3 and 4, which discuss changes to specific regulations and examine of how business supply chains are changing in response to regulatory differences.
Update on intra-UK trade data
This section provides an update on the value of intra-UK trade, in terms of both sales and purchases.[footnote 6] Throughout this chapter, we refer to trade flows in terms of sales of goods and services (for example, exports to other UK nations) and purchases of goods and services (for example, imports from other UK nations).
As noted in the 2022 to 2023 annual report, data on intra-UK trade is limited, with only 3 of the four UK nations (Scotland, Wales, and Northern Ireland) publishing statistics on the value of sales and purchases to the other UK nations. Lags in the publication of the datasets differ, as do their respective methodologies for data collection and production plus wording of questions. This makes comparability and estimates of total intra-UK trade challenging. Analysing current intra-UK trade flows remains challenging, although improvements are underway. In this year’s report, we also make use of additional ONS data from BICS and from HMRC, to better understand trade flows between Great Britain and Northern Ireland.
In March 2023, the OIM published a Data Strategy Roadmap[footnote 7] outlining the projects being undertaken by the Office for National Statistics (ONS), the Devolved Governments, UK Government departments and academics from around the UK, as well as the OIM, that may improve the collective understanding of how the UK internal market is operating. If the projects detailed within the OIM Data Strategy Roadmap achieve their objectives, experimental estimates of intra-UK trade covering all four UK nations may be available by Autumn 2024.
In July 2023, the four nations along with the ONS published a user guide to regional trade, outlining the various measures of trade, including their strengths and limitations.[footnote 8] Additionally, in December 2023 the ONS and the Alan Turing Institute published a new dataset on industry-to-industry payment flows based on payment systems data.[footnote 9] Regional breakdowns of this dataset are planned for 2024.
Some methodological improvements to trade statistics have already been implemented and these are cited throughout the chapter.
Value of intra-UK trade
The Economic Statistics Centre of Excellence’s (ESCoE) dataset for 2015 (published in 2021) remains the most recent estimate of intra-UK trade that includes figures for England. ESCoE estimates that intra-UK sales in 2015 amounted to around £190 billion. In Figure 2.1, the variation in importance of economic trade is shown in the proportion of GDP that intra-UK trade represents. Using ESCoE 2015 data and 2015 GDP estimates,[footnote 10] intra-UK sales represented around 10% of total UK GDP.[footnote 11] Comparatively, England’s intra-UK sales represented only 6% of England’s GDP; Scotland’s intra-UK sales was 34% of Scottish GDP; for Wales, 54% of its GDP is made up of intra-UK sales; and Northern Ireland’s intra-UK sales represented 26% of Northern Ireland’s GDP.[footnote 12] As noted above, we expect the new intra-UK trade dataset (due in autumn 2024) will enable an update of the £190 billion estimate.
Figure 2.1: 2015 estimates of inter-regional trade as proportion of GDP
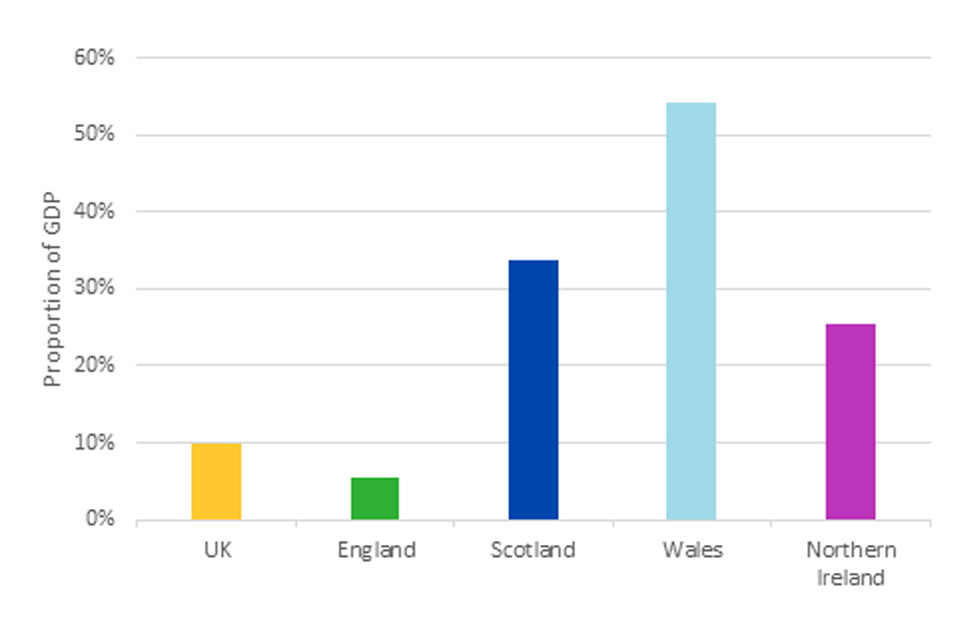
A bar graph of 2015 ESCoE inter-regional trade data of each UK nation as a proportion of each UK nations’ GDP.
For the UK, intra-UK sales represented 9.85% of total UK GDP.
England’s intra-UK sales represented 5.54% of England’s GDP; Scotland’s intra-UK sales was 33.70% of Scottish GDP; for Wales, 54.21% of its GDP is made up of intra-UK sales; and Northern Ireland’s intra-UK sales represented 25.52% of Northern Ireland’s GDP.
Source: Economic Statistics Centre of Excellence (2021); Regional economic activity by gross domestic product, UK - Office for National Statistics (ons.gov.uk)
Note: Excludes non-resident flows (goods or services which move between UK nations but may be produced or provided by a non-resident to the UK).
Figure 2.2 and Figure 2.3 show that intra-UK sales are broadly proportionate to the size on the national economies. In 2015 over 85% of intra-UK sales from Scotland, Wales and Northern Ireland were made to England.[footnote 13] Comparatively, for England over three-fifths of intra-UK sales were to Scotland.
Figure 2:2: 2015 ESCoE estimates of intra-UK sales by UK nation (£billion)
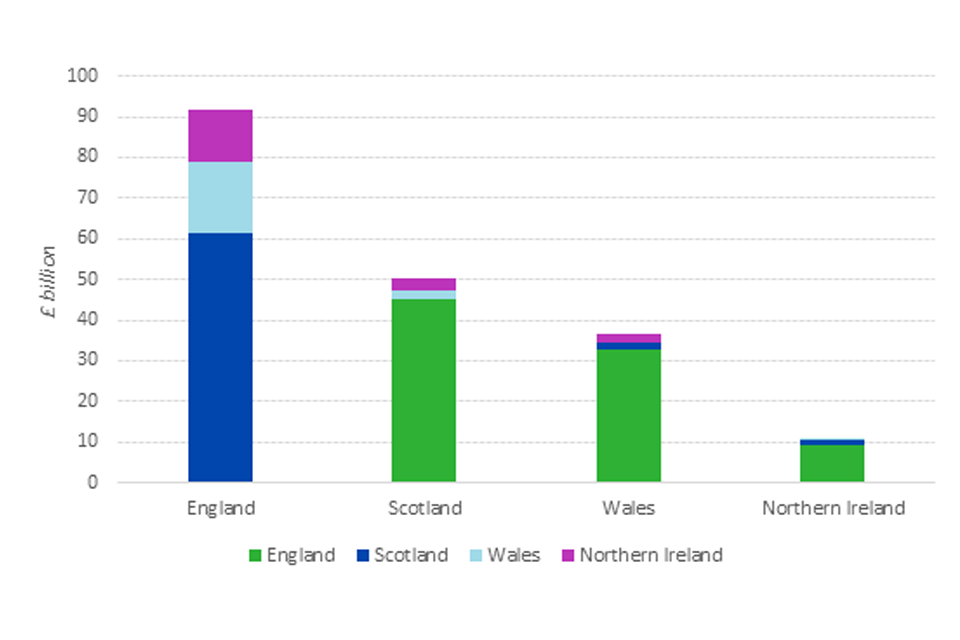
A bar graph of 2015 ESCoE data showing the value of sales in £s that each UK nation sold to each of the other UK nations.
England sales to Scotland, Wales and Northern Ireland were around £61bn, £17.5bn and £13bn respectively.
Scotland sales to England, Wales and Northern Ireland were around £45bn, £2bn and £3bn.
Wales sales to England, Scotland and Northern Ireland were around £33bn, £2bn and £2bn respectively.
Northern Ireland sales to England, Scotland and Wales were around £9bn, £1bn and £0.4bn respectively.
Source: OIM Analysis of Economic Statistics Centre of Excellence (2021)
Note: Excludes non-resident flows (goods or services which move between UK nations but may be produced or provided by a non-resident to the UK).
Figure 2.3: 2015 ESCoE estimates of intra-UK sales as a proportion of inter-regional trade by UK nation
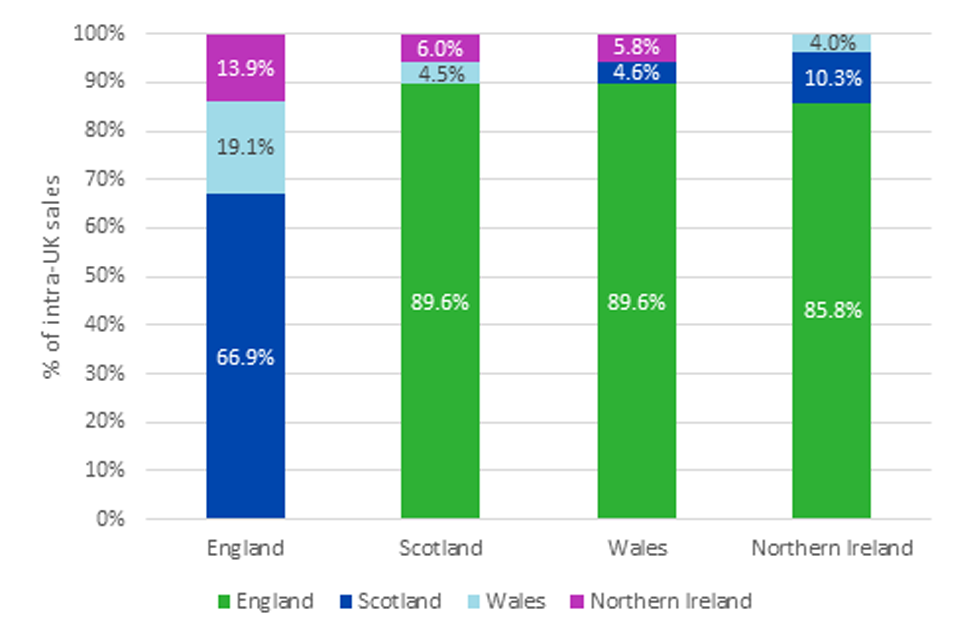
A bar graph of 2015 ESCoE data showing intra-UK sales as a proportion of inter-regional trade by UK nation.
England’s proportion of sales to Scotland, Wales and Northern Ireland were 66.9%, 19.1% and 13.9% respectively.
Scotland’s proportion of sales to England, Wales and Northern Ireland were 89.6%, 4.5%, and 6.0% respectively.
Wales’s proportion of sales to England, Scotland and Northern Ireland were 89.6%, 4.6%, and 5.8% respectively.
Northern Ireland’s proportion of sales to England, Scotland and Wales were 85.8%, 10.3%, and 4.0% respectively.
Source: OIM Analysis of Economic Statistics Centre of Excellence (2021) Note: Excludes non-resident flows (goods or services which move between UK nations but may be produced or provided by a non-resident to the UK).
Scotland, Wales and Northern Ireland publish their own data on intra-UK trade covering both sales and purchases. Whilst we include 2020 data this has been impacted by the COVID-19 pandemic,[footnote 14] therefore comparisons of 2021 data are made against pre-pandemic 2019 data. The overall trends are consistent with the findings in the 2022 to 2023 annual report. Figure 2.4 and Figure 2.5 show that:
-
total intra-UK sales for Scotland, Wales and Northern Ireland in 2021 amounted to £94.7 billion and total intra-UK purchases for Scotland, Wales and Northern Ireland were £119.1 billion in 2021
-
of these 3 nations, Scotland traded the most with the rest of the UK in absolute terms (see Figure 2.4) in 2021, followed by Wales and then Northern Ireland, with these absolute differences likely driven primarily by the relative sizes of their economies
-
the value of intra-UK trade as a proportion of each nation’s total external sales/purchases was broadly similar for Scotland, Wales, and Northern Ireland, ranging from 43 to 61% for sales and 59 to 65% for purchases in 2021 (see Figure 2.5). The proportion of external sales accounted for by intra-UK trade is significantly higher for each of these nations than the figure for the UK as a whole in 2015 (27%), suggesting that countries outside the UK account for a much bigger proportion of England’s sales than other UK nations do.
Figure 2.4: Total external sales and purchases from/to the rest of the UK for Scotland, Wales and Northern Ireland for 2019 to 2021 (£ billion)
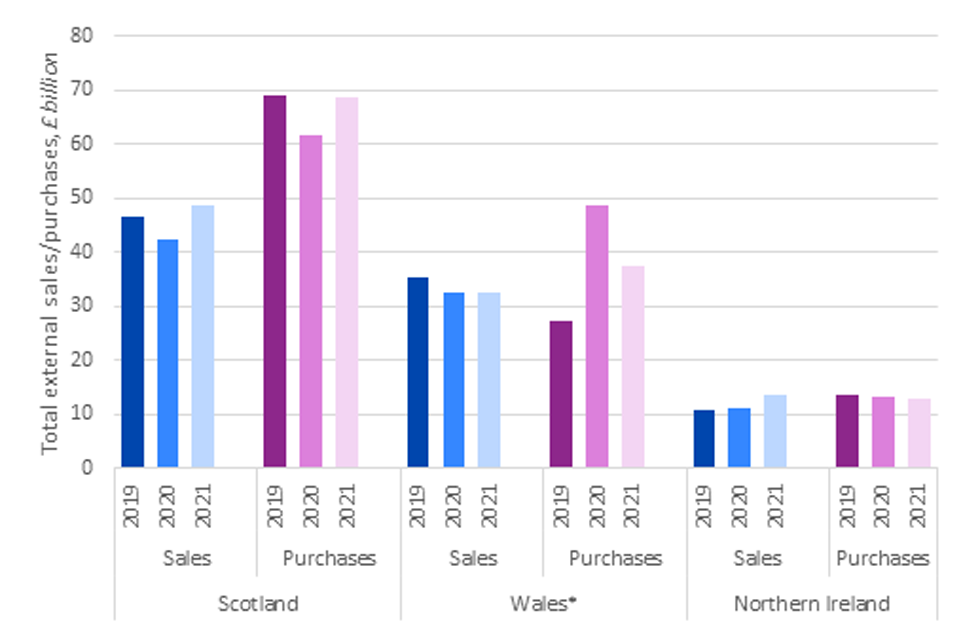
A bar graph that gives purchases and sales from each of Scotland, Wales and Northern Ireland to the rest of the UK for 2019 to 2021.
Scotland sold £47bn to the rest of the UK in 2019, £42bn in 2020, and £49bn in 2021. Scotland purchased £69bn from the rest of the UK in 2019, £62bn in 2020, and £69bn in 2021.
Wales sold £35bn to the rest of the UK in 2019, £32bn in 2020, and £32bn in 2021. Wales purchased £27bn from the rest of the UK in 2019, £49bn in 2020, and £37bn in 2021.
Northern Ireland sold £11bn to the rest of the UK in 2019, £11bn in 2020, and £14bn in 2021. Northern Ireland purchased £14bn from the rest of the UK in 2019, £13bn in 2020, and £13bn in 2021.
Source: Northern Ireland Economic Trade Statistics, 2022; Trade Survey Wales, 2021 (*); GDP Quarterly National Accounts Scotland: 2023; Export Statistics Scotland, 2021.
Notes: Data has not been adjusted for inflation. External sales/purchases refer to trade outside of Wales either to/from the Rest of the UK, the EU, Non-EU, and Unallocated trade.
(*)OIM analysis includes unallocated sales/purchases from the Welsh data. ‘Unallocated sales/purchases’ are where respondents have been unable to allocate this trade to a specific destination/origin (Rest of UK, EU, Non-EU, and Wales) therefore these figures are likely to be a lower estimate of Welsh trade with the rest of the UK, and therefore should be treated with caution.[footnote 15]
TSW state 2020 and 2021 data are currently provisional, 2019 has been revised.
Figure 2.5: Intra-UK trade as a proportion of total external purchases/sales for Scotland, Wales and Northern Ireland for 2019 to 2021
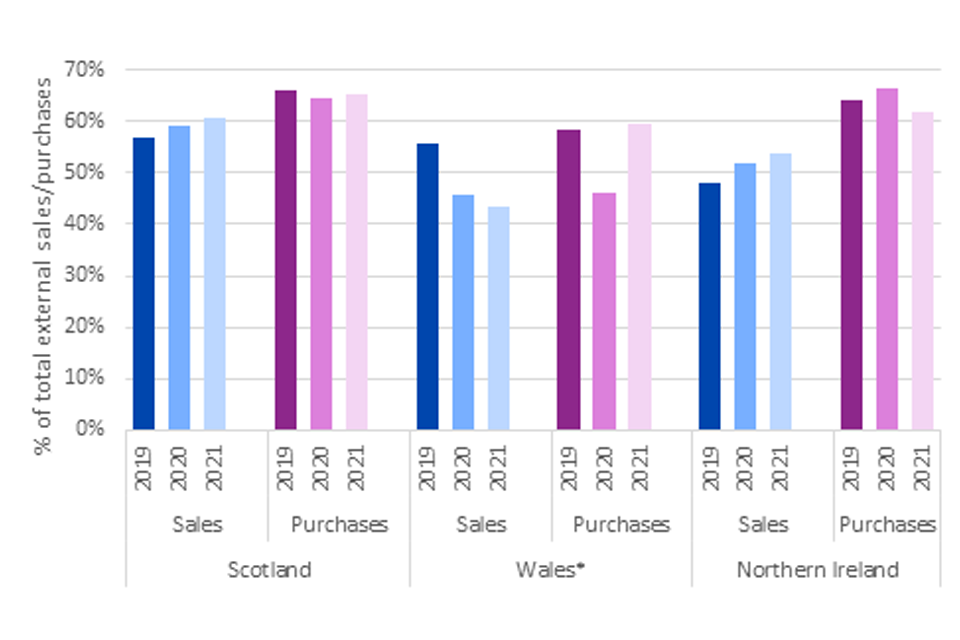
A bar graph showing the proportion of the value of intra-UK trade as a proportion of total external purchases/sales for Scotland, Wales and Northern Ireland for 2019 to 2021.
For Scotland, 57% of external sales and 66% of purchases were to/from the rest of the UK in 2019; 59% of sales and 64% of purchases in 2020; 61% of sales and 65% purchases in 2021.
For Wales, 56% of external sales and 58% of purchases were to/from the rest of the UK in 2019; 46% of sales and 46% of purchases in 2020; 43% of sales and 59% purchases in 2021.
For Northern Ireland, 48% of external sales and 64% of purchases were to/from the rest of the UK in 2019; 52% of sales and 66% of purchases in 2020; 54% of sales and 62% purchases in 2021.
Source: Northern Ireland Economic Trade Statistics, 2022; Trade Survey Wales, 2021; GDP Quarterly National Accounts Scotland: 2023; Export Statistics Scotland, 2021.
Notes: Data has not been adjusted for inflation. External sales/purchases refer to trade outside of Wales either to/from the Rest of the UK, the EU, Non-EU, and Unallocated trade.
OIM analysis includes unallocated sales/purchases from the Welsh data. ‘Unallocated sales/purchases’ are where respondents have been unable to allocate this trade to a specific destination/origin (Rest of UK, EU, Non-EU, and Wales) therefore these figures are likely to be a lower estimate of Welsh trade with the rest of the UK.[footnote 16] TSW state 2020 and 2021 data are currently provisional, 2019 has been revised.
Below we consider the trade statistics produced by each nation in further detail.[footnote 17]
Scotland data
Scotland’s sales (export) data has been sourced from ‘Export Statistics Scotland’ which is principally based on a business survey.[footnote 18] This publication uses a different data source from those reported for 2019 which we included in our 2022 to 2023 annual report, improving the accuracy of the annual estimates for 2019 to 2021.[footnote 19] Purchases (import) statistics are sourced from Quarterly National Accounts.[footnote 20]
In 2021, Scotland’s sales to the rest of the UK were valued at an estimated £48.6 billion and accounted for over half (61%) of all Scotland’s external sales. This is in line with previous estimates.[footnote 21] Purchases from the rest of the UK have also remained consistent with previous estimates at around £69 billion, also accounting for over almost two-thirds (65%) of all Scotland’s external purchases.
Wales data
Welsh trade data comes from the Trade Survey for Wales (TSW), an online survey of businesses in Wales.[footnote 22] Improvements to the TSW methodology are underway and the results of the 2021 survey are described as ‘official statistics in development’ (the new terminology for ‘Experimental Statistics’). Methodological improvements, namely across-years imputation, have been applied to the sales (export) data between 2019-2021, but this new approach has not been applied to the purchases (import) data.[footnote 23] Therefore, caution is needed when analysing the purchases data. The TSW also acknowledges the presence of relatively high unallocated sales and unallocated purchases.[footnote 24]
In 2021, Welsh sales to the rest of the UK were valued at an estimated £32.5 billion and accounted for 43% of all Welsh external sales. Most of the sales in 2021 were to England with 84% (£27.2 billion), followed by Scotland with 5% (£1.6 billion) and Northern Ireland with 3% (£1.1 billion). A further 8% (£2.6 billion) were unallocated sales within the UK.[footnote 25] The data suggests sales to the rest of the UK have declined from 2019, which was estimated at £35.3 billion, (however the proportion of total external sales has increased to 56% see Figure 2.55).[^26] However there was a large increase in unallocated sales from 2019 to 2021.[footnote 27]
Purchases into Wales from the rest of the UK were £37.4 billion in 2021, equating to 59% of total Welsh external purchases. For 2021 most of the purchases from the rest of the UK were from England with 85% (£31.9 billion), followed by Scotland and Northern Ireland with 1% (£0.5 billion) and 0.4% (£0.2 billion) respectively. A further 13% (£4.8 billion) of UK purchases were unable to be allocated.[footnote 28]
Northern Ireland data
The Northern Ireland Statistics and Research Agency (NISRA) conducts an annual survey on trade, the Northern Ireland Economic Trade Statistics (NIETS).[footnote 29] Improvements in the survey are underway[footnote 30] with a new data portal and data visualisation hub being launched this year. As well as comparable annual estimates for 2019 to 2021, estimates are available for 2022.
In 2021, Northern Ireland’s sales to the rest of the UK were valued at an estimated £13.7 billion and accounted for 54% of all Northern Ireland’s external sales. Purchases from the rest of the UK are estimated at around £13.1 billion, accounting for 62% of all Northern Ireland’s external purchases. [footnote 31]
Recent NIETS estimates for 2022 show sales to the rest of the UK have increased to an estimated £15.7 billion however remains the same in proportion of value of trade at 54%. Purchases from the rest of the UK have stayed stable at an estimate £13.1 billion.[footnote 32]
The ONS and HMRC also provide data on trade movements between Great Britain and Northern Ireland.
The ONS Business Insights and Conditions Survey[footnote 33] (BICS), a fortnightly business survey, asks businesses whether they have sent goods from Great Britain to Northern Ireland and from Northern Ireland to Great Britain in the previous 12 months and how the volume of goods sent compared with the previous month.[footnote 34] This data source is a helpful cross-check for understanding any changes in behaviour over time. An average of 4.5% of businesses[footnote 35] stated they had sent goods from Great Britain to Northern Ireland in the last 12 months[footnote 36] (albeit representing a low proportion of businesses, as shown below in the HMRC Customs data, this represents a significant value of goods from Great Britain to Northern Ireland). BICS data also shows that less than 2% of businesses sent goods from Northern Ireland to Great Britain in the last 12 months.[footnote 37] In terms of volumes sent, the BICS data shows that approximately 48% of businesses reported that volumes had stayed the same for Great Britain to Northern Ireland sales, 24% of businesses stated volumes decreased, and 5% of businesses reported volumes increased.[footnote 38] For volumes sent from Northern Ireland to Great Britain, similar proportions were observed. 51% of businesses stated that volumes stayed the same for Northern Ireland to Great Britain sales, 28% reported volumes decreased, and volumes increased for 3% of businesses.[footnote 39] These responses have stayed relatively consistent over time.
HMRC report on the movements of goods into Northern Ireland from Great Britain based on customs data.[footnote 40] HMRC reports that the ‘Total value associated with full declarations cleared by HMRC for movements of goods into Northern Ireland from Great Britain in 2022 was £14.1 billion, up 13% from the 2021 total value of £12.4 billion.’[footnote 41] For context, the 2021 value of customs declarations represented around 24% of Northern Ireland’s GDP.[footnote 42] HMRC also reports that the ‘Total number of full declarations cleared by HMRC for movements of goods into Northern Ireland from Great Britain in 2022 was 1,470,000, up by 41% when compared with the 2021 declaration count of 1,040,000. Total number of unique businesses moving goods into Northern Ireland from Great Britain in 2022 was 12,800, up by 22% when compared with the 2021 business count of 10,500’.[footnote 43] Whilst the data indicates that the total number of full declarations cleared by HMRC and the total number of unique businesses moving goods into Northern Ireland from Great Britain, as seen in Figure 2.6, have increased from 2021 to 2022, HMRC notes that caution is advised when drawing conclusions about the year-on-year changes given the data reports the date the goods were cleared, and not when the goods were moved. Data was only collected from January 2021, therefore in the first year of collection it is likely that there would be less than a full year of transactions recorded because of the lag in reporting.[footnote 44]
Figure 2.6 : Yearly count of full declarations and count of businesses associated with full declarations cleared by HMRC split by different declaration systems
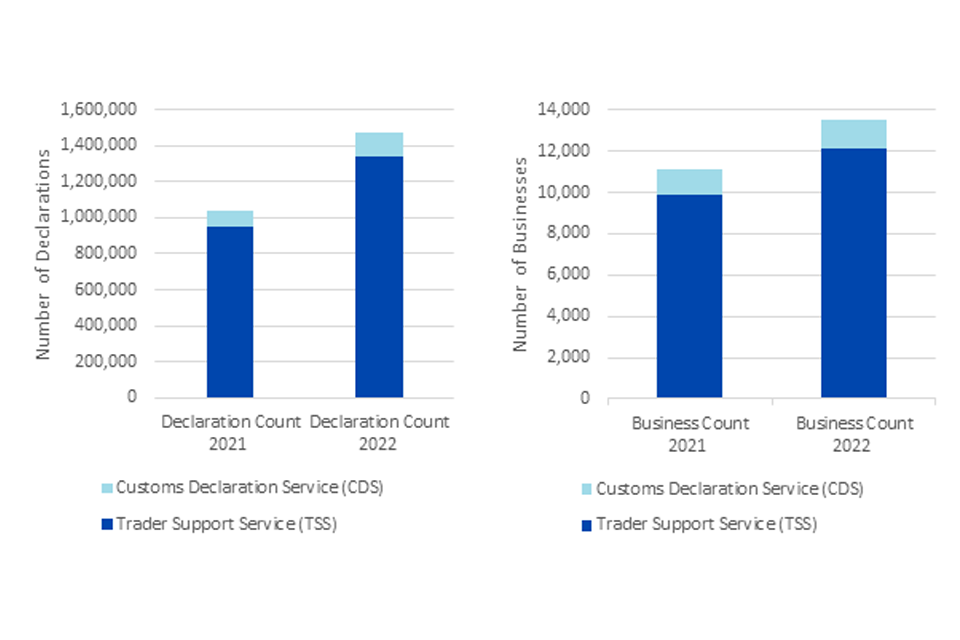
Two bar charts showing the yearly count of full declarations (first bar chart) and count of businesses (second bar chart) associated with full declarations cleared by HMRC split by different declaration systems.
The first bar chart illustrating the number of declarations with full declarations cleared by HMRC, shows that in 2021, the total number of declarations was 1,040,000 with Trader Support Service (TSS) accounting for 950,000 declarations and Customs Declaration Service (CDS) accounting for 90,000 declarations. In 2022, the total number of declarations was 1,470,000 with Trader Support Service (TSS) accounting for 1,340,000 declarations and Customs Declaration Service (CDS) accounting for 130,000 declarations.
The second bar chart illustrating the count of businesses with full declarations cleared by HMRC, shows that in 2021, the total business count was 10,500, with Trader Support Service (TSS) accounting for 9,500 businesses and Customs Declaration Service (CDS) accounting for 1,200 businesses. In 2022, the total business count was 12,800, with Trader Support Service (TSS) accounting for 12,100 businesses and Customs Declaration Service (CDS) accounting for 1,400 businesses.
Source: Administrative data extracted from HMRC’s Customs Declaration Service (CDS)
Who trades within the UK?
In this section we review the best available evidence to provide insights into the extent to which different types of business trade with other parts of the UK and the potential barriers they face. We also note whether there has been a change since the 2022 to 2023 annual report. We rely on the ONS Business Insights and Conditions Survey[footnote 45] (BICS), which has questions on the proportion of UK businesses that trade with other UK nations and the challenges businesses face when doing so, and national trade data. It is noted that data is based on weighted estimates from the voluntary fortnightly business survey (BICS) about financial performance, workforce, prices, trade, and business resilience. The survey was sent to around 39,000 UK businesses, and results presented in this report are based on a response rate of around 20% to 30% (7,800 to 11,700 businesses) across Waves 63 to 95 of the survey.[footnote 46]
BICS asked businesses whether they had sold goods or services to/from other UK nations.[footnote 47] A new question on purchases was included in the October 2023 BICS. There is only one data point for purchases, therefore we do not make inferences from responses but purely report findings. Next year, more data points will enable us to make more informative comparisons.
The results are consistent with the findings in the 2022 to 2023 annual report, with around 15% of businesses reporting they had sold to other UK nations.[footnote 48] For comparison, around 10% of businesses had exported internationally in the last 12 months.[footnote 49] Approximately 10% of businesses reported they had purchased from other UK nations within the last 12 months.[footnote 50]
Trade by industry sector
BICS evidence suggests that businesses in the manufacturing and wholesale and retail trade sectors are generally more likely to trade with other UK nations (see Figure 2.7). On average, the survey results indicate over 30% of businesses within the manufacturing industry sell to other UK nations, whilst approximately 18% of businesses in this sector state they purchase from other UK nations (purchase data is one data point).[footnote 51] For businesses within the wholesale and retail trade industry, on average approximately 25% sell to other UK nations whilst approximately 15% state they purchase from other UK nations.[footnote 52]
Figure 2.7: Proportion of businesses making intra-UK sales/purchases by industry sector
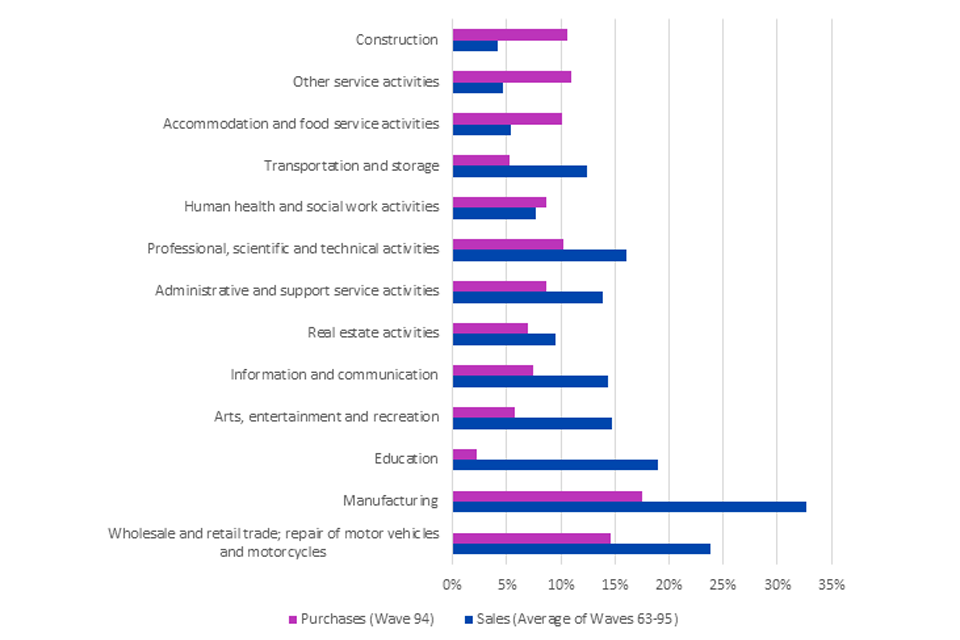
A bar graph showing the proportion of businesses making intra-UK purchases and sales by industry sector.
For the Construction sector, the proportion of businesses with purchases from the Rest of the UK is 11% and the proportion of businesses that sold to the Rest of the UK is an average of 4%.
For the Other service activities sector, the proportion of businesses with purchases from the Rest of the UK is 11% and the proportion of businesses that sold to the Rest of the UK is an average of 5%.
For the Accommodation and food service activities sector, the proportion of businesses with purchases from the Rest of the UK is 10% and the proportion of businesses that sold to the Rest of the UK is an average of 5%.
For the Transportation and storage sector, the proportion of businesses with purchases from the Rest of the UK is 5% and the proportion of businesses that sold to the Rest of the UK is an average of 12%.
For the Human health and social work activities sector, the proportion of businesses with purchases from the Rest of the UK is 9% and the proportion of businesses that sold to the Rest of the UK is an average of 8%.
For the Professional, scientific and technical activities sector, the proportion of businesses with purchases from the Rest of the UK is 10% and the proportion of businesses that sold to the Rest of the UK is an average of 16%.
For the Administrative and support service activities sector, the proportion of businesses with purchases from the Rest of the UK is 9% and the proportion of businesses that sold to the Rest of the UK is an average of 14%.
For the Real estate activities sector, the proportion of businesses with purchases from the Rest of the UK is 7% and the proportion of businesses that sold to the Rest of the UK is an average of 9%.
For the Information and communication sector, the proportion of businesses with purchases from the Rest of the UK is 7% and the proportion of businesses that sold to the Rest of the UK is an average of 14%.
For the Arts, entertainment and recreation sector, the proportion of businesses with purchases from the Rest of the UK is 6% and the proportion of businesses that sold to the Rest of the UK is an average of 15%.
For the Education sector, the proportion of businesses with purchases from the Rest of the UK is 2% and the proportion of businesses that sold to the Rest of the UK is an average of 19%.
For the Manufacturing sector, the proportion of businesses with purchases from the Rest of the UK is 18% and the proportion of businesses that sold to the Rest of the UK is an average of 33%.
For the Wholesale and retail trade; repair of motor vehicles and motorcycles sector, the proportion of businesses with purchases from the Rest of the UK is 15% and the proportion of businesses that sold to the Rest of the UK is an average of 24%.
Source: Business Insights and Conditions Survey
BICS questions: ‘In the last 12 months, has your business sold goods or services to customers in other UK nations?’ ‘In the last 12 months, has your business purchased goods or services from suppliers in other UK nations’.
Notes: Sales data: Average of Wave 63 (8-21 August 2022), Wave 68 (17-30 October 2022), Wave 75 (23 January – 5 February 2023), Wave 81 (17 April 2023 to 30 April 2023), Wave 88 (24 July 2023 to 6 August 2023) and Wave 95 (30 October 2023 to 12 November 2023). Purchase data: Wave 94 (16 October 2023 to 29 October 2023).
National trade data shows the proportion of intra-UK sales by industry sectors varies by UK nation (see Figure 2.8). For example, in Wales and Northern Ireland, the Manufacturing sector accounts for the largest value of sales to the rest of the UK whilst in Scotland, Business and other services was the largest sector. This is consistent with our findings within the 2022 to 2023 annual report.
-
in 2021, Scotland’s sales to the rest of the UK relied heavily on Business and other services[footnote 53], particularly financial and insurance activities valued at an estimated £9.2 billion (19% of Scotland’s sales). In comparison international sales relied more heavily on manufacturing.[footnote 54] This has been a consistent trend since 2019. Purchase data by sector for 2021 is not available for Scotland.[footnote 55]
-
for Wales, in 2021, the Manufacturing sector made up almost half (49.1%, £16.0 billion) of the value of sales to the rest of the UK.[footnote 56] This was followed by the Business and other services sector (23.9%, £7.8 billion). The Trade, accommodation and transport sector accounted for the highest proportion of Welsh purchases from the rest of the UK in 2021 at 37.2% (£13.9 billion).[footnote 57] This was followed by almost a quarter of purchases from the Manufacturing sector (24.5%, £9.1 billion), in 2021
-
for Northern Ireland, the Manufacturing sector also made up almost half (43%, £5.9 billion) of the value of sales to the rest of the UK. The Trade, accommodation and transport sector accounted for the highest proportion of Northern Ireland purchases from the rest of the UK in 2021 at 64.7% (£8.5 billion). This is consistent with purchase data in both 2019 and 2020, with Manufacturing being the second largest sector (19.1%, £2.5 billion in 2021)
Figure 2.8: Estimates of intra-UK sales/purchases by industry sector, 2021
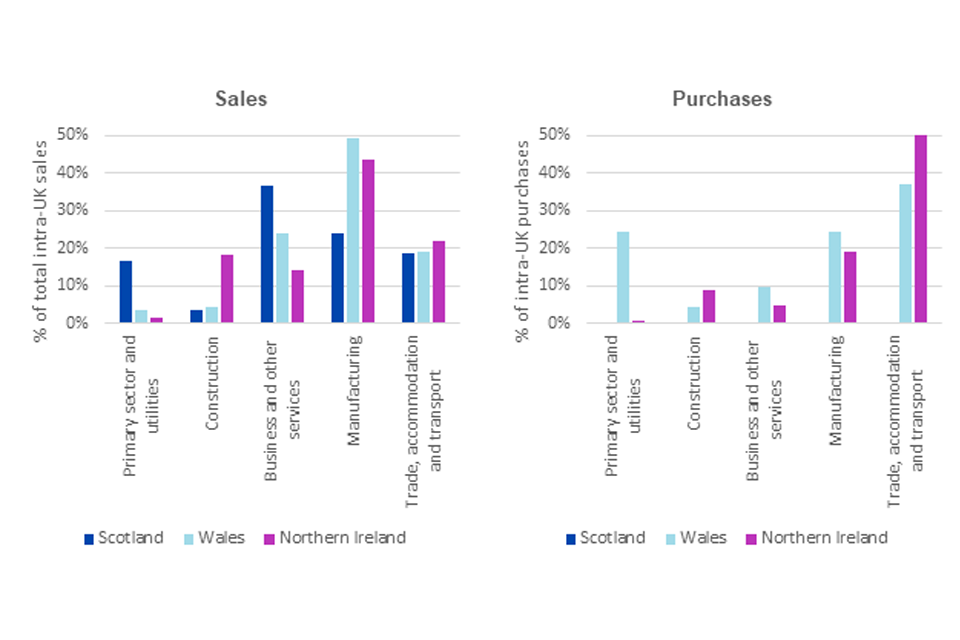
Two bar graph showing estimates of sales and purchases in 2021 to other UK nations for Scotland, Wales and Northern Ireland for five broad industry sectors (Primary sector and utilities; Construction; Business and other services; Manufacturing; and Trade accommodation and transport).
The first bar chart illustrating the proportion of intra-UK sales by broad industry sector, shows for Scotland, 17% of sales to other UK nations were made by Primary sector and utilities; 4% by Construction; 37% by Business and other services; 24% by Manufacturing; and 19% by Trade accommodation and transport. For Wales, 4% of sales to other UK nations were made by Primary sector and utilities; 4% by Construction; 24% by Business and other services; 49% by Manufacturing; and 19% by Trade accommodation and transport. For Northern Ireland, 2% of sales to other UK nations were made by Primary sector and utilities; 18% by Construction; 14% by Business and other services; 43% by Manufacturing; and 22% by Trade accommodation and transport.
The second bar chart illustrating the proportion of intra-UK purchases by broad industry sector. For Scotland, there was no purchase data by sector in 2021. For Wales, 24% of purchases from other UK nations were made by Primary sector and utilities; 4% by Construction; 10% by Business and other services; 24% by Manufacturing; and 37% by Trade accommodation and transport. For Northern Ireland, 1% of purchases from other UK nations were made by Primary sector and utilities; 9% by Construction; 5% by Business and other services; 19% by Manufacturing; and 65% by Trade accommodation and transport.
Source: Northern Ireland Economic Trade Statistics, 2022; Trade Survey Wales, 2021; GDP Quarterly National Accounts Scotland: 2023; Export Statistics Scotland, 2021.
Note: Scotland does not release purchase data by sector.
Trade by business size
Our analysis of the available evidence suggests business size continues to impact the likelihood of intra-UK trade. Evidence from the BICS suggests that larger businesses are more likely to trade across the UK than smaller ones, both in terms of sales and purchases.[footnote 58] As shown in Figure 2.9, less than 15% of micro businesses (0-9 employees) made sales to other UK nations, compared with over 40% of large businesses (250+ employees). This trend is also reflected in purchases.
Figure 2.9: Proportion of businesses with intra-UK sales/purchases by size band (employees)
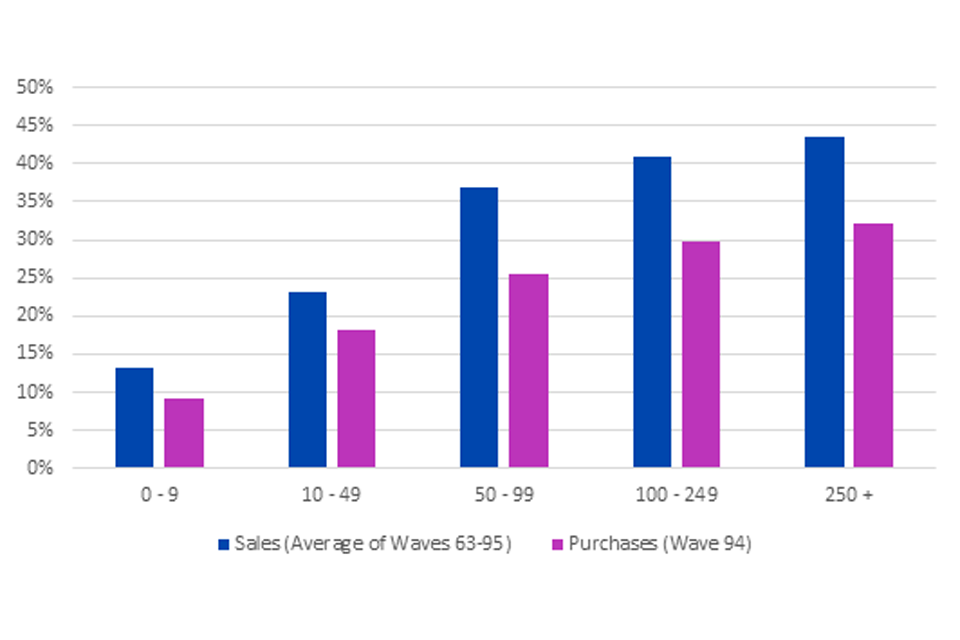
A bar graph showing the proportion of businesses with sales to and purchases from the Rest of the UK by size band.
The graph shows that an average of 13% of businesses with 0-9 employees sold to other UK nations and 9% purchased from other UK nations.
For businesses with 10-49 employees, an average of 23% sold to other UK nations, and for purchases this figure was 18%.
An average of 37% of businesses with 50-99 employees made sales to other UK nations and 26% made purchases from other UK nations.
For businesses with 100-249 employees, an average of 41% made sales from other UK nations and 30% made purchases from other UK nations.
An average of 43% of businesses with 250 plus employees made sales to other UK nations and 32% made purchases from other UK nations.
Source: Business Insights and Conditions Survey
BICS questions: ‘In the last 12 months, has your business sold goods or services to customers in other UK nations?’ ‘In the last 12 months, has your business purchased goods or services from suppliers in other UK nations’.
Notes: A large proportion of the BICS sample is accounted for by small businesses
Sales data: Average of Wave 63 (8-21 August 2022), Wave 68 (17-30 October 2022), Wave 75 (23 January – 5 February 2023), Wave 81 (17 April 2023 to 30 April 2023), Wave 88 (24 July 2023 to 6 August 2023) and Wave 95 (30 October 2023 to 12 November 2023). Purchase data: Wave 94 (16 October 2023 to 29 October 2023).
Evidence from the BICS is largely supported by other intra-UK trade data from Scotland, Wales and Northern Ireland, as seen in Figure 2.10.
-
for Scotland and Northern Ireland, from 2019-2021 there has been a consistent picture that larger businesses represented a higher proportion of sales to the rest of the UK (at approximately 60% for Scotland and approximately 45% for Northern Ireland)
-
for Wales, in 2021, large businesses accounted for a higher proportion of trade across the UK than smaller ones, both in terms of sales (38%, £12.4 billion) and purchases (64%, £23.8 billion).[footnote 59] For sales, this is a change from 2019, which saw medium sized businesses marginally having the largest share of total sales to the rest of the UK (39%, £13.6 billion), closely followed by large businesses (38%, £13.3 billion). For purchases the trend has remained the same, with large businesses representing the majority of trade to the rest of the UK (57%, £15.6 billion in 2019)
Figure 2.10: Estimates of intra-UK sales/purchases by business size, 2021
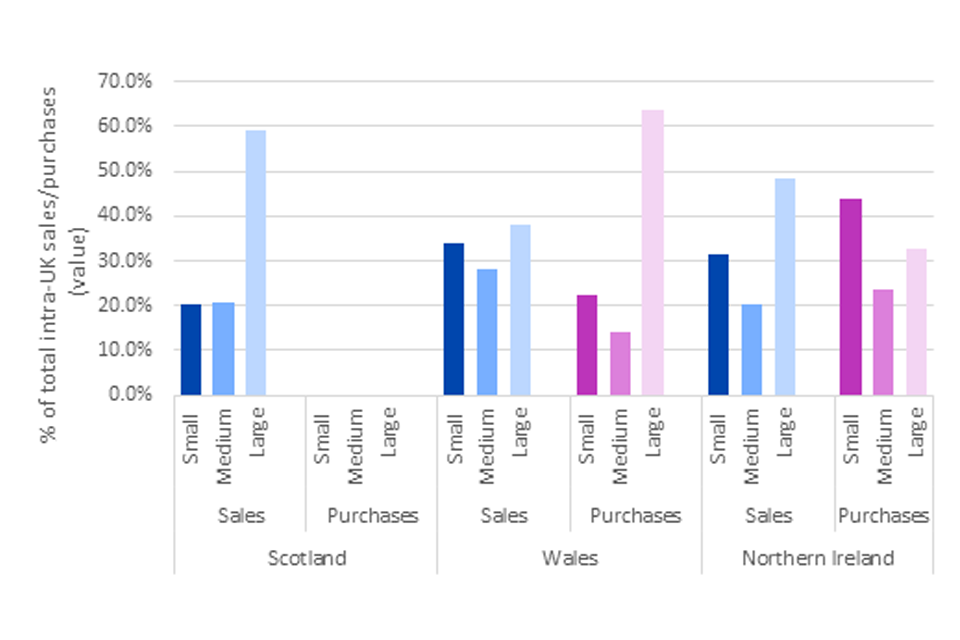
A bar graph showing estimates of sales to and purchase from other UK nations for Scotland, Wales and Northern Ireland by business size (Small = 0-49 employees, Medium = 50-249 employees, Large = 250+ employees).
For Scotland, 20% of sales to other UK nations were made by Small businesses, 21% by Medium businesses, and 59% by Large businesses. For Scotland, there was no purchase data by business size in 2021.
For Wales, 34% of sales to other UK nations were made by Small businesses, 28% by Medium businesses, and 38% by Large businesses. For Wales, 22% of purchases from other UK nations were made by Small businesses, 14% by Medium businesses, and 64% by Large businesses.
For Northern Ireland, 31% of sales to other UK nations were made by Small businesses, 20% by Medium businesses, and 48% by Large businesses. For Northern Ireland, 44% of purchases from other UK nations were made by Small businesses, 24% by Medium businesses, and 33% by Large businesses.
Source: Northern Ireland Economic Trade Statistics, 2022; Trade Survey Wales, 2021; GDP Quarterly National Accounts Scotland: 2023; Export Statistics Scotland, 2021.
Note: Scotland does not release purchase data;
Business Sizes are as follows: Small = 0-49 employees, Medium = 50-249 employees, Large = 250+ employees
Experiences of intra-UK trade
Based on BICS[footnote 60], it continues to be the case that more than half of businesses that sold goods and services to customers in other UK nations did not face any challenges when doing so.[footnote 61] Of those businesses who did engage in trade with other UK nations, the number experiencing challenges due to differences in rules or regulations is low at less than 10% and has remained low over time.[footnote 62] In the 2022 to 2023 annual report transport costs[footnote 63] were cited as the biggest problem, but now a lack of demand[footnote 64] is the highest reported concern with 17% of businesses citing this issue. Challenges related to the Northern Ireland Protocol was stated by an average of 8% of businesses as a challenge experienced when selling goods or services to customers in other UK.[footnote 65]
Conclusion
In 2021, intra-UK trade remained important to the UK nations, representing between 43% to 65% of the external sales and purchases of Scotland, Wales and Northern Ireland. This represented £94.7 billion worth of intra-UK sales for Scotland, Wales and Northern Ireland and £119.1 billion for intra-UK purchases in 2021. To date, we do not see much change over time, either looking back to 2019 or, in the case of Northern Ireland where we have more up to date numbers, looking forward to 2022. It is too early to comment on overall trends given the disruption from Covid-19. Updated data for England is not available.[footnote 66] As stated in last year’s annual report, the Economic Statistics Centre of Excellence (ESCoE) estimates that intra-UK sales (including figures for England) amounted to around £190 billion in 2015.
In this year’s report, we make use of additional ONS data from BICS and from HMRC, to better understand trade flows between Great Britain and Northern Ireland. BICS data suggests an average of 4.5% of businesses stated they had sent goods from Great Britain to Northern Ireland in the last 12 months (albeit representing a low proportion of businesses, this represents a significant value of goods from Great Britain to Northern Ireland, with HMRC reporting that the ‘Total value associated with full declarations cleared by HMRC for movements of goods into Northern Ireland from Great Britain in 2022 was £14.1 billion, up 13% from the 2021 total value of £12.4 billion’. For context, the 2021 value of customs declarations represented around 24% of Northern Ireland’s GDP.[footnote 67] For goods sent from Northern Ireland to Great Britain this was less than 2%. Further, HMRC report that, based on customs data, ‘the total number of unique businesses moving goods into Northern Ireland from Great Britain in 2022 is 12,800, up by 22% when compared with the 2021 business count of 10,500’, although caution must be exercised when comparing year-on-year figures due to lags in the data as explained at paragraph 2.21.
BICS evidence indicates that businesses in the manufacturing and wholesale and retail trade sectors are generally more likely to trade with other UK nations. National trade data shows the proportion of intra-UK sales by industry sectors varies by UK nation. For example, in Wales and Northern Ireland, the Manufacturing sector accounted for the largest value of sales to the rest of the UK whilst in Scotland, Business and other services was the largest sector. For intra-UK purchases, we only have data for Wales and Northern Ireland, whereby we observed that purchases from Trade, Accommodation and Transport sector is the largest proportion of total external purchases, followed by the Manufacturing sector. This has been a consistent trend for both intra-UK sales and purchases by industry sector since 2019.
In 2021, we observed that in terms of intra-UK sales, larger firms contributed a higher proportion of total external sales to the rest of the UK for Scotland, Wales and Northern Ireland. This is a consistent trend since 2019 for both Scotland and Northern Ireland. For Wales, in 2019 medium sized businesses marginally had the largest share of intra-UK sales at 39% compared to large businesses at 38%. Further, this intra-UK trade data is largely supported by evidence from the BICS, whereby we continue to find that trade is more common among larger businesses.
Finally, we continue to observe that businesses are generally finding it easy to trade with other UK nations, with the majority of firms responding to the BICS that they have not encountered challenges.
Overall, the available data on intra-UK trade remains limited but improvements are underway. As set out in the OIM Data Strategy Roadmap[footnote 68] projects being undertaken should improve the collective understanding of how the UK internal market is operating. We expect estimates of intra-UK trade covering all 4 UK nations to be available by Autumn 2024. Additionally, next year with more data points, we will be able to make better comparisons on both sales and purchases from the BICS data.
Regulatory landscape and developments
Key findings
-
over the last year, there has been a significant increase in the number of proposed differences in regulations within the scope of UKIMA
-
most of these proposed regulations are in relation to goods although there have also been developments in relation to services and regulated professions
-
the goods sector most affected is food and drink. For services, the proposed regulations apply to a more diverse range of economic activities. A small number of proposed regulations relate to defining new regulated professions
-
proportionally speaking, substantially more economic activity (as measured by employment) in services is outside the scope of UKIMA than is the case for goods but the size of the services sector relative to goods means that in absolute terms most economic activity that is subject to UKIMA is in services
-
to date, there have been only modest effects on internal market in relation to goods. It is too early to identify effects in relation to services. We have not identified effects in relation to the regulated professions
In this chapter we discuss the regulatory landscape and the regulatory developments within the scope of UKIMA in relation to each of goods, services and regulated professions. That discussion must be understood in the light of various developments to the internal market regime which have taken place over the last year. A summary of those changes is set out at Appendix A. It should also be read in conjunction with the data on aggregate trade flows discussed in Chapter 1, which helps position these developments discussed in this chapter in their broader context. In addition, 4 of the regulatory developments we discuss in this chapter form the basis for the case studies of businesses’ strategies in response to regulatory differences that are set out in Chapter 4.
Goods
Regulatory landscape assessment in relation to goods
Figure 3.1 shows for each nation the proportion of employment[footnote 69] that is in sub-sectors where sector-specific policy making falls into one of 3 categories:
-
employment in sub-sectors where sector specific policy making is reserved (ie not subject to regulatory difference between the nations)[footnote 70]
-
employment in sub-sectors where sector specific policy making is devolved but excluded from UKIMA (ie potentially subject to regulatory difference but not the MAPs)
-
employment in sub-sectors where sector-specific policy making is devolved but is not excluded from UKIMA (ie potentially subject to regulatory difference and the MAPs)
The data shows that for each nation the proportion of employment in goods sub-sectors that are in the first category (where there cannot be regulatory difference within GB and only between GB and NI in the case of UK-EU divergence) are a small proportion of total employment in goods (for detail on the methodology used to calculate these figures see Appendix B – the figures should be treated as rough estimates). Of the goods sub-sectors where regulations could differ, in each nation, only a small percentage is in sub-sectors that are excluded from UKIMA.
Figure 3.1: Goods sector economic activity (percentage of total goods sector employment[footnote 71] by relationship with regulatory difference and the MAPs
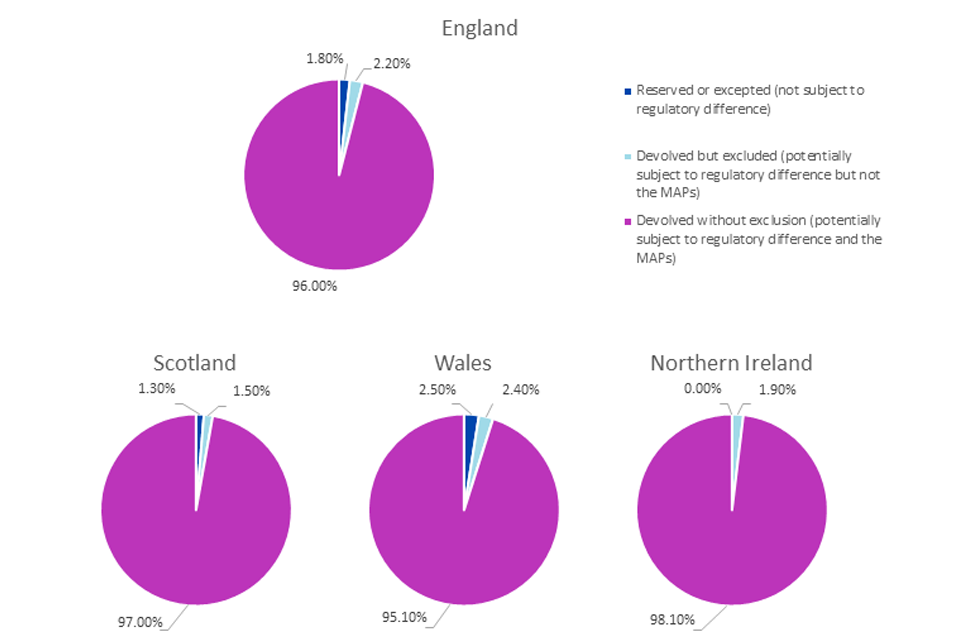
A set of four pie charts showing the Goods sector economic activity for each UK nation as a percentage of total goods sector employment for each UK nation by categories of relationship with regulatory difference and the MAPs (Reserved or excepted; Devolved but excluded; and Devolved without exclusion).
The first pie chart shows the Goods sector economic activity for England. 96% of total Goods sector employment in England accounts for Devolved without exclusion; 2.2% for Devolved but excluded; and 1.8% for reserved or excepted.
The second pie chart shows the Goods sector economic activity for Scotland. 97% of total Goods sector employment in Scotland accounts for Devolved without exclusion; 1.5% for Devolved but excluded; and 1.3% for reserved or excepted.
The third pie chart shows the Goods sector economic activity for Wales. 95.1% of total Goods sector employment in Wales accounts for Devolved without exclusion; 2.4% for Devolved but excluded; and 2.5% for reserved or excepted.
The fourth pie chart shows the Goods sector economic activity for Northern Ireland. 98.1% of total Goods sector employment in Northern Ireland accounts for Devolved without exclusion; 1.9% for Devolved but excluded; and 0% for reserved or excepted.
Source:
GB: NOMIS database, 2021 data, count by Employment
NI: Business Register and Employment Survey, 2021 data, count by Employees
Note: Charts are based to be all the same size and are not to scale of the proportion of each nations’ employment figures in the Goods Sector.
Please see Appendix B: Assessment of the regulatory landscape for more information on the relationship with the regulatory difference and the MAPs. However, in interpreting these figures it must be noted that in every UK nation services account for a much greater proportion of employment (and economic output) than do goods. England’s Services sector accounts for 86% of employment compared to only 14% of English employment occurring in the Goods sector. Therefore, England’s services sector is roughly 6 times larger than England’s goods sector. For Scotland the equivalent figures are 83% and 17%; Wales 82% and 18%; and NI 85% and 15%.
Current and upcoming regulatory changes in relation to goods
In our statutory role to monitor the internal market, including regulatory difference that might have impacts on its operation, we have identified an increased level of relevant regulatory developments compared to the 2022 to 2023 annual report. We have also observed an increased number of cases where initial policy development might have indicated potential regulatory difference but ultimately Governments reached a level of alignment to allow UK-wide consultations.
The broad sectors where we consider regulatory difference to be most likely to occur have not changed since the 2022 to 2023 annual report. These include (but are not limited to) environment, food and drink, public health measures, and animal welfare.
Regulatory developments that we focus on in this section have been identified by gathering intelligence through publicly available sources (such as Governments’ publications, announcements), regular stakeholder engagement, submissions to the OIM webform and questionnaires sent to the 4 governments in the UK.[footnote 72] The list presented in this section is not exhaustive. It includes regulatory developments that have a good level of publicly available policy detail to inform our understanding of the potential regulatory difference and/or have a certain level of interest generated by stakeholders. No conclusions should be drawn from the ordering of the presentation of the regulations in this section.
In the 2022 to 2023 annual report, we identified a number of regulatory developments that were affecting, or had the potential to affect, the UK internal market. Of those, 4 (Single-use plastic, Deposit Return Schemes, High fat, salt or sugar food and drink restrictions, and Precision breeding) are covered as case studies in chapter 4. We provide details about those regulations below. All other regulatory developments that we have identified are set out in Appendix C.
Single use plastic
Measures have been brought into force across all parts of the UK to tackle the issue of single-use plastic waste. At the time of our 2022 to 2023 annual report, the UK Government (in England) and the Scottish Government had implemented bans on the supply and, in the case of Scotland, the manufacture of certain single use plastic products.[footnote 73] Further, an exclusion disapplying the MAPs in relation to these products had been agreed under the Resources and Waste Common Framework.[footnote 74]
Since the 2022 to 2023 annual report, the UK and Welsh Governments have introduced further bans on the sale of single-use plastics.[footnote 75] In England, the UK Government’s new ban came into effect on 1 October 2023 and prohibits the supply of single-use plastic cutlery, balloon sticks, plates, trays or bowls and certain types of polystyrene food containers, drinks containers and cups.[footnote 76] The Welsh Government’s ban came into force on 30 October 2023 and prohibits the supply of single-use: plastic plates, cutlery, drinks stirrers, balloon sticks, drinking straws, plastic-stemmed cotton buds, and cups and food containers made of polystyrene. The Welsh Government’s legislation provides for a ‘second phase’ of its ban, which we discuss in Appendix C, paragraphs C.12 to C.14.
The scope of the bans vary in terms of the single-use plastics they cover. For example, the supply of plastic bowls or trays is only banned in England and is not covered by bans elsewhere in the UK. It will also not be covered by the existing exclusion for single-use plastics and so will be subject to the MAPs for goods.[footnote 77] The bans also vary in respect of the activities that are prohibited. While the bans in England and Wales prohibit the supply of certain products, the existing ban in Scotland also prohibits their manufacture in Scotland.
In Northern Ireland, there are currently no restrictions on single-use plastic items, but the Department for Agriculture, Environment and Rural Affairs (DAERA) has consulted on policy options for the reduction of single-use plastic beverage cups and food containers, including a ban on the use of these items as one option. DAERA explained to us that regulations restricting single use plastics have not been made in Northern Ireland because there has not been a functioning Assembly, but future restrictions will go beyond those implemented in Great Britain due to obligations under the Windsor Framework. Planned future restrictions are set out in Table 4.1.
Deposit Return Schemes (DRS)
DRS aim to increase recycling rates for drinks containers by incentivising consumers to return them. They work by applying a charge to in-scope containers that can be redeemed when the container is returned. As waste management policy is devolved in the UK, the development and introduction of DRS is the responsibility of the 4 governments across the UK. As noted in our 2022 to 2023 annual report, the 4 governments are working towards development of DRS.
Following publication of the 2022 to 2023 annual report, the UK Government agreed a time-limited exclusion for the Scottish Government’s scheme, which was to be launched ahead of the joint scheme in England, Wales and Northern Ireland.[footnote 78] In May 2023 the UK Government set out that any exclusion would only cover PET plastic, aluminium and steel cans – it would not include glass. The Scottish Government has since delayed the launch of its scheme to bring its commencement into line with the planned launch date (1 October 2025) of the joint scheme in England, Wales and Northern Ireland.[footnote 79] Regulations establishing the joint scheme are not currently available and the Deposit Management Organisation (the scheme administrator) is expected to be appointed by summer 2024.[footnote 80]
A significant difference between the schemes continues to be the materials in scope. In England and Northern Ireland, materials included are polyethylene terephthalate (PET) plastic, steel and aluminium containers.[footnote 81] In addition to those materials, Wales and Scotland also intend to include glass containers in their schemes, though their positions on this are not yet fully confirmed.[footnote 82]
The Welsh Government told us that it remains committed to including glass containers in the joint scheme as it applies in Wales. The Scottish Government has not confirmed whether glass containers will remain covered by its scheme. DBT noted its work with the Devolved Governments to develop interoperable schemes across the UK that do not create unnecessary trade barriers. DAERA highlighted that the implications of differences in scope (for example, glass) have been considered as part of the development of DRS across the UK.
High fat, salt or sugar (HFSS) food and drink
The UK Government has put in place regulations to restrict the promotion of targeted HFSS foods by location and volume price in England under the Food (Promotion and Placement) (England) Regulations 2021.[footnote 83] Restrictions on the location of HFSS products are in key selling locations such as checkouts, store entrances, aisle ends and their online equivalents came into force in October 2022.
Since the 2022 to 2023 annual report, the UK Government’s restrictions on the promotion of HFSS products in England by volume price, such as ‘buy 1 get 1 free’ or ‘3 for 2’, which were set to come into force on 1 October 2023 were further delayed to 1 October 2025.[footnote 84] The Welsh Government is planning to roll out its HFSS promotion restrictions in 2024. This will broadly align Wales with England with respect to location and volume promotion restrictions. Welsh Government also plans to align with England on the same product categories included in legislation. However, the options for including additional restrictions on meal deals, temporary price promotions, and free-standing display units in stores are also being considered.
The Scottish Government confirmed in a statement to the Scottish Parliament plans to consult on the detail of proposed regulation to restrict the promotion of less healthy food and drink where those are sold to the public. The consultation is expected to be published early in 2024.
In Northern Ireland, promotional restrictions on HFSS products are being considered as part of a new draft obesity strategic framework, which has been issued for public consultation.
There is likely to be broad alignment as to what is in scope of the HFSS promotion restrictions across the UK. Subject to the outcome of further consultation by the Scottish Government, potential regulatory difference may arise in relation to meal deals and temporary price reductions being in scope of the HFSS promotion restrictions in Wales and Scotland but not within England.
Precision breeding
In May 2022, the UK Government introduced the Genetic Technology (Precision Breeding) Bill, which alters the definition of Genetically Modified Organisms (GMOs) in England to exclude certain organisms created via precision breeding technologies. The change is intended to simplify the process of obtaining authorisation to market precision-bred plants and animals (PBOs), relative to the requirements for authorising GMOs.
Since the 2022 to 2023 annual report, the Genetic Technology (Precision Breeding) Act 2023 (the Precision Breeding Act) was passed in March 2023 and seeks to remove PBOs from the GMO legislation, introducing legislation to develop an alternative framework to regulate their use, including a register of PBOs. Secondary legislation that will set out how the Precision Breeding Act will work in practice is expected to be in place by the end of 2024.
The Precision Breeding Act applies only to England. Neither Scotland nor Wales are planning to introduce similar legislation and continue to watch the developments at EU level closely, with the Welsh Government indicating to us that it is considering its approach to gene editing. Northern Ireland is required by the Windsor Framework to follow EU regulations on GMOs. Notably, the EU has published its proposal for legislation on plants obtained by certain genomic techniques and their food and feed, which, if enacted, would result in similar legislation to the Precision Breeding Act.[footnote 85] However, this is not likely to occur until after the Precision Breeding Act’s provisions are implemented and operational.
Implementation of the Precision Breeding Act and associated secondary legislation will result in regulatory difference between England and rest of the UK. On the issue of this potential difference, DBT highlighted to us that under UKIMA, precision-bred plants and animals, and food and feed derived from them, which are produced or imported into England can be legally marketed in another part of the UK. DBT also indicated that they are monitoring global regulations on genetic technology, including in the EU.
Further regulatory developments in relation to goods
Further regulatory developments that we identified in relation to goods are listed below, with details set out in Appendix C:
-
fireworks
-
rodent glue traps and animal snares
-
vapes
-
alcohol advertising
-
further single-use plastic measures
-
minimum unit pricing of alcohol
-
net zero policies (phasing out of gas boilers, and petrol/diesel cars)
-
plasticated wet wipes
-
reforms to assimilated law on wine
-
XL Bully dogs
Services
Regulatory landscape assessment in relation to services
Figure 3.2 shows that for each nation the proportion of services employment that is in sub-sectors that are not subject to regulatory difference is much larger (ranging from 13% to 4%) than for goods. Similarly, for each nation, the proportion of employment that is in services sub-sectors that are devolved but excluded from UKIMA is also substantially higher than for goods. This means that the proportion of employment in the third category of sub-sectors that potentially subject to regulatory difference and the MAPs is somewhat smaller than for goods, although still the largest category.
For this reason, in each nation, the total number of people employed in services sub-sectors that are potentially subject to both regulatory difference and the MAPs is still greater than equivalent number for goods.
Figure 3.2: Services sector economic activity (percentage of total services employment[footnote 86] by relationship with the regulatory difference and the MAPs
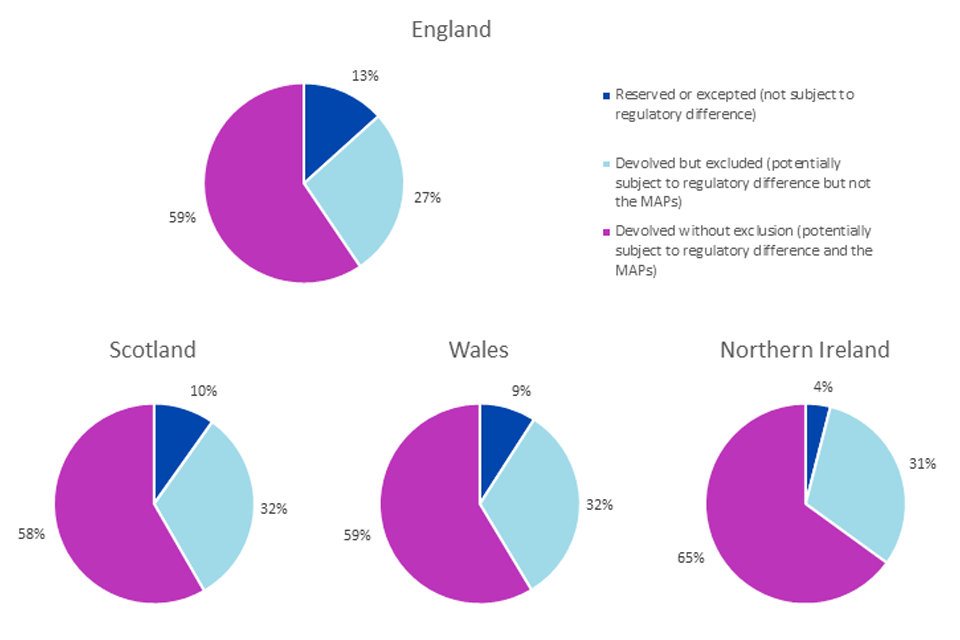
A set of four pie charts showing the Services sector economic activity for each UK nation as a percentage of total services sector employment for each UK nation by categories of relationship with regulatory difference and the MAPs (Reserved or excepted; Devolved but excluded; and Devolved without exclusion).
The first pie chart shows the Services sector economic activity for England. 59% of total Services sector employment in England accounts for Devolved without exclusion; 27% for Devolved but excluded; and 13% for reserved or excepted.
The second pie chart shows the Services sector economic activity for Scotland. 58% of total Services sector employment in Scotland accounts for Devolved without exclusion; 32% for Devolved but excluded; and 10% for reserved or excepted.
The third pie chart shows the Services sector economic activity for Wales. 59% of total Services sector employment in Wales accounts for Devolved without exclusion; 32% for Devolved but excluded; and 9% for reserved or excepted.
The fourth pie chart shows the Services sector economic activity for Northern Ireland. 65% of total Services sector employment in Northern Ireland accounts for Devolved without exclusion; 31% for Devolved but excluded; and 4% for reserved or excepted.
Source:
GB: NOMIS database, 2021 data, count by Employment
NI: Business Register and Employment Survey, 2021 data, count by Employees
Note: Charts are based to be all the same size and are not to scale of the proportion of each nations’ employment figures in the Services Sector
Current and upcoming regulatory developments in relation to services
The evidence we gathered for our annual and periodic reports published in March 2023 focused mainly on the operation of the MAPs in relation to goods, as we did not identify evidence of regulatory changes that might interact with the MAPs as they apply to services. In this report, we have expanded our coverage on the internal market by including additional analysis of services. We have identified the following regulatory developments in relation to services, with details set out in Appendix C:
-
rodent glue traps
-
regulation of cosmetic procedures
-
national standards for taxi and private hire vehicles
-
licensing of activities involving animals
-
tourism measures (licensing of short-term lets and visitor levies)
Regulated professions
Introduction
In this section, we provide an analysis of the regulated professions in the UK, using information from the UK Regulated Professions Register and data collected from regulators or public sources.
First, we provide an economic overview of the regulated professions, setting out how many fall into each of 3 distinct scenarios which, together, describe the regulatory landscape.
We outline the nature of the regulatory differences we found in regulated professions which are subject to multiple regulatory regimes across the UK nations. We then discuss which regulated professions are impacted by reserved matters, and which are excepted or out of scope of UKIMA. For these professions, we present indicative estimates of the number of professional registrations made with their regulators.
Finally, we identify upcoming regulatory developments which could create additional regulated professions in future.
Regulatory landscape
There are 192 regulated professions across the UK, in which we found 3.5 million economically active professional registrations[footnote 87] with regulators. 81 professions are regulated on a UK-wide basis. The remaining 111 are therefore potentially subject to regulatory difference. Of these, 90 require only that a professional register with a different national regulator to trade cross-border. These professions account for around 1.5 million professional registrations. The remaining 21, which are mostly legal professions, require a professional to obtain a different national qualification to trade cross-border. There are around 250,000 professional registrations in these professions. To put these numbers in context, there are approximately 36.6 million employees in the UK.
The regulation of professions can be outside the scope of the MAPs either because it is a reserved matter or because it is excepted from UKIMA. The regulated professions which are reserved matters are those of Architect, Auditor, Veterinary Surgeon, a number of health professions[footnote 88] and, in Wales, legal professions. The regulated professions which are excepted from UKIMA are legal and teaching professions. We set out a full list of reserved and excepted professions in Appendix B.
We found around 2.05 million registrations with regulators in the regulated professions which are reserved matters, and around 850,000 registrations with regulators in the legal and teaching professions which are excepted from the MAPs.
Figure 3.3 shows the proportion of professional registrations that fall under professions which are reserved, excepted, or neither reserved nor excepted. Our data is likely to significantly understate the proportion of registrations in professions which are devolved without exception, as most of the 82 professions for which we were unable to gather data would fall into this category.
Figure 3.3: Regulated professional economic activity (percentage of total economically active professional registrations with regulators) by relationship with regulatory difference and the MAPs
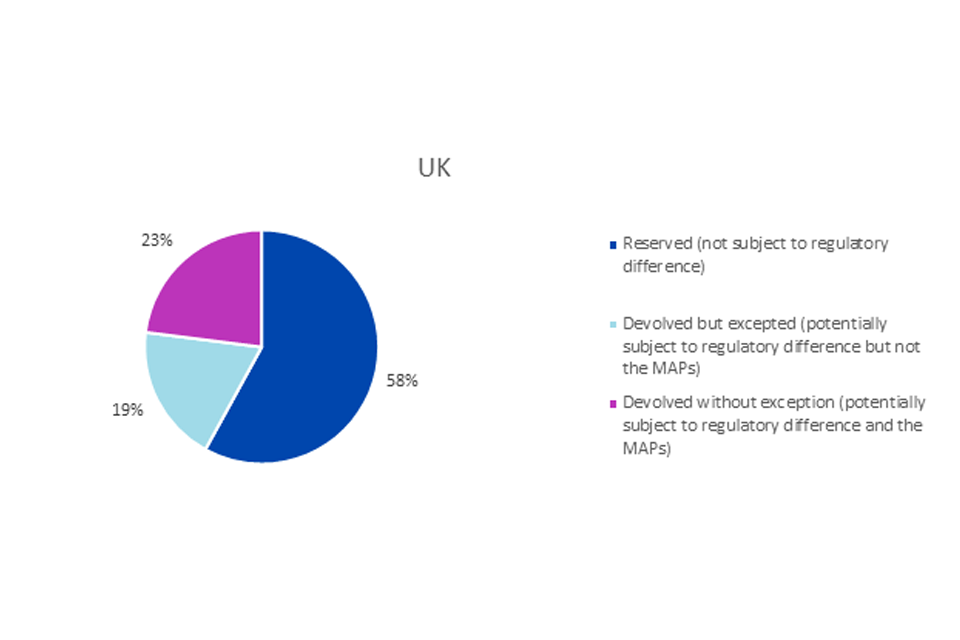
A pie chart showing Regulated professional economic activity for the UK as a percentage of total economically active professional registrations with regulators by relationship with regulatory difference and the MAPs (Reserved or excepted; Devolved but excluded; and Devolved without exclusion).
The pie chart shows Regulated professional economic activity for the UK, with 23% of total economically active professional registrations with regulators in UK accounting for Devolved without exclusion; 27% for Devolved but excluded; and 13% for reserved or excepted.
Source: OIM calculations – see Appendix B Note: Based on data for 110 of the 192 regulated professions in the UK
It is notable that many of the legal professions which require a professional to obtain a different national qualification to trade cross-border are excluded from UKIMA in at least one of the UK nations. However, as all the regulations governing the professions that are neither reserved nor excluded pre-date the commencement of the UKIMA, the MAPs do not currently apply to them either (because regulations introduced before UKIMA are not subject to its provisions). The MAPs may apply to any future changes to requirements in these regulated professions, or to any newly regulated professions.
Regulatory developments
We have identified a small number of regulatory developments in relation to the regulated professions. We note that some of these are being brought forwards in conjunction with regulation of the associated services. Further detail on each of these regulatory developments is set out in Appendix C.
-
certification of electricians
-
licensing of dog walkers and providers of other canine services
-
licensing of practitioners of non-surgical cosmetic procedures
-
licensing of building inspectors
-
licensing of individuals involved in waste transportation
-
licensing of acupuncture, body piercing, electrolysis, and tattooing procedures
-
regulation of Pharmacy Technicians
Conclusions
The goods sector is largely within the scope of the MAPs, with only a small proportion of total goods sector employment not subject to them by way of being reserved matters or excluded from the MAPs. The goods sector has seen the most significant developments in regulatory difference over the last 12 months, with a greater number of regulations being brought forward than in relation to either services or professional qualifications.
Most of these proposed regulations have yet to take effect and so any impacts they may have on the internal market are yet to become fully apparent. While some of the proposed regulations will apply to relatively small sub-sectors, in total the volume of economic activity subject to differences in regulation is rising over time. It is also more concentrated in some sub-sectors than others, with proposed regulations that collectively will apply to a large proportion of the food and drink sectors, in particular. This creates something of a ‘patchwork quilt’ of potential effects, some of which have limited the impact of new regulations on the internal market; to better understand this, our case studies in Chapter 4, each of which examines business responses to regulations applying to goods, explore in more detail how business responses might vary between different regulations. Overall, we find that the impact of differing regulations on the internal market in relation to goods over the last year has been modest.
The MAPs are not likely to apply (by reason of being reserved matters or exclusions) to a greater proportion of services activity (as measured by employment data) than is the case for goods. In addition, the localised provision of services further complicates the picture of how these developments might affect trade and the internal market. Regulatory difference in relation to services is starting to emerge although regulatory developments are fewer in number than in relations to the goods sector. The proposed regulations apply to a diverse range of economic activities, in contrast to developments in goods which particularly apply to food and drink, with many of the others relating to environmental protection.
Given the complexity of analysing the services area and that regulatory difference is only just starting to emerge, we take the view that it is too early to identify any clear effects on the internal market. We intend to continue to monitor developments in relation to services including by considering further the effect on the internal market of regulations that apply to services that are predominantly or wholly delivered on a local basis.
Regulated professionals account for a significant proportion of all employed individuals. Based on registration data for 110 of the 192 regulated professions, we estimate that there are at least 3.5 million economically active registrations with regulators, which is just under 10% of all employed individuals.[footnote 89] Slightly less than 1% of all employed people are in the category of regulated professionals that are subject to the greatest degree of regulatory difference, that is, circumstances where they must obtain a different qualification in order to practice cross-border. It is notable that many of these professions are excepted from UKIMA and so the MAPs would not apply even if the governing regulations change. With respect to these regulated professionals, we therefore see little possibility for the functioning of the internal market to have changed since the introduction of UKIMA.
For other regulated professions which are currently subject to regulatory difference, the principal difference is registration with an additional regulator(s) in order to trade cross-border. We take the view that this is a more modest barrier to trade than a requirement for a different qualification and should be assessed accordingly. Notwithstanding this, all of the regulations relating to these regulated professions predate UKIMA and are outside of its scope (so the MAPs are not applicable). If the regulations change then UKIMA may apply but we note in this respect that, historically, change in the regulation of established professions is infrequent and that no changes are proposed at the current time by any of the governments in the UK.
The picture is different with regard to newly regulated professions. None of these are reserved or excepted from UKIMA and regulatory change is more likely as all government proposals in relation to regulated professions currently relate to defining new regulated professions. Data on cross-border trade by the professions affected by these regulations is sparse; at this stage we note only that many of them typically provide their services locally and so cross-border trade might be anticipated to be small.
Taken in the round, the emerging picture for the regulated professions is that there is no identifiable change to the functioning of the internal market for these professions since UKIMA took effect and that picture does not appear likely to change in the near future.
Business strategy case studies
Key findings
-
businesses have a strong preference for regulatory uniformity as it reduces costs and simplifies supply changes
-
businesses have a variety of strategies for responding to regulatory difference
-
responses include adopting a high standard that is compliant in all nations; actions to reduce supply chain complexity, such as producing a product that is compliant with regulations across the UK or product range reduction; or withdrawing from supplying particular nations.
-
the specific response chosen depends on a range of factors including the costs of the strategy; the current complexity of the supply chain; the ease of tracking and labelling goods; brand values; customer expectations and legal uncertainty
-
the effects of a regulation introduced by one nation can arise in other nations
-
in some circumstances, policy makers may be able to reduce any adverse trade effects associated with regulatory difference through careful policy design
We have, for the first time, undertaken some case studies looking into the specific strategies employed by businesses to manage regulatory differences across their operations to help us understand how the UK internal market is developing. The case studies provide a granular focus on the effects of regulatory differences that should be read in conjunction with the broader, higher-level discussion of developments in the internal market that is set out in chapters 2 and 3.
Although the data available on business strategies at the time of the 2022 to 2023 annual report was limited (not least because of a low level of business awareness of UKIMA and the MAPs), it was already becoming clear by the time we published our report on Defra’s peat regulations[footnote 90] that businesses might adopt any one of a wide range of strategies and that the factors driving that decision are typically multi-faceted.
To improve our understanding of these business strategies and to better understand how they might vary depending on context, we have conducted 4 case studies where regulatory difference has occurred or is likely to occur in the near future. We have examined the approaches that businesses have adopted in response to that regulatory difference.
The 4 case studies, single use plastic, deposit return schemes, high fat, salt and sugar foods and precision breeding, were chosen because of the anticipated level of regulatory difference and the likelihood that businesses have already adapted to regulations that are in force or are likely to have advanced plans about how they might do so.
The case studies examine the anticipated (and in some cases actual) response of businesses to regulatory difference. Although a broad direction of travel for the internal market can be inferred from our findings, a more detailed picture that attempts to quantify the impact would require additional and more detailed research. In some cases, more information about the specific nature of the regulatory difference that will eventually emerge will be required before a more detailed picture can be drawn. For these reasons, we have focused our attention on understanding how businesses subject to the regulations in each of these 4 areas have changed, or are planning to change, their operations.
The research has been taken forward through a series of interviews with businesses operating in industries affected by the regulations. The interviews sought to identify any factors specific to the industry and explore a range of possible drivers behind the business’ strategy including but not limited to: costs, complexity, competition and competitiveness, interaction between the changing regulation and other regulations, legal certainty, branding and reputation, broader corporate goals (such as environmental, social and governance (‘ESG’) commitments), customer demand, and the role of international exports and imports. We selected businesses for interview taking into account the need to identify business operating in, and where possible headquartered in, all 4 nations of the UK. Our sample included large and small businesses although larger businesses were generally more willing to participate in an interview and so our sample is more representative of large businesses operating across the UK than other types of business.
We first describe the specific context surrounding each of the 4 areas and what the businesses told us about their preparations for the regulations and the factors underlying those preparations. We conclude by identifying themes and trends common to the 4 case studies and discussing their relevance in other sectors and for other regulations.
Single use plastic
Introduction
As part of the transition to a circular economy, and to reduce levels of plastic waste, the UK and Devolved Governments have sought to reduce the UK’s reliance on single use plastic (SUP). Beginning in October 2019, legislative measures to restrict the supply of commonly littered SUP items have been progressively implemented in Scotland, England and Wales, and proposed in Northern Ireland (although proposals in Northern Ireland have been largely on hold pending the return of the Northern Ireland Assembly). Each of the nations has taken its own approach, creating differences in policy and the implementation timetable for restrictions.
A detailed description of the measures taken in each nation is available at paragraphs 3.8 – 3.11, with further detail in Appendix C. Below, Table 4.1 summarises the differences between the measures:
Table 4.1. Legislative measures to restrict the supply of SUP items by UK nation
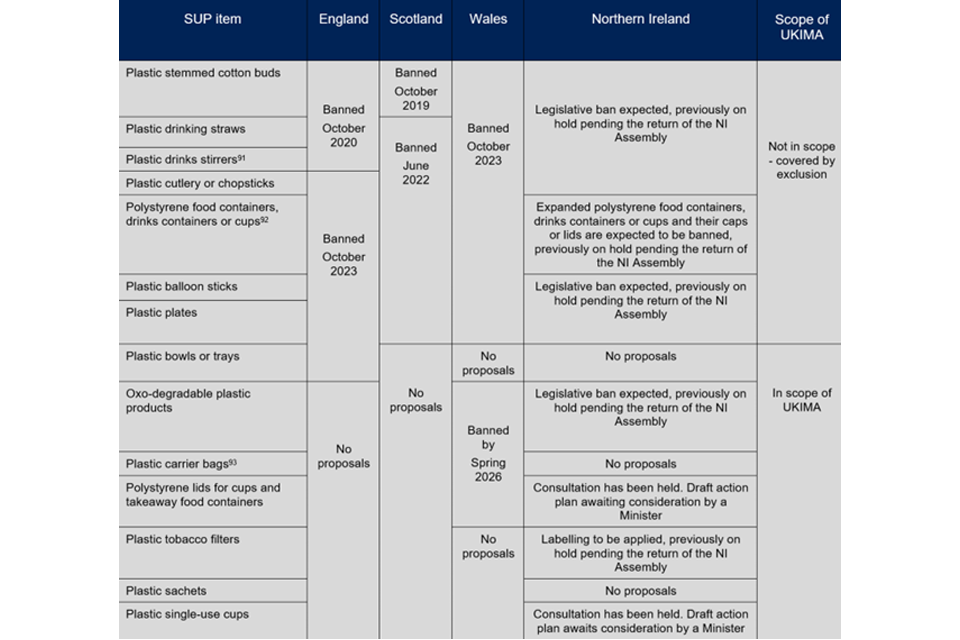
Table footnotes: [footnote 91], [footnote 92], [footnote 93]
A graphic showing the different legislative measures that have been taken in each UK nation to restrict the supply of SUP items.
Plastic stemmed cotton buds were banned in Scotland in October 2019, in England in October 2020, and in Wales in October 2023. A legislative ban is also expected in Northern Ireland, having previously been on hold pending the return of the Northern Ireland Assembly. Plastic stemmed cotton buds are not in scope of UKIMA as they are covered by an exclusion.
Plastic drinking straws and stirrers were banned in England in October 2020, in Scotland in June 2022 and in Wales in October 2023. A legislative ban is also expected in Northern Ireland, having previously been on hold pending the return of the Northern Ireland Assembly. Plastic drinking straws and stirrers are not in scope of UKIMA as they are covered by an exclusion.
Plastic cutlery or chopsticks, balloon sticks and plates and polystyrene food containers, drinks containers or cups were banned in Scotland in June 2022 and in England and Wales in October 2023. A legislative ban is also expected in Northern Ireland, having previously been on hold pending the return of the Northern Ireland Assembly. Plastic cutlery or chopsticks, balloon sticks and plates and polystyrene food containers, drinks containers or cups are not in scope of UKIMA as they are covered by an exclusion.
Plastic bowls or trays were banned in England in October 2023. There are no proposals to ban these items in Scotland, Wales or Northern Ireland. Plastic bowls or trays are in scope of UKIMA.
Oxo-degradable plastic products will be banned in Wales by Spring 2026. There are no proposals to ban these items in England or Scotland. A legislative ban is expected in Northern Ireland, having previously been on hold pending the return of the Northern Ireland Assembly. Oxo-degradable plastic products are in scope of UKIMA.
Plastic carrier bags will be banned in Wales by Spring 2026. There are no proposals to ban these items in England, Scotland or Northern Ireland. Plastic carrier bags are in scope of UKIMA.
Polystyrene lids for cups and takeaway food containers will be banned in Wales by Spring 2026. There are no proposals to ban these items in England or Scotland. A consultation on measures in relation to these items has been held in Northern Ireland, and a draft action plan is awaiting consideration by a Minister. Polystyrene lids for cups and takeaway food containers are in scope of UKIMA.
Labelling will be applied to plastic tobacco filters in Northern Ireland, having previously been on hold pending the return of the Northern Ireland Assembly. There are no proposals on these items in Wales, England or Scotland. Plastic tobacco filters are in scope of UKIMA.
There are no proposals to restrict the supply of plastic sachets in England, Scotland, Wales or Northern Ireland. Plastic sachets are in scope of UKIMA.
A consultation has been held in Northern Ireland on measures in relation to plastic single-use cups, and a draft action plan is awaiting consideration by a Minister. There are no proposals to restrict the supply of plastic single-use cups in England, Wales or Scotland. Plastic single-use cups are in scope of UKIMA.
With the exception of plastic-stemmed cotton buds and SUP balloon sticks, restrictions have focussed on SUP items used in the consumption of food and drink products. We have therefore focussed our case study on how food and drink retailers have responded to the SUP restrictions.
We asked businesses to outline the factors driving their approach to managing different national restrictions on SUP drinking straws, drinks stirrers, cutlery, chopsticks, plates, bowls and trays, and polystyrene drinks or food containers and cups (which we refer to as the ‘in-scope SUP items’ in the rest of this section). We did not ask businesses about managing restrictions on plastic-stemmed cotton buds and SUP balloon sticks.
We received evidence from 4 of the UK’s largest supermarkets. The supermarkets were selected for the breadth of their operations that are affected by SUP restrictions and, given these operations span across the UK’s nations, their exposure to regulatory difference. We also interviewed a multinational food and drink packaging manufacturer which supplies several large retailers in the UK. In addition, we have examined public commitments and other statements on plastic reduction from a number of the UK’s largest takeaway coffee and restaurant chains.
Below we outline the approaches to managing the SUP restrictions that have been taken by the businesses we have examined. We then discuss the factors that the supermarkets told us were driving their approaches, before making some concluding remarks on the case study.
Approaches adopted in response to differences in SUP restrictions
Our view is that overwhelmingly, the businesses we have examined are taking a UK-wide approach to the supply of SUPs, rather than treating UK nations with different regimes as separate markets. In many cases this means that retailers have withdrawn in-scope SUP items from UK nations where they may still be legally supplied.
Supermarkets
All 4 supermarkets we spoke to reported that they had supplied in-scope SUP items in the past. However, these have incrementally been removed from their UK supply chains over time, with an acceleration in this trend since 2018, prompted by the introduction of restrictions. All 4 supermarkets have now phased out all the in-scope SUP items across the UK and reported that they do not expect to supply these to UK customers in future.
The supermarkets identified 3 business areas which previously involved the supply of in-scope SUP items to UK customers. In these areas, alternative items are now provided instead. The supermarkets reported subtle differences in their use of SUP items in each of the businesses areas which impacted their decision-making in response to the different national restrictions:
-
items such as cutlery, food and drink containers, drinks stirrers and drinking straws are commonly provided to customers consuming takeaway food or drink products in-store. In-store cafés, of which c.1000 are operated by the 4 supermarkets, and other in-store units such as salad bars, hot food counters and food and drink concessions typically provide these items
-
some pre-packaged food and drink products, designed to be consumed by customers ‘on the go’, are packaged in bowls or trays and include other items such as cutlery. The supermarkets manufacture these products as well as retailing them
-
many of the in-scope items are sold for home use in bulk
Where they have encountered differences in the timing of national restrictions, the supermarkets have adopted a strategy of removing in-scope SUP items from their supply chains on a UK-wide basis in advance of the first national restriction to take effect. SUP straws and stirrers were almost entirely removed from the supermarkets’ UK supply chains ahead of the ban in England which came into effect in October 2020, while SUP cutlery, chopsticks, plates and polystyrene containers and cups were almost entirely removed from the supermarkets’ UK supply chains ahead of the ban in Scotland which came into effect in June 2022. For a short period, some of the supermarkets continued to supply in-scope SUP items in the UK nations where restrictions had not yet commenced, to sell-down their remaining stocks.
Where they have encountered differences in the scope of national restrictions, the supermarkets have, in effect, adopted a strategy of acting to the ‘highest common denominator’, that is adopting a single UK-wide policy that is compliant with the regulations in each nation. Each of the 3 supermarkets that we spoke to which have operations in Northern Ireland have stopped supplying in-scope SUP items in Northern Ireland despite the absence of restrictions, in line with their position in the other UK nations. Similarly, all 4 supermarkets have stopped supplying SUP bowls and trays across all UK nations, despite England being the only nation to have banned the supply of these.
In addition to our interviews with the supermarkets, we examined public statements on SUP made by a sample of 8 of the largest takeaway coffee and restaurant chains operating in the UK.
Public statements from these businesses suggest that, like the supermarkets, they have taken a UK-wide approach to the supply of in-scope SUP items. Each of the coffee and restaurant chains removed SUP straws from their UK supply chains ahead of the ban which came into force in England in October 2020. Some of the businesses also phased out SUP straws from their wider global operations at this point.
Similarly, all of the restaurant chains have phased out SUP cutlery from their UK supply chains. One restaurant chain trialled paper-based cutlery in Scotland, the Republic of Ireland, and Northern Ireland, ahead of the ban on SUP cutlery in Scotland which came into force in June 2022. After a short trial period, it also phased out SUP cutlery from England and Wales. Many of the coffee and restaurant chains have set further public deadlines to phase out SUP from their supply chains entirely.
Evidence from the packaging manufacturer that we interviewed also suggests that large food and drink retailers are taking a UK-wide approach to the supply of SUPs. The manufacturer provides food and drink packaging to a number of large food and drink retailers in the UK. The manufacturer told us it produces a single, ‘core’ product line for its UK customers, which is designed to comply with all SUP restrictions in effect across the UK nations. The manufacturer also has the capability to produce bespoke products, such as packaging designed to meet a particular national requirement, if requested by retailers. However, the manufacturer told us that retailers overwhelmingly request SUP-free packaging, and do not request more than one packaging specification for their UK operations.
Factors influencing the decision to adopt a UK-wide approach
The supermarkets and the packaging manufacturer identified significant advantages of having a single UK operating model, which requires a uniform position on the supply of SUPs in the UK nations. They highlighted the benefits of reduced operational complexity, including cost savings and reduced legal compliance risk. The supermarkets further outlined a number of factors related to the cost and efficacy of SUP alternatives and switching costs. They also cited brand considerations in their decisions, including the role of sustainability commitments, compliance with local legislation and ‘brand coherence’. We explore each of the factors that were described to us below.
Reduced complexity
The supermarkets highlighted the importance of maximising economies of scale in their business activities, which can generate significant cost savings when applied across the scale and breadth of their portfolios. Due to this, one supermarket described maintaining a single UK operating model as being ‘key to our business’.
We were told that there are cost savings in procurement and distribution when the same ‘standard’ of items are supplied across all UK nations. Uniformity of supply simplifies procurement requirements, reducing the time that managers and other staff need to spend on supplier management. It also reduces the need for systems to track stock distribution, as the same items are sent to all stores. The reduced operational complexity reduces staff training costs.
The supermarkets also told us that there are cost savings in manufacturing when the same pre-prepared food and drink products are supplied across all UK nations. Uniform products which comply with the SUP requirements in all nations can be manufactured on a single production line, which reduces manufacturing costs.
This sentiment was echoed by the packaging manufacturer. It told us that manufacturing more than one core product ‘standard’ for the UK market would not be economically viable, and if a retailer requested packaging containing SUP on a bespoke basis this would have higher production costs due to the reduced economies of scale. This would be reflected in a higher price.
Legal compliance benefits
One supermarket told us that supplying the same stock-keeping unit (SKU)[footnote 94] for all UK nations helps it to minimise its risk of accidental non-compliance with local restrictions. The supermarket outlined its manufacturing process for pre-packaged food and drink products, which takes place on a single production line. At the point of manufacture, the end store destination of a product is not determined. As the supermarket produces a single SKU to comply with all national SUP restrictions, it does not need to track the distribution of individual products and there is no risk of products being sent to the wrong locations.
Costs of alternative products
All 4 supermarkets told us that the costs of SUP alternatives were a factor in their decision-making, as non-plastic alternatives are more expensive. The supermarkets we spoke to told us that in most cases they have absorbed the costs, rather than passing them on to customers. One supermarket acknowledged that this has resulted in lower margins on certain products. We were told that customers are not willing to pay higher prices to fund sustainability initiatives, although customers strongly support them. In many cases in-scope items are provided free of charge to customers, for example those who have purchased food or drink at in-store cafés. This makes it difficult to pass on the costs.
Switching costs
Stock wastage was frequently mentioned as a switching cost. During the changeover period from plastic to non-plastic items the supermarkets tried to minimise this by redistributing stock which had been banned in one UK nation to stores in other locations where the stock could still be supplied. Nonetheless, some stock eventually had to be written off to ensure compliance with restrictions.
Non-plastic replacement items undergo significant testing before being rolled out in stores. One supermarket told us that it has a lead time of 18 months to replace an SUP item in its supply chain with an alternative, with testing taking up the bulk of this time.
The supermarkets also flagged the indirect costs of phasing out SUPs. A significant amount of management time was spent on finding suppliers able to supply SUP alternatives or working with existing suppliers to meet new requirements. In addition, replacing SUP items in supply chains necessitated changes to IT systems, additional stock checks and higher staff training costs.
Efficacy of SUP alternatives
The supermarkets told us that on the whole, suppliers have been able to provide effective alternatives to the in-scope SUP items, albeit at a higher cost, and these have been accepted by most customers.
However, phasing out the in-scope SUP items has not been unanimously well received by customers. One supermarket gave us the example of introducing paper drinking straws, which received a mixed reception from customers. The supermarket received some negative feedback about their efficacy compared to plastic straws and considers finding an effective replacement for SUP drinking straws to be a work in progress.
The supermarkets expressed concern that future plastic reduction would be more difficult than phasing out the in-scope SUP items has been so far. They told us that the most easily removed SUP has been phased out, either voluntarily, or in response to the restrictions. Remaining SUP items in the supply chain currently have limited alternatives.
To further understand the role of effective alternatives, we explored with the supermarkets whether they would take the same approach to SUP plastic sachets that they have taken to other SUP items. Sachets are commonly used to provide individual servings of sauces and other condiments in takeaway food settings. They are not part of the current restrictions but have been discussed by some of the 4 governments as a potential target for future restrictions.
The supermarkets felt that there were limited alternatives to SUP sachets. They told us that like for like replacements made from sustainable materials would require further product development from suppliers. One alternative to using plastic sauce sachets in store could be giving customers access to a large sauce container, rather than individual portions. However, it was felt that this had drawbacks, such as poor portion control, which could lead to increased food waste and higher costs. The supermarkets told us that this presents a trade-off between different sustainability objectives: plastic reduction, on the one hand, and reducing food waste, on the other. The supermarkets told us that while they would prefer to adopt a single UK position on the supply of SUP sachets, as they have for other SUP items, if differing restrictions on SUP sachets were introduced in future, they would need to further weigh up the benefits and drawbacks of phasing out SUP sachets before determining whether this was possible.
Brand considerations
Throughout our discussions with the supermarkets, it was clear that they regard phasing out SUP as good for their brands. Broadly, there were 3 reasons given for this. First, plastic reduction initiatives are a prominent part of published sustainability commitments made by the supermarkets, which they told us their customers support. Second, phasing out in-scope SUP items in the nations with restrictions demonstrates compliance with local legislation, which customers expect. Third, applying the same product standards across all UK store locations helps maintain brand coherence.
All 4 supermarkets have published sustainability commitments which prominently feature plastic reduction initiatives. The supermarkets flagged their commitments in our discussions and emphasised that they support the aim of SUP restrictions. They told us that phasing out SUP where effective alternatives exist was ‘the right thing to do’. Given their commitments, the supermarkets were already phasing out some of the in-scope SUP items before the introduction of legislation. One supermarket told us it started work to phase out SUP as early as 2015 and had removed most of the in-scope SUP items from its supply chain in 2018.
The supermarkets perceive that their customers also support phasing out SUP, with one supermarket telling us that plastic reduction had been ‘high in the public mind’ in the years before the Covid-19 pandemic. Sustainability commitments are seen as an area of non-price competition by the supermarkets. One supermarket told us that if customers perceived it to have made minimal effort to phase out SUP, there was a risk of losing market share to rivals with more effective plastic reduction initiatives.
Conclusions
The businesses we spoke to (which, importantly, were exclusively large businesses with substantial cross border operations and complex supply chains) identified a range of factors that had influenced their decisions on how to address differences in SUP restrictions.
We observe that the approaches taken by the supermarkets to managing different SUP restrictions, and the factors driving them, remained the same regardless of which nation was the ‘first mover’ in introducing a restriction. The supermarkets have faced a variety of scenarios, with different nations moving first in restricting different SUP items, but they decided to remove all the in-scope items from their supply chains on a UK-wide basis in advance of the first national restriction to take effect – taking a highest common denominator approach. This is likely to be a helpful insight for policy makers. In our view, for SUP this approach is likely to have been influenced by the similarity of the policy direction in each nation and the time-limited nature of the differences between the policies in relation to certain items.
The businesses’ observations about costs merit further exploration. There were costs associated with using alternative (non-plastic) materials, which could have been avoided by supplying SUP items in certain jurisdictions where those items could still be legally supplied. However, these had to be set against the costs of increased supply chain complexity that would be required to accommodate using plastic and non-plastic items in different parts of the same business. For this case study, we did not ask the businesses to quantify this trade-off, but they explained that the costs associated with supply chain complexity can quickly mount. We anticipate that a similar trade-off will likely exist for other types of regulatory difference.
The role of branding and, to a lesser degree, the role of any corporate policy to comply with local legislation was highly important to the businesses we spoke to, something that we recognise is likely to be true, at least in part, for many large businesses. However, the influence of these factors for smaller businesses with weaker brands, more limited cross-border operations and/or less complex supply chains may be different; we would need to undertake further work to assess this.
Deposit return schemes
Introduction
This case study examines the factors beverage manufacturers took into account when considering how to address regulatory difference between the nations of the UK. In particular, we were interested in how businesses considered use of the MAPs.
Around 50 countries currently have deposit return schemes (DRS). In a typical DRS consumers pay an additional sum when they buy a beverage in a container. This sum is then refunded when the consumer returns the container to a designated point, often a retail location.[footnote 95]
Governments can have a number of objectives when introducing a DRS. Typically the intention will be to bring about behaviour change among consumers, retailers and producers of beverages, to maximise the recycling of drinks containers. DRS also enables a segregated waste stream for in-scope items, which should mean more of the material collected for recycling can be used. Other aims of a scheme could be to reduce litter and the cost of clean up, and to reduce energy and materials use.
These schemes are often considered as part of wider circular economy and extended producer responsibility measures, which aim to incentivise producers to ensure their products are recyclable and to minimise unnecessary packaging material.
DRS requires a governance mechanism, to manage flows of money and materials. This can be achieved by setting up a deposit management organisation (DMO), funded by industry and operated on a not-for-profit basis. The DMO can be held accountable for the effective operation of the scheme including, for example, meeting targets for collection of waste material. Further detail on the proposed regulations is at paragraphs 3.12 to 3.15.
To gather evidence to consider this question, we spoke with producers, wholesalers and retailers involved in the drinks sector in the UK. The businesses we spoke with ranged from multinational brands to niche suppliers. We also engaged with trade bodies that, collectively, represent the views of over 1,000 businesses in the beverage sector.
Businesses we spoke with anticipated that there might be differences in design and approach between DRS schemes in the UK, including with respect to timing of implementation and the materials that would be in scope. On this understanding most businesses were preparing for a commercial environment in which there would be a period of regulatory difference and possibly permanent regulatory difference (with the implication that the various schemes might not be interoperable).
We explored the response to these anticipated regulatory differences with these businesses from both the perspective of the anticipated temporal differences and also the potential differences in scheme design. With respect to the latter we have worked on the understanding that, although they are being developed in collaboration, there may be differences in scheme design between the England, Wales and Northern Ireland schemes. There may also be differences between those schemes and the scheme in Scotland. This case study aims to understand business strategy in response to potential regulatory difference arising from development of different DRS schemes in different nations of the UK at different times.
Approaches adopted in response to differences in DRS requirements
When considering the specific impacts of introducing a DRS in one nation of the UK, producers and retailers (which can often be parts of the same business) told us that they utilise 3 main strategies:
-
continue to trade as previously, complying with local legislation, either absorbing the costs of the scheme or passing them on through the supply chain, ultimately to consumers
-
continue to trade in the nation that is introducing the regulations but offer a reduced range of products to mitigate costs and complexity
-
focus on supplying one nation or a subset of nations. This might mean realignment to focus on the business’s main market, which could be in the nation introducing the regulations or a different nation.
From our discussions with stakeholders, we have identified factors businesses consider when deciding between these strategies.
Factors influencing a decision to continue to trade as previously
Brand reputation and compliance
Several stakeholders referred to the beverage sector, and the wider food and drink industry, as a ‘high compliance’ environment, where businesses tended to take a ‘highest common denominator’ approach to regulation. In practice this meant businesses would often move ahead of regulation, for example in relation to health or environmental requirements, because this was perceived to be what customers would expect and in order to make changes to product lines or supply chains on a suitable timescale.
In that context, the stakeholders we spoke with were overwhelmingly in favour of DRS and strongly supported interoperability of schemes within the UK. In the specific example of the proposed scheme in Scotland, several stakeholders emphasised they had engaged with the scheme from the outset, including as founder members of the scheme DMO, Circularity Scotland. Retailers with physical stores had made extensive preparations to participate in that scheme and some producers had explored ways to meet scheme requirements, while maintaining their current offering in the Scottish market.
Factors commonly cited in these decisions included brand reputation around compliance. As part of this, stakeholders also pointed to consumer expectations around how a brand would respond to regulation, including in relation to any wider environmental messaging associated with the brand. Some businesses had trialled return point operations, highlighting a desire to be fully ready to implement the scheme requirements. These businesses had typically made capital investment in the infrastructure needed to operate a return point, underscoring their commitment to successful delivery of the scheme.
A specific aspect of brand reputation was evident from our discussions with stakeholders. Businesses based in Scotland, in particular smaller producers, had registered with the Scottish scheme because they had positioned their brands as ‘Scottish products’ and participation in the Scottish market was an integral part of their brand. Focusing on sales in the rest of the UK, even in the short-run, was not a viable strategy even if they made substantial sales in those markets. We take the view that while this consideration probably only applies to a small proportion of businesses, a similar effect could apply to other nations which are introducing their own DRS.
Supply chain visibility
Many stakeholders highlighted the complex structure of the beverage supply chain in the UK. This is discussed further below. Large producers (including large retailers with extensive own brand ranges) were more likely than other businesses to have a predetermined destination for their products. This potentially allowed greater scope to track products through the supply chain, meaning that these larger businesses operating across the UK were better placed to target delivery of products that complied with regulatory requirements in a given nation (though to do so would still incur cost and complexity).
Ability to pass through costs
Where businesses had decided to continue to trade as previously, it was likely increased costs would be passed through to consumers. A DRS will typically increase retail prices, to reflect addition of the deposit and the need to cover scheme costs. Businesses were clear scheme costs would be passed onto consumers, as there was limited scope to absorb costs in a sector where margins could be tight.[footnote 96] The ability to pass these costs on was a consideration for businesses choosing not to adapt their overall strategy to mitigate the costs.
Factors influencing a decision to offer a reduced range and /or focus on particular nations
Most of the stakeholders we spoke to identified ways in which costs might increase in their businesses and supply chains as a result of regulations that were different between nations. We explored these with a view to understanding whether businesses would change anything about their approach to mitigate these costs.
Wholesale distribution in the beverage sector
From an internal market perspective, it is notable that supply chains tended to be structured on a UK-wide (or, in some cases, GB-wide) basis. Echoing comments made by businesses in our qualitative research[footnote 97] for the 2022 to 2023 annual report, the sector did not tend to consider the UK’s internal borders. For example, distribution sites could often serve more than one nation, especially if located reasonably close to border areas. Producing separate product lines for each nation was not typically a feature of the sector.
While large producers would be more likely to have predetermined destinations for products, for SMEs we heard that approximately 90% of stock might be sold to wholesalers, who, at the time they purchase the stock, would not necessarily know the identity or location of the customer to whom that stock would ultimately be sold. Products might pass through several intermediaries before reaching their end outlet. Tracking products was complicated and data capture through the supply chain could be variable; establishing reliable systems for tracking and data capture would add to costs.
Where regulations differ between nations, a warehouse would need to maintain separate positions for stock for each market where different regulations apply. Stakeholders took the view that as well as increasing complexity it would increase cost in other ways. Stock holding might need to increase due to inflexibilities in moving stock between nations. There might be a shortage of stock held for one nation and a surplus of stock held for another, but stock intended for one nation could not be delivered into the other nation, if that stock did not meet the DRS requirements of that nation. Some producers noted that sales volumes in the beverage industry are influenced by a number of factors including the weather. It would be challenging for producers and wholesalers to forecast how much stock was required for each nation. If more stock was required that would increase stock-holding costs and might also require more warehouse space. It was plausible that a decision by one nation to change its regulatory requirements could have cost and complexity impacts in other nations served by that supply chain. Businesses might respond to increased complexity by refocusing their activities on their main market, which might not be the nation introducing the regulation.
Duplication of stock keeping units
In developing its scheme, the Scottish government acknowledged the potential for fraud and for accidental leakage of items from other nations in the UK. As a producer responsibility scheme, the responsibility for addressing these risks rests with drinks producers and the scheme administrator, since the costs posed by any fraud would fall upon those producers. The scheme administrator accepted specific SKUs for containers placed on the Scottish market, or a surcharge to producer fees for managing the scheme where single UK barcode was used, as means to address these risks.
In general, businesses identified that duplicating SKUs to accommodate different regulations between nations would increase costs. For example, in a factory producing 80,000 bottles per hour, a pause to switch from production of non-DRS to DRS items could mean that, cumulatively, thousands of units of production could be foregone, in order to serve what might be a relatively small part of the business’s overall market. In general, businesses considered that the costs associated with nation-specific SKUs would be economically viable only where sales volumes were sufficient to justify costs arising from duplication.
Businesses emphasised a duplication of SKUs would, in itself, cause constraints, even if the overall volume of goods traded remained steady. Different SKUs would require separate storage and handling arrangements and there would be data and reporting implications, including the difficulty of tracking products intended only for one nation in the UK.
Labelling
Some stakeholders identified costs associated with labelling price-marked packs, that is, products where the retail price is printed on the label, in circumstances where the deposit varied between nations. A retailer told us that applying nation-specific stickers to products was more costly and less efficient than price-marked packs.
Cost mitigation strategies
Many of the costs that stakeholders identified as arising from regulatory difference varied with the number of product lines (or SKUs) the business operated, regardless of the volume associated with each SKU. This is a critical factor in understanding businesses’ cost mitigation strategies. Stakeholders considered that the cost saving from removing a low sales volume product from the portfolio was broadly similar to the costs of removing a high volume one. They said that this gives rise to 2 potential strategies, the attractiveness of which vary depending on the product portfolio that a business operates.
First a business could reduce the range of products it offers (either only in the nation with the most stringent regulations or across the UK). This would typically be achieved by removing the product lines with low sales volumes. This strategy would be most suitable for a business with some large volume products that account for the majority of sales and profits and a ‘tail’ of less popular product lines. The size of the business is less relevant than the profile of its product portfolio – both multinationals and SMEs told us they were considering range reduction as a strategy.
In general, range reduction would mean the withdrawal of, potentially, a large number of small volume products from the market. In doing this, some producers told us they would look to maintain a balance of products, rather than remove entire lines. Some referred to focusing on a ‘safe’ product offering, meaning an adequate range where the additional costs of scheme compliance could be managed. Businesses accepted that, once they had withdrawn from certain product areas, it might be difficult to return, as customers would be lost.
The scale of potential range reduction is difficult to quantify. No stakeholder we spoke to had taken a firm decision to reduce its range and the cost savings would in part depend on the degree to which the schemes differed, the full details of which were not fully available to our stakeholders at the time we spoke to them. Nevertheless, by way of example, a wholesaler suggested to us there could be a potential reduction of 20% to 30% in SKUs available in Scotland, across soft drinks and beer brands, owing to the complexity arising from differing DRS requirements across the UK nations (either temporarily or permanently). The scale of any reduction in product availability could vary depending, for example, on differences between sales volumes for a given product line in each nation.
Second, a business could withdraw from a nation (or nations) completely allowing them to focus their activities on complying with the regulations in a few selected markets. This strategy would be most suitable for a business with only low-volume products in its portfolio (such as some artisan producers) or a business with most of its sales in a sub-set of the UK’s nations. This strategy was mentioned less than range reduction by our stakeholders but one producer with heavily concentrated national sales and which considered itself a ‘must-carry’ item for supermarkets in its home nation but not elsewhere suggested that it might just focus on its home market, subject to confirmation of the details of the schemes across the UK.
Factors influencing use of the MAPs
Businesses expressed very little interest in using the MAPs to bring non-DRS items into Scotland. Businesses gave a number of reasons for this. Notably, producers told us that as the funders of the scheme they were committed to its success. It would not make sense to put items on the market that would undermine the DMO’s objectives. We might assume that where outcomes are funded by industry, there is a clear incentive on industry to make the measure successful and that this may be more compelling than any advantage which might be derived from the MAPs.
Also significant was the food and drink sector’s approach to compliance, including the adoption of new requirements ahead of regulation. Even where businesses could have legitimately brought in non-DRS items, they considered that using the MAPs equated to taking advantage of a ‘loophole’. Business linked this perception to their brand reputation and customer expectations that brands would ‘do the right thing’; utilising the MAPs could damage their brands in the eyes of some customers. We note that we were not able to explore fully whether smaller retailers who may not have the same brand values might be more willing to utilise the MAPs – especially if they perceive there to be a cost advantage from doing so.[footnote 98]
Businesses also cited logistical considerations. Several retailers told us that to sell DRS and non-DRS items together would confuse customers and further complicate supply chains. In respect of the Scottish scheme, some retailers questioned whether it would be legal to stock non-DRS products, even if those products had entered Scotland lawfully, because of the obligations placed on businesses by scheme legislation. In that context, reliance on the MAPs would become an additional risk.
Conclusions
This case study has highlighted some important dynamics that might affect business strategy with respect to regulatory difference between DRS that may also be of broader significance for other markets.
The role of a product portfolio with products that have widely differing sales volumes (for example, both high volume and low volume products) appears to be significant, at least in so far as the costs of regulatory difference are not proportionate to sales volumes.
The geographic dispersion of sales and the supply chain structure supporting those sales influences the response – particularly where they are concentrated in a sub-set of UK nations, as does the perception of a brand as being connected with a particular location or nation. This may be more common in the food and drink sector and in particular amongst artisan producers.
Protection of brand values was important and would likely lead to compliance with local regulations rather than use of the MAPs, at least amongst those businesses that had invested in their brands, especially retailers. None of the stakeholders we spoke to had any interest in being challenged over their use of the MAPs, much less to defend their position before the law if necessary, especially if local regulations placed specific obligations on businesses that might create tension with use of the MAPs. We note that without case law to clarify the position, the uncertainty is likely to remain.[^99]
High fat, salt, and sugar foods
Introduction
This case study examines how businesses are navigating potential regulatory difference across the UK in relation to HFSS promotions.
Governments across England, Wales, and Scotland[footnote 100] have put forward policies to address concerns about rising obesity levels, particularly among children, by implementing restrictions on the promotion of HFSS products in stores and online. These include volume promotions (for example, multibuys) and location promotions (for example, restricting the placement of HFSS products in stores and online). A detailed description of these policies can be found at paragraphs 3.16 to 3.20.
It is likely that each UK nation will follow the same definition for HFSS products, using the 2004 nutrient profiling model (NPM)[footnote 101], but the type of promotional policies and categories of products in scope could potentially differ from country to country. We therefore sought stakeholders’ views on how they are planning to approach these potential differences. We spoke to large British and international food retailers and food manufacturers who sell products that are in the HFSS categories. We also sought views from trade associations to gain an overall understanding of how the industry has responded to HFSS promotion restrictions and policy teams within the 4 governments responsible for food and drink issues.
Approaches to differences in HFSS promotional policies
Food manufacturers and food retailers (who are sometimes also food manufacturers via their own-brands) face certain choices in how they respond to regulatory differences between one or more nations of the UK. Broadly, those options are:
-
sell existing products in compliance with local regulations on promotional activity
-
reformulate the affected product(s) and offer the reformulated version only in the nation(s) where the reformulation is required to take the product outside of the HFSS restrictions
-
reformulate the product(s) and offer the reformulated version for sale across the UK
-
introduce new, non-HFSS products which can be offered on promotion alongside the established products
-
only offer the product(s) in nations where the regulations are most easily met
-
utilise the MAPs to sell existing product lines cross-border
Businesses that we spoke to said that the strategy they would adopt would vary depending on the specific product in question. However, there was a commonly held view that producing different products for different nations was best avoided, if possible.
There was broad consensus that products that were closest to the profile for consideration as a non-HFSS product were most suitable for reformulation, whereas other products would require alternative strategies (where views as to the best response varied between businesses). There was recognition that depending on the nature of the differences between nations it might not be possible to develop a product that avoided HFSS restrictions in each nation at a cost that was competitive in each nation. In that scenario, most businesses said that range reduction, with low volume items being withdrawn from the portfolio, was the most likely response.
Factors influencing the choice of strategy
Consumer attitudes
Based on our engagement with food manufacturers, we understand that prior to the announcement of HFSS promotion restrictions, the food and drink industry were already responding to evolving consumer attitudes towards healthier options. Businesses were proactively adopting measures to enhance the nutritional quality of their products, launching initiatives focused on reducing salt, sugar, and calorie content. This was alongside businesses working to voluntary targets set out by UK Government. Notably, there have been ongoing reductions in salt content in line with voluntary targets initially set in 2006 by the Food Standards Agency.[footnote 102] As a result, the UK is widely acknowledged to be leading in the world in salt reduction.[footnote 103] Businesses have been working to specific salt targets for 28 categories set by UK Government[footnote 104], most of which are categories included in the HFSS promotion restrictions.[footnote 105] In addition, retailers also told us that they are signed up to the UK Government’s voluntary sugar and calorie reduction programmes.[footnote 106]
This proactive shift in the food and drink industry reflected an acknowledgment of evolving consumer expectations and a voluntary commitment to offering more nutritious choices, even before the implementation of regulatory measures. A few businesses we spoke to stated that their reformulation strategies were focused on the NPM scores prior to the announcement of HFSS promotion restrictions. Most businesses, however, informed us that it was not until the announcement of the HFSS promotion restrictions that the NPM became the key target measure for them.
Reformulation strategy
Businesses told us that reformulation is commonly used as one of the key strategies to offer healthier products to consumers. Reformulation is a long and time-consuming process, with products typically looked at in cycles of 1 to 3 years. The announcement of HFSS promotion restrictions prompted businesses to place a greater emphasis reformulating products that were close to being non-HFSS based on their NPM scores, in addition to other factors (for example, internal or external nutritional targets, consumer taste preference, innovation).
According to businesses, reformulation changes are approached incrementally, with small adjustments made each time to preserve product quality and consumer acceptance. Businesses that made significant product alterations in the past experienced notable consumer losses, emphasising the importance of gradual modifications. A few businesses we spoke to were able to swiftly reformulate products on the cusp of non-HFSS status to ensure compliance ahead of legislation, enabling them to continue promoting their products in prominent areas in stores. These businesses had typically aligned their reformulation efforts to the NPM prior to the HFSS promotion restrictions.
However, many of the businesses we spoke to emphasised that only a small proportion of their products[footnote 107] had the potential to be reformulated to meet compliance. Manufacturers emphasised a reluctance to alter high-scoring HFSS products, such as chocolate or ice cream, considering them indulgent treats. Reformulating such products to meet the non-HFSS criteria could create an unrecognisable product. Businesses told us that, in such circumstances, they preferred to introduce new compliant products alongside established products. As a result, there are significant limitations to businesses utilising reformulation to navigate and respond to the regulations.
The businesses explained that potential regulatory difference has not had an impact on their reformulation activity; the work they have done in this respect was necessary for other purposes.
All businesses we spoke to confirmed that they currently treat the UK as one market, with no product variations across the home nations, with the exception that certain products may use locally sourced ingredients. Businesses emphasized that while regulatory difference raises concerns and heightens uncertainty for forward planning, it alone might not trigger substantial changes to their strategies. However, when asked what would happen if there were significant differences between the nations, particularly if one nation decided on adopting a more stringent HFSS definition than any other, businesses suggested it could become financially unviable to supply less popular products in those markets. In such circumstances, they would be likely to reduce the range of products.
Most businesses suggested that if there were stricter regulations elsewhere in the UK in the future, they may consider reformulating products on a case-by-case basis so that a single product would comply with the requirements across all nations. The decision, however, would hinge on the extent of the difference; the greater the differences the more difficult it would be to adopt a ‘highest common denominator’ approach. We take the view that it will be difficult to adopt a highest common denominator approach the more likely it is a business will face the risk of being undercut by competitors that have relied upon the MAPs.
Some businesses told us that they had the ability (in particular, the scale) to allow their UK approach to diverge from their European approach.[footnote 108] They emphasised that, in terms of recipes and formulations, it would not be practical for reasons of cost to operate different standards across the UK market, especially in addition to EU/UK divergence.
Market size and other factors
Considering the size discrepancy between the English market and other UK nations, in terms of product volume and number of stores, businesses expressed concerns about running several versions of a product for different nations. Some low volume products may face vulnerability due to economies of scale and fall below the minimum order quantities set by retailers, and as a result supplying certain products to smaller nations could become financially unviable due to manufacturing costs. This would reduce the product range available in smaller markets that are subject to stricter (or perhaps just different) restrictions.
We asked retailers more specifically how they plan to respond to the Welsh Government’s plan to restrict meal deals, temporary price promotions and free-standing display units. Whilst most retailers expressed concern about this difference, they emphasised that it was too early to determine their response. Retailers however indicated they would continue to offer selected products for meal deals in England. They were unable to say at this stage whether they would reformulate or swap the products offered in meal deals in Wales. They also explained they had no plans to reformulate products that would be affected by the Welsh ban on temporary price promotions and those prominently displayed on free-standing display units. In addition, businesses noted that they were waiting to see what the Scotland and Northern Ireland HFSS restriction will be before considering their potential response.
Regulatory difference also raises the possibility of differences in labelling and packaging, especially for products in Wales and Scotland that display temporary price promotions. Most businesses we spoke to have already shifted away from using pricing or icons on packaging, opting for in-store labelling to highlight promotions. Some businesses also stressed additional cost concerns and confusion if there needed to be more than one packaging version of the same product in addition to other requirements such as the ‘not for EU’ labelling[footnote 109] for British products sold throughout the UK. These cost pressures would accentuate some of the cost pressures on low volume items discussed earlier, and likely lead to a narrowing of the product range offered. This highlighted the relationship between the potential scale of impact of regulatory difference on businesses and whether it can be addressed at the point of sale rather than businesses’ supply chains.
Conclusions
The case study of HFSS has produced a number of helpful insights. First, it was notable that the principle response from many of the businesses we spoke to was not driven by the new HFSS regulations. Rather, product reformulation was a longstanding industry activity that could be adapted to the needs of the new regulations for certain products. As reformulation is both costly and time consuming (and comes with some risks that customers may reject the reformulated product) we conclude that product reformulation may not be a common response to regulatory difference in many cases. The same desire to reduce supply chain complexity and its associated costs that is a feature of our SUP and DRS case studies was also a factor frequently mentioned by businesses in connection with HFSS regulations.
The response to HFSS restrictions and the potential regulatory difference varied across the businesses we spoke to, although they held a common held view that producing different products for different nations was best avoided, if possible.
Some businesses expected to accept the impact of the promotional restrictions for some of their products without changes. We take the view that this is an easier strategy to adopt when there is some protection from competition from businesses that do not have to comply with the regulations.
Some businesses mentioned range reduction (in particular removing low volume products) as a possible response. While this is a credible strategy none of the businesses we spoke to had made any firm plans in this regard and it was clear that the degree of range reduction would be sensitive to the specific costs incurred. For the HFSS regulations those costs would most likely be associated with packaging requirements and many of these could be mitigated by moving from promotional messages being applied at the factory to being applied in store. This highlighted that the impact of regulatory difference on businesses will also be influenced by whether it can be addressed at the point of sale or if it will impact businesses’ supply chains.
Some businesses were still deciding exactly what they would do once Scotland and Northern Ireland announce their HFSS restrictions. However, businesses stated that while some adjustments clearly require long lead times (reformulation of a product is a good example) others can be implemented at shorter notice. It follows that the range of options open to a business by way of response to regulatory difference, at least in the short term, may depend on how long they have to prepare their response.
Precision breeding
Introduction
This case study examines the factors influencing how businesses will plan to manage differences in regulations arising in the treatment of precision bred (PB) products. We have focused on businesses in the grains supply chain such as wheat and barley, as these crops are grown on a much larger scale in the UK.[footnote 110] In addition, grain crops generally have more complex supply chains than do typical horticultural crops such as fruit and vegetables.
Precision bred organisms (PBOs) are plants or animals produced using gene editing techniques which adapt the genome of an organism for selected traits. Precision breeding produces results that could have occurred naturally, or been achieved with traditional breeding methods, but at greater speed. PBOs are therefore different from plants or animals into which gene sequences from other species have been incorporated into the organism’s genome (GMOs). GMOs can be identified by testing for the presence of genes from other species, but the lack of foreign genes in PBOs prevents this testing, so they are harder to identify.
Currently, PBOs are subject to the same regulatory regime as GMOs under legislation based on EU legislation and which applies across the UK. However, the Genetic Technology (Precision Breeding) Act 2023, (the Precision Breeding Act) was passed in March 2023 with the intention of removing PBOs, and the food and feed produced from them, from the scope of current legislation regulating GMOs. Once the Precision Breeding Act’s provisions are implemented, PBOs will be subject to an alternative regulatory framework including, amongst other things, the establishing and maintenance of registers of various categories of required information and notices relevant to PBOs and the food and feed produced from them.
A detailed description of the relevant measures in each nation is available at paragraphs 3.21 to 3.24. In our view there appears to be a distinction in the way in which PB products are treated under relevant legislation depending on where they are intended to be sold. The MAPs would in principle allow PB products either grown in England, or imported into England from outside the UK, to be sold into Scotland and Wales to both businesses and consumers. However, an apparent effect of the Northern Ireland Retail Movement Scheme is that only consumer retail products containing, or consisting of, such PB products can be sold in Northern Ireland. Regardless, once relevant products arrive in another UK nation, they would be subject to such other nation’s existing GM legislation, which, in our view, could potentially result in them being considered unregistered GMOs with the consequence that no further processing would be permitted, and any products formed from such illegal processing would also likely be prohibited.[footnote 111]
We interviewed stakeholders from across the grain supply chain, speaking to trade associations with connections to plant developers and plant producers, and to farmers’ unions, grain traders, millers, maltsters, the whisky industry, food manufacturers and retailers.[footnote 112] We also spoke to policy teams within the 4 UK governments and to some non-governmental regulators with a responsibility for food and drink issues.
Factors affecting grain supply chain businesses’ planning for PB regulatory difference
Businesses across the grains sector from farmers through to retailers told us they would consider a range of factors when deciding how they might react to the expected differences in precision breeding legislation. They told us that they would also first have a fundamental decision to make as to whether they would choose to use PBOs. Regardless of that decision they could still be impacted by others’ decisions to use PBOs, due to the need to prove the PB status of their own inputs and products in a commercial landscape where both were used.
Factors influencing whether to use PBOs
Several factors relate to whether businesses may choose to grow or use PB products. These include:
-
consumer views on and knowledge of PB products
-
evidence available on the benefits and risks of precision breeding
-
possible effects on the ability to sell products to particular markets
Consumer views on, and knowledge of, precision breeding
In order to plan for differences in PB legislation, affected businesses need to first decide on whether they wish to produce or use PB products. The most fundamental factor that would affect this decision was whether they considered consumers would be likely to buy PB products. Stakeholders from across the grain supply chain told us they needed confidence in their ability to sell PB products before electing to use them, but they felt strongly that UK consumers did not currently understand, nor approve of, precision breeding.
The importance of consumer understanding of precision breeding was confirmed by the Food Standards Agency (FSA). They highlighted research they had undertaken into consumer perceptions of precision breeding, which found that consumers’ knowledge of PB products was very low, and that consumers had concerns about what precision breeding technology might be, and what risks might be associated with it.[footnote 113] Stakeholders we spoke to felt that consumer education on precision breeding was a role for government, yet the FSA study found that consumers were more trusting of scientists, farmers and regulators such as the FSA to provide advice on food.
Stakeholders recognised that consumers’ views on precision breeding would likely change over time as their understanding of the technology grew. The uncertainty about what consumers might want in the future led to many stakeholders taking the view that it was best to adopt a ‘watch and wait’ approach to their own production and use of PB products.
Evidence available on benefits and risks of precision breeding
Businesses along the grain supply chain told us that they would also need more detailed information about the perceived benefits of precision breeding before using them. They were generally very positive about the possibilities of precision breeding. They considered that it was likely to have the potential to produce plants with improved pest and disease resistance, a reduced requirement for agrochemicals, and a more efficient use of land, with higher yields, and resistance to drought and other weather conditions. Whilst there was a recognition that PB plants would likely be more expensive to buy initially, there was a view that over time, the gains in yield and reduction of other costs such as agrochemicals, could lead to cheaper food. However, there was a common view that more quantifiable evidence would need to be available before businesses would grow PBOs or use PB products.
Ability to sell to particular markets
Stakeholders also took account of whether using PB products was likely to affect the markets to which they could sell those products. Due to the current position in Scotland and Wales, it is likely that no processing of PB products would be allowed, as they would be considered unregistered GMOs, and any products formed would also likely be prohibited. Many sectors in Scotland and Wales such as flour millers, maltsters, feed compounders, bakeries and distillers would not, therefore, be inclined to buy PB products given they would not be permitted to use them in their processes. In effect, the MAPs would only facilitate the sale of PB products exported from England to the other UK nations, in a form saleable to the final consumer without further processing. For example, PB flour could be exported from England to Scotland and Wales and be sold without further processing to consumers for use in home baking and cooking. In the EU, PB products are currently also regarded as GM products, and stakeholders voiced concerns about the potential loss of this market for any products containing PBOs.
Regardless of whether businesses choose to produce or use PB products, they recognised that regulatory difference could have impacts on their ability to sell to some markets. English businesses which might decide to grow or use only non-PB crops had concerns that buyers in Scotland and Wales might still be reluctant to buy from them due to a perceived risk that PB content might be present.
A stakeholder from Northern Ireland expressed concerns that continuing to buy grain from anywhere within Great Britain could compromise their position with the EU, and their ability to prove that they were adhering to EU GM legislation. They suggested that the EU might harbour concerns that the lack of borders within Great Britain could lead to PB products spreading into Scotland and Wales from England and then on to Northern Ireland.
Similar concerns were voiced by stakeholders in the whisky industry, who considered that there may be difficulties in exporting whisky worldwide due to concerns it may have been made with PB ingredients.
Factors influencing how to address regulatory differences
Factors contributing to planning for regulatory difference relate either to changes that all grain sector businesses would expect to have to make regardless of their own decision to grow PBOs or use PB products, or to other factors which would have an impact on the ability and timing of detailed planning for regulatory difference. These factors include:
-
impact of additional costs for all grain sector businesses from different legislation in different nations
-
potential opportunities from the differing regulations for the business to exploit
-
risks to the business resulting from the differences
-
the degree of certainty about the detail of the difference and the implementation timescale for the legislation
Other impacts of differing precision breeding legislation on businesses
Businesses had concerns that the differences between the UK nations on precision breeding would introduce additional costs and burdens on them. The biggest impact cited by stakeholders was the potential need for segregation of PB crops from non-PB crops. This could be deemed necessary if food and feed processing businesses in Wales and Scotland were to avoid inadvertently processing PB products. The majority of stakeholders expressed the view that large scale segregation of grains into PB and non-PB grains would not be viable in the UK due to the complexities involved, a lack of sufficient storage infrastructure, as well as the large costs it would incur.
Grain from one farm is currently often co-mingled with grain from another. For segregation to work, grain would need to be segregated right along the supply chain. Farmers would need to use separate combine harvesters for PB and non-PB crops. Every vessel used for the storage, transport and processing of the grain would need to be duplicated or cleaned when changing over from PB to non-PB grain. This would include separation for silos, lorries, milling machinery, food production lines and storage points at distribution depots.
Some stakeholders told us that it would not be possible to guarantee complete segregation, so some tolerance of the presence of PB crops would be required. Due diligence in relation to the presence of PB crops would be severely hampered by the lack of a test that identifies PB crops. While labelling might assist with tracing segregated crops, there is no legal requirement in the Precision Breeding Act for PB products to be segregated or labelled as being PB. Several stakeholders were of the view that the difficulties posed by segregation were insurmountable, and that the only viable options were either ‘all in or all out’, with either PB grain used throughout the UK, or not taken up at all by businesses using non-specialist mainstream flours.
In contrast, some stakeholders informed us that segregation does already occur for the relatively small volumes of organic and other specialist flours, so segregation was already possible, albeit on a small scale.
In addition, one large food manufacturer of products made with grains told us that they already had a good level of control over their supply chain, starting with which varieties of grain were grown by farmers specifically for them, and with segregation from other products already in place along the supply chain for quality reasons. They felt that they would be well placed to be able to exclude PB products should differences on precision breeding legislation arise.
In addition, whilst segregation is seen as being particularly challenging regarding grains, some stakeholders held the view that for some horticultural crops such as potatoes and tomatoes, there was already a high degree of segregation in place due to the many different varieties involved. For these products, we were informed that the supply chains were generally short, and that particularly where farmers grew directly for retailers, it would be relatively straightforward for farmers to grow PB varieties if asked to do so.
The lack of a diagnostic test for PB crops also led to concerns that additional layers of tracking and certification might instead be necessary to prove the PB status of crops. The current uncertainty over whether labelling would be required (because it is not mandatory), both along the supply chain, and for consumers was also cited as a major barrier for businesses’ ability to plan ahead for PB regulatory difference.
It was recognised that whilst labelling along the supply chain could reduce some requirements for tracking and certification, it would also be burdensome and expensive in itself. Stakeholders told us labelling could slow down production lines and was likely to lead to inefficiencies and waste. Products would no longer be able to be sold across the whole of Great Britain, leading to surpluses of products in one nation not necessarily being usable for other nations with a shortfall.
One retailer told us that a similar situation had already occurred with the products they supply to Northern Ireland and the Republic of Ireland. Under the Windsor Framework’s Northern Ireland Retail Movement Scheme, products destined for Northern Ireland using the ‘green lane’ must be labelled ‘Not for EU’. The retailer told us that the sales of certain products, like salads, and barbecue items varied with the weather, and that the impacts of the ‘Not for EU’ labelling meant it was no longer possible to adjust the volume of products between the Republic of Ireland and Northern Ireland to take account of weather changes.
Opportunities from differing regulations
Stakeholders also considered whether differences in regulations would present opportunities for their businesses, and how they might plan to take advantage of these. As noted above, the MAPs would in principle allow PB products to be sold in Scotland and Wales, and the Windsor Framework (specifically its Northern Ireland Retail Movement Scheme) would appear to permit the sale in Northern Ireland of consumer retail products which contain, or consist of, PB products.
However, given the apparent effect of existing GM legislation applicable in Scotland, Wales and Northern Ireland is that only end products can be sold (given further processing of what would be considered unregistered GM products would appear to be prohibited), this would greatly limit the opportunity for sales of grains to those nations. None of the stakeholders we spoke to said they would use the MAPs to sell PB products to the rest of the UK.
Risks from regulatory differences
Businesses also considered the potential risks from regulatory difference for them, to see what mitigations might be possible. Businesses in food production and retail told us that using PB products in their businesses was currently viewed as a reputational risk to their brand. Until PB foods are accepted by consumers, no stakeholders wished to use them. The level of perceived risk varied somewhat, depending on the sector. For example, it was seen as likely to be lower for the brewing industry, given beer has a relatively short shelf life, allowing for inventories of products affected by changes in policy to be sold down more quickly. In contrast, the risk was seen as higher for the whisky industry where stock can be kept for 12 years or more. They needed greater confidence in the position consumers would likely take on PB products in the longer term.
Even though all stakeholders were unanimous in deciding that they would not choose to be the first in their sector to use PB products, many still saw the availability of PB products in England as being a potential reputational risk for them. The lack of a test to identify PB products gave rise to concerns about carrying out due diligence on their inputs to prove the PB status. Some food manufacturers operating in Scotland felt that it would be difficult to prove that their inputs complied with Scottish GM law. They had concerns that there might be doubts over the legality of their operations with consequent reputational risks.
There was also a more general concern among stakeholders that there was no effective means to rebut any allegations of using undeclared PB products in their business, even where legal to do so, and that this also represented a reputational risk to their brand. For so long as there is limited consumer demand for PB products, it was very important to the stakeholders we spoke to that their position in choosing not to use PB products be clear and provable to their buyers and any onward chain.
Certainty about how the regulatory differences would work and implementation timescales
With precision breeding, there are a number of uncertainties which currently make detailed planning extremely challenging. As noted earlier, the Precision Breeding Act only provides a high level description of the new regime and contains powers for the Secretary of State for Environment, Food and Rural Affairs to make provisions for the regulation of PBOs in England at a later date via secondary legislation. This secondary legislation is still under development and is currently expected to be laid in summer 2024, coming into effect around the end of 2024.
Many stakeholders told us that detailed planning for differences in the regimes could only be carried out once more detail on the Precision Breeding Act was available. They also emphasised the importance of clarity over how close the detail of the Precision Breeding Act might be to the broadly equivalent EU proposal for legislation on plants obtained by certain new genomic techniques. Stakeholders also mentioned uncertainty around whether the EU proposals would successfully pass into EU law, and a lack of certainty over possible timing.
In addition, businesses were concerned that, whilst Scotland and Wales are currently aligned with the EU’s position on PB, continuing to use existing GM legislation which mirrors the EU GM legislation, this could change in the future. Scotland and Wales might not choose to align with the new EU proposals, should they be passed, or might choose to align with the Precision Breeding Act.
Every business we spoke to told us that they would not produce or use PB products until the detail of the regulations and their likely effect on the supply chain were clear. Similar views on not using GMOs were voiced by many businesses when GMOs became available, and we considered whether the adoption of PBOs could follow a similar path to adoption of GMOs. Whilst GMOs are now common in animal feed, where they do not need to be labelled, some retailers told us they still excluded GMOs in their food products where GMO labelling is required.
PBO labelling requirements remain unclear, but even without labelling, retailers may consider that consumers might hold stronger views on PBO content in food than in feed, and that its use in food carries higher reputational risks. This could result in retailers making a similar decision to their GMO use, excluding it from their food. A critical difference between GMO use and potential PBO use is that whilst it is legal for GMOs to be processed into food and feed across the UK, this does not appear to be the case for PBOs in Scotland and Wales. Any illegality of PBO processing brings such large segregation challenges that it could preclude significant use of PBO grains, even in feed.
Conclusions
In drawing conclusions, we note that one significant difference between this case study and the others we have considered is that the Precision Breeding Act presents an opportunity for businesses, rather than either a prohibition on, or obligation to perform, particular actions. In addition, the differences discussed in this study were more distant and less certain than for the other case studies we have undertaken. Our conclusions must be seen in this light; as the situation clarifies, new facts may emerge.
For this study, we spoke to businesses along the grains supply chain, as this is a large and complex market. The situation for grains may not be reflective of other agricultural / food markets with simpler supply chains and crops that are easier to segregate, such as salad vegetables. We think this is notable as it suggests that the impact of regulatory differences can be highly sensitive to the practical realities of the supply chain being regulated.
Grain supply businesses noted they needed clarity around precision breeding issues before considering using PB products or planning for regulatory differences. Lack of consumer awareness of precision breeding, with few being in favour of it, led stakeholders to note that consumers needed education on it and that PB products would be avoided until there was widespread consumer acceptance. Similarly, stakeholders also told us they would not use the MAPs to sell PB products to Scotland and Wales as to do so was viewed as a reputational risk. We consider this a variation on a theme that emerges in our other case studies; the response to the regulatory differences is strongly influenced by customer preferences and demand, even to the degree that a business will choose to forgo the opportunity to sell a product that is lawful to sell.
Planning for the regulatory differences that will be created by the Precision Breeding Act has not begun in the grains sector due to the many uncertainties, and whilst all businesses we spoke to recognised potential benefits from precision breeding, they all spoke of having a ‘watch and wait’ approach for the present. It is our view based on the evidence we have gathered that the most likely outcome is that adoption of PB grains is likely to be very limited until there is a substantial change in consumer understanding and demand, and regulatory differences around precision breeding diminish.
Overarching conclusions on the case studies
The case studies illuminate certain trends in businesses’ responses to regulatory difference. Although these trends are instructive, we recognise that the case studies have drawn most of their evidence from large businesses and have considered only 4 sectors. Smaller businesses or businesses operating in different sectors might respond differently.
One of the most notable findings from our case studies of SUP and DRS is the perception of the MAPs amongst larger businesses with strong brands and a significant footprint of operations in the devolved nations. There was a clear view from those to whom we spoke that the MAPs were unlikely to be used to address regulatory differences within their businesses. Clearly, if this view is widespread, it will have significant implications for the internal market regime but, on the basis of the research we have undertaken to date, it is difficult to say with confidence how widespread this effect may be. Further research would be required but 3 interrelated elements appear likely to drive how widely this approach might be adopted: the importance of brand values in the affected sector; consumer understanding of the issue and their propensity to criticise businesses that do not adopt the local standards; and the likelihood of businesses that adopt locally compliant policies being undercut by businesses using the MAPs. These factors might vary between specific examples and will likely require case by case consideration.
A second notable finding is the high degree to which businesses wish to achieve a simplified supply chain with specific products that are compliant with regulations across the UK. Where it has been technically possible to do so, most of the businesses we spoke to were working towards solutions that achieved this approach – typically by adopting a highest common denominator approach. This was invariably seen as the best strategy where it was feasible. Only in scenarios where this approach was not technically possible did businesses adopt, or plan to adopt, different strategies. We consider this a particularly significant finding – it suggests that larger businesses, with more complex UK-wide supply chains are likely to play a role in establishing ‘UK-wide norms’ that transcend individual policy making by each of the governments. While we accept that further research will be required before more concrete conclusions can be drawn, this would suggest that Common Frameworks, and other forms of inter-governmental cooperation outside those frameworks, could helpfully be informed by the intentions of these businesses. We note in this regard that businesses will only be able to adopt a highest common denominator approach in scenarios where regulatory differences permit it. For example, a product that is subject to a regulation that requires labelling in one nation but not others can be made compliant everywhere by attaching the label to all products regardless of where they are sold. To take a simplistic example, regulatory difference that required a blue label in one nation and a green label in another nation would prevent such an approach. Where a highest common denominator approach was not possible businesses told us they looked to other strategies which included reducing the range of products offered in the nation with different regulations or focusing their business on one nation or a subset of nations. The effects of these strategies could arise in nations other than the nation introducing the regulation.
A significant number of businesses identified range reduction as a possible consequence of regulatory differences that required different products to be supplied to different nations. While we think this is a credible response to the increased costs and complexity associated with duplicating product lines, 2 points are worth emphasising. First, the products ‘at risk’ will be low volume products and may not account for a substantial proportion of cross-border trade (although no doubt the consumers who purchase them would prefer for them to continue to be supplied). Second, none of the businesses that we spoke to that identified range reduction as a potential response had yet made any firm decisions about which items to withdraw and from which markets. We take the view that this is unsurprising as it could result in lost market share (even if the manufacturer continues to sell other products in the affected nation there is no guarantee consumers will switch to these products in response to another product being withdrawn). Furthermore, we note that insofar as businesses are trying to grow the market share and volumes of their low volume items and so the trajectory of recent growth may also be a relevant consideration. In addition, the vacated niche could potentially open up opportunities for rivals to enter the market and compete, perhaps using the niche product to attack the former incumbent’s core products. Given the high level of uncertainty that a business would face in trading-off these different considerations it seems likely that most businesses would delay taking a decision to withdraw a product until it was strictly necessary.
It is also clear that, for many products, the UK internal market is one part of broader global supply chains and a wider global marketplace. The needs of some businesses to source inputs from overseas and the fact that for others many of their customers (in some cases most of their customers) are in export markets will have a powerful bearing on how they interact with the UK internal market. For example, developments in the use of precision bred grains look likely to be shaped by changes in EU policy and European consumer sentiment as much as they will by domestic considerations. In the case of grains, the challenges of supplying different products to different international markets arise from the difficulties of segregating precision bred ingredients. We can see, however, that the influence of EU policy (and policy further afield) might also be relevant in scenarios where much of the UK supply of a particular product or input is imported and there are limited production facilities for that product or input. In these scenarios, outcomes within the UK might need to adapt to international changes and/or accept significant cost implications associated with diverging from international norms. More analysis of these types of scenarios would be required before firmer conclusions could be drawn.
The final factor that we identify as particularly important is the role of consumer preferences. In many cases, policy development moves in tandem with, or even lags, consumer attitudes and tastes. Arguably, policy developments in relation to SUP, horticultural peat and DRS have been introduced at a time when a significant body of consumer opinion understood and supported the policy objectives behind these initiatives. This influences the confidence businesses have in designing a given response to regulatory developments, including regulatory difference, as it makes consumer behaviour more predictable. A business can have greater confidence in adopting a ‘highest common denominator’ approach to, for example, SUP if it understands that customers across the UK would appreciate, and reward with their custom, such an approach. However, some regulations will be introduced ahead of consumer understanding and preferences. Precision bred crops is arguably an area where there is not yet widespread consumer understanding of the product and, perhaps as a consequence of that, limited consumer demand. This creates uncertainty for businesses that accentuates some of the difficulties of addressing regulatory difference. We see parallels with some of the findings in the retail horticultural peat products market,[footnote 114] where businesses’ response to the proposed regulations was significantly influenced by customer preferences and environmental commitments (which were themselves in part a response to broader consumer sentiment). We take the view that a regulatory difference that emerges ahead of consumer understanding / demand is less likely to lead to a UK-wide response by businesses than one that is contemporaneous with or lagging consumer understanding / demand. Similarly, a regulation is more likely to not be taken up if it creates an opportunity rather than an obligation (as the precision breeding regulations will do) but is subject to considerable uncertainty as to whether consumers (both intermediate consumers and final consumers) want the product.
The findings from the case studies suggest that there may be ways in which policy makers might be able to adjust policy design in order to minimise internal market impacts while retaining the benefits of the policy. One approach is to explore whether regulations can be designed so that they permit a ‘highest-common-denominator’ response. This will require coordination and cooperation between governments as the decisions made by one government may affect another; this may be challenging if different governments develop policy on differing timetables. A second approach is to try and design the policy such that the point in the supply chain where regulation has its effects, is as close to the final consumer as possible. The emerging evidence appears to suggest that regulations that have their effects towards the end of the supply chain are easier to manage for the simple reason this require few changes to the overall supply chain. Not all policies will be possible to design in this manner. A third approach is to note that the effects of a difference in regulation may arise outside of the nation into which it has been introduced. This is more likely when supply chains cross national borders. This has potential implications for both the assessment of a policy’s impact and also the role that can be played by inter-governmental cooperation.
Conclusions
As we acknowledged in the 2022 to 2023 annual report, the UK internal market regime remains at an early stage and so trends and patterns are only just starting to emerge. Furthermore, many of the policy arrangements that will have a material impact on the shape, breadth and depth of regulatory differences are still bedding in, including: the operation of Common Frameworks; the implementation of the exclusions regime; and the scope of excluded services as covered by Schedule 2 of UKIMA continued to evolve over the previous year.
Against this backdrop, we have not attempted to draw firm conclusions about the future direction of travel for the UK internal market. Notwithstanding this, the regulatory developments over the last year, combined with businesses’ initial responses to those developments, provides some insights into some of the dimensions of future change for the internal market.
In our 2022 to 2023 annual report we identified a number of factors that are of particular significance for businesses addressing regulatory differences in their operations and, by extension, that are of significance for the development of the internal market. In summary those factors were: the effects on competition of a level playing field between nations; the perceived complexity arising from different introduction dates in different nations for similar regulations; the limited awareness of UKIMA; uncertainty about the effects of the MAPs; and the role played by inter-governmental cooperation and coordination in addressing some of these issues.
Our analysis in this report confirms the importance of these factors. Our case studies in particular highlight the role of cross-border competition where business could potentially be held to different standards because of the MAPs (DRS), the complexity of different introduction dates (SUP, DRS, HFSS), and uncertainty about the effect of the MAPs and in particular the legality of particular strategies (DRS). In addition, the role of inter-governmental cooperation and coordination was a clear theme in each case study. Our work for the 2023 to 2024 annual report, particularly our case studies, has identified further factors of relevance that we think are likely to influence both current regulatory developments and regulatory developments in the future.
The macro-level datasets that we discuss in Chapter 2 provide interesting insights into the importance of trade for each of the 4 nations of the UK. The scale of the internal market is significant as a proportion of total UK economic activity for each of the 4 UK nations. Similarly, UK internal trade is an important component of the input sourcing and sales of many UK businesses operating across a wide range of activities, especially those involved in the production of goods.
However, as the market sizing data we introduce in Chapter 3 makes clear, goods are proportionally more exposed to regulatory differences and the MAPs than services and there are a greater number of proposed regulatory differences in relation to goods than services. On the other hand, the services sector is so large in total that although proportionally more services activity is outside of the scope of regulatory difference and the MAPs, in absolute terms services accounts for most economic activity that is subject to both regulatory difference and the MAPs. There is therefore, scope for regulatory changes in services in future to become at least as important for the development of the UK internal market as regulatory developments in goods.
Professional qualifications, while covered by UKIMA, look likely to be the area that will be subject to the least change in the next few years with the most limited effects on the internal market. There are very few professional qualifications that post-date UKIMA (and hence would be within its scope). Forthcoming regulatory change in relation to professional qualifications is mostly to regulate new professions (often with modest numbers of practitioners) rather than to reform the existing arrangements and many of those professions typically provide their services locally with limited cross-border trade.
For these reasons, we would expect to see any effects on the functioning of the internal market from regulatory difference particularly in relation to goods and especially in those sub-sectors of goods that are subject to most regulatory change, most notably food and drink. To consider this in more detail, the case studies in Chapter 4 look into the business response to regulatory changes largely affecting the food and drink sectors.
The case studies in Chapter 4 highlight that the specific business responses to regulatory difference is sensitive to the design of the regulation and the specifics of the affected supply chain. That is, a similar regulation can have quite different effects as between industries and even between different businesses in the same industry. This can lead to a wide range of potential outcomes including, amongst other things, the businesses accommodating local regulations even where the MAPs offer a legal alternative, the development of new products and changes to the range of products provided. More research is needed into the likely responses of smaller businesses, where, we hypothesise, there may be greater interest in use of the MAPs given they may have weaker brands and different corporate ESG policies. We are also cautious about extrapolating findings about the food and drink sub-sector into other sub-sectors without further analysis.
The case studies in particular indicate a number of ways in which policy makers might be able to adjust policy design in order to minimise internal market impacts. These include: considering designing regulatory difference to permit a ‘highest-common-denominator’ response, which will require coordination and cooperation between governments; paying close attention to the point in the supply chain that a regulation has its effects, as the closer to the final consumer that a regulation has its effects the easier differences may be to manage; and recognising that the effects of a difference in regulation may arise outside of the nation into which it has been introduced, which is more likely when supply chains cross national borders.
The emerging picture of the internal market is that on the one hand, regulatory differences are starting to build up, albeit slowly and with goods affected more considerably than services, especially in food and drink. On the other hand, businesses are adapting creatively to the new regulatory realities in ways that often preserve existing trade flows and supply chains. The relative strength of these forces is yet to become clear and policy makers can make choices that, even if they pursue differing regulations, may assist businesses in keeping existing trade flows open. This is a dynamic environment, and we will undertake further work through 2024 to better understand how regulatory policy, business strategy and the wider economic environment will influence the UK internal market.
-
Under section 33(5) of the UK Internal Market Act 2020 we are required to prepare a report at least once in every relevant 12 month period on the operation of the internal market in the UK and on developments as to the effectiveness of the operation of that market. ↩
-
Parts 1 to 3 of UKIMA establish the market access principles of mutual recognition and non-discrimination across the 4 nations of the UK. Briefly, the mutual recognition principle ensures that, without further requirements, a product that has been legally produced in, or imported into, and can be legally sold in one part of the UK, can be sold in any other part of the UK, or that a service that can be legally provided in one part of the UK can be provided in another part of the UK. The non-discrimination principle ensures that goods or services coming from other parts of the UK are not directly or indirectly discriminated against (in favour of local goods or services). ↩
-
Following the UK’s departure from the EU the UK government and the devolved governments agreed to work together to establish common approaches in some areas that were previously governed by EU law, but that are otherwise within areas of competence of the devolved governments or legislatures. Known as ‘common frameworks’, their aim is to set out common UK, or GB, approaches to particular policy areas and how they will be operated and governed. ↩
-
The Windsor Framework, which came into effect on 1 October 2023, amends certain provisions of the Northern Ireland Protocol which itself formed part of the UK/EU Withdrawal Agreement. One of the aims of the Windsor Framework is to reduce the level of controls and checks on goods coming from Great Britain which are intended to be sold in Northern Ireland. ↩
-
Sections 10 and 18 and Schedules 1 and 2 of UKIMA contain provisions excluding the application of the MAPs in certain cases, including where such exclusions are necessary to give effect to the terms of a Common Framework Agreement or other agreement between the UK government and a devolved government that certain cases, matters, requirements or provisions should be excluded from the application of the MAPs. ↩
-
By Intra-UK trade, we mean trade between the 4 nations of the UK, those being: England, Wales, Scotland, and Northern Ireland. ↩
-
ONS Industry-to-industry payment flows, UK: 2016 to 2023, experimental data and insights. An experimental UK industry-to-industry payment flows dataset based on anonymised and aggregated Bacs Direct Debit and Direct Credit payments. ↩
-
Regional gross domestic product: all ITL regions - Office for National Statistics: Gross Domestic Product (GDP) at current market prices (2021), pounds million. ↩
-
The ONS Gross Domestic Product figures, at 2021 market prices, indicate the UK’s GDP was £1921 billion in 2015, suggesting that intra-UK sales represented c.10% of GDP in 2015. ↩
-
The ONS Gross Domestic Product figures, at 2021 market prices, indicate England’s GDP was £1652 billion in 2015; Scotland’s GDP was £149 billion; Wales’s GDP was £67 billion; and Northern Ireland’s GDP was £42 billion in 2015, suggesting that the £91.6 billion inter-regional trade for England; £50.3 billion for Scotland; £36 billion for Wales; and £10.8 billion for Northern Ireland, represented 5.5%; 33.7%; 54.2%; and 25.5% of each nations’ GDP respectively. ↩
-
England accounted for 89.6% (£45.1 billion) of intra-UK sales from Scotland, 89.6% (£32.7 billion) from Wales, and 85.8% (£9.3 billion) from Northern Ireland. ↩
-
TSW state that they have not previously published Trade Survey for Wales data relating to 2020 due to inconsistencies and quality issues caused by the COVID-19 pandemic. Whilst 2020 data are included in this report with appropriate explanation of the limitations, 2021 comparisons are often drawn against pre-pandemic 2019 data. 2020 data relates to a period impacted by the coronavirus (COVID-19) pandemic. As a result, business closures over this period and pandemic restrictions may have affected responses. International trade was also impacted for a prolonged period due to different ongoing government pandemic restrictions in various countries. ↩
-
In both 2020 and 2021, ‘unallocated sales’ accounted for c. £19.9 billion and £20.9 billion respectively. Comparatively, in 2019, only c. £3.9 billion was from ‘unallocated sales’. For purchases in 2019, unallocated purchases into Wales was £10.5 billion, rising to in 2020 c. £49.2 billion, and in 2021, this was c. £12.7 billion of the total purchases into Wales. ↩
-
Export Statistics Scotland 2021. The Global Connections Survey (GCS) is one of the main data sources informing the estimates of Scotland’s exports in Export Statistics Scotland. The Scottish Government sends the GCS to a sample of 6,000-10,000 companies with operations in Scotland to collect data on the value of sales and exports both internationally and to the rest of the UK. It is the primary source of information for estimates of the value of exports from Scotland to the rest of the UK. Where export information from the GCS is not available, Exports Statistics Scotland uses alternative sources of export information, or estimates the value of exports as a percentage of business turnover. Exports Statistics Scotland also note that all statistics in this release are for Scotland’s onshore economy, which excludes any extra-regio activity. Within the UK, extra-regio activity includes offshore oil and gas extraction and overseas public administration and defence activities. ↩
-
See Export Statistics Scotland: methodology The ESS estimates export value as a proportion of a business’ turnover. The 2021 edition uses a different data source for turnover value. This changes the resulting export value and means that the estimated values for the year 2019 quoted in this annual report are different from 2019 data published last year. Using the new data source has resulted in a decrease of 10.3% in the estimate for Scotland’s sales to the rest of the UK in 2019, which dropped from £52.0 billion to £46.7 billion. Import (purchases) statistics are sourced from Quarterly National Accounts. ↩
-
Exports statistics Scotland 2021 Figure 4. Exports to the rest of the UK account for more of Scotland’s total exports than international exports. ↩
-
Trade Survey for Wales (TSW): 2021 (official statistics in development) - GOV.WALES, page 4. It is noted that data is based on a voluntary online survey and the respondent bases for some detailed statistics are relatively small. An overall response rate of 16% was achieved for the TSW 2021 (1,264 responses from a sample of 8,000 businesses). ↩
-
The introduction of across-years imputation for sales has meant that variability in the achieved sample across the years of fieldwork has been reduced. However, purchases have not been subject to this methodological change and so the ability to make robust comparisons across the years is limited. (Trade Survey for Wales (TSW): 2021 (official statistics in development), page 6). Further information on TSW methodology is set out in Trade Survey for Wales: quality and methodology information ↩
-
Unallocated trade is a result of businesses providing the total value of their sales and/or purchases but being unable to provide a geographical breakdown of this trade. It is important to consider these changes when looking at results across years. A proportion of the value changes seen across years is likely to be a result of an increase in unallocated trade value (Trade Survey for Wales (TSW): 2021 (official statistics in development), page 49) ↩
-
Trade Survey for Wales (TSW) 2021, page 17. ↩
-
In 2021, ‘unallocated sales’ accounted for £20.9 billion. Comparatively, in 2019, only c. £3.9 billion was from ‘unallocated sales’. ↩
-
Trade Survey for Wales (TSW) 2021, page 39 ↩
-
The NIETS survey is based on an annual survey of local businesses’ trade with markets inside and outside Northern Ireland. ↩
-
Northern Ireland Broad Economy Sales and Exports Statistics Development Plan 2021 ↩
-
The NISRA published an Overview of Northern Ireland Trade with Great Britain in July 2023 analysing NIETS data which covered data up to 2021: NISRA Overview of Northern Ireland Trade with Great Britain 2021. These figures have been updated for the 2022 publication. ↩
-
Northern Ireland Economic Trade Statistics, 2022. ↩
-
BICS questions: Has your business sent goods from GB to Northern Ireland in the last 12 months? In September 2023, how did the volume of goods your business sent from GB to Northern Ireland compare with the previous calendar month? Has your business sent goods from Northern Ireland to GB in the last 12 months? And In September 2023, how did the volume of goods your business sent from Northern Ireland to GB compare with the previous calendar month? ↩
-
‘Currently trading’ businesses only. Average response from Wave 42 (18 October 2021 to 31 October 2021) to Wave 94 (16 October 2023 to 29 October 2023). Minimal fluctuation between survey responses. ↩
-
See Wave 68 (17 October 2022 to 30 October 2022); Wave 70 (14 November 2022 to 27 November 2022); Wave 72 (12 December 2022 to 27 December 2022); Wave 73 (28 December 2022 to 8 January 2023); Wave 75 (23 January 2023 to 5 February 2023 23 January 2023 to 5 February 2023 ); Wave 77 (20 February 2023 to 5 March 2023); Wave 79 (20 March 2023 to 2 April 2023); Wave 81 (17 April 2023 to 30 April 2023) Wave 83 (15 May 2023 to 28 May 2023); Wave 85 (12 June 2023 to 25 June 2023) Wave 88 (24 July 2023 to 6 August 2023); Wave 90 (21 August 2023 to 3 September 2023); Wave 92 (18 September 2023 to 1 October 2023); and Wave 94 (16 October 2023 to 29 October 2023). ↩
-
‘Currently trading’ businesses only. Average response from Wave 42 (18 October 2021 to 31 October 2021) to Wave 94 (16 October 2023 to 29 October 2023). Minimal fluctuation between survey responses. ↩
-
BICS question: In [specified month], how did the volume of goods your business sent from GB to Northern Ireland compare with the previous calendar month? Average response from Wave 44 (1 November 2021 to 28 November 2021) to Wave 94 (1 September 2023 to 30 September 2023) was 48.0% for volume stayed the same, 24.0% for volumes decreased, and 4.7% for volume increased. ↩
-
BICS question: In [specified month], how did the volume of goods your business sent from Northern Ireland to GB compare with the previous calendar month? Average response from Wave 42 (4 October 2021 to 31 October 2021) to Wave 94 (1 September 2023 to 30 September 2023) was 50.6% for volume stayed the same, 28.1% for volumes decreased, and 3.1% for volume increased. ↩
-
To note, the UK and the EU have agreed the Windsor Framework, which establishes a new UK internal trade scheme based on commercial data-sharing for the movement of goods. All data reported within the HMRC release applies to periods before the Windsor Framework was implemented. Summary of movements of goods into Northern Ireland from Great Britain 2022: commentary. HMRC state users should not compare the NIETS survey data published by NISRA and the data in the HMRC release. Issues include differences in collection methodology, timeliness, and coverage. Summary of movements of goods into Northern Ireland from Great Britain 2022: methodology notes ↩
-
Summary of movements of goods into Northern Ireland from Great Britain 2022: commentary. The releases notes that: ‘Items on a declaration with a value greater than £100 million are excluded. This is to remove likely erroneous entries and extreme outliers from this release. Any items remaining on the declaration have been included.’ ↩
-
The ONS Gross Domestic Product figures, at 2021 market prices, indicate Northern Ireland’s GDP was £51.7 billion in 2021, suggesting that the £12.4 billion value of customs declarations in 2021 represented c.24% of GDP. ↩
-
Summary of movements of goods into Northern Ireland from Great Britain 2022: commentary ↩
-
The clearance date of a declaration was used to select declarations from the 2021 and 2022 annual periods. As this publication is based on the date the goods were cleared, and not when the goods were moved, these caveats should be noted: Goods moved in 2021 may have been reported on a declaration that was not received by HMRC until 2022. The data on this declaration would be recorded for the 2022 period. Goods moved in 2022 may be reported on a declaration that is submitted in 2023. The data on this declaration would be recorded for the 2023 period, and not included in this publication. Caution is advised when drawing conclusions about the year-on-year changes of the movement of goods into Northern Ireland from Great Britain. The definition of this data is “Full declarations cleared by HMRC between 1st January 2021 and 31st December 2022 for movements of goods into Northern Ireland from Great Britain” The clearance date of a declaration was used to select declarations from the 2021 and 2022 annual periods. Summary of movements of goods into Northern Ireland from Great Britain 2022: methodology notes. The collection of data for goods moving into NI from GB has only been required since 1st January 2021 as part of the Northern Ireland Protocol (NIP) and end of the Transition Period. Summary of movements of goods into Northern Ireland from Great Britain 2021 - GOV.UK (www.gov.uk) ↩
-
Business insights and impact on the UK economy - Office for National Statistics (ons.gov.uk) ↩
-
BICS questions: ‘In the last 12 months, has your business sold goods or services to customers in other UK nations?’ Responses: ‘Yes’, ‘No’, ‘Not Sure’. Period covered August 2022 to November 2023. Publications: Wave 63 (8-21 August 2022), Wave 68 (17-30 October 2022), Wave 75 (23 January – 5 February 2023), Wave 81 (17 April 2023 to 30 April 2023), Wave 88 (24 July 2023 to 6 August 2023) and Wave 95 (30 October 2023 to 12 November 2023) Survey question ‘In the last 12 months, has your business purchased goods or services from suppliers in other UK nations?’ Responses: ‘Yes’, ‘No’, ‘Not Sure’. Period covered Wave 94 (16 October 2023 to 29 October 2023). ↩
-
BICS sales to other UK nations. Category: All Businesses. Publications: Wave 63: 14%, Wave 68: 16%, Wave 75: 15%, Wave 81: 16%, Wave 88: 14% and Wave 95: 12%. ↩
-
BICS survey question: ‘Which of the following best describes your export status?’. Response: ‘Exported in the last 12 months’. Wave 94: 10%. ↩
-
BICS purchases from other UK nations. All Businesses: Wave 94: 10%. ↩
-
BICS sales to other UK nations by industry. Manufacturing: Wave 63: 29%, Wave 68: 32%, Wave 75: 41%, Wave 81: 39%, Wave 88: 35% and Wave 95: 21.3%. BICS purchases from other UK nations. Manufacturing: Wave 94: 18%, ↩
-
BICS sales to other UK nations by industry. Wholesale and retail trade: Wave 63: 26%, Wave 68: 25%, Wave 75: 22%, Wave 81: 25%, Wave 88: 23% and Wave 95: 21.3%. Wholesale and retail trade: Wave 94: 15%. ↩
-
‘Business and other services’ defined as Information and communication, Financial and insurance activities, Real estate activities Professional, scientific and technical activities, Administrative and support service activities, Education and Other Services. ↩
-
Exports statistics Scotland 2021 Figure 5. Manufacturing accounted for the largest proportion of Scotland’s international sales, whereas services accounted for the largest proportion of sales to the rest of the UK and Figure 7. In 2021, for sales to the rest of the UK, financial and insurance activities was the highest value sector. ↩
-
Whilst annual imports with product breakdown are available in Supply and Use Tables (Supply, Use and Input-Output Tables: 1998-2020 - gov.scot (www.gov.scot)), and provide the baseline for provisional estimates in QNAS, the latest release is for 1998-2020 and so does not cover 2021 data. ↩
-
England accounting for 87% (£13.8 billion), Scotland 5% (£0.8 billion) and Northern Ireland 4% (£0.7 billion). Trade Survey for Wales (TSW): 2021 (official statistics in development), page 19 ↩
-
England accounting for 83% (£11.6 billion) of purchase value in this sector. Trade Survey for Wales (TSW): 2021 (official statistics in development), page 40 ↩
-
BICS questions: In the last 12 months, has your business sold goods or services to customers in other UK nations? Response: Yes. ‘In the last 12 months, has your business purchased goods or services to customers in other UK nations?’ Responses: ‘Yes’. ↩
-
Trade Survey for Wales (TSW): 2021 (official statistics in development), page 18 and 40. ↩
-
BICS question: ‘In the last 12 months, which of the following challenges, if any, has your business experienced when selling goods or services to customers in other UK nations? Challenges related to the Northern Ireland Protocol; Differences in rules or regulations; Lack of demand; Supply chain disruption; Transport capacity; Transport costs; Other; Not Sure; Business did not experience any challenges. ↩
-
Business did not experience any challenges: Wave 63: 56%, Wave 68: 53%, Wave 75: 55%, Wave 81: 60%, Wave 88: 60% and Wave 95: 57%. ↩
-
Business did not experience any challenges: Wave 63: 9% (base size 3171), Wave 68: 5% (base size 3455), Wave 75: 8% (base size 3595), Wave 81: 5%, Wave 88: 5% and Wave 95: 6%. ↩
-
Transport costs: Wave 63: 17% (base size 3171), Wave 68: 17% (base size 3455), Wave 75: 22% (base size 3595), Wave 81: 14%, Wave 88: 14% and Wave 95: 11%. ↩
-
Lack of demand: Wave 63: 14% (base size 3171), Wave 68: 14% (base size 3455), Wave 75: 12% (base size 3595), Wave 81: 12%, Wave 88: 14% and Wave 95: 17%. ↩
-
Challenges related to the Northern Ireland Protocol: Wave 63: 10% (base size 3171), Wave 68: 9% (base size 3455), Wave 75: 9% (base size 3595), Wave 81: 7%, Wave 88: 8% and Wave 95: 7%. ↩
-
ONS has developed an experimental methodology https://www.ons.gov.uk/businessindustryandtrade/internationaltrade/methodologies/experimentalmethodologyforproducingukinterregionaltradeestimates to make the devolved trade statistics comparable and calculate estimates for England based on the residual, leveraging other data sources (haulage data, payments data) to supplement the trade surveys and fill known data gaps. This will generate consistent estimates of intra-UK trade for all 4 nations by autumn 2024. ↩
-
The ONS Gross Domestic Product figures, at 2021 market prices, indicate Northern Ireland’s GDP was £51.7 billion in 2021, suggesting that the £12.4 billion value of customs declarations in 2021 represented c.24% of GDP ↩
-
We have used employment data because of the superior granularity in the available data compared with gross-value-added data. We anticipate that if gross-value-added data had been available it would have produced slightly different percentage figures as some sub-sectors of the economy produce more gross-value-added per employee than others. ↩
-
References to ‘reserved’ matters include excepted matters in Northern Ireland. Note, however, that the UK government could diverge GB from EU regulations for goods in excepted matters covered by the Windsor Framework and hence create regulatory difference within the UK. ↩
-
In this context ‘total goods sector employment’ refers to SIC sections A-C and F. ↩
-
The OIM webform allows stakeholders to report an issue with buying or selling goods or services between different parts of the UK, or difficulty using a professional qualification awarded in one part of the UK. Report a UK Internal Market issue. ↩
-
UK: The Environmental Protection (Plastic Straws, Cotton Buds and Stirrers) (England) Regulations 2020; Scotland: The Environmental Protection (Cotton Buds) (Scotland) Regulations 2019; The Environmental Protection (Single-use Plastic Products) (Scotland) Regulations 2021. ↩
-
The United Kingdom Internal Market Act 2020 (Exclusions from Market Access Principles: Single-Use Plastics) Regulations 2022. ↩
-
The Environmental Protection (Plastic Plates etc. and Polystyrene Containers etc.) (England) Regulations 2023; The Environmental Protection (Single-use Plastic Products) (Wales) Act. ↩
-
The UK Government’s earlier ban covered the supply of single-use plastic drinking straws, drinks stirrers and plastic-stemmed cotton buds. ↩
-
The explanatory note to the UK ban (applying in England) acknowledged that existing UKIMA exclusion will not apply to the prohibition on single-use trays and bowls. ↩
-
Policy statement: Scottish Deposit Return Scheme - UK internal market exclusion, 27 May 2023. Policy statement: Scottish Deposit Return Scheme - UK internal market exclusion - GOV.UK ↩
-
The Deposit and Return Scheme for Scotland (Miscellaneous Amendment) Regulations 2023. ↩
-
Introducing a Deposit Return Scheme for drinks containers in England, Wales and Northern Ireland, Government response, 20 January 2023, page 29. ↩
-
Introducing a Deposit Return Scheme for drinks containers in England, Wales and Northern Ireland, Government response, 20 January 2023, page 10 ↩
-
Introducing a Deposit Return Scheme for drinks containers in England, Wales and Northern Ireland, Government response, 20 January 2023, page 10. ↩
-
Foods are classed as HFSS using the Food Standards Agency’s 2004-2005 nutrient profile model. However, in UK Government’s regulations only pre-packed HFSS products in 13 specific categories will be subject to promotional restrictions. ↩
-
Government delays restrictions on multibuy deals and advertising on TV and online ↩
-
Proposal for a Regulation of the European Parliament and of the Council on plants obtained by certain new genomic techniques and their food and feed ↩
-
In this context ‘total services employment’ refers to SIC sections D, E and G-T. ↩
-
‘Economically active’ registrations do not include those held by retirees, hobbyists and others who have left a profession. ↩
-
The specific health professions which are reserved are outlined under Schedule 5 of the Scotland Act 1998, and under Schedule 7A of the Wales Act 2017. ↩
-
Given that we have not been able to obtain registration data for a further 82 regulated professions, this will be an underestimate. ↩
-
Report on the impact of a proposed ban of the sale of horticultural peat in England on the effective operation of the internal market, Office for the Internal Market, February 2021. Final report (publishing.service.gov.uk) ↩
-
The ban on plastic drinks stirrers in England includes re-usable drinks stirrers. ↩
-
The ban in England includes Expanded and Extruded Polystyrene, whereas the ban in Scotland includes Expanded Polystyrene and the ban in Wales includes Expanded and Foamed Extruded Polystyrene. ↩
-
We have not included in this table measures to restrict demand for carrier bags: single-use carrier bag charges are in force in England, Scotland and Wales, and a carrier bag levy is in force in Northern Ireland. ↩
-
In inventory management, a SKU is the unique identifier of a product line. Typically, an alphanumeric sequence in a scannable barcode, a SKU identifies the characteristics, (for example, size or brand) which distinguish the product line from other product lines. If a product line is subject to specific local regulatory requirements that could also be reflected in the SKU. ↩
-
There are suggestions for alternative models of DRS which involve a different approach to return pathways. At the time of writing we do not believe any of these alternative models have been put into operation. However, the Welsh government has piloted a digital DRS, to allow consumers to use existing kerbside collection services to return in-scope containers, in addition to use of return points. ↩
-
ONS publication: Recent trends in UK food and drink producer and consumer prices: January 2023.suggests margins in the food and drink sector are being squeezed at the same time as consumer price increases. ↩
-
OIM: Qualitative research with businesses on intra-UK trade: March 2023 OIM: Qualitative research with businesses on intra-UK trade - GOV.UK (www.gov.uk) ↩
-
This point was previously explored in stakeholder evidence for our 2023 Periodic Report. OIM Periodic Report - GOV.UK (www.gov.uk) See, for example, paragraph 2.10 in that report. ↩
-
Northern Ireland has not made an announcement on this topic. ↩
-
The nutrient profiling model was developed by the Food Standards Agency (FSA) in 2004 to 2005. Foods scoring 4 or more points, and drinks scoring 1 or more points, are classified as ‘less healthy’. ↩
-
It is now the responsibility of the Department of Health and Social Care to publish salt reduction targets. ↩
-
Salt targets 2017 progress report: A report on the food industry’s progress towards meeting the 2017 salt targets (publishing.service.gov.uk), page 32 to page 37 ↩
-
These include bread, biscuits & cakes, breakfast bakery, breakfast cereals, crisps, pizza, ready-meals, potato-based products, desserts & puddings, and savoury snacks. ↩
-
Public Health England challenged the food industry to reduce its sugar and calorie contents. ↩
-
These were primarily close to the NPM score of 4 for food and one for drinks. ↩
-
Some multinational businesses mentioned they were able to adapt product recipes solely for the UK market to make them HFSS complaint, due to the sheer popularity and demand of the products. For instance, one manufacturer successfully reformulated a popular ice lolly for the UK market, a divergence from Europe that might not have been feasible for less popular products. Other businesses explored reformulation by introducing smaller and lighter versions of their products to offer a healthier alternative, although this did not necessarily guarantee HFSS compliance. ↩
-
Following the introduction of the Windsor Framework, food products produced and sold in the UK must be labelled as not for sale in the EU. ↩
-
Although, given only consumer retail products can be sold in Northern Ireland the potential for such products to be further processed would appear to be very limited. ↩
-
Maltsters process barley into malt, an intermediate product mostly used in brewing and distilling. ↩
-
Food Standards Authority publication: 9 March 2023 Consumer perceptions of precision breeding ↩
-
Report: Impact of a proposed ban of the sale of horticultural peat in England on the effective operation of the UK Internal Market - GOV.UK (www.gov.uk) ↩