Technical report on the impacts of the trial
Updated 17 May 2022
Applies to England

© Crown copyright 2022
This publication is licensed under the terms of the Open Government Licence v3.0 except where otherwise stated. To view this licence, visit nationalarchives.gov.uk/doc/open-government-licence/version/3 or write to the Information Policy Team, The National Archives, Kew, London TW9 4DU, or email: psi@nationalarchives.gov.uk.
Where we have identified any third party copyright information you will need to obtain permission from the copyright holders concerned.
This publication is available at https://www.gov.uk/government/publications/an-evaluation-of-the-group-work-jobs-ii-trial/technical-report-on-the-impacts-of-the-trial
DWP Research Report No. 988
A research report carried out by research consortium led by ICF on behalf of Department for Work and Pensions /Department of Health and Social Care (Employers, Health and Inclusive Employment directorate).
© Crown copyright 2021.
You may re-use this information (not including logos) free of charge in any format or medium, under the terms of the Open Government Licence. To view this licence, visit The National Archives or write to the Information Policy Team, The National Archives, Kew, London TW9 4DU, or email: psi@nationalarchives.gsi.gov.uk.
If you would like to know more about DWP research, please email: socialresearch@dwp.gov.uk
First published July 2021.
ISBN: 978-1-78659-263-7
Views expressed in this report are not necessarily those of the Department for Work and Pensions or any other government department.
Acknowledgements
This study was commissioned by the joint Department for Work and Pensions and Department of Health and Social Care Work and Health Unit. We are particularly grateful to Pontus Ljungberg, Sian Moley, Lyndon Clews, Sarah Honeywell, Caroline Floyd, Rachel Shanahan, David Johnson, Mark Langdon, Anna Bee, Craig Lindsay and members of the DWP Policy Psychology Division for their guidance and support throughout the study.
Dr Adam P. Coutts would like to thank the Health Foundation for the 3-year fellowship (Grant ID – 1273834) which enabled him to conduct the research. Many thanks to Liz Cairncross at the Health Foundation who provided support and advice throughout the fellowship.
We would also like to thank the Jobcentre Plus staff, Group Leaders, provider representatives and individual benefit claimants who gave their time to participate in the fieldwork.
Views expressed in this report are not necessarily those of the Department for Work and Pensions, Department of Health and Social Care, or any other government department.
Author’s credits
This report was prepared by Caroline Bryson and Dr Susan Purdon of Bryson Purdon Social Research.
Glossary of terms
| Active Labour Market Policy | Active Labour Market Policies (ALMPs) aim to increase the employment opportunities for job seekers and improve matching between jobs (vacancies) and workers (i.e. the unemployed). In so doing ALMPs may contribute to reducing unemployment and benefit receipt via increased rates of employment and economic growth. |
|---|---|
| Active learning techniques | Active learning techniques are based on actively involving participants in a learning activity rather than just requiring them to passively listen. |
| Carer’s Allowance | Carer’s Allowance (CA) is the main welfare benefit for carers and was formerly known as the Invalid Care Allowance. |
| Caseness | A person is described as having suggested case level anxiety or depression if their scores on the Generalised Anxiety Disorder (GAD-7) and Patient Health Questionnaire (PHQ-9) scales suggests they would exceed the ‘caseness thresholds’ used by Improved Access to Psychological Therapies. Diagnosis of anxiety and depression respectively would be based on a clinical interview and would take account of additional evidence, to which the GAD and PHQ scores may contribute. |
| Cost Benefit Analysis | A cost benefit analysis (CBA) examines all the costs and benefits of the intervention and quantifies them in monetary terms as far as possible, in order to examine the balance of costs and benefits. |
| Disability Employment Advisor | Disability Employment Advisors (DEAs) are people employed by Jobcentre Plus to support and upskill Work Coaches and other members of jobcentre staff to deliver tailored advisory services to disabled people. |
| Effect size | An effect size is the difference between the mean for the 2 groups (for example, the intervention and control groups in a randomised control trial) divided by the overall standard deviation. |
| Employment and Support Allowance | Employment and Support Allowance (ESA) is a benefit for people who have an illness, health condition or disability that affects how much they can work. ESA offers financial support if people are unable to work, and personalised help so that people can work if they are able to. |
| Financial strain | Financial strain refers to when an individual’s financial outgoings start to exceed their income to a degree that psychologically threatens their sense of self, identity, relationships and/or self-esteem. |
| General self-efficacy | General self-efficacy is the strength of an individual’s belief that they are effective in handling life situations. |
| Group Leader | Group Leaders are the individuals who delivered the Group Work course, using active learning techniques, to participants. |
| Group Work | Group Work is a course designed to enhance self-efficacy, self-esteem and social assertiveness among those looking for paid work. It aims to prevent the potential negative mental health effects of unemployment and help unemployed people back into work. The course is the application of JOBS II model, originally developed by the University of Michigan, in the UK labour market. |
| Impact on Participants | Impact on Participants (IoP) refers to the analysis of the impact of an intervention based on comparing outcomes for individuals who participated in the intervention with a matched comparison group of individuals who did not. |
| Income Support | Income Support (IS) is an income-related benefit for people who have no income or are on a low income, and who cannot actively seek work. It is mainly for people who cannot seek work due to childcare responsibilities. |
| Initial Reception Meeting | All Group Work participants were invited to an Initial Reception Meeting (IRM) which preceded the course itself. The IRM was designed as an opportunity for participants to meet the Group Leaders who would deliver their course and learn more about what it would involve. |
| Intention to Treat | Intention to Treat (ITT) refers to the analysis of the impact of an intervention based on comparing outcomes for all individuals who were offered the opportunity to participate in the intervention with a control group of individuals who were not offered this opportunity. |
| Jobcentre Plus | Jobcentre Plus (JCP) is a brand under which the DWP offers working-age support services, such as employment advisory services. In the context of this report, ‘jobcentre’ refers to the physical premises in which Jobcentre Plus services are offered. |
| JOBS II | JOBS II is the course originally designed by the University of Michigan, and the Group Work course is the application of JOBS II in the UK. |
| Job-search self-efficacy | Job-search self-efficacy is the strength of an individual’s belief that they have the skills to undertake a range of job-search tasks. |
| Jobseeker’s Allowance | Jobseeker’s Allowance (JSA) is an unemployment benefit for people who are actively looking for work. |
| Latent and Manifest Benefits | Latent and Manifest Benefits (LAMB) are material and psychosocial benefits associated with being in work such as social interaction, social support, activity, identity, collective purpose, self-worth (Latent benefits) and income (Manifest). |
| Mastery | The mastery outcome was a composite measure taking into account scores on job search self-efficacy, self-esteem and locus of control indexes. It was designed to be a measure of someone’s emotional and practical ability to cope and take on particular situations. |
| Mental Health Issues | Mental Health Issue is a broad term that includes those who have: deteriorating mental health (for example, related to the experience of unemployment); elevated but not clinical levels of a symptom; mental health conditions; or are post-treatment; have symptoms but may not recognise they have a condition; or are aware of their condition/ situation but choose not to disclose. Many individuals with Mental Health Issues are found to struggle with their job search. |
| Psychosocial | Psychosocial indicators concern psychological and social factors that can influence health and wellbeing outcomes. Typical examples of such indicators include social support, employment status, job quality, poverty and marital status. |
| Self-efficacy | Self-efficacy is the strength of an individual’s belief that they have the skills to undertake a task and achieve an outcome. |
| Standard deviation | Standard deviation is a statistical measure of how much or how little all values for a group vary from the overall mean for the group. A low standard deviation indicates that the values tend to be close to the mean, while a high standard deviation indicates that the values are spread out over a wider range. |
| Statistical significance | A statistic derived from a study, such as the difference between 2 groups, is said to be statistically significant if the size of that statistic has only a low probability of arising by chance alone. The probability of a statistic of that size occurring by chance alone is termed the ‘p-value’. By convention, if the p-value is less than 0.05 then it is stated that the statistic is ‘significant’. |
| Universal Credit | Universal Credit (UC) is an in and out of work benefit designed to support people with their living costs. Most new claims by people with a health condition or disability are now made to UC. |
| Well-being | Wellbeing is an individual’s self-report as to whether they feel they have meaning and purpose in their life, and includes their emotions (happiness and anxiety) during a particular period. |
| Work Coach | Work Coaches are frontline Jobcentre Plus staff based in jobcentres. Their role is to support benefit claimants into work through work-focused interviews. |
| Work and Health Unit | The Work and Health Unit (WHU) is a joint unit between the Department for Work and Pensions and Department of Health and Social Care. It leads on the Government’s strategy to support working-age disabled people or those with long-term conditions, to access and retain good quality employment. |
| Zelen design | The Zelen design is randomised control trial methodology in which randomisation is applied before any potential beneficiaries are informed of the possibility of participating in the intervention being trialed. Only those randomised into the experiment group are informed of the opportunity of participating. |
Abbreviations
| ALMP | Active Labour Market Policy |
| CA | Carer’s Allowance |
| CBA | Cost Benefit Analysis |
| CV | Curriculum Vitae |
| DHSC | Department of Health and Social Care |
| DLA | Disability Living Allowance |
| DWP | Department for Work and Pensions |
| ESA | Employment and Support Allowance |
| FIOH | Finnish Institute of Occupational Health |
| GAD | Generalised Anxiety Disorder |
| GSE | General Self-Efficacy |
| GW | Group Work/JOBS II |
| IoP | Impact on Participants |
| IRM | Initial Reception Meeting |
| IS | Income Support |
| ITT | Intention to Treat |
| JCP | Jobcentre Plus |
| JSA | Jobseeker’s Allowance |
| JSSE | Job Search Self-Efficacy |
| LAMB | Latent and Manifest Benefits |
| ONS | Office for National Statistics |
| pp | Percentage Point |
| PHQ | Patient Health Questionnaire |
| PIP | Personal Independence Payment |
| RCT | Randomised Control Trial |
| UC | Universal Credit |
| UCLA | University of California, Los Angeles |
| WHO | World Health Organisation |
| WHU | Work and Health Unit |
Executive Summary
Aims of the Group Work trial
Group Work is a 20-hour job search skills workshop comprising 5 four-hour sessions delivered over the course of a working week designed to enhance self-efficacy, self-esteem and social assertiveness among those looking for paid work. Delivered by third party contractors, and using training on job search to help participants feel competent and confident in their abilities to look for and find paid work, Group Work aims to prevent the potential negative mental health effects of unemployment and help unemployed people back into work, as well as strengthening their resilience to setbacks that they may face in the process of applying for jobs.
Group Work is a trial of the JOBS II programme, which was originally developed in the United States by the Michigan Prevention Research Centre (MPRC) at University of Michigan. It has since been adapted and trialled in a number of countries. Between January 2017 and March 2018, the Department for Work and Pensions (DWP) and Department of Health and Social Care (DHSC) Joint Work and Health Unit undertook a Randomised Controlled Trial (RCT), to test the potential effectiveness of the JOBS II intervention in a UK labour market context, targeting benefit claimants[footnote 1] who were struggling with their job search and/or were feeling low or anxious and lacking in confidence about their job search. Work Coaches were trained to recognise benefit claimants who were likely to benefit from the course based on these criteria. Over the course of the trial, 2,596 benefit claimants attended the Group Work course. Compared to the international trials, the UK trial was considerably larger in terms of the number of people included, and it covered a broader range of people, with no restrictions being set in terms of unemployment duration. The recruitment process in the UK was also very different, with all those deemed eligible being included, whereas in the international trials only those stating an interest in taking part were included.
The primary research question for the UK impact evaluation is whether Group Work improves employment, health and wellbeing outcomes for job seeking benefit claimants struggling with their job search. The impact evaluation addressed whether Group Work has a statistically significant positive impact on:
- entry into paid employment: The evaluation measures the impact of Group Work after 6 and 12 months on the percentage of people being in any paid work, as well as the percentage of those working 30 or more hours per week and receipt of unemployment-related benefits. It also looks at the type of work that people enter, measuring the impact of Group Work on people being in a job earning £10,000 or more per year, and on people being in a job with which they are satisfied
- people’s job search activity: Does Group Work have an impact on the type and level of job search activity that people are doing, including the number of CVs and applications they submit and their experience of doing work placements, voluntary work and/or training?
- people’s belief they have the skills to look for and find work: Does Group Work have an impact on people’s levels of self-efficacy and job search self-efficacy? Does it impact on their confidence in finding work and/or in the relevance of their own qualities and experience?
- wellbeing: Does Group Work have an impact on people’s levels of wellbeing, measured in terms of life satisfaction, happiness, self-worth, anxiety and loneliness, and their perceptions of the psychological and financial benefits of being in work?
- mental health: Does Group Work have an impact on people’s levels of anxiety, depression and wellbeing according to clinical measures?
- overall health: Does Group Work have an impact on the prevalence of self-reported health issues or on people’s use of health services?
In addition to measuring the impact of Group Work across the target population, a further aim of the impact evaluation has been to look for differential impacts across different population groups in line with the aims of the course and evidence from other JOBS II trials (where, notably, those with lower levels of self-efficacy and those with, or at higher risk of having, anxiety, depression or poor mental well-being). In other words, the analysis addresses the question of who benefits most from the course and whether the course is more effective in improving the outcomes of some population groups over others.
The impact evaluation
The impact evaluation was conducted as part of a wider programme of research for the Group Work project conducted by a consortium led by ICF, involving Bryson Purdon Social Research LLP (BPSR), IFF Research, Professor Steve McKay of the University of Lincoln, Dr Clara Mukuria of the University of Sheffield and Dr Adam Coutts of the University of Cambridge. This technical report details the methodology of, and findings from, the impact evaluation. It forms part of a suite of 3 technical reports from the evaluation, one per strand – impact evaluation, process evaluation and cost benefit analysis. A synthesis report integrates the findings from the 3 strands and provides commentary on their policy and practice implications.
Within the Zelen-designed RCT[footnote 2], eligible benefit recipients were randomly allocated either into a group offered the Group Work course or into a control group. The outcomes of trial participants were tracked from ‘baseline’[footnote 3] for 12 months, with data on their outcomes collected to measure the impact of the Programme 6 and 12 months after baseline using both administrative data and survey data collected on a sub-sample.
Those offered the course could opt to attend or decline to do so. In the event, only 22% of those offered the course went on to attend, with those most likely to do so being those reporting lower general or job-search self-efficacy, lower life satisfaction, lower levels of depression[footnote 4], the longer-term unemployed, and those who were older and male.
In line with the design of the trial, the original intention had been to measure the impact of Group Work among all those offered the course (an Intention-to-Treat (ITT) analysis) – that is, comparing the combined outcomes of those who attended the course (course participants) and those who declined (course decliners) against those not offered the course (the control group). With the achieved 6-month sample sizes, the size of impact needed for statistical significance on a binary (percentage) outcome is around 5 percentage points. That is, the difference between the offered Group Work group and the control group needs to be at least 5 percentage points.[footnote 5] With the sample sizes achieved at the 12 month survey the size of impact needed for statistical significance is around 7 percentage points.[footnote 6] However as, only 22% of those offered it participated on the course, the ability to detect impacts of this size is enormously reduced. Therefore, this report focuses mainly on the impacts of Group Work on course participants (an Impact on Participants (IoP) analysis). See Section 2 for more discussion on the methodology.
Headline findings
Overall, when looking at the impacts on all those offered the course (the ITT analysis), statistically significant positive impacts are detected on a small number of mental health, wellbeing and self-efficacy measures after 6 months. However, these statistically significant impacts are no longer in evidence after 12 months. When focusing on course participants (IoP), there are a wider range of significant positive impacts at 6 months across a range of mental health, well-being and self-efficacy measures, as well as on measures of confidence in finding paid work. Moreover, there is a pattern of positive but not statistically significant differences between the outcomes of participants and the matched comparison group. As with the ITT analysis, in the main, there are no longer statistically significant impacts at 12 months, although the non-significant differences between participants and the matched comparison group are still positive. The impacts which remain statistically significant at 12 months are that course participants were more likely than the matched comparison group to have higher levels of job search efficacy and higher self-reported levels of happiness. Group Work appeared to be most effective for those with lower levels of self-efficacy and higher levels of anxiety and depression before they start the course. There are a wide range of statistically significant positive impacts for these groups, sustained 12 months after baseline. Importantly, although there is no statistically significant evidence that Group Work impacts entry into paid work either across the whole trial population (the ITT analysis) or among all course participants (the IoP analysis), Group Work does appear to have a statistically significant impact on employment levels among those with greater mental health and self-efficacy issues prior to the course, broadly in line with the international evidence from other JOBS II trials. Importantly, there is no evidence of any negative impacts of attending a Group Work course.
Impacts across the trial population (ITT)
Overall, when looking at the impacts on all those offered the course (the ITT analysis), statistically significant positive impacts are found on a small number of mental health, wellbeing and self-efficacy measures after 6 months. However, these statistically significant impacts are no longer in evidence after 12 months.
In summary:
- there is no statistically significant evidence from the ITT analysis that Group Work impacts on entry into work[footnote 7] or on job search activity
- however, there is some significant evidence 6 months after baseline of Group Work positively impacting on levels of job search capability. Those offered Group Work were significantly more likely than those in the control group to have higher levels of general self-efficacy (59% compared to 54%) and to agree with a statement that ‘my experience is in demand’ (59% compared to 53%). However, this impact is not sustained 12 months after baseline. The difference between the job search self-efficacy scores of those offered and not offered Group Work were close to statistical significance 6 months after baseline (56% compared to 50%). However, no statistically significant impacts were found across a range of other job search confidence questions including a measure of confidence in finding work within the next 13 weeks
- using the World Health Organisation-Five Well-being Index (WHO-5) to identify those with likely depression or poor wellbeing, 6 months after baseline those offered Group Work had significantly better scores than those in the control group (a mean score of 12.2 out of 25 compared to 11.4). However, this statistically significant impact is not sustained 12 months after baseline. However, there is no consistent evidence from the ITT analysis that the offer of Group Work impacts on levels of anxiety or depression (measured using clinical standardised scales PHQ-9 and GAD-7)[footnote 8], or on overall self-perceived health or use of health services[footnote 9]
- looking across a range of wellbeing measures (including levels of life satisfaction, feeling worthwhile, happiness and loneliness), little statistically significant evidence is found of impacts on those offered Group Work
Impacts on Group Work course participants (IoP)
When comparing the 6-month outcomes of Group Work course participants with those of a matched comparison group drawn from the control group (i.e. an ‘Impact on Participant’, or IoP, analysis), there are a wider range of statistically significant positive impacts at 6 months than the ITT analysis across a range of wellbeing and self-efficacy measures, as well as on measures of confidence in finding paid work. However, as with the ITT analysis, in the main, these differences narrow after 12 months and, whilst remaining positive, are no longer statistically significant.
In summary:
- there are positive percentage point differences between course participants and the matched comparison group in terms of being in paid work, including measures of any work, full-time work, earnings levels and job satisfaction[footnote 10] although they are not large enough to reach statistical significance
- there is positive, but largely non-statistically significant, evidence of Group Work participants doing more job search (including looking for work, responding to vacancies and doing voluntary work, placements or training) than the matched comparison group. However, the only outcome for which there is a significant impact of attending Group Work is on the number of CVs that a participant had submitted in the previous fortnight. At 6 months, 28% of course participants had submitted ten or more CVs in the previous 2 weeks compared to 16% of the matched comparison group. The pattern is similar, and still statistically significant, at 12 months, with 26% of course participants submitting ten or more CVs compared to 18% of the matched comparison group
- Group Work appears to be effective in moving people towards work, increasing people’s belief in their ability to enter work. Six months after baseline, course participants reported a level of belief in their ability to find work not apparent among the matched comparison group across a range of measures. Six months after baseline:
- course participants were statistically significantly more likely than the matched comparison group to rate as having higher levels of general self-efficacy (60% compared to 47%). In other words, 6 months after the course, participants were more likely to perceive themselves as being able to effectively handle situations than their matched comparison group
- the proportion of course participants who reported higher levels of job search self-efficacy is also significantly different to the proportion among the matched comparison group (58% compared to 36%), with this significant impact still evident 12 months after baseline
- the percentage of course participants agreeing strongly or agreeing about the value of their personal qualities was significantly higher 6 months after baseline than the percentage in the matched comparison group. 70% of course participants and 59% of the matched comparison group agreed or agreed strongly that “my personal qualities make it easy to get a new job”
- likewise, 61% of course participants compared to 46% of the matched comparison group agreed or agreed strongly that “my experience is in demand in the labour market”
- course participants were also significantly more likely to be confident that they would find work within the next 13 weeks (40% compared to 27% of the matched comparison group)
Although positive differences between the 2 groups are sustained after 12 months, the only findings which remain statistically significant are levels of job search self-efficacy and the number of CVs being submitted by the 2 groups.
- there is statistically significant evidence of Group Work positively impacting on levels of mental health. Using the WHO-5 index, course participants were significantly less likely than the matched comparison group to score as having likely depression or poor wellbeing (49% compared to 59%) 6 months after baseline, although this is not sustained after 12 months. The PHQ-9 depression scale identified the same pattern of positive results, but not at a level that reached statistical significance. The differences in the proportions of participants and the matched comparison group whose scores suggest them having suggested case-level anxiety[footnote 11] using the standardised GAD-7 anxiety scale, were very close to statistical significance[footnote 12]
- moreover, across a range of wellbeing measures capturing life satisfaction, feeling life is worthwhile, happiness, loneliness, and perceptions of the value of employment, there are statistically significant positive impacts of Group Work on participants’ levels of wellbeing at 6 months. However, with the exception of levels of happiness, none of these impacts remain significant 12 months after baseline. 6 months after baseline:
- on the ONS life satisfaction measure, just under half (48%) of the course participants reported that they were satisfied with their lives compared to 34% of the matched comparison group
- using the ONS measure of the extent to which someone feels their life is worthwhile, just over half (54%) of the participants perceived life as being worthwhile compared to 38% of the matched comparison
- on the ONS measure of happiness, just over half (55%) of the course participants rated themselves as happy compared to 37% of the matched comparison group
- course participants were less likely than the matched comparison group to rate as lonely on the UCLA Loneliness Scale (46% compared to 55%)
- the LAMB scale measures someone’s self-perception of their psychosocial environment such as social support, activity, time structure and routine.[footnote 13] Course participants were more likely than the matched comparison group to have a positive perception of their psychosocial environment. On the standard 4-category measure which captures an individuals perceived psychological and social benefits to being employed (where a lower score denotes a better LAMB score), 15% of course participants scored in the lowest (best) category compared to 7% of the matched comparison group
Differential impacts across sub-groups of course participants (IoP)
Strong evidence was found, broadly in line with the international literature, that Group Work is most effective for those with lower levels of self-efficacy and those whose depression and anxiety levels at baseline suggest that they might receive a clinical diagnosis.
Course participants and the matched comparison group were divided into those with lower and higher levels of general self-efficacy at baseline (see Chapter 3 for more detail on how these groups are defined). Six months after baseline, course participants with lower baseline general self-efficacy had statistically significantly better outcomes than their matched comparison group in relation to being in paid work, in full-time paid work, their levels of general and job search self-efficacy, their wellbeing and their anxiety levels. With the exception of being in paid work, all of these statistically significant impacts are sustained 12 months after baseline. However, among those with higher levels of general self-efficacy, Group Work appeared to have very little impact. Nonetheless, there was a statistically significant positive impact (at 6 months, but not at 12 months) on levels of job search self-efficacy, and no evidence of the course having any negative impacts.
The pattern is very similar when course participants and the matched comparison group are divided into those with suggested case level[footnote 14] anxiety at baseline and those who did not. Again, Group Work is found to be effective in improving the 6 month outcomes of those with suggested case level anxiety at baseline across the same range of outcomes, whilst the only significant impact for those with lower baseline anxiety scores was on their levels of job search self-efficacy. Twelve months after baseline, among those with suggested case level baseline anxiety, course participants were significantly more likely to be in paid work of 30 hours or more and to have higher levels of general and job search self-efficacy.
Lastly, course participants and the matched comparison group are split into those whose PHQ-9 score suggested case level depression[footnote 15] at baseline and those whose score did not, there is similar evidence, but statistically significant on fewer outcomes, that Group Work is more effective for those with higher levels of depression. There is considerable overlap between anxiety and depression, so this consistency of evidence is to be expected. Among those with suggested case level depression at baseline, there are significant impacts - 6 and 12 months after baseline - on their levels of general and job search self-efficacy, and depression/wellbeing (as measured by the WHO-5 scale). Group Work appears to have very little impact on those who do not exhibit case level baseline depression. The only 6-month outcome on which there is a significant impact of Group Work among those with lower levels of baseline depression is job search self-efficacy.
Concluding comments
Low take-up of the Group Work course made it highly unlikely that statistically significant impacts could be identified across all those offered the course (as per the original ITT design). However, under the IoP analysis, where the 6 and 12-month outcomes of course participants are compared to a matched comparison group, there is some evidence of Group Work having an impact at 6 months. Although it did not appear to impact on employment rates, its ability to impact on mental health, levels of job search self-efficacy, participant confidence and a wider range of wellbeing outcomes suggests that the course is effective in these respects. Moreover, no negative impacts of Group Work on course participants were detected. However, as these positive impacts tend to remain but not be statistically significant 12 months after baseline, it suggests that some further intervention might be required to capitalise on these early impacts.
A key finding from this evaluation is the differential impact that Group Work appeared to have on sub-groups of participants with different starting points, and is supported by evidence from previous JOBS II trials. It was most effective for those with lower starting levels of general self-efficacy and poorer mental health, where there are statistically significant impacts - importantly, often sustained after 12 months - on employment and mental health outcomes, self-efficacy and wellbeing. Although this will no doubt give pause for thought about whether the course should be more targeted, it is important to consider whether the same impacts would have been found if the dynamics of the course were changed by having a greater proportion of attendees with these potential challenges to entry into work. This is further discussed in the process evaluation (Knight et al., 2020a) and synthesis reports (Knight et al., 2020b).
1. Overview
1.1. Overview
Group Work is a 20-hour job search skills workshop designed to enhance self-efficacy, self-esteem and social assertiveness among those looking for paid work. Using training on job search to help participants feel competent and confident in their abilities to look for and find paid work, it aims to prevent the potential negative mental health effects of unemployment and help unemployed people back into work. It is a UK version of the JOBS II programme that was originally developed in in the United States by the University of Michigan and since been trialled in a number of countries.
Group Work is one of several interventions being trialled by the Department for Work and Pensions (DWP) and Department of Health and Social Care (DHSC) Joint Work and Health Unit (WHU) to build a strong evidence base of what interventions work best to help those with health issues move into or retain work (see van Stolk et al., 2014, for the report which recommended the testing of JOBS II in the UK). The WHU undertook a Randomised Controlled Trial (RCT), to test the potential effectiveness of the JOBS II intervention in a live UK labour market context, targeting benefit claimants struggling with their job search and/or feeling low, anxious and lacking in confidence about aspects of their job search. The evaluation of the Group Work Trial was conducted by a consortium led by ICF, involving Bryson Purdon Social Research LLP (BPSR), IFF Research, Professor Stephen McKay of the University of Lincoln, Dr Clara Mukuria of the University of Sheffield and Dr Adam Coutts of the University of Cambridge. The evaluation comprised 3 main strands:
- an impact evaluation, drawing on survey data collected for random sub-samples of the trial participants and DWP administrative data, measuring the impact of Group Work after 6 and 12 months
- a process evaluation focusing on the set up and running of the trial as well as the perceptions of course participants, and those declining to participate, in Group Work
- a cost benefit analysis, comparing the costs of running the course against the monetary gains of any improvements in participants’ outcomes
ICF conducted the process and cost benefit analysis strands. BPSR conducted the impact analysis based on DWP administrative data and a longitudinal survey of trial participants which was conducted by IFF Research (which also included participant perception questions which formed part of the process evaluation). Dr Adam Coutts, whilst on a research placement with DWP, was directly involved in the design and commissioning of the trial and the evaluation and conducted a programme of observation and ethnographic research with programme providers and participants.
This technical report details the methodology of and findings from the impact evaluation. It forms part of a suite of 3 technical reports from the evaluation, one per strand (Knight et al., 2020a; Rayment et al., 2020)). A synthesis report integrates the findings from all 3 strands, along with commentary on their policy and practice implications (Knight et al., 2020b).
In the Zelen-based RCT (see Section 2.3 for more detail), eligible benefit recipients were randomly allocated either into a group offered the Group Work course or into a control group. Those offered the course could opt to attend the course or decline to do so. The outcomes of trial participants were tracked from ‘baseline’[footnote 16] for 12 months, with data on their outcomes collected to measure the impact of the Programme 6 and 12 months after baseline using both administrative and survey data.
In line with the design of the trial, the original intention had been to carry out an Intention-to-Treat (ITT) analysis to measure the impact of Group Work among all those offered the course – that is, comparing the combined outcomes of those who attended the course (course participants) and those who declined (course decliners) against those not offered the course (the control group). The rationale for this was that the RCT was designed to test the effect of a voluntary course and, therefore, its overall impact should necessarily include those who did not choose to take it up. However, only 22% of those offered the course went on it. As a result, the ability to detect an impact of the Programme based on an ITT analysis is enormously reduced (see Section 6.1). Therefore, while the ITT analysis is reported in Chapter 5, the main focus is on the impacts of Group Work on course participants (Impacts on Participants (IoP), reported in Chapters 6 and 7). Although this moves away from the original trial design, it was deemed a fairer test of the effectiveness of the course. A range of steps have been taken to ensure that, as far as the data will allow, the outcomes of course participants are compared against a matched comparison group who, at baseline, very closely resembled course participants (see Section 6.2).
1.2. Aims of the impact evaluation
The WHU’s trial of Group Work targeted claimants of Jobseeker’s Allowance (JSA), Employment Support Allowance (ESA), Universal Credit Full Services (UC) and Income Support (IS) (Lone Parents with child(ren) aged 3 and over) who were struggling with their job search and/or feeling low or anxious and lacking in confidence about their job search. The overall aim of the impact evaluation has been to measure the effectiveness of Group Work within a live UK policy context among this target group. The target population for the Group Work trial was broader than for several other international evaluations of JOBS II (for instance, including those with both short and longer-term periods of unemployment). Compared to other trials, Group Work also included a much larger proportion of people who had no experience of paid employment (see Section 2.2 for more detail).
The primary research question for the impact evaluation is whether Group Work improves employment, health and wellbeing outcomes for job seeking benefit claimants struggling with their job search. The full range of outcome measures is described in Chapter 3, but in summary, the research questions for the impact evaluation are:
Does Group Work have a statistically significant positive impact on:
- entry into paid employment: The evaluation measures the impact of Group Work after 6 and 12 months on the percentage of people being in any paid work, as well as the percentage of those working 30 or more hours per week. It also looks at the type of work that people enter, measuring the impact of Group Work on people being in a job earning £10,000 or more per year, and on people being in a job with which they are satisfied
- people’s job search activity: Does Group Work have an impact on the type and level of job search activity that people are doing, including the number of CVs and applications they submit and their experience of doing work placements, voluntary work and/or training?
- people’s belief they have the skills to look for and find work: Does Group Work have an impact on people’s levels of self-efficacy and job search self-efficacy? Does it impact on their confidence in finding work and/or in the relevance of their own qualities and experience?
- wellbeing: Does Group Work have an impact on people’s levels of wellbeing, measured in terms of life satisfaction, happiness, self-worth, anxiety and loneliness, and their perceptions of the psychological and financial benefits of being in work?
- mental health: Does Group Work have an impact on people’s levels of anxiety, depression and wellbeing according to clinical measures?
- overall health: Does Group Work have an impact on the prevalence of self-reported health issues or on people’s use of health services?
In addition to measuring the impact of Group Work across the target population, a further aim of the impact evaluation has been to look for differential impacts across different population groups in line with the aims of the course and evidence from other JOBS II trials (where, notably, those with lower levels of self-efficacy and those at higher risk of mental health problems). In other words, the analysis addresses the question of who benefits most from the course and whether the course is more effective in improving the outcomes of some population groups over others.
1.3. Report outline
This technical report is structured as follows:
- Chapter 2 outlines the Group Work course, detailing the RCT design used to test the impact and including a summary of international trials of JOBS II
- Chapter 3 describes the outcomes used to measure the impact of Group Work
- Chapter 4 provides a profile of the trial population, and examines the factors that are correlated with take-up of the course
- Chapter 5 details the methodology and findings from the ITT analysis, that is, the impact of Group Work at 6 and 12 months among all those offered the course
- Chapter 6 details the methodology and findings from the IoP analysis, that is, the impact of Group Work at 6 and 12 months among those who attended the course
- Chapter 7 reports on the impact of Group Work at 6 and 12 months among different population sub-groups of course participants (an IoP analysis)
- Chapter 8 provides concluding comments on the report findings
There is an amount of repetition within each chapter, so that each can, as far as is possible, be read as a stand-alone chapter. Those interested in the key findings should focus on Chapters 2, 6, 7 and 8.
The following appendices are included at the end of the report:
- non-response weighting (Appendix A)
- demonstration of balance between the 2 arms of the trial at randomisation and for those responding to the surveys at 6 and 12 months (Appendix B)
- propensity score matching (Appendix C)
- correlations between the outcome measures (Appendix D)
2. The Group Work trial design
2.1. The Group Work course
Group Work is a 20-hour group-based course delivered in 5 half-day sessions, averaging 4 hours a day, over the period of a working week. The course content focuses on job search skills. However, the underlying processes by which it is delivered are also designed to enhance the self-efficacy, self-esteem and social assertiveness of the participants to help unemployed job seekers with (or at risk of) mental health issues look for and find paid work:
The job-search skill content is used as a vehicle for helping participants feel competent and confident. It is this confidence that will be the true source of their success.
UK edition of JOBS II Manual
The course is led by trained facilitators using active learning techniques and aims to prevent the potential negative mental health effects of unemployment and help unemployed people back into work. During the trial, benefit claimants who agreed to attend the course were first invited to attend an Initial Reception Meeting (IRM) at which they met the facilitators and other participants and found out more about what the course would involve. Both the IRM and the full course were delivered at non-Jobcentre Plus venues by a third-party provider.
Group Work is the application of the JOBS II model, which was first developed in the United States by the University of Michigan and since trialled in a number of countries (see Section 2.2). It is one of a number of interventions being trialled by the Department for Work and Pensions (DWP) and Department of Health and Social Care (DHSC) Joint Work Health Unit (WHU) to build a strong evidence base of what interventions work best to help those with health issues move into or retain work.
For more information on how the course was set up and delivered, and course content see Knight et al. (2020a).
2.2. International trials of the JOBS II programme
The process report for this evaluation (Knight et al., 2020a) includes a summary of the international evidence from previous evaluations of JOBS II. Differences in trial populations and outcome measures make it hard to make direct comparisons with the Group Work trial. However, the summary here draws on the 2 trials which provide the most relevant for and comparable data to the UK trial, with Table 2.1 summarising trial designs in each case. Further detail on the UK trial is included in Section 2.3, with the findings for the US and Finnish trials being discussed here.
Table 2.1: Summary of the trial designs in the UK, United States of America and Finland
| Group Work (UK) Trial | USA Trial | Finnish Trial | |
|---|---|---|---|
| Eligibility | Benefit claimants struggling with job search. No criteria set in terms of unemployment duration | Unemployed for less than 13 weeks | Unemployed or had received termination notice. No criteria set in terms of unemployment duration |
| Recruitment and random allocation | Zelen design. All those identified as eligible were included in the trial and randomly allocated. Those allocated to the intervention arm were then invited to take up the course. | Trial participants initially recruited by interviewers. Those interested were asked to complete a screening questionnaire. Only those screened in were randomly allocated. | Potential participants were contacted about the trial. Only those expressing interest were randomly allocated. |
| Numbers randomized | 16,193 | 1,801 | 1,261 |
| Take-up of the programme in the intervention arm | 22% | 54% | 70% |
| Range of outcomes collected | Employment; job-search activity; general self-efficacy; job-search self-efficacy; latent and manifest benefits; well-being; depression; anxiety; overall health. | Employment, financial strain; assertiveness; role and emotional functioning; job search self-efficacy; self-esteem; internal control orientation; mastery, depression; distress symptoms. | Employment, wage rate, job stability, job satisfaction; job-search intensity; psychological distress; and depressive symptoms. |
The initial JOBS II model developed in the United States by the University of Michigan was first tested in a randomised controlled trial (RCT) (Vinokur et al., 1995). That trial focussed on those unemployed for less than 13 weeks so in that respect alone is very different to the Group Work trial in the UK which included jobseekers with a range of lengths of unemployment (including half who report never having been in paid work) as well as those already in some form of paid work. Trial participants were recruited to the US trial by trained interviewers (again, a difference to the UK trial where Work Coaches were responsible for recognising benefit claimants who might benefit from the offer of Group Work) approaching potential participants while they waited in unemployment offices. Those meeting basic eligibility criteria were told about the programme and asked to complete a screening questionnaire. Those judged eligible based on their questionnaire responses were then randomly allocated to JOBS II or control group. The trial was designed to allow for a test of whether JOBS II was more, or less, effective for those at high risk of depression (relative to mild risk), and the trial actively over-represented those at high risk.
Of those allocated to JOBS II, 54% took up the programme. This is much higher than the take-up percentage for the Group Work trial, where the take-up rate was 22%. The exact reasons for this large difference between the 2 trials are unclear. It may reflect the fact that the JOBS II trial in the US recruited only those recently unemployed, or it may be a cultural difference. Another plausible explanation is that the recruitment by interviewers in Michigan prior to randomisation led to the exclusion of many of those who were simply not interested in participation.
The outcomes studied in the Michigan trial covered a similar range to those of the Group Work trial (depression, financial strain, assertiveness, distress symptoms, role and emotional functioning, job search self-efficacy, self-esteem, internal control orientation, mastery[footnote 17], and reemployment). However, the outcome scales used are generally not the same as those used in the Group Work trial, so direct comparison is not possible. The main findings from the United States JOBS II trial at 6-months were:
- the experimental group had significantly higher mastery scores than the control group
- those at high risk of depression were significantly more likely to be in work if they were in the experimental group rather than the control group, the impact being around 10 percentage points. There was no significant impact on employment for those at mild risk of depression
- the programme had a positive impact on measures of depression for those at high risk of depression, but no impact on those at mild risk of depression
The JOBS II programme has also been tested using a RCT design in Finland (Vuori et al., 2002). The Finnish trial recruited people from a longer-term unemployed population than the Michigan trial and is in that respect closer to the UK Group Work trial. However, the recruitment process was very different to the UK model. In Finland, potential participants were contacted, informed about the trial, and only those interested in taking part, agreeing to randomisation, and completing a baseline assessment questionnaire were included. This approach generated a much higher take-up rate of the programme for those allocated to the experiment group, at 70%. This recruitment approach provides a trial of JOBS II for a group of people who believe that the programme will benefit them and so are willing to engage. The impacts from such a trial are unlikely to be replicated in a trial with a broader population.
The outcomes collected in the Finnish trial are, again, similar to the Group Work outcomes in terms of their range, but the actual scales used are different. So, as with the Michigan trial, direct comparisons with the UK trial are generally not possible. The Finnish outcomes include: reemployment, wage rate, job stability, job satisfaction, job-search intensity, psychological distress (measured using the General Health Questionnaire), and depressive symptoms (measured using the Depression (DEPS) scale).
The Finnish trial found that at 6-months:
- there was no statistically significant impact on reemployment, but there was a positive significant impact on stable employment[footnote 18]; this impact was greatest for those unemployed for a ‘moderate’ amount of time (3 to 12 months). There was no statistically significant impact on the longer-term unemployed
- no statistically significant impacts on wage rates or job satisfaction were found
- there was a statistically significant positive impact on reduced psychological distress, with the impact being greatest for those at the greatest risk of depression at baseline. No statistically significant impact was detected on depressive symptoms
2.3. The Group Work trial design
The Group Work trial started in January 2017 and finished in March 2018, with 2,596 benefit claimants attending the Group Work course (with attending defined as starting but not necessarily completing). The trial operated in 5 Jobcentre Plus districts – Durham and Tees, Merseyside, Midland Shires, Mercia, and Avon, Severn and Thames, with one or 2 centrally located provider hubs (where the Group Work course was delivered) and a number of participating jobcentres in each district.
To be eligible for the trial, participants had to be struggling with their job search and/or feeling low or anxious and lacking in confidence about their job search, and in receipt of Jobseeker’s Allowance (JSA), Employment Support Allowance (ESA), Universal Credit Full Services (UC) or Income Support (IS) (Lone Parents with child(ren) aged 3 and over). Benefit claimants who were doing some forms of paid work were still eligible for the trial if they were seeking further or different employment.
Work Coaches in the participating jobcentres were responsible for recognising benefit claimants who might benefit from Group Work, and were provided with training and a desk-based aid using these eligibility criteria (see Knight et al., 2020a for more detail). They administered an onscreen survey with these claimants. On completion of the survey (and regardless of the responses given), the benefit claimants were randomised into 2 unequally sized groups, the first of which was offered the opportunity to go on the course (the ‘intervention’ or ‘offered Group Work group’) and the second was not (the ‘control group’). 73% (n=11,900) of the trial participants were randomly assigned to the offered Group Work arm of the trial and 27% to the control group (n=4,293).[footnote 19] The control group were offered standard services, as appropriate, with no mention made of Group Work.
The Work Coaches introduced and explained the course to benefit claimants allocated to the offered Group Work arm and then carried out handovers to the provider in their district. Participation in Group Work was entirely voluntary.
At the point of randomisation, 45% of those offered the course agreed to attend the initial reception meeting (IRM) that preceded the course, with the proportion interested reducing over time. A third (34%) attended an IRM, whilst only 22% started the course (with attendance defined as starting the course). While the process report (Knight et al., 2020a) provides commentary on a range of reasons for this, from an impact perspective it is important to note that some of those initially interested may have later declined because they entered paid work before the course start.
The Group Work course was delivered by 2 third-party providers: one covering the Durham and Tees and Merseyside districts; and the other the Midland Shires, Mercia and Avon, Severn and Thames districts. Both providers had a Service Level Agreement with the DWP that benefit claimants would attend an IRM within 5 days of a referral and that they would start the full Group Work course within 15 days.
The trial adopted a single consent Zelen design (Torgerson and Roland, 1998). In accordance with this design, eligible benefit claimants were randomised into either the ‘offered Group Work’ arm or the control arm without obtaining prior informed consent. The single consent design means that only those offered Group Work were later informed that they were part of a trial and given the option of accepting or declining the intervention. Those in the control group were not offered Group Work but rather were offered the standard range of interventions or support through Jobcentre Plus.
The Zelen design made the trial operationally easier to administer for Jobcentre Plus Work Coaches. It allowed the Work Coach to have a fuller discussion if they knew the benefit claimant has been allocated to the intervention arm, as opposed to a Work Coach trying to recruit a benefit claimant into a trial in which they may be allocated to the control group. Where benefit claimants were indeed allocated to the control group, this had the potential to harm the working relationship between the claimant and the Work Coach.
The motivation for running the trial as a formal RCT, whether following a Zelen design or otherwise, was that it would give unbiased estimates of impact based on an Intention to Treat (ITT) analysis. Under this analysis, outcomes for all those assigned to the offered Group Work arm (irrespective of whether or not they take up the course) are compared to outcomes for those assigned to the control group. The randomisation should ensure that the 2 arms of the trial are ‘balanced’, in the sense that they will both have the same profile of people, apart from any randomly occurring differences. Any difference in outcomes that is statistically significant can then be confidently attributed to the Group Work offer. Table B.1 of Appendix B demonstrates the balance at the point of randomisation.
In part this ‘guarantee’ of balance is somewhat undermined because data on most outcomes have necessarily been collected by survey rather than via administrative systems (see Section 2.4 for more detail). The surveys are voluntary and there is potential for non-response bias. If there are differences in the response profile for the 2 arms of the trial this may introduce bias into the estimates of impact. Furthermore, the baseline data were not collected at the same time for participants relative to decliners and controls, with baseline data for participants being collected on Day 1 of the course and baseline data for decliners and the control group being collected a few months later (see Section 2.4). Steps have been taken to test for and minimise any bias attributable to these features. The survey data have been tested for non-response bias by comparing the profile of those responding to the 6 and 12 month surveys to the profile of all those randomised. Observed differences in the profile have been addressed by applying non-response weights. After applying these weights, there is no observable evidence of imbalance. The details are included in Appendices A and B.
2.4. Data used in the impact analysis
The impact of Group Work has been estimated using DWP administrative data on benefit receipt and a longitudinal survey of random samples of those from each arm of the trial.
The administrative data cover the full trial population, including receipt, and its monetary value, of JSA, ESA, IS, UC, Disability Living Allowance (DLA), Carer’s Allowance, State Retirement Pension, Pension Credit, Widow’s Benefit and Bereavement Benefit. The analysis focuses on receipt and monetary value of the benefits related to unemployment or low pay, namely JSA, ESA, IS and UC, at 3 points in time: at randomisation as well as 6 and 12 months after randomisation.
The survey data[footnote 20] used for the impact evaluation were collected at 4 points in time[footnote 21]:
- At the point of randomisation, using an online survey administered by the Work Coaches. Key demographics and scores from a sub-set of outcomes were collected at this point on the 16,193 people entering the trial.
- A baseline survey collected a richer set of outcome measures. For the 2,596 course participants, this survey of pre-course outcomes measures was administered by the Group Leaders on the first day of the course. A random sample of those who declined the course (the ‘decliners’, who form part of the ITT analysis) and a random sample of the control group were contacted by IFF to take part in a telephone survey - 2,559 decliners and 1,484 members of the control group took part in this baseline survey. It is important to note 2 key differences between the baseline survey for course participants and the other 2 groups. The first is the data collection mode (telephone compared to paper self-completion). Second, although the baseline survey for decliners and the control group is designed to provide comparable data to the pre-course outcomes for participants, the participant baselines were conducted around 3 weeks after randomisation (median=20 days, mean=38 days), while, for decliners and the control group, the average gap between randomisation and the baseline survey collection was almost 5 months (median=145 days, mean=143 days). The reasons for the delay for the decliners and control group were mainly down to sample management issues. Firstly, an interval of several weeks was needed after randomisation so that the decliners could be distinguished from participants, after which a period was needed for sample cleaning. Secondly, those sampled were written to in advance of being approached by IFF, giving them an opportunity to opt out of the surveys. As a result, these processes took several months.
- Six months after baseline: All those taking part in the baseline survey were invited to take part in a telephone survey 6 months later, repeating the outcome measures collected at randomisation and baseline. 744 of the course participants, 1,066 decliners and 648 control group members did so.
- Twelve months after baseline: All those taking part in the baseline survey were again invited to take part in a telephone survey 12 months later (regardless of whether or not they took part at 6 months), using the same set of outcome measures as at the 6-month survey. 593 of the course participants, 580 decliners and 427 control group members did so.
The survey data have been assessed for non-response bias and non-response weights applied. This stage involved a comparison between the survey respondents and all those randomised on a range of characteristics recorded either at the randomisation stage survey or in DWP administrative datasets. To allow for this comparison, the data used in this report had to be restricted to those consenting for their survey data to be linked to DWP administrative data. This reduces the 6-month sample sizes to 609 for participants, 887 for decliners and 533 for the control group. The sample sizes at 12 months reduces to 510 for participants, 580 for decliners and 362 for the control group. The details of the non-response weighting are included in Appendix A. With these 6-month sample sizes, and allowing for the fact that the 609 participants have to be weighted down so that they represent 22% of the offered Group Work arm, the size of impact needed for statistical significance on a binary (percentage) outcome is around 5 percentage points.[footnote 22] That is, the difference between the offered Group Work group and the control group needs to be at least 5 percentage points. With the sample sizes achieved at the 12 month survey the size of impact needed for statistical significance is around 7 percentage points.[footnote 23]
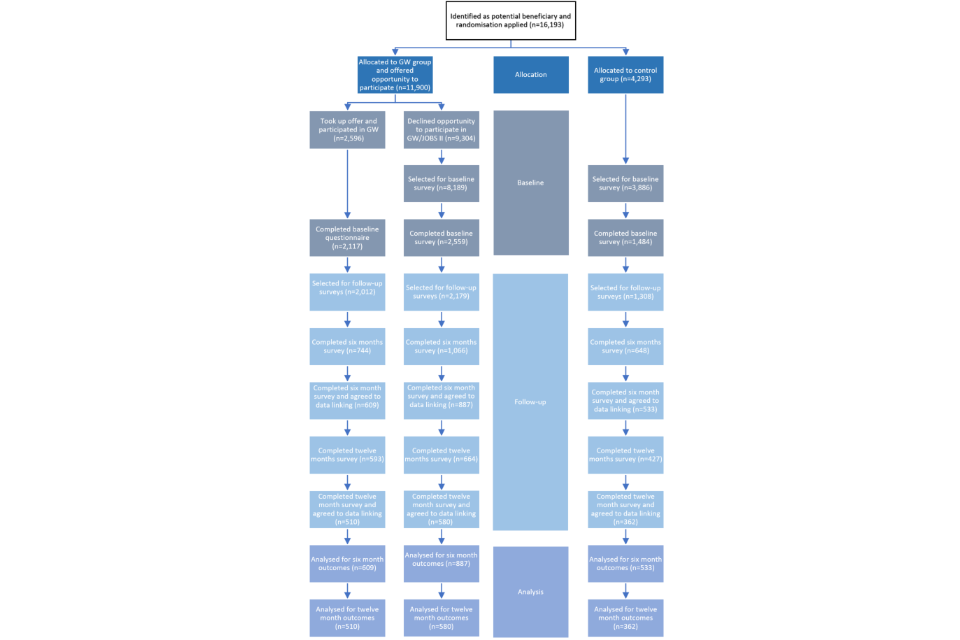
The trial design is summarised in Figure 2.1.
Figure 2.1: Flow diagram for the Group Work RCT
" "
2.5. Table format, statistical tests and p-values
Most of the tables in this report use the same format. The tables present the results for each outcome at baseline or randomisation (see Section 2.4), 6 months after baseline and 12 months after baseline. Where available, randomisation data are reported, as this provides the most accurate measure of outcomes prior to being offered the course, collected at precisely the same time point for both arms of the trial. Where the outcome measure was not collected at the point of randomisation (the case for the majority of outcomes) the baseline outcome is reported, with each table making clear which data wave are reported. The tables present the randomisation and baseline outcomes for all those completing the 6-month survey, but the results are very similar for those completing the 12-month survey. For each survey wave, the percentage or mean score is shown for those in the offered Group Work group and for those in the control or comparison group. Where data are not available, this is shown in the table as 2 dots (..).
The tables show for each outcome the p-value significance level of the difference between the offered Group Work and control/comparison groups. The p-value is the probability of an observed difference being due to chance alone, rather than being a real underlying difference for the population. A p-value of less than 5% is conventionally taken to indicate a statistically significant difference (p<0.05). The p-values have been calculated in the complex samples module of SPSS and take into account the weighting of the data applied to address survey non-response biases– see Appendix A. Where the differences between the 2 groups are statistically significant (that is the p-value is less than 0.05), these are highlighted in red and with an asterisk. The term ‘statistically significant’ is often abbreviated in the text to ‘significant’. The text also includes discussion of impacts which are close to statistical significance using, as a rule of thumb, a p-value of less than 0.10.
A large number of statistical tests have been carried out and included in this report. No attempt has been made to allow for multiple comparisons, partly because the number of tests is so large, but also because the tests are not independent of one another (the same sample is used each time and the outcomes are correlated), so standard multiple comparison adjustments are not valid. It should be noted that there is a risk that some of the apparent significant differences may arise just by chance.
P-values are dependent on sample size. For any given observed difference, the smaller the sample size the larger the p-value. Because the survey sample size is larger at 6 months than at 12 months, the impacts have to be slightly larger at 12 months to reach significance.
The unweighted sample sizes are cited at the end of each table.
3. The outcome measures
3.1. Overview
Drawing on the aims of Group Work, the evaluation measures the impact of Group Work on a range of employment, job search, mental health and well-being outcomes collected in the four-wave longitudinal survey of the trial population. In addition, the impact of Group Work is measured using Department for Work and Pensions (DWP) administrative data on being on job search related benefits and on the monetary value of those benefits (see Section 2.3).
As described in Section 2.3, baseline survey measures were collected at 2 points in time among course participants, those who declined the course and the control group. Data on a subset of outcomes were collected at the point of randomisation but as the amount of data that could be collected at that point was necessarily limited by the time available in the Work Coach interview, a fuller set of outcomes was asked in the baseline survey. These same outcomes were repeated at 6 months and 12 months after the baseline. The impact on benefit receipt using administrative data draws on 3 time points: randomisation and 6 and 12 months after randomisation.
The tables in Sections 3.2. to 3.8 show which outcomes were asked at each data collection point, from randomisation to 12-month follow-up.
This chapter provides more detail on each of the outcome measures, including the points at which the data were collected, divided into:
- work-related outcomes (section 3.2)
- job search related outcomes (section 3.3)
- well-being outcomes (section 3.4)
- mental health outcomes (section 3.5)
- wider health outcomes (section 3.6)
The interconnectedness of a number of the mental health, health and wellbeing outcomes means that there is a relatively high level of correlation between the outcomes, demonstrated in Appendix D. This means that, to some extent, there is overlap in what different measures (for example, anxiety and depression; wellbeing and loneliness) are capturing.
3.2. Work-related outcomes
A core aim of Group Work is to help people enter paid employment if they are ready to do so. A secondary aim is to ensure the quality of any work that people take up.
The survey data is used to measure the impact of Group Work against the following work-related outcomes:
- currently being in paid work (currently working for an employer or self-employed or having done paid work within the previous 7 days)
- currently being in paid work of 30 or more hours a week (i.e. in full-time work)
- currently being in paid work that someone is satisfied with (‘very satisfied’ or ‘satisfied’ on a 5-point scale)
- currently earning above or below £10,000 per annum
The impact on receipt of Jobseeker’s Allowance (JSA), Employment Support Allowance (ESA), Universal Credit (UC) or Income Support (IS) is also measured using administrative data, including the amount of these benefits received. Whilst not a measure of entry into work, with several of these benefits payable to those on low incomes, benefit receipt – and the value of those benefits – provide a rough proxy measure of the impact of Group Work in helping people into paid work, or paid work of higher hours or higher levels of pay.
Each of these outcomes were asked at the following time points. Unfortunately, course participants were not asked at the baseline survey whether they were in paid work and, thus, any details about any work they might have been doing at that point. However, eligibility for the course did not exclude benefit claimants in paid work.
Administrative data
| Randomisation | Baseline | 6-months after randomisation | 12-months after randomisation | 6-months after baseline | 12-months after baseline | |
|---|---|---|---|---|---|---|
| Receipt of JSA/UC/ESA/IS | Yes | No | Yes | Yes | No | No |
| Value of JSA/UC/ESA/IS payments | Yes | No | Yes | Yes | No | No |
Survey data
| Randomisation | Baseline | 6-months after randomisation | 12-months after randomisation | 6-months after baseline | 12-months after baseline | |
|---|---|---|---|---|---|---|
| In paid work | No | Decliners and control group only | No | No | Yes | Yes |
| In paid work 30+ hours a week | No | Decliners and control group only | No | No | Yes | Yes |
| In paid work that satisfies | No | Decliners and control group only | No | No | Yes | Yes |
| In paid work earning more or less than £10k pa | No | Decliners and control group only | No | No | Yes | Yes |
3.3. Job search-related outcomes
If someone has not entered employment as a result of attending a Group Work course, a positive outcome would still be evidence that someone is closer to entering work. The evaluation included a range of measures about people’s job search activity and propensity to look for work:
- levels of job search activity are measured using the Finnish Institute of Occupational Health Job Seeking Activity Scale (Revised). This 7-item job search activity scale measures the frequency with which individuals undertake key job search activities, for example contacting employers or searching for job vacancies on the internet. The original version of this measure was developed at the Finnish Institute of Occupational Health (FIOH) (Vuori and Tervahartiala, 1994; Vuori and Vesalainen, 1999) and subsequently modified for use in the UK labour market. Modifications were made by Birkin and Meehan in 2004 and 2016, to include 2 additional items on internet-based job search and followed the format of the existing items. These changes were made following discussion with Professor Jukka Vuori. Survey respondents are given a list of job search activities - including looking for advertised job vacancies both online and at jobcentres or in newspapers and making speculative contacts to employers - and asked to say how often they had done this activity within the past 2 weeks (with response codes ranging from ‘not to all’ (1) to ‘every day’ (4)). Using the mean from the responses from the 7 items, a job search activity scale was created (a continuous variable running from 1 (no job search) to 4 (scoring ‘every day’ on all 7 items). Those scoring 1.01 to 2.29 are coded as ‘lower levels of job search activity’ job search and those scoring 2.3 or more are coded as ‘higher levels of job search activity’ job search. The higher and lower activity categories are derived from the baseline scores of the control group (with high and low split into 2 equally-sized groups), as the control group provides a representative picture of the eligible population. Those working 30 or more hours were not asked these questions, and therefore form a separate category in the outcome measure
- the Job Seeking Activity Scale also asks about number of vacancies applied for and CVs submitted. Respondents are categorised into those who applied for fewer or more than ten vacancies in the past 2 weeks. Likewise, they are categorised into those who submitted fewer or more than ten CVs in the past 2 weeks
- gaining relevant skills or experience is measured by 3 measures: whether someone has (a) attended training or courses; (b) done voluntary work and/or (c) attended work placements in the previous 6 months
Although the Job Seeking Activity Scale was asked at baseline, a large proportion of participants did not provide a response to a number of items on the scale. Therefore, it is not possible to use the baseline data for this variable. As a result, as none of the other variables were asked at the point of randomisation or at baseline, there is no ‘pre-programme’ job search measures.
Each of these outcomes were asked at the following time points:
| Randomisation | Baseline | 6-months | 12-months | |
|---|---|---|---|---|
| Level of job search activity | No | No[footnote 24] | Yes | Yes |
| Vacancies applied for | No | No | Yes | Yes |
| CVs submitted | No | No | Yes | Yes |
| Training or courses | No | No | Yes | Yes |
| Voluntary work | No | No | Yes | Yes |
| Work placements | No | No | Yes | Yes |
In addition, Group Work aspires to increase people’s confidence that they can enter work, and the evaluation therefore includes a number of measures aimed at capturing whether Group Work does have an impact on people’s perceptions that they could enter work:
- general self-efficacy is a broad measure of the strength of an individual’s beliefs that they are effective in handling life situations. The evaluation measured this using the 3 item General Self Efficacy Scale, originally developed for a study exploring whether self-efficacy predicts return to work following sickness absence (Labriola et al., 2007). Survey respondents are asked to score themselves using a 5-point scale from ‘always’ to ‘never’ on 3 statements about their confidence in dealing with situations and solving problems. A mean score is calculated across the 3 items, where 1 denotes high self-efficacy and 5 denotes low self-efficacy. The scores are also grouped into ‘higher self-efficacy (less than 2.34) or lower self-efficacy (2.34 or more). As with the job search activity scale, the high and low self-efficacy categories are derived from the baseline scores of the control group (with ‘high’ and ‘low’ split into 2 equally-sized groups)
- the Job Search Self Efficacy (JSSE) Index (Modified) is a 9-item measure of the strength of an individual’s belief that they have the skills to undertake a range of job search tasks. The JSSE gathers information about a key predictor of job search behaviours (Eden and Aviram, 1993; Kanfer and Hulin, 1985; Saks and Ashforth, 1999). It has been argued that job search self-efficacy is an important motivational factor which facilitates appropriate job search behaviour as well as providing a buffer against the deleterious effects of unemployment. The original 6-item JSSE Index was developed at the University of Michigan (Vinokur et al., 1995). This was subsequently modified for use in the UK labour market by Birkin and Meehan in 2014, following discussion with Professor Richard H Price. Three new items were added to address using IT for job search and work. For each of the nine items – including writing a good application/CV and making a good impression - survey respondents were asked to rate their confidence using a 5-point scale from ‘not at all’ to ‘a great deal’
For each of the sub-scales, responses are coded from 1 (low self-efficacy) to 5 (high self-efficacy). Using the mean from the responses from the nine items, a continuous job search self-efficacy scale was created from 1 to 5. Those scoring between 1 and 3.78 are coded as ‘lower job search self-efficacy’ (around 50% of the control group at baseline, as the control group provides a representative picture of the eligible population), with a higher score coded as ‘higher job search self-efficacy’. The impact of Group Work was measured by comparing both the mean scores and the proportions scoring as having ‘higher job search self-efficacy’ of the Group Work and control groups.
- confidence in finding a job was measured with the question:
Which of the following statements best describes your confidence in getting a job within 13 weeks?
- certain that I will find a job
- likely that I will find a job
- likely that I won’t find a job
- certain that I won’t find a job
Confidence is measured as proportion who described their confidence as ‘certain’ or ‘likely that I will find a job’.
- someone’s perceived ability to influence their propensity to find work was measured with the question:
In your opinion, which of the following plays the greatest role in securing a job placement?
- luck
- who you know
- your educational background
- your previous work experience
- the number of jobs you apply for
- effort put into each application
Survey respondents were asked to pick one response. In the analysis, these responses are grouped into ‘job search effort’ (number of applications and effort put into each), ‘fixed effects (education, experience)’ and ‘things outside my control (who you know or luck)’.
Linked to this outcome, the following 2 questions were also asked using a 5-point scale:
For the following statements, please say how much you agree or disagree with the statement
- my personal qualities make it easy to get a new job
- my experience is in demand in the labour market
The impact of Group Work is measured by comparing the proportion who ‘strongly agree’ or ‘agree’ with each statement.
Each of these outcomes were asked at the following time points:
| Randomisation | Baseline | 6-months | 12-months | |
|---|---|---|---|---|
| General self-efficacy | No | Yes | Yes | Yes |
| Job search self-efficacy | No | Yes | Yes | Yes |
| Confidence in finding work | Yes | No | Yes | Yes |
| Factors affecting success | Yes | No | Yes | Yes |
| Personal qualities | Yes | No | Yes | Yes |
| Experience | Yes | No | Yes | Yes |
3.4. Well-being outcomes and the latent and manifest benefits of work
In addition to examining whether Group Work helps people into work, or move them towards employment, the evaluation also looked at whether it increased people’s well-being. The evaluation measured the impact of the Group Work on:
- the ONS4 Well-being questions which asks individuals to rate themselves on a scale of 0 to 10 to 4 items related to their well-being and life satisfaction (Office for National Statistics, 2019):
For the next questions, please give me an answer on a scale of zero to ten, where zero is not at all and ten is completely
- overall, how satisfied are you with your life nowadays?
- overall to what extent do you feel the things you do in your life are worthwhile?
- overall how happy did you feel yesterday?
- overall, how anxious did you feel yesterday?
The impact of Group Work is measured by comparing the mean score of each item for the Group Work and control groups as well as the proportions scoring as ‘high’ (a score of 7 or more on satisfaction, feeling worthwhile and happiness, and 6 or more for anxiety). For the first 3 items, ‘high’ is a positive outcome, while for anxiety it is negative.
- loneliness was measured by the UCLA Loneliness Scale (Hughes et al., 2004), which comprises 3 questions that measure 3 dimensions of loneliness: relational connectedness, social connectedness and self-perceived isolation. This is a long-standing measure of loneliness, more recently adopted by the ONS as part of their recommended suite of 4 loneliness measures (in addition to an overall measure of loneliness). The questions are:
The next questions are about how you feel about different aspects of your life. For each one, tell me whether it is something you feel hardly ever, some of the time or often
- how often do you feel that you lack companionship?
- how often do you feel left out?
- how often do you feel isolated from others?
The scale uses 3 response categories: ‘hardly ever’ (1), ‘some of the time’ (2) and ‘often’ (3). Added together, the items form a scale where a higher score denotes greater loneliness and score of 6 or more is taken to be a measure of ‘lonely’. Both the mean scores and the proportion who are lonely are reported.
- the Latent And Manifest Benefits (LAMB) scale (Mueller et al., 2005) measures the perceived benefits of employment to individuals. It draws on literature about paid employment fulfilling a range of psychological needs above and beyond one’s need for material security, including time structure, personal identity and social activity (Jahoda, 1981). The inclusion of the LAMB scale in the evaluation allows for the measurement of the impact of Group Work on the extent to which participants perceive their psychosocial environment (such as social support, activity, time structure and routine), regardless of their employment status at 6 and 12 months. The 12-item LAMB scale was created using the questions/variables with the highest factor loadings from an original 18-item version trialled in Germany (Kovacs et al., 2019). Individuals answer the statements using a 6-point Likert scale of 0 to 5, where 0 means strongly disagree and 5 means strongly agree. The statements capture how people feel about their daily life (whether they have enough to do, feel like they contribute to society, etc.) and the extent to which their income constrains what they can do. A total score is achieved by adding up scores across all 12 items with a maximum score of 60. The impact analysis uses both the mean score and comparison across a categorical variable where the scale is split into quartiles (0 to 14; 15 to 29; 30 to 44; 45 to 60). In addition, the items can be used to create 2 sub-scales measuring an individual’s levels of psychosocial deprivation (the psychological effects of not being in employment) and financial strain. A score of 0 to 19 indicates low psychosocial deprivation, 20 to 34 is medium, 35 to 50 is high. A score of 0 to 3 indicates low financial strain, 4 to 7 is medium, and 8 to 10 is higher. Both the mean score and the groupings of the overall scale and the 2 sub-groups are used to measure the impact of Group Work
| Randomisation | Baseline | 6-months | 12-months | |
|---|---|---|---|---|
| Self-efficacy | No | Yes | Yes | Yes |
| ONS wellbeing | Yes | Yes | Yes | Yes |
| UCLA loneliness | No | Yes | Yes | Yes |
| LAMB scale[footnote 25] | No | Yes | Yes | Yes |
3.5. Mental health outcomes
The evaluation also looked at whether Group Work had a beneficial effect on participants’ mental health, and the evaluation measured this using 3 standardised measures:
- the World Health Organisation-Five Well-being Index (WHO-5) is a 5 item unidimensional measure of wellbeing with a good research pedigree. It was developed and published by the World Health Organisation in 1998 and can also be used to indicate likely depression. Individuals are asked to consider how often in the previous 2 weeks they have experienced particular feelings (for example, feeling calm, feeling cheerful, feeling active) using a scale from ‘no time’ to ‘all of the time’. A score of 0 to 25 is derived by looking at responses across all statements. The impact of Group Work is measured comparing the mean scores of the Group Work and control groups where a higher score denotes better wellbeing. The scores are also grouped into ‘good wellbeing’ (13 to 25), ‘poor wellbeing’ (9 to 12) and ‘likely depressed’ (0 to 8). Lastly, in line with WHO-5 recommendations, to provide a binary measure, people are divided into those with ‘poor wellbeing or likely depression’ and those with ‘good wellbeing’
- the PHQ-9 (Patient Health Questionnaire) is a nine-item scale designed to facilitate the recognition of depression. Individuals answer nine statements about the last 2 weeks using a scale of 0 to 3, where 0 denotes ‘not at all’, 1 ‘several days’, 2 ‘more than half the days’ and 3 ‘nearly every day’. The statements cover issues such as feeling down and depressed, sleeping problems and concentration issues. An overall score ranging from 0 to 27 is derived from adding up the scores across all nine items, with a higher score indicating a greater level of depression. The scores are also grouped into ‘no depression’ (0 to 4), mild depression (5 to 9), moderate depression (10 to 14), moderately severe depression (15 to 19) and severe depression (20 to 27). The analysis compares the mean scores of the Group Work and control groups along with the proportion of people in each category. It also looks at the proportion of respondents whose score suggests ‘caseness’ (a score of 10 or more) – that is, the threshold used by Improved Access to Psychological Therapies (IAPT) to suggest that the person probably would receive a diagnosis of depression[footnote 26]
Both the WHO-5 and the PHQ-9 have been shown to be valid and reliable screening tools for depression (Levis, Benedetti and Thombs, 2019). One difference between the 2 measures is that the shorter WHO-5 has items all of which are phrased positively or neutrally, in contrast to the PHQ-9 which presents problems (with negative phrasings or connotations) which an individual may have encountered. This may influence how individuals engage with and respond to the items, with some research (Henkel et al., 2003) suggesting that the WHO-5 is a better screening tool for depression in primary care settings. This point is relevant to the interpretation of the impact findings presented in Chapters 5 and 6.
- the GAD-7 (General Anxiety Disorder) scale is a 7-item scale designed primarily as a measure for generalised anxiety. Individuals answer 7 statements about the last 2 weeks using a scale of 0 to 3, where 0 denotes ‘not at all’, 1 ‘several days’, 2 ‘more than half the days’ and 3 ‘nearly every day’. The statements cover issues such as high levels of worry, anxiety and restlessness. An overall score ranging from 0 and 21 is derived from adding up the scores across all 7 items, with a higher score indicating a greater level of anxiety. The scores are also grouped into ‘no anxiety’ (0 to 4), mild anxiety (5 to 9), moderate anxiety (10 to 14), severe anxiety (15 to 21). The analysis compares the mean score of the Group Work and control groups and the proportion of people in each category. It also looks at the proportion of respondents whose score suggests ‘caseness’ – that is a threshold (a score of eight or more) used by IAPT to suggest the person would probably be diagnosed with anxiety[footnote 27]
Each of these outcomes was asked at the following time points:
| Randomisation | Baseline | 6-months | 12-months | |
|---|---|---|---|---|
| WHO-5 | No | Yes | Yes | Yes |
| PHQ-9 | No | Yes | Yes | Yes |
| GAD-7 | No | Yes | Yes | Yes |
3.6. Wider health outcomes
In addition to the mental health outcomes described in Section 3.5, the evaluation measured the impact of Group Work on people’s overall health, measured via the EQ-5D (EuroQol Group, 1990) and use of health services during the past 3 months:
- the EQ-5D-3L is a standardised measure of health status. It comprises 5 questions, each of which asks about a different aspect of someone’s health (mobility, self-care, performing usual activities, pain and discomfort, and anxiety and depression). Focusing on how they feel today, people are asked to use a 3-point scale to rate themselves as having no problems (1) some problems (2) or extreme problems (3). Responses to the 5 questions can be aggregated to provide an overall health score from 1 to 3, where a lower score denotes better health. The reporting focuses on a derived valuation score that reflects an individual’s health-related quality of life (Dolan, 1997) , with a lower score indicating a lower quality of life
- the EQ-5D also includes the EQVAS which asks people to rate from 0 to 100 how good or bad they perceive their health to be on that day, with 0 denoting the worst health they can imagine and 100 denoting the best imaginable health
- visits to GP in the last 2 weeks and use of Casualty and outpatient services in the past 3 months are also used as measures of overall health, as well as a measure of impact on health service usage
Each of these outcomes were asked at the following time points:
| Randomisation | Baseline | 6-months | 12-months | |
|---|---|---|---|---|
| EQ-5D | No | Yes | Yes | Yes |
| EQVAS thermometer | No | Yes | Yes | Yes |
| GP, Casualty and outpatient visits | Yes | No | Yes | Yes |
4. The trial population
4.1. Overview
The data collected at randomisation and baseline gives rich information on the profile of those entering the trial, and the characteristics of course participants relative to decliners. This chapter describes:
- the characteristics of all those randomised
- the characteristics of course participants
- how the participation rate varies across groups
Although it would be of value to compare the profile of those on the trial to the profile of the general population of working age, for most of the baseline outcomes data on the general population of working age are not easy to find.
There is evidence of differential take-up of Group Work across a range of characteristics, with take-up amongst those allocated to the Group Work arm of the trial being higher than average amongst men, those who were older, those out of work for more than a year, those with low general self-efficacy or low job search self-efficacy, those with lower life satisfaction scores and feelings of life being worthwhile, and lower levels of depression.[footnote 28]
4.1.1. Demographic profile of the trial population
Table 4.1 shows the profile of the trial participants[footnote 29] in terms of their gender, age, ethnic group, qualifications, and whether they had achieved a Grade C or above for both English and Maths at GCSE (or equivalent). The first column of data gives the profile for all those randomised, the second column gives the profile for participants. The third column of data gives the estimated take-up rate of Group Work across the profile categories[footnote 30], and, finally, the fourth column of data includes a p-value for a statistical test of whether the take-up rate differs across the categories. Where there is a statistically significant difference the p-value has been highlighted in red and with an asterisk. See Section 2.5 for more detail.
A low take-up for a particular group may reflect 2 things. It may suggest that Group Work is less attractive to that group. However, for groups who are closest to the labour market, a low take-up might partially be attributed to a proportion of that group having moved into work prior to the course start date. The data available do not allow for the distinction between the 2 explanations to be made.
Overall:
- over half of the trial population were male (58% of those randomised; 63% of course participants). The take-up rate was statistically significantly higher for men than for women (23% compared to 20%)
- 63% of those randomised and 74% of course participants were over the age of 35. The take-up rate increased with age, from a very low 13% take-up for those aged 16 to 24 to a 28% take-up rate for those aged 50 to 59
- just under a third of those randomised (30%) had no formal qualifications and 41% had at least a Grade C in both English and Maths at GCSE, but 18% had a professional qualification or a degree. There is no evidence of differential course take-up by qualification
- 91% of all those randomised were white. Take-up of Group Work was higher for mixed race, Black and Asian trial participants than for White (at 35%for mixed race, 38% for Black, 26% for Asian, but just 22% for White trial participants)
Table 4.1: Demographic profile of the Group Work trial population
| All randomised (percentage) | Course participants (percentage) | Take-up rate amongst those allocated to GW arm (percentage) | p-value for differences in take-up rate | |
|---|---|---|---|---|
| Gender1 | <0.001* | |||
| Male | 58 | 63 | 23 | |
| Female | 42 | 37 | 20 | |
| Age1 | <0.001* | |||
| 16-24 | 14 | 9 | 13 | |
| 25-34 | 23 | 18 | 17 | |
| 35-49 | 33 | 34 | 23 | |
| 50-59 | 24 | 32 | 28 | |
| 60-65 | 6 | 8 | 27 | |
| Qualifications1 | 0.166 | |||
| Professional/work related | 11 | 10 | 21 | |
| University degree/tertiary qualification | 7 | 7 | 23 | |
| Diploma in higher education | 8 | 7 | 19 | |
| A/AS level/Scottish highers | 7 | 7 | 23 | |
| GCSE/Scottish Standard | 32 | 33 | 22 | |
| None of the above | 30 | 31 | 22 | |
| Not answered | 5 | 5 | 18 | |
| Achieved grade C or above for both English and Maths GCSE1 | 0.825 | |||
| Yes | 41 | 41 | 22 | |
| No | 52 | 52 | 22 | |
| Not answered | 7 | 7 | 22 | |
| Ethnic group2 | 0.017* | |||
| White | 91 | 89 | 21 | |
| Mixed | 2 | 3 | 35 | |
| Black | 3 | 4 | 38 | |
| Asian | 3 | 3 | 26 | |
| Other ethnic group | 1 | 1 | 15 | |
| Base: randomisation tool | 16,193 | 2,596 | ||
| Base: baseline survey | 2,029 | 609 |
Source1: Randomisation survey
Source2: Baseline survey
4.1.2. Benefit receipt profile of the trial population
Table 4.2 shows the profile of the trial population and Group Work participants in terms of whether they were in receipt of particular benefits at randomisation, the length of time spent on benefits in the 3 years up to randomisation and the time since last in paid work. The list of benefits is restricted to those within the Department for Work and Pensions (DWP) administrative dataset attached to the trial data and is not a comprehensive list of all benefits[footnote 31].
Almost three-quarters of those randomised (74%) were in receipt of Jobseeker’s Allowance (JSA) at that point in time, and 12% were in receipt of Universal Credit (UC). The percentages for all other benefits were less than 10%.
Take-up of Group Work was also low for those in receipt of Employment Support Allowance (ESA) (11%), Carers Allowance (CA) (9%), and Income Support (IS) (7%).
The trial population varied quite considerably in terms of the length of time on benefits and the time since last in work, with 13% having been on benefits for less than a month and 28% having been on benefits for over 2 years. Take-up of Group Work was higher than average for those on benefits for more than 2 years (at 28%) or not in work in the last 2 years (31%).
Half (53%) of those randomised had never been in paid work, with a further 15% not having worked in the previous 2 years. One in 10 (10%) had been in work within the previous 6 months. The profile of those who took up the course was very similar, with half (51%) of participants never having worked and 9% having worked in the previous 6 months.
Table 4.2: Benefit receipt of the Group Work trial population at randomisation and benefit/work history
| All randomised (percentage) | Course participants (percentage) | Take-up rate amongst those allocated to GW arm (percentage) | p-value for differences in take-up rate | |
|---|---|---|---|---|
| Benefit receipt at randomisation1 | ||||
| Disability Living Allowance: | 0.807 | |||
| In receipt | 5 | 4 | 21 | |
| Not in receipt | 95 | 96 | 22 | |
| Employment Support Allowance: | <0.001* | |||
| In receipt | 8 | 4 | 11 | |
| Not in receipt | 92 | 96 | 23 | |
| Carer’s Allowance: | <0.001* | |||
| In receipt | 2 | 1 | 9 | |
| Not in receipt | 98 | 99 | 22 | |
| Income Support: | <0.001* | |||
| In receipt | 4 | 1 | 7 | |
| Not in receipt | 96 | 99 | 22 | |
| Job-seekers Allowance: | <0.001* | |||
| In receipt | 74 | 82 | 24 | |
| Not in receipt | 26 | 18 | 15 | |
| Universal Credit: | 0.845 | |||
| In receipt | 12 | 12 | 22 | |
| Not in receipt | 88 | 88 | 22 | |
| Length of time on benefits in the 3 years prior to randomisation1 | <0.001* | |||
| Up to 7 days | 6 | 4 | 14 | |
| 8 to 31 days | 7 | 6 | 18 | |
| 1 to 6 months | 28 | 24 | 18 | |
| 6 to 12 months | 16 | 15 | 21 | |
| One to 2 years | 15 | 16 | 23 | |
| Over 2 years | 28 | 35 | 28 | |
| When last in work2 | <0.001* | |||
| In the 6 months before randomisation | 10 | 9 | 20 | |
| 6 to 12 months ago | 6 | 7 | 25 | |
| 1 to 2 years ago | 5 | 7 | 30 | |
| More than 2 years ago | 15 | 21 | 31 | |
| Can’t remember | 12 | 5 | 10 | |
| Never in paid work | 53 | 51 | 21 | |
| Base: adminstrative data | 16,193 | 2,596 | ||
| Base: baseline survey | 2,029 | 609 |
Source1: DWP administrative data
Source2: Baseline survey
4.1.3. The profile of the trial population in terms of self-efficacy and job search confidence
As noted in Section 3.3, the general self-efficacy and job search self-efficacy scales have been divided into 2 groups (high and low) in such a way that around half of those randomised fall into each group.
Take-up of Group Work was higher than average (at 27%) for those with lower general self-efficacy. Similarly, take-up was higher than average (at 30% for those with lower job search self-efficacy. There is, however, no statistically significant difference in take-up between those expressing confidence they would find a job in the next 13 weeks and those not confident.
Table 4.3: Self-efficacy/job search confidence of the Group Work trial population at randomisation or baseline
| All randomised (percentage) | Course participants (percentage) | Take-up rate amongst those allocated to GW arm (percentage) | p-value for differences in take-up rate | |
|---|---|---|---|---|
| General self-efficacy scale2 | <0.001* | |||
| Higher self-efficacy | 54 | 42 | 17 | |
| Lower self-efficacy | 46 | 58 | 27 | |
| Job search self-efficacy scale2 | <0.001* | |||
| Higher job search self-efficacy | 49 | 31 | 14 | |
| Lower job search self-efficacy | 51 | 69 | 30 | |
| Confidence in finding job1 | 0.103 | |||
| Confident will find a job | 55 | 51 | 20 | |
| Not confident will find a job | 45 | 49 | 24 | |
| Base: randomisation tool | 16,193 | 2,596 | ||
| Base: baseline survey | 2,029 | 609 |
Source1: Randomisation survey
Source2: Baseline survey
4.1.4. The profile of the trial population in terms of wellbeing and latent and manifest benefits
Table 4.4 profiles those randomised on the ONS subjective wellbeing scales and the Latent and Manifest Benefits (LAMB) scales.
Across these wellbeing measures, there is quite a complex picture in relation to the profile of those recruited into the trial and those who took up the offer of the course. (There is a clearer picture in terms of mental health, reported in Section 4.1.5). The take-up of Group Work was lower amongst those citing higher anxiety levels on the ONS measure (22% compared to 23%). However, the reverse was true with take up across the ONS measures of life satisfaction and feeling life is worthwhile: those scoring as having lower levels of life satisfaction (23%compared to 20%) and those less likely to feel life is worthwhile more likely to take up the course (23% compared to 22%).
The LAMB scales show an interesting pattern to take-up. Those scoring either low or high on the overall scale had lower rates of take-up than those scoring in the middle of the range (6% for those scoring 0-14, 11% for those scoring 45 to 60, and 23% for those scoring 15-44). The explanation for this is not entirely clear, but it is plausible that a proportion of those with a low score (i.e. score as having better perceptions of the benefits of paid work) may have entered work quickly, and so not entered the course, whereas those with a particularly high score (i.e. worse perceptions) may not have been convinced of the value of participation. This chimes with findings from the process evaluation (Knight et al., 2020a), which found that amongst the participants interviewed for the qualitative process evaluation those closer to the labour market, not perceiving themselves to be struggling with their job search, and who considered their physical and mental health challenges to be too great, were less likely to find the course helpful.
Table 4.4: Wellbeing and latent and manifest benefits of the Group Work trial population at randomisation or baseline
| All randomised (percentage) | Course participants (percentage) | Take-up rate amongst those allocated to GW arm (percentage) | p-value for differences in take-up rate | |
|---|---|---|---|---|
| ONS well-being measures1 | ||||
| Satisfaction: | 0.002* | |||
| Satisfied with life | 32 | 30 | 20 | |
| Other | 68 | 70 | 23 | |
| Life worthwhile: | 0.030* | |||
| Thinking life worthwhile | 44 | 42 | 21 | |
| Other | 56 | 58 | 23 | |
| Happiness: | 0.114 | |||
| Happy | 41 | 40 | 21 | |
| Other | 59 | 60 | 22 | |
| Anxiety: | 0.046* | |||
| Anxious | 30 | 29 | 21 | |
| Other | 70 | 71 | 23 | |
| Overall LAMB scale2 | <0.001* | |||
| Score 0-14 | 10 | 3 | 6 | |
| Score 15 to 29 | 32 | 39 | 23 | |
| Score 30 to 44 | 45 | 52 | 23 | |
| Score 45 to 60 | 13 | 7 | 11 | |
| LAMB psychosocial2 | <0.001* | |||
| Low | 32 | 27 | 17 | |
| Medium | 48 | 59 | 24 | |
| High | 20 | 14 | 15 | |
| LAMB financial strain2 | 0.005* | |||
| Low | 19 | 14 | 16 | |
| Medium | 35 | 41 | 25 | |
| High | 47 | 44 | 20 | |
| Base: randomisation tool | 16,193 | 2,596 | ||
| Base: survey | 2,029 | 609 |
Source1: Randomisation survey
Source2: Baseline survey
4.1.5. The mental health profile of the trial population
Finally, Table 4.5 gives the profile of those randomised and those participating in Group Work in terms of the 3 mental health outcomes: the WHO-5 well-being scale, the PHQ-9 depression scale and the GAD-7 anxiety scale. These measures suggest that those entering the trial had relatively poor mental health at randomisation, with the WHO-5 wellbeing scale suggesting that 60% had likely depression/poor wellbeing, 46% having a depression score which suggests caseness as measured by the PHQ-9 and 51% having anxiety suggesting caseness as measured by the GAD-7.
The profile of those taking up Group Work is somewhat more complex. Those with likely depression/poor wellbeing on the WHO-5 scale were less likely than those lower levels of depression/higher wellbeing (20% compared to 24%) to attend the course. However, there is no evidence of differential take-up of the course based either on trial participants’ PHQ-9 depression score or on their GAD-7 anxiety score.
Table 4.5: Mental health of the Group Work trial population at baseline
| All randomised (percentage) | Participants (percentage) | Take-up rate amongst those allocated to GW arm (percentage) | p-value for differences in take-up rate | |
|---|---|---|---|---|
| WHO-5 wellbeing | 0.030* | |||
| With likely depression/poor wellbeing | 60 | 54 | 20 | |
| Other | 41 | 46 | 24 | |
| PHQ-9 depression | 0.972 | |||
| Depression suggesting caseness | 46 | 45 | 22 | |
| Other | 54 | 55 | 22 | |
| GAD-7 anxiety | 0.522 | |||
| Anxiety suggesting caseness | 51 | 49 | 22 | |
| Other | 49 | 51 | 21 | |
| Base: baseline survey | 2,029 | 609 |
Source: Baseline survey
5. Impacts of the offer of Group Work on the trial population (Intention to Treat)
5.1. Overview
As described in Section 1.1, in line with the trial design, the original intention was for the primary measures of the impact of Group Work to be those which compare the 6 and 12 month outcomes of all those offered the course (regardless of take up) with those randomly assigned to the control group who were not offered the course) – an Intention to Treat (ITT) design. The random allocation to the 2 groups (offered Group Work and control) is done to ensure that, when the outcomes for these 2 groups are compared, any statistically significant differences can reasonably be attributed to Group Work.[footnote 32] However, with only one in 5 (22%) of those randomised into the ‘offered Group Work’ arm of the trial attending the course the differences in outcomes will tend to be small in an ITT analysis – thereby severely reducing the ability to detect a significant impact among all those randomised (see Section 6.1). It was therefore decided that the primary measures of impact should be those which compare the outcomes of those participating in Group Work against those of a matched comparison group – described in this report as an Impact on Participants (IoP) design.
Nonetheless, in line with the original trial design, the ITT estimates of impact are reported in this Chapter. The following sections describe the ITT impact assessment methodology (Section 5.2) and present the estimates of impact at 6 and 12 months (Section 5.3). The Chapter does not include much commentary about these findings, bar highlighting the outcomes for which there are statistically significant impacts or patterns that were close to being statistically significant. More commentary is provided on the IoP results, including on particular population sub-groups, in Chapters 6 and 7. Separate Chapters on the ITT and IoP analysis have been provided for clarity and ease of identifying the relevant impact estimates.
Overall, when looking at the impacts on all those offered the course (the ITT analysis), statistically significant positive impacts are detected on a small number of mental health, wellbeing and self-efficacy measures after 6 months, although these statistically significant impacts are no longer in evidence after 12 months. There is no statistically significant evidence from the ITT analysis that Group Work impacts on entry into work or on job search activity.
5.2. The Intention to Treat (ITT) analysis
In the ITT analysis, outcomes for all those randomly assigned to the offered Group Work group are compared to outcomes for those randomly assigned to the control group. The offered Group Work group includes both course participants and those who declined. With a participation rate of 22% the decliners make up the large majority of the offered Group Work group. Given the low take up rate, unless the impact on participants is very large, the ITT estimates of impact can be expected to be small to moderate at best.
In the reporting in this Chapter, if the difference between the outcome measures in the 2 arms at 6 or 12 months is statistically significant (at the 5% level of significance), this is taken as evidence of Group Work having an impact. This is a relatively simple test and is only valid if the 2 arms are balanced. That is, the 2 arms must be very similar in terms of their profile and baseline/randomisation outcomes. In practice this is the case. Appendix C sets out the evidence for balance.
5.3. Table format, statistical tests and p-values
Tables 5.1 to 5.8 present the ITT impact results. Divided into broad outcome domains, each table has the same format. Each table presents the results for each outcome at baseline[footnote 33] or randomisation, 6 months after baseline and 12 months after baseline. Where available, randomisation data are reported, as this provides the most accurate measure of outcomes prior to being offered the course, collected at precisely the same time point for both arms of the trial. Where the outcome measure was not collected at the point of randomisation (which is the case for the majority of outcomes) the baseline outcome is reported, with each table making clear which data wave are reported. Whilst the tables present the randomisation and baseline outcomes for all those completing the 6-month survey, the results are very similar for those completing the 12-month survey. For each survey wave, the percentage or mean score is shown for those in the offered Group Work group and for those in the control group.
Again at each wave, the tables show for each outcome the p-value significance level of the difference between the offered Group Work and control groups. Where the differences between the 2 groups are statistically significant (that is the p-value is less than 0.05), these are highlighted in red and with an asterisk. The term ‘statistically significant’ is often abbreviated in the text to ‘significant’. The text also includes discussion of impacts which are close to statistical significance using, as a rule of thumb, a p-value of less than 0.10.
P-values are dependent on sample size. For any given observed difference, the smaller the sample size the larger the p-value. Because the survey sample size is larger at 6 months than at 12 months, the impacts have to be slightly larger at 12 months to reach significance. As a very crude rule of thumb, for outcomes presented as percentages that are around the 50% mark, the difference between the 2 arms of the trial has to be around 5 percentage points to reach significance, whereas at 12 months the difference has to be around 7 percentage points.
The unweighted sample sizes are cited at the end of each table.
For more information on the outcome measures and the derivation of the categories, see Chapter 3.
5.4. Findings from the Intention-to-Treat analysis
The tables in this Chapter split the outcomes into broad domains:
- work-related outcomes, including benefit receipt using administrative data (Tables 5.1 and 5.2)
- job search related outcomes (Tables 5.3 and 5.4)
- wellbeing outcomes and latent and manifest benefits of work (Tables 5.5 and 5.6)
- mental health outcomes (Table 5.7)
- wider health outcomes (Table 5.8)
5.4.1. Work-related outcomes
In the ITT analysis (comparing all those offered Group Work with those in the control group), there are no statistically significant impacts either 6 or 12 months after baseline on being in work (including full-time work); being in work earning £10,000 a year or more; or being in a paid job that they are satisfied with (Table 5.1).
Table 5.1: Impact of Group Work on work outcomes: intention to treat analysis
At baseline:
| Offered GW (percentage) | Control group (percentage) | p-value | ||
|---|---|---|---|---|
| Working status[footnote 34] | ||||
| In paid work | .. | 19 | ||
| In paid work 30+ hours a week[footnote 35] | .. | 9 | ||
| Earnings | ||||
| In paid work earning £10k pa or more | .. | .. | ||
| In paid work earning less than £10k pa | .. | .. | ||
| In paid work, earnings not given | .. | .. | ||
| Not in paid work | .. | .. | ||
| Job satisfaction[footnote 36] | ||||
| In paid work that satisfies me | .. | .. | ||
| In paid work that does not satisfy me | .. | .. | ||
| Not in paid work | .. | .. | ||
| Base: all | 1496 | 533 |
At 6-month follow-up:
| Offered GW (percentage) | Control group (percentage) | p-value | ||
|---|---|---|---|---|
| Working status[footnote 34] | ||||
| In paid work | 28 | 26 | 0.604 | |
| In paid work 30+ hours a week[footnote 35]] | 13 | 13 | 0.834 | |
| Earnings | 0.663 | |||
| In paid work earning £10k pa or more | 14 | 13 | ||
| In paid work earning less than £10k pa | 9 | 10 | ||
| In paid work, earnings not given | 5 | 4 | ||
| Not in paid work | 72 | 74 | ||
| Job satisfaction[footnote 36] | 0.072 | |||
| In paid work that satisfies me | 19 | 21 | ||
| In paid work that does not satisfy me | 9 | 5 | ||
| Not in paid work | 73 | 74 | ||
| Base: all | 1496 | 533 |
At 12-month follow-up:
| Offered GW (percentage) | Control group (percentage) | p-value | ||
|---|---|---|---|---|
| Working status[footnote 34] | ||||
| In paid work | 30 | 26 | 0.212 | |
| In paid work 30+ hours a week[footnote 35] | 15 | 13 | 0.3 | |
| Earnings | 0.52 | |||
| In paid work earning £10k pa or more | 19 | 15 | ||
| In paid work earning less than £10k pa | 10 | 9 | ||
| In paid work, earnings not given | 2 | 2 | ||
| Not in paid work | 70 | 74 | ||
| Job satisfaction[footnote 36] | 0.221 | |||
| In paid work that satisfies me | 22 | 17 | ||
| In paid work that does not satisfy me | 9 | 10 | ||
| Not in paid work | 70 | 74 | ||
| Base: all | 1090 | 362 |
Source: Survey data
Moreover, there are no significant impacts of Group Work using administrative data to look at receipt of Jobseeker’s Allowance (JSA), Employment Support Allowance (ESA), Universal Credit (UC) or Income Support (IS), or at the amount of benefit received 6 or 12 months after randomisation[footnote 37] (Table 5.2).
Table 5.2: Impact of Group Work on benefit receipt: intention to treat analysis
At randomisation:
| Offered GW group (percentage) | Control group (percentage) | p-value | |
|---|---|---|---|
| In receipt of: | |||
| Universal Credit, Jobseeker’s Allowance, Employment Support Allowance or Income Support | 98 | 98 | 0.229 |
| Mean amount per week (£) | 81.9 (sd 36.3) | 81.8 (sd 36.2) | 0.826 |
| Base: | 11,900 | 4,293 |
At 6-months:
| Offered GW group (percentage) | Control group (percentage) | p-value | |
|---|---|---|---|
| In receipt of: | |||
| Universal Credit, Jobseeker’s Allowance, Employment Support Allowance or Income Support | 78 | 79 | 0.391 |
| Mean amount per week (£) | 70.25 (sd 54.0) | 70.83 (sd 54.0) | 0.547 |
| Base: | 11,900 | 4,293 |
At 12-months:
| Offered GW group (percentage) | Control group (percentage) | p-value | |
|---|---|---|---|
| In receipt of: | |||
| Universal Credit, Jobseeker’s Allowance, Employment Support Allowance or Income Support | 72 | 72 | 0.781 |
| Mean amount per week (£) | 71.47(sd 66.2) | 72.55 (sd 67.3) | 0.359 |
| Base: | 11,900 | 4,293 |
Source: DWP administrative data
5.4.2. Job search-related outcomes
In the ITT analysis, there are no statistically significant impacts of Group Work on the job search activities of those offered Group Work at either 6 or 12 months after baseline. Table 5.3 sets out the findings on job search activity, including the number of vacancies applied for and CVs submitted, as well as the proportion of those attending training or courses or voluntary work or work placements. The only outcome for which there is an impact close to statistical significance (p=0.052) is on having attended a course or undertaken training. Twelve months after baseline, 37% of those in the Group Work arm had done so compared to 30% of those in the control group.
Table 5.3: Impact of Group Work on job search activity outcomes: intention to treat analysis[footnote 38]
At baseline:
| Offered GW (percentage) | Control group (percentage) | p-value | |
|---|---|---|---|
| Job search activity scale[footnote 39] | |||
| In paid work 30 hours or more | .. | .. | |
| Higher levels | .. | .. | |
| Lower levels | .. | .. | |
| No job search | .. | .. | |
| Number of vacancies applied for | |||
| In paid work 30 hours or more | .. | .. | |
| Ten or more | .. | .. | |
| Fewer than 10 | .. | .. | |
| None | |||
| Number of CVs submitted | |||
| In paid work 30 hours or more | .. | .. | |
| Ten or more | .. | .. | |
| Fewer than 10 | .. | .. | |
| None | |||
| Gaining experience | |||
| Attended training/courses | .. | .. | |
| Voluntary work | .. | .. | |
| Work placements | .. | .. | |
| Base: all | 1496 | 533 |
At 6-month follow-up:
| Offered GW (percentage) | Control group (percentage) | p-value | |
|---|---|---|---|
| Job search activity scale[footnote 39] | 0.985 | ||
| In paid work 30 hours or more | 13 | 13 | |
| Higher levels | 33 | 34 | |
| Lower levels | 34 | 34 | |
| No job search | 20 | 20 | |
| Number of vacancies applied for | 0.985 | ||
| In paid work 30 hours or more | 13 | 13 | |
| Ten or more | 28 | 28 | |
| Fewer than 10 | 25 | 25 | |
| None | 33 | 34 | |
| Number of CVs submitted | 0.851 | ||
| In paid work 30 hours or more | 13 | 13 | |
| Ten or more | 19 | 17 | |
| Fewer than 10 | 25 | 27 | |
| None | 43 | 43 | |
| Gaining experience | |||
| Attended training/courses | 37 | 36 | 0.969 |
| Voluntary work | 20 | 21 | 0.82 |
| Work placements | 9 | 10 | 0.418 |
| Base: all | 1496 | 533 |
At 12-month follow-up:
| Offered GW (percentage) | Control group (percentage) | p-value | |
|---|---|---|---|
| Job search activity scale[footnote 39] | 0.113 | ||
| In paid work 30 hours or more | 16 | 13 | |
| Higher levels | 25 | 33 | |
| Lower levels | 36 | 33 | |
| No job search | 23 | 22 | |
| Number of vacancies applied for | 0.566 | ||
| In paid work 30 hours or more | 15 | 13 | |
| Ten or more | 26 | 30 | |
| Fewer than 10 | 20 | 21 | |
| None | 38 | 36 | |
| Number of CVs submitted | 0.464 | ||
| In paid work 30 hours or more | 15 | 13 | |
| Ten or more | 18 | 21 | |
| Fewer than 10 | 20 | 21 | |
| None | 47 | 45 | |
| Gaining experience | |||
| Attended training/courses | 37 | 30 | 0.052 |
| Voluntary work | 20 | 18 | 0.459 |
| Work placements | 8 | 5 | 0.123 |
| Base: all | 1090 | 362 |
Source: Survey data
Looking beyond job search activity to people’s confidence in their ability to find work, there are significant findings 6 months after baseline (Table 5.4). Those offered Group Work were statistically significantly more likely than those in the control group to have higher levels of general self-efficacy (59% compared to 54%) and to agree that ‘my experience is in demand’ (59% compared to 53%). The impact of Group Work on having a higher level of job search self-efficacy at 6 months after baseline was close to statistical significance (p=0.09), with 56% of those in the Group Work arm and 50% of those in the control group scoring as having higher levels of job search efficacy. The differences in the mean scores of the 2 groups is not statistically significant. Neither of the significant impacts are sustained 12 months after baseline, and the job search self-efficacy scores are no longer close to significance. Nor were there significant impacts across a range of other job search confidence questions including the Job Search Self Efficacy (JSSE) Index and confidence in finding work within the next 13 weeks. See Section 3.3 for more detail on these outcome measures.
Table 5.4: Impact of Group Work on self-efficacy/confidence outcomes: intention to treat analysis
At randomisation/baseline:
| Offered GW | Control group | p-value | |
|---|---|---|---|
| General self-efficacy scale (1 to 5)2 | |||
| Mean score (lower score, higher self-efficacy) | 2.5 (sd 0.9) | 2.4 (sd 1.0) | 0.523 |
| Higher self-efficacy | 53% | 56% | 0.296 |
| Lower self-efficacy | 47% | 44% | |
| Job search self-efficacy scale (1 to 5)2 | |||
| 9-item scale | |||
| Mean score (higher score, higher self-efficacy) | 3.6 (sd 1.0) | 3.7 (sd 1.0) | 0.324 |
| Higher job search self-efficacy | 48% | 51% | 0.386 |
| % agree personal qualities will help get work1 | 49% | 50% | 0.767 |
| % agree their experience is in demand1 | 39% | 38% | 0.685 |
| Confidence in finding job1 [footnote 40] | 0.608 | ||
| In work including voluntary work[footnote 41] | .. | .. | |
| Confident will find a job | 55% | 56% | |
| Not confident will find a job | 45% | 44% | |
| Factors affecting job search success1 | 0.935 | ||
| Job search effort | 24% | 24% | |
| Fixed effects | 54% | 53% | |
| Things outside my control | 23% | 24% | |
| Base: all | 1496 | 533 |
At 6-month follow-up:
| Offered GW | Control group | p-value | |
|---|---|---|---|
| General self-efficacy scale (1 to 5)2 | |||
| Mean score (lower score, higher self-efficacy) | 2.4 (sd 0.9) | 2.5 (sd 0.9) | 0.073 |
| Higher self-efficacy | 59% | 54% | 0.041* |
| Lower self-efficacy | 41% | 46% | |
| Job search self-efficacy scale (1 to 5)2 | |||
| 9-item scale | |||
| Mean score (higher score, higher self-efficacy) | 3.7 (sd 1.0) | 3.7 (sd 1.0) | 0.233 |
| Higher job search self-efficacy | 56% | 51% | 0.09 |
| % agree personal qualities will help get work1 | 68% | 66% | 0.52 |
| % agree their experience is in demand1 | 59% | 53% | 0.015* |
| Confidence in finding job1 [footnote 40] | 0.22 | ||
| In work including voluntary work[footnote 41] | 32% | 30% | |
| Confident will find a job | 31% | 28% | |
| Not confident will find a job | 37% | 42% | |
| Factors affecting job search success1 | 0.304 | ||
| Job search effort | 27% | 24% | |
| Fixed effects | 45% | 49% | |
| Things outside my control | 29% | 27% | |
| Base: all | 1496 | 533 |
At 12-month follow-up
| Offered GW | Control group | p-value | |
|---|---|---|---|
| General self-efficacy scale (1 to 5)2 | |||
| Mean score (lower score, higher self-efficacy) | 2.5 (sd 0.9) | 2.4 (sd 0.9) | 0.529 |
| Higher self-efficacy | 54% | 56% | 0.662 |
| Lower self-efficacy | 46% | 44% | |
| Job search self-efficacy scale (1 to 5)2 | |||
| 9-item scale | |||
| Mean score (higher score, higher self-efficacy) | 3.7 (sd 1.0) | 3.6 (sd 1.1) | 0.265 |
| Higher job search self-efficacy | 55 | 54 | 0.617 |
| % agree personal qualities will help get work1 | 69% | 65% | 0.204 |
| % agree their experience is in demand1 | 57% | 60% | 0.318 |
| Confidence in finding job1 [footnote 40] | 0.716 | ||
| In work including voluntary work[footnote 41] | 34% | 31% | |
| Confident will find a job | 27% | 29% | |
| Not confident will find a job | 39% | 40% | |
| Factors affecting job search success1 | 0.284 | ||
| Job search effort | 24% | 27% | |
| Fixed effects | 46% | 48% | |
| Things outside my control | 30% | 25% | |
| Base: all | 1090 | 362 |
Source: Survey data (in the category description 1 denotes the first wave of data comes from the randomisation survey and 2 denotes baseline survey)
5.4.3. Wellbeing outcomes and latent and manifest benefits
In addition to examining whether Group Work helped people into work, or moving them towards paid employment, the evaluation also explored whether Group Work improved people’s well-being. The evaluation included a range of well-being measures described in Section 3.4, the findings from which are presented in Table 5.5. Although, on most 6-month measures, those in the Group Work arm had more positive outcomes than those in the control group, none of the differences are statistically significant.
Table 5.5: Impact of Group Work on wellbeing outcomes: intention to treat analysis
At randomisation/baseline:
| Offered GW | Control group | p-value | |
|---|---|---|---|
| ONS measures (0-10)1 | |||
| Mean scores[footnote 42] | |||
| Life satisfaction | 5.2 (sd 2.4) | 5.3 (sd 2.4) | 0.414 |
| Life worthwhile | 5.8 (sd 2.5) | 5.9 (sd 2.5) | 0.284 |
| Happiness | 5.6 (sd 2.8) | 5.5 (sd 2.9) | 0.994 |
| Anxiety | 3.8 (sd 3.0) | 3.9 (sd 3.2) | 0.672 |
| % satisfied with life | 31 | 32 | 0.574 |
| % thinking life worthwhile | 43 | 43 | 0.948 |
| % happier | 40 | 41 | 0.699 |
| % anxious | 30 | 32 | 0.359 |
| UCLA loneliness measure (3 to 9)2 | |||
| % lonely | 49 | 50 | 0.598 |
| Mean score (higher= lonelier) | 5.5 (sd 2.0) | 5.6 (sd 2.0) | 0.277 |
| Base: all | 1496 | 533 |
At 6-month follow-up:
| Offered GW | Control group | p-value | |
|---|---|---|---|
| ONS measures (0-10)1 | |||
| Mean scores[footnote 42] | |||
| Life satisfaction | 5.8 (sd 2.7) | 5.8 (sd 2.6) | 0.586 |
| Life worthwhile | 6.1 (sd 2.7) | 6.1 (sd 2.7) | 0.786 |
| Happiness | 6 (sd 3.0) | 5.9 (sd 3.0) | 0.341 |
| Anxiety | 3.8 (sd 3.1) | 3.9 (sd 3.1) | 0.696 |
| % satisfied with life | 47 | 45 | 0.385 |
| % thinking life worthwhile | 50 | 49 | 0.686 |
| % happier | 51 | 48 | 0.281 |
| % anxious | 31 | 29 | 0.541 |
| UCLA loneliness measure (3-9)2 | |||
| % lonely | 48 | 52 | 0.55 |
| Mean score (higher= lonelier) | 5.4 (sd 2.1) | 5.5 (sd 2.1) | 0.544 |
| Base: all | 1496 | 533 |
At 12-month follow-up:
| Offered GW | Control group | p-value | |
|---|---|---|---|
| ONS measures (0-10)1 | |||
| Mean scores[footnote 42] | |||
| Life satisfaction | 5.9 (sd 2.7) | 5.9 (sd 2.7) | 0.836 |
| Life worthwhile | 6.1 (sd 2.7) | 6.1 (sd 2.7) | 0.999 |
| Happiness | 6.1 (sd 2.8) | 6 (sd 3.0) | 0.394 |
| Anxiety | 3.9 (sd 3.1) | 3.8 (sd 3.2) | 0.941 |
| % satisfied with life | 47 | 46 | 0.798 |
| % thinking life worthwhile | 51 | 52 | 0.754 |
| % happier | 51 | 50 | 0.803 |
| % anxious | 28 | 28 | 0.922 |
| UCLA loneliness measure (3-9)2 | |||
| % lonely | 48 | 48 | 0.958 |
| Mean score (higher= lonelier) | 5.5 (sd 2.0) | 5.5 (sd 2.1) | 0.98 |
| Base: all | 1090 | 362 |
Source: Survey data (in the category description 1 denotes the first wave of data comes from the randomisation survey and 2 denotes baseline survey)
The Latent and Manifest Benefits (LAMB) scale measures the perceived psychosocial environment, such as social support, time structure, activity and routine, as it proposed that these ‘latent benefits’ are absent during a period of unemployment environment (see Section 3.4). Table 5.6 shows the overall LAMB scores of those in the Group Work and control groups, together with their scores on 2 sub-scales which measure individuals’ levels of psychosocial deprivation and their level of financial strain. There is no statistically significant evidence that Group Work has an impact on people’s overall LAMB score. Moreover, there is a statistically significant negative impact at 6 months among those offered Group Work on the psychosocial deprivation scale when comparing the proportions scoring as low, medium or high. With a lower score denoting lower levels of psychosocial deprivation[footnote 43] (i.e. better), a third (32%) of those offered Group Work compared to 38% in the control group scored low. However, there are no significant differences in the 6 or 12-month mean score, nor at 12 months after baseline across the low, medium and high categories. Conversely, a statistically significant positive impact is detected on levels of financial strain 6 months after baseline, with those in the offered Group Work group having lower levels of financial strain, scoring an average of 6.1 out of 10 compared to 6.4 among the control group[footnote 44]. There are no significant differences across the low, medium and high categories, and the difference in mean score is no longer significant 12 months after baseline.
This pattern of findings is difficult to interpret and, in fact, is different from the IoP findings for this scale reported on later in Section 6.4.3. A comparison across the control group, decliners and course participants, after controlling for baseline differences[footnote 45], suggests that the ITT impacts may be being driven by the decliner group. That is, the decliner group had LAMB scores that are not in line with those for similar people in the control group. In the absence of a hypothesis as to why the decliners have lower levels of financial strain at 6 months than similar people in the control group, the most plausible explanation for the finding is that it is simply a randomly occurring difference in the decliner group survey data that is not attributable to Group Work.
Table 5.6: Impact of Group Work on the Latent and Manifest Benefits scale: intention to treat analysis
At baseline:
| Offered GW | Control group | p-value | |
|---|---|---|---|
| Overall scale (from 0 to 60, lower score better) | |||
| Mean score | 30.8 (sd 11.9) | 31.2 (sd 12.3) | 0.535 |
| Score 0 to 14 | 9% | 11% | 0.095 |
| Score 15 to 29 | 33% | 31% | |
| Score 30 to 44 | 46% | 42% | |
| Score 45 to 60 | 12% | 16% | |
| Psychosocial deprivation scale (from 0 to 50, lower score better) | |||
| Mean score | 24.3 (sd 11.3) | 24.8 (sd 11.8) | 0.457 |
| Low | 32% | 32% | 0.322 |
| Medium | 49% | 45% | |
| High | 19% | 23% | |
| Financial strain score (from 0 to 10, lower score better) | |||
| Mean score | 6.5 (sd 3.2) | 6.5 (sd 3.3) | 0.82 |
| Low | 19% | 19% | 0.936 |
| Medium | 35% | 34% | |
| High | 46% | 47% | |
| Base: all | 1496 | 533 |
At 6-month follow-up:
| Offered GW | Control group | p-value | |
|---|---|---|---|
| Overall scale (from 0 to 60, lower score better) | |||
| Mean score | 30.4 (sd 2.1) | 30.3 (sd 12.8) | 0.939 |
| Score 0 to 14 | 12% | 13% | 0.119 |
| Score 15 to 29 | 32% | 33% | |
| Score 30 to 44 | 45% | 39% | |
| Score 45 to 60 | 12% | 16% | |
| Psychosocial deprivation scale (from 0 to 50, lower score better) | |||
| Mean score | 24.5 (sd 11.7) | 24 (sd 12.2) | 0.5 |
| Low | 32% | 38% | 0.019* |
| Medium | 48% | 39% | |
| High | 21% | 23% | |
| Financial strain score (from 0 to 10, lower score better) | |||
| Mean score | 6.1 (sd 3.3) | 6.4 (sd 3.2) | 0.040* |
| Low | 23% | 20% | 0.421 |
| Medium | 34% | 35% | |
| High | 44% | 46% | |
| Base: all | 1496 | 533 |
At 12-month follow-up:
| Offered GW | Control group | p-value | |
|---|---|---|---|
| Overall scale (from 0 to 60, lower score better) | |||
| Mean score | 30.6 (sd 12.6) | 30.7(sd 13.0) | 0.918 |
| Score 0 to 14 | 12% | 13% | 0.545 |
| Score 15 to 29 | 30% | 31% | |
| Score 30 to 44 | 44% | 39% | |
| Score 45 to 60 | 14% | 17% | |
| Psychosocial deprivation scale (from 0 to 50, lower score better) | |||
| Mean score | 24.7 (sd 12.1) | 24.4 (sd 12.5) | 0.733 |
| Low | 32% | 36% | 0.474 |
| Medium | 46% | 42% | |
| High | 21% | 22% | |
| Financial strain score (from 0 to 10, lower score better) | |||
| Mean score | 6.1 (sd 3.3) | 6.4 (sd 3.2) | 0.142 |
| Low | 25% | 20% | 0.248 |
| Medium | 32% | 34% | |
| High | 44% | 46% | |
| Base: all | 1090 | 362 |
Source: Survey data
5.4.4. Mental health outcomes
The evaluation also examined whether Group Work had a positive impact in terms of improving people’s mental health, either by addressing their anxieties and concerns about job search or by helping them enter paid work (with its known associations with improved mental wellbeing). The evaluation measures the impact of Group Work on mental health and wellbeing using the WHO-5, the PHQ-9 depression scale and the GAD-7 anxiety scale (see Section 3.5) (Table 5.7).
Six months after baseline, those offered Group Work scored statistically significantly better on the WHO-5 wellbeing measure than those in the control group (a mean score of 12.2 out of 25 compared to 11.4, an effect size[footnote 46] of 0.11 standard deviations). However, the difference between the 2 groups is no longer significant 12 months after baseline. Moreover, looking at the proportion of trial participants whose scores suggest that they have likely depression or poor wellbeing, the lower proportions of those in the Group Work arm are not significantly different to those not offered the course, at either 6 or 12 months. The pattern of results using the PHQ-9 is the same but the differences between the 2 groups do not reach statistical significance on the mean score or in the proportions suggesting caseness. Section 3.5 includes a discussion about the relative sensitivity of the PHQ-9 and WHO-5 measures, with some evidence of WHO-5 being more sensitive to identifying depression.
Again 6 months after baseline, those offered Group Work had statistically significantly lower levels of anxiety (as measured by GAD-7) than the control group, both on the mean score (7.8 out of 21 compared to 8.6 among the control group, again an effect size of 0.11 standard deviations) and in the proportions suggesting caseness (44% compared to 51%). As with other measures, these significant impacts are not evident 12 months after baseline. As with the LAMB ITT impacts, there is some evidence that the 6-month impacts on GAD-7 may be exaggerated. A 7 percentage point impact on suggested caseness measured across course participants and decliners is very large, especially given that the IoP estimates presented later in Section 6.4.4 suggest that the impact on course participants is only slightly larger at 9 percentage points[footnote 47]. The 7 percentage point ITT impact would imply the trial has been successful in reducing those at probable caseness threshold amongst decliners as well as participants.[footnote 48] Again, as with LAMB, in the absence of a hypothesis as to how this might have arisen, the most plausible explanation for the finding is that it is simply a randomly occurring difference in the decliner group survey data that is not attributable to Group Work.
Table 5.7: Impact of Group Work on mental health outcomes: intention to treat analysis
At baseline:
| Offered GW | Control group | p-value | |
|---|---|---|---|
| WHO-5 wellbeing (score 0-25, higher score better)2 | |||
| Mean score | 11.7 (sd 6.9) | 11.5 (sd 6.8) | 0.712 |
| % with likely depression/poor wellbeing | 59% | 61% | 0.368 |
| WHO-5 wellbeing categories2 | 0.362 | ||
| Likely depression | 38% | 38% | |
| Poor wellbeing | 21% | 24% | |
| Good wellbeing | 41% | 39% | |
| PHQ-9 depression scale (score 0 to 27, lower score better) | |||
| Mean score | 9.9 (sd 8.0) | 10 (sd 8.1) | 0.849 |
| % depression level suggesting caseness | 45 | 47 | 0.422 |
| PHQ-9 depression categories | 0.911 | ||
| None | 34% | 34% | |
| Mild | 21% | 19% | |
| Moderate | 15% | 16% | |
| Moderately severe | 13% | 14% | |
| Severe | 17% | 17% | |
| GAD-7 anxiety scale (score 0 to 21, lower score better) | |||
| Mean score | 8.9 (sd 6.8) | 9.4 (sd 6.9) | 0.236 |
| % anxiety levels suggesting caseness | 51% | 54% | 0.241 |
| GAD-7 anxiety categories | 0.715 | ||
| None | 34% | 32% | |
| Mild | 22% | 21% | |
| Moderate | 18% | 18% | |
| Severe | 26% | 28% | |
| Base: all | 1496 | 533 |
At 6-month follow-up:
| Offered GW | Control group | p-value | |
|---|---|---|---|
| WHO-5 wellbeing (score 0-25, higher score better)2 | |||
| Mean score | 12.2 (sd 6.9) | 11.4 (sd 6.8) | 0.031* |
| % with likely depression/poor wellbeing | 53% | 57% | 0.13% |
| WHO-5 wellbeing categories2 | 0.245 | ||
| Likely depression | 36% | 40% | |
| Poor wellbeing | 17% | 17% | |
| Good wellbeing | 47% | 43% | |
| PHQ-9 depression scale (score 0 to 27, lower score better) | |||
| Mean score | 8.6 (sd 8.0) | 9.2 (sd 8.0) | 0.187 |
| % depression level suggesting caseness | 38 | 41 | 0.211 |
| PHQ-9 depression categories | 0.599 | ||
| None | 43% | 38% | |
| Mild | 19% | 20% | |
| Moderate | 12% | 14% | |
| Moderately severe | 12% | 13% | |
| Severe | 13% | 15% | |
| GAD-7 anxiety scale (score 0 to 21, lower score better) | |||
| Mean score | 7.8 (sd 6.9) | 8.6 (sd 7.0) | 0.042* |
| % anxiety levels suggesting caseness | 44% | 51% | 0.004* |
| GAD-7 anxiety categories | 0.241 | ||
| None | 43% | 38% | |
| Mild | 21% | 21% | |
| Moderate | 15% | 17% | |
| Severe | 22% | 25% | |
| Base: all | 1496 | 533 |
At 12-month follow-up:
| Offered GW | Control group | p-value | |
|---|---|---|---|
| WHO-5 wellbeing (score 0-25, higher score better)2 | |||
| Mean score | 11.7 (sd 6.9) | 11.1 (sd 7.3) | 0.286 |
| % with likely depression/poor wellbeing | 55% | 57% | 0.607 |
| WHO-5 wellbeing categories2 | 0.408 | ||
| Likely depression | 39% | 44% | |
| Poor wellbeing | 16% | 14% | |
| Good wellbeing | 45% | 43% | |
| PHQ-9 depression scale (score 0 to 27, lower score better) | |||
| Mean score | 8.8 (sd 7.9) | 9.6 (sd 8.4) | 0.179 |
| % depression level suggesting caseness | 41 | 43 | 0.416 |
| PHQ-9 depression categories | 0.656 | ||
| None | 41% | 40% | |
| Mild | 19% | 17% | |
| Moderate | 14% | 12% | |
| Moderately severe | 14% | 16% | |
| Severe | 13% | 16% | |
| GAD-7 anxiety scale (score 0 to 21, lower score better) | |||
| Mean score | 8 (sd 6.9) | 8.4 (sd 7.3) | 0.369 |
| % anxiety levels suggesting caseness | 46% | 47% | 0.72% |
| GAD-7 anxiety categories | 0.279 | ||
| None | 41% | 42% | |
| Mild | 19% | 16% | |
| Moderate | 17% | 15% | |
| Severe | 22% | 27% | |
| Base: all | 1090 | 362 |
Source: Survey data
5.4.5. Wider health outcomes
There are no statistically significant impacts at 6 or 12 months of Group Work on people’s self-reported assessment of their overall health (see Section 3.6 for a description of the EQ-5D and EQVAS scales). Similarly, when people were asked about GP visits within the past 2 weeks or Casualty or hospital outpatient visits in the past 3 months, there are no significant impacts (Table 5.8).
Table 5.8: Impact of Group Work on wider health outcomes: intention to treat analysis
At baseline/randomisation:
| Offered GW | Control group | p-value | ||||
|---|---|---|---|---|---|---|
| EQ-5D health2 | ||||||
| EQ Value | 0.6 (sd 0.3) | 0.7 (sd 0.3) | 0.276 | |||
| EQVAS mean score (higher score better) | 60 (sd 27.2) | 64 (sd 27.4) | 0.009*[footnote 49] | |||
| Use of health services1 | ||||||
| % to GP | 28% | 29% | 0.666 | |||
| % to Casualty or outpatients | 22% | 19% | 0.184 | |||
| Base: all | 1,496 | 533 |
At 6-month follow-up:
| Offered GW | Control group | p-value | ||||
|---|---|---|---|---|---|---|
| EQ-5D health2 | ||||||
| EQ Value | 0.7 (sd 0.3) | 0.7 (sd 0.3) | 0.62 | |||
| EQVAS mean score (higher score better) | 64.6 (sd 25.4) | 63.6 (sd 26.6) | 0.497 | |||
| Use of health services1 | ||||||
| % to GP | 28% | 24% | 0.125 | |||
| % to Casualty or outpatients | 19% | 20% | 0.714 | |||
| Base: all | 1,496 | 533 |
At 12-month follow-up:
| Offered GW | Control group | p-value | ||||
|---|---|---|---|---|---|---|
| EQ-5D health2 | ||||||
| EQ Value | 0.7 (sd 0.3) | 0.7 (sd 0.3) | 0.285 | |||
| EQVAS mean score (higher score better) | 62.5 (sd 26.3) | 61.5 (sd 27.2) | 0.621 | |||
| Use of health services1 | ||||||
| % to GP | 28% | 29% | 0.757 | |||
| % to Casualty or outpatients | 21% | 21% | 0.912 | |||
| Base: all | 1,090 | 362 |
Source: Survey data (in the category description 1 denotes the first wave of data comes from the randomisation survey and 2 denotes baseline survey)
5.4.6. Concluding comments
The ITT analysis shows Group Work having a statistically significant positive impact 6 months after baseline on:
- levels of general self-efficacy
- a belief that someone’s experience is in demand in the workplace
- levels of depression/wellbeing[footnote 50]
- levels of financial strain
Across other measures, positive percentage point differences between those offered Group Work and the control group do not reach statistical significance. Moreover, none of these differences are sustained as statistically significant 12 months after baseline.
The trial was designed to take into account that attendance on the Group Work course was voluntary. However, as take up of the course among those offered it was only 22%, the impact on course participants needed to be very substantial to detect a statistically significant impact among all those offered the course (that is, within an ITT analysis). Given that the level of take up is something that could change over time, with amendments made to the way in which it was offered, it seems inappropriate to judge the effectiveness of Group Work simply on an ITT analysis based on a one in 5 take-up rate. So, Chapter 6 reports in more detail on the impacts of Group Work on those who attended the course.
6. Impacts of Group Work on the course participants (Impact on Participants)
6.1. Overview
Take up of Group Work among those offered it was fairly low, at just 22%. The implication is that the impact on course participants has to be very large if there is be a statistically significant difference between the 2 arms of the trial in the Intention to Treat (ITT) analysis. Given this, and given that the sample sizes in the follow-up surveys are only modest, the focus has been on generating estimates of impact just on course participants[footnote 51] rather than focussing entirely on the impact as measured in the ITT analysis. These ‘Impacts on Participants’ are reported in this chapter.
To explain the problem with the ITT analysis and how it interacts with the sample sizes a little further, the sample sizes from the 6-month survey are 609 course participants, 887 decliners and 533 in the control group.[footnote 52] With these sample sizes, and allowing for the fact that the 609 participants have to be weighted down so that they represent 22% of the offered Group Work arm, the size of impact needed for statistical significance in the ITT analysis is around 5 percentage points.[footnote 53] That is, the difference between the offered Group Work group and the control group needs to be at least 5 percentage points. With the sample sizes achieved at the 12 month survey (510 participants, 580 decliners and 362 in the control group) the size of impact needed for statistical significance in the ITT analysis is around 7 percentage points.[footnote 54]
Now, assuming there is no impact of the programme on decliners, these 5 and 7 percentage point impacts would imply that the impact of the course on participants’ outcomes would need to be at least 23 percentage points at 6 months and 32 percentage points at 12 months. This is substantially higher than impacts found for other employment programmes, including previous trials of JOBS II (see Knight et al., 2020a for further discussion). Six months after baseline, a 23 percentage point impact for just 22% of course participants equates to a 5 percentage point impact for the offered Group Work (i.e. participants and decliners) trial arm. Likewise, at 12 months, a 32 percentage point difference among course participants equates to a 7 percentage point impact in the ITT analysis. In the analysis reported in this and the previous chapter, there are not impacts on participants that are as large as 23 percentage points even though a number of impacts are positive. This is why the ITT analysis finds fewer statistically significant impacts.
For this reason, the main focus has been on the impact of Group Work on course participants (labelled here as the Impact on Participants, or IoP analysis[footnote 55]), where, as detailed below, the outcomes of Group Work participants are compared to those of a comparison group matched using propensity score matching to have a very similar profile as the course participants in terms of their demographics and baseline outcomes.
Section 6.4 presents the outcomes of course participants and their matched comparison group, using the full set of outcomes described in Chapter 3. Six months after baseline Group Work is shown to have had a wider range of statistically significant positive impacts than shown in the ITT analysis across a range of mental health, well-being and self-efficacy measures, as well as on measures of confidence in finding paid work. As with the ITT analysis, in the main, these are no longer statistically significant impacts by 12 months, raising questions about how Group Work could be adapted to improve the sustainability of participants’ outcomes. The exceptions to this are that, at 12 months, course participants were statistically significantly more likely than the matched comparison group to have higher levels of job search self-efficacy and higher self-reported levels of happiness.
Despite a pattern of positive differences between the outcomes of course participants and the matched comparison group in job search activity and being in paid work, in the main these differences do not reach statistical significance in the IoP analysis.
6.2. The Impact on Participants (IoP) analysis
The IoP analysis compares the outcomes of course participants with those of a matched comparison group, that is a comparison group in which the control group is weighted to have the same, or close to the same, demographic profile and baseline outcomes as the participant group. If successful, the IoP analysis isolates the impact on course participants rather than, as in the ITT analysis, all those offered the course. Essentially, the matched comparison group is assumed to give an estimate of the counterfactual for participants (that is, what their outcomes would have been in the absence of the course).
Three matched comparison groups have been generated:
- A matched comparison group for the 6-month survey participants.
- A matched comparison group for the 12-month survey participants.
- A matched comparison group for the participants in the Department for Work and Pensions (DWP) administrative dataset.
For all 3, the matched comparison group was generated using propensity score matching. Essentially, control group members who have characteristics very similar to participants are given a large (propensity score) weight, and control group members who are dissimilar are given a much smaller weight. After applying the weights to the control group, it acts as a matched comparison group. Further details on generating the matched comparison samples can be found in Appendix C.
Using a matched comparison group for participants is not without risk of bias. The IoP analysis moves away from the original RCT design, which provides reasonable assurance of matched groups in the intervention and control groups with no unobserved differences between them. With a matched comparison group, which has to be identified using statistical methods, there is a risk that the IoP impact estimates are biased by unobserved, but important, differences between course participants and their matched comparison group. Appendix C details how close the 2 groups, participant and matched comparison, are on observed characteristics. As far as it is possible to test, the matched comparison groups look to be appropriate and should give a reasonable estimate of the counterfactual for participants.
6.3. Table format, statistical tests and p-values
Tables 6.1 to 6.8 present the IoP impact results. As with the ITT analysis, the tables divide the outcomes into broad domains, presenting each set of outcomes in the same table format. Each table presents the results for each outcome at baseline or randomisation, 6 months after baseline and 12 months after baseline. Where available, randomisation data are used, as they provide the most accurate measure of pre-programme outcomes, collected at precisely the same time point for both arms of the trial. Where the outcome measure was not collected at the point of randomisation (which is the case for the majority of outcomes) the baseline outcome is reported, with each table making clear which data wave is being reported. Whilst the tables present the randomisation and baseline outcomes for all those completing the 6-month survey, the results are very similar for those completing the 12-month survey. For each survey wave, the tables show the percentage or mean score for those in the Group Work course participant group and for those in the matched comparison group.
Again at each wave for each outcome, the p-value significance level is reported for the difference between the Group Work course participants and matched comparison group. Where the differences between the 2 groups are statistically significant (that is the p-value is less than 0.05), these are highlighted in red and with an asterisk. The term ‘statistically significant’ is often abbreviated in the text to ‘significant’. The text also includes discussion of impacts which are close to statistical significance using, as a rule of thumb, a p-value of less than 0.10.
The unweighted sample sizes are cited at the end of each table.
For more information on the outcome measures and the derivation of the categories, see Chapter 3.
P-values are dependent on sample size. For any given observed difference, the smaller the sample size the larger the p-value. Because the survey sample size is larger at 6 months than at 12 months, the IoP impacts have to be slightly larger at 12 months to reach significance. As a very crude rule of thumb, for outcomes presented as percentages that are around the 50% mark, the difference between the participant and matched comparison group has to be around nine percentage points to reach significance, whereas at 12 months the difference has to be around 10 percentage points.
6.4. Findings from the Impact on Participants analysis
The tables in this Chapter split the outcomes into broad domains:
- work-related outcomes, including benefit receipt using administrative data (Tables 6.1 and 6.2)
- job search related outcomes (Tables 6.3 and 6.4)
- wellbeing outcomes and latent and manifest benefits of work (Tables 6.5 and 6.6)
- mental health outcomes (Table 6.7)
- wider health outcomes (Table 6.8)
Further analysis which looks at the differential impact across different population sub-groups is discussed in Chapter 7.
6.4.1. Work-related outcomes
Table 6.1 includes the work-related outcomes asked in the survey – whether or not someone is in paid work (at all or 30 or more hours a week), satisfaction with any paid work they have and earnings levels (for more detail on these outcomes, see Section 3.2). Although there are positive differences between course participants and the matched comparison group across these outcomes, the percentage point differences are not large enough to reach statistical significance at either 6 or 12 months after baseline. In other words, there is no evidence reaching statistically significance that attending the Group Work course has an impact on any of the work-related outcomes.
Six months after baseline, 20% of course participants were in paid work (10% working 30 or more hours a week) compared to 18% of those in the matched comparison group (9% working 30 or more hours per week). Although course participants were not asked about any paid work they were doing when they attended the course, it is reasonable to assume that they should mirror the matched comparison group, in which 10% were in some form of work (usually lower hours in line with benefit eligibility). So, among the matched comparison group, there was a 10 percentage point increase in the proportion in paid work 6 months after baseline, the majority of which went into full-time work (the proportion working 30 hours or more went from 2% at baseline to 9% 6 months later). Twelve months after baseline 23% of course participants and 20% of the matched comparison group were in paid work (with the proportions in work of 30 hours or more 11 and 7% respectively).
As with the findings on being in paid work, there are no significant impacts on job satisfaction (with satisfaction derived from individual being ‘very satisfied’ or ‘satisfied’ on a 5-point scale). The percentages of those in paid work that satisfied them[footnote 56] were 14% among Group Work course participants and 13% in the matched comparison group 6 months after baseline, with comparative percentages of 16 and 15% after 12 months.
Six months after baseline, 9% of both course participants and the matched comparison group were in employment earning £10,000 per year or more, with percentages of 11 and 8% at 12 months. Again, this is not a statistically significant difference.
Table 6.1: Impact of Group Work on work outcomes: impact on participants
At baseline:
| Participants | Compar-ison group | p-value | |
|---|---|---|---|
| Working status[footnote 57] | |||
| In paid work | .. | 10% | |
| In paid work 30+ hours a week | .. | 2% | |
| Job satisfaction[footnote 58] | |||
| In paid work that satisfies me | .. | .. | |
| In paid work that does not satisfy me | .. | .. | |
| Not in paid work | .. | .. | |
| Earnings | |||
| In paid work earning £10k pa or more | .. | .. | |
| In paid work earning less than £10k pa | .. | .. | |
| In paid work, earnings not given | .. | .. | |
| Not in paid work | |||
| Base: all | 609 | 533 |
At 6-month follow-up:
| Participants | Compar-ison group | p-value | |
|---|---|---|---|
| Working status[footnote 57] | |||
| In paid work | 20% | 18% | 0.442 |
| In paid work 30+ hours a week | 10% | 9% | 0.85 |
| Job satisfaction[footnote 58] | 0.515 | ||
| In paid work that satisfies me | 14% | 13% | |
| In paid work that does not satisfy me | 6% | 4% | |
| Not in paid work | 80% | 82% | |
| Earnings | 0.495 | ||
| In paid work earning £10k pa or more | 9% | 9% | |
| In paid work earning less than £10k pa | 6% | 5% | |
| In paid work, earnings not given | 5% | 3% | |
| Not in paid work | 80% | 82% | |
| Base: all | 609 | 533 |
At 12-month follow-up:
| Participants | Compar-ison group | p-value | ||
|---|---|---|---|---|
| Working status[footnote 57] | ||||
| In paid work | 23% | 20% | 0.445 | |
| In paid work 30+ hours a week | 11% | 7% | 0.135 | |
| Job satisfaction[footnote 58] | 0.573 | |||
| In paid work that satisfies me | 16% | 15% | ||
| In paid work that does not satisfy me | 7% | 5% | ||
| Not in paid work | 77% | 80% | ||
| Earnings | 0.748 | |||
| In paid work earning £10k pa or more | 11% | 8% | ||
| In paid work earning less than £10k pa | 11% | 10% | ||
| In paid work, earnings not given | 1% | 2% | ||
| Not in paid work | 77% | 80% | ||
| Base: all | 510 | 362 |
Source: Survey data
Administrative data on benefit receipt provides a larger dataset of course participants than the survey data, so it was used to look at the impact of attending the course on receipt of benefits related to unemployment, namely Jobseeker’s Allowance (JSA), Employment Support Allowance (ESA), Income Support (IS) and Universal Credit (UC) as a proxy for being in paid work. However, as benefit claimants can continue to be eligible for these benefits if they are doing a limited number of hours of paid work under a certain pay threshold, benefit receipt is only a crude proxy of unemployment. In fact, 6 months after randomisation, course participants were statistically significantly more likely (85% compared to 83%) to be in receipt of these benefits than those in the matched comparison group (as shown in Table 6.2 below). However, 12 months after randomisation, this significant difference had disappeared, with 77% of course participants and 76% of those in the matched comparison group on JSA, ESA, IS or UC. There are no significant differences in the amount of these benefits that course participants and their matched comparison group received either after 6 or 12 months.[footnote 59]
Table 6.2: Impact of Group Work on benefit receipt: impact on participants
At randomisation:
| Participants | Compar-ison group | p-value | |
|---|---|---|---|
| In receipt of: | |||
| Universal Credit, Jobseeker’s Allowance, Employment Support Allowance or Income Support | 99% | 99% | 0.802 |
| Mean amount per week (£) | 82.2 (sd 35.1) | 83.4 (sd 32.2) | 0.167 |
| Base: | 2596 | 4293 |
At 6-months:
| Participants | Compar-ison group | p-value | |
|---|---|---|---|
| In receipt of: | |||
| Universal Credit, Jobseeker’s Allowance, Employment Support Allowance or Income Support | 85% | 83% | 0.046* |
| Mean amount per week (£) | 73.6 (sd 45.8) | 73.7 (sd 50.0) | 0.919 |
| Base: | 2596 | 4293 |
At 12-months:
| Participants | Compar-ison group | p-value | |
|---|---|---|---|
| In receipt of: | |||
| Universal Credit, Jobseeker’s Allowance, Employment Support Allowance or Income Support | 77% | 76% | 0.315 |
| Mean amount per week (£) | 71.7 (sd 56.8) | 74 (sd 62.6) | 0.138 |
| Base: | 2596 | 4293 |
Source: DWP administrative data
6.4.2. Job search-related outcomes
The 6 and 12 month surveys included a range of measures of trial participants’ job search activity (Table 6.3). Those attending the Group Work course were statistically significantly more likely than the matched comparison group to have submitted more CVs within the previous fortnight. This significant impact is evident both at 6 and 12 months after baseline. At 6 months, 28% of course participants had submitted ten or more CVs in the last 2 weeks compared to 16% of the matched comparison group, whilst a third (33%) had submitted none compared to 41% in the matched comparison group. The pattern is similar at 12 months, with 26% of course participants submitting 10 or more CVs compared to 18% of the matched comparison group.
There is a similar pattern of results to the CVs in terms of vacancies applied for, although the differences in the number of applications between the course participants and matched comparison is not statistically significant at either 6 or 12 months. The same applies for the impact on attending training and courses.
There is no statistically significant impact of course attendance on job search when the Finnish Institute of Occupational Health Job Seeking Activity Scale (Revised) is used to categorise benefit claimants into those engaging in higher and lower levels of job search, no job search or being in full-time paid work (see Section 3.3 for more detail). There are no statistically significant differences on this measure between the course participants and the matched comparison group at either 6 or 12 months after baseline.
Table 6.3: Impact of Group Work on job search activity outcomes: impact on participants
At baseline:
| Participants | Comparison group | p-value | |
|---|---|---|---|
| Job-search activity scale in past fortnight[footnote 60] | |||
| In paid work 30 hours or more | .. | .. | |
| Higher levels | .. | .. | |
| Lower levels | .. | .. | |
| No job search | |||
| Number of vacancies applied for in past fortnight | |||
| In paid work 30 hours or more | .. | .. | |
| Ten or more | .. | .. | |
| Fewer than ten | .. | .. | |
| None | .. | .. | |
| Number of CVs submitted in past fortnight | |||
| In paid work 30 hours or more | .. | .. | |
| Ten or more | .. | .. | |
| Fewer than ten | .. | .. | |
| None | .. | .. | |
| Gaining experience | |||
| Attended training/courses | .. | .. | |
| Voluntary work | .. | .. | |
| Work placements | .. | .. | |
| Base: all | 609 | 533 |
At 6-month follow-up:
| Participants | Comparison group | p-value | |
|---|---|---|---|
| Job-search activity scale in past fortnight[footnote 60] | 0.437 | ||
| In paid work 30 hours or more | 10% | 9% | |
| Higher levels | 40% | 43% | |
| Lower levels | 39% | 33% | |
| No job search | 11% | 15% | |
| Number of vacancies applied for in past fortnight | 0.078 | ||
| In paid work 30 hours or more | 10% | 9% | |
| Ten or more | 37% | 28% | |
| Fewer than ten | 29% | 28% | |
| None | 24% | 34% | |
| Number of CVs submitted in past fortnight | 0.017* | ||
| In paid work 30 hours or more | 10% | 9% | |
| Ten or more | 28% | 16% | |
| Fewer than ten | 29% | 34% | |
| None | 33% | 41% | |
| Gaining experience | |||
| Attended training/courses | 53% | 45% | 0.079 |
| Voluntary work | 26% | 26% | 0.994 |
| Work placements | 13% | 9% | 0.12 |
| Base: all | 609 | 533 |
At 12-month follow-up:
| Participants | Comparison group | p-value | |
|---|---|---|---|
| Job-search activity scale in past fortnight[footnote 60] | 0.293 | ||
| In paid work 30 hours or more | 11 | 7 | |
| Higher levels | 36 | 40 | |
| Lower levels | 41 | 38 | |
| No job search | 12 | 15 | |
| Number of vacancies applied for in past fortnight | 0.297 | ||
| In paid work 30 hours or more | 11 | 7 | |
| Ten or more | 38 | 34 | |
| Fewer than ten | 25 | 29 | |
| None | 26 | 31 | |
| Number of CVs submitted in past fortnight | 0.031* | ||
| In paid work 30 hours or more | 11 | 7 | |
| Ten or more | 26 | 18 | |
| Fewer than ten | 27 | 27 | |
| None | 36 | 49 | |
| Gaining experience | |||
| Attended training/courses | 42 | 33 | 0.083 |
| Voluntary work | 28 | 21 | 0.127 |
| Work placements | 11 | 9 | 0.521 |
| Base: all | 510 | 362 |
Source: Survey data
Beyond helping with job search activity, Group Work aspires to increase people’s job search self-efficacy and confidence that they can enter work (see Section 3.3 for the measures used, and the evidence of the role of job search self-efficacy.) Certainly, 6 months after baseline (but not sustained 12 months after baseline), the course appeared to provide its participants with a level of confidence about their capacity to find work not apparent among the matched comparison group, with large and statistically significant impacts across a number of measures (see Table 6.4).
At randomisation or baseline (depending on when the questions were asked), the Group Work course participants and matched comparison group were not statistically significantly different in their perceptions of getting work across all outcomes asked. However, by 6 months, course participants were statistically significantly more likely than the matched comparison group to report positive outcomes across all these measures except their views on factors affecting job search success.
General self-efficacy is measured using the General Self Efficacy scale described in Section 3.3. At baseline, 42% of course participants and 46% of benefit claimants in the matched comparison group had higher levels of general self-efficacy (a non-significant difference). Six months after baseline, the proportion among course participants had risen to 60% and was statistically significantly greater than the proportion in the matched comparison group (47%). The difference between the mean scores of the 2 groups was also statistically significant (2.3 versus 2.6 out of 5, with a lower score denoting higher levels of general self-efficacy). In other words, 6 months after the course, participants were more likely to perceive themselves as being able to effectively handle situations than their matched comparison group.
Job search self-efficacy is measured using the Job Search Self Efficacy Index (Modified) described in Section 3.3. The proportion of course participants who were rated as having a higher level of job search self-efficacy rose substantially from 31% at baseline to 58% at 6 months. With the comparable percentages for the comparison group being 31% and 36%, the difference at 6 months between the course participants and the matched comparison group was statistically significant, as was the mean score difference (3.8 versus 3.4 out of 5, where a higher score denotes higher job search self-efficacy). In other words, 6 months after the course, participants showed higher levels of confidence and self-efficacy about their job search abilities than their matched comparison group.
The percentages of course participants agreeing strongly or agreeing to 2 statements about the value of their personal qualities and their experience were substantially and significantly statistically higher 6 months after baseline than the percentages in the matched comparison group. 70% of course participants and 59% of the matched comparison group agreed that “my personal qualities make it easy to get a new job” at 6 months after baseline, while 61% compared to 46% agreed that “my experience is in demand in the labour market”. They were also substantially and statistically significantly more likely to be confident that they will find work within the next 13 weeks. Six months after baseline, 40% of course participants were confident compared to 27% of the matched comparison group. However, when asked what they felt plays the greatest role in securing a job, the proportions of course participants and the matched comparison group who felt that it was mainly down to their own job search effort, fixed effects such as their education or experience, or things outside of their control (for example, luck or who you know) were close to, but not reaching, statistical significance.
However, with the exception of levels of job search self-efficacy, by 12 months after baseline these statistically significant differences between the course participants and the matched comparison group are no longer evident. In the main, the gap between the course participants and the matched comparison narrowed between 6 and 12 months, largely due to improvements among the matched comparison group. However, for the job search self-efficacy, there is still a statistically significant impact at 12 months with 57% of course participants compared to 45% of the matched comparison group scoring as having higher levels of job search self-efficacy. Likewise, there is a statistically significant difference in their mean scores (3.8 versus 3.5 out of 5).
Table 6.4: Impact of Group Work on self-efficacy/confidence outcomes: impact on participants
At randomisation/baseline:
| Participants | Compa-rison group | p-value | |
|---|---|---|---|
| General self-efficacy scale (1 to 5)2 | |||
| Mean score (lower score, higher self-efficacy) | 2.6 (sd 0.8) | 2.5 (sd 0.9) | 0.273 |
| Higher self-efficacy | 42% | 46% | 0.368 |
| Lower self-efficacy | 58% | 54% | |
| Job search self-efficacy scale (1 to 5)2 | |||
| 9-item scale | |||
| Mean score (higher score, higher self-efficacy) | 3.3 (sd 0.9) | 3.4 (sd 0.9) | 0.759 |
| Higher job search self-efficacy | 31% | 31% | 0.823 |
| % agree personal qualities will help get work1 | 49% | 47% | 0.529 |
| % agree their experience is in demand¹ | 38% | 35% | 0.507 |
| Confidence in finding job1 | 0.469 | ||
| In work including voluntary | .. | .. | |
| Confident will find a job | 50% | 54% | |
| Not confident will find a job | 50% | 46% | |
| Factors affecting job search success¹ | 0.873 | ||
| Job search effort | 23% | 21% | |
| Fixed effects | 55% | 57% | |
| Things outside my control | 22% | 22% | |
| Base: all | 609 | 533 |
At 6-month follow-up:
| Participants | Compa-rison group | p-value | |
|---|---|---|---|
| General self-efficacy scale (1 to 5)2 | |||
| Mean score (lower score, higher self-efficacy) | 2.3 (sd 0.9) | 2.6 (sd 0.9) | 0.003* |
| Higher self-efficacy | 60% | 47% | 0.005* |
| Lower self-efficacy | 40% | 53% | |
| Job search self-efficacy scale (1 to 5)2 | |||
| 9-item scale | |||
| Mean score (higher score, higher self-efficacy) | 3.8 (sd 0.8) | 3.4 (sd 0.9) | 0.000* |
| Higher job search self-efficacy | 58% | 36% | 0.000* |
| % agree personal qualities will help get work1 | 70% | 59% | 0.013* |
| % agree their experience is in demand¹ | 61% | 46% | 0.001* |
| Confidence in finding job1 | 0.001* | ||
| In work including voluntary | 27% | 24% | |
| Confident will find a job | 40% | 27% | |
| Not confident will find a job | 33% | 50% | |
| Factors affecting job search success¹ | 0.073 | ||
| Job search effort | 29% | 20% | |
| Fixed effects | 42% | 49% | |
| Things outside my control | 29% | 30% | |
| Base: all | 609 | 533 |
At 12-month follow-up:
| Participants | Compa-rison group | p-value | |
|---|---|---|---|
| General self-efficacy scale (1 to 5)2 | |||
| Mean score (lower score, higher self-efficacy) | 2.3 (sd 0.9) | 2.4 (sd 0.9) | 0.381 |
| Higher self-efficacy | 59% | 52% | 0.211 |
| Lower self-efficacy | 41% | 48% | |
| Job search self-efficacy scale (1 to 5)2 | |||
| 9-item scale | |||
| Mean score (higher score, higher self-efficacy) | 3.8 (sd 0.9) | 3.5 (sd 0.9) | 0.001* |
| Higher job search self-efficacy | 57% | 45% | 0.027* |
| % agree personal qualities will help get work1 | 69% | 60% | 0.072 |
| % agree their experience is in demand¹ | 58% | 54% | 0.421 |
| Confidence in finding job1 | 0.376 | ||
| In work including voluntary | 30% | 25% | |
| Confident will find a job | 33% | 31% | |
| Not confident will find a job | 37% | 44% | |
| Factors affecting job search success¹ | 0.205 | ||
| Job search effort | 26% | 24% | |
| Fixed effects | 44% | 52% | |
| Things outside my control | 30% | 24% | |
| Base: all | 510 | 362 |
Source: Survey data (in the category description 1 denotes the first wave of data comes from the randomisation survey and 2 denotes baseline survey)
6.4.3. Wellbeing outcomes and latent and manifest benefits of work
In addition to examining whether Group Work helped people into work, or moving them towards paid employment, the evaluation also explored whether Group Work improved people’s well-being. This section reports on 3 relevant measures: the ONS4 Wellbeing questions, the UCLA Loneliness Scale and the Latent and Manifest Benefits (LAMB) scale, the results of which are in Tables 6.5 and 6.6. All of these scales are described in more detail in Section 3.4.
Comparing course participants against the matched comparison group, there are statistically significant impacts of Group Work on participants’ levels of wellbeing at 6 months after baseline on all these outcomes except for the ONS anxiety measure. However, with the exception of levels of happiness measured by the ONS scale, none of these statistically significant impacts are present 12 months after baseline.
There is a pattern of positive statistically significant results 6 months after baseline across the 3 ONS wellbeing measures of life satisfaction, feeling worthwhile and being happy:
- nearly half (48%) of course participants reported at 6 months that they were satisfied with their lives compared to 34% of the matched comparison group, with a mean score difference of 6.5 out of 10 compared to 5.4
- similarly, 54% of the participants perceived life as being worthwhile compared to 38% of the matched comparison (mean scores 6.3 and 5.7 respectively)
- the comparable percentages on happiness were 55 and 37%, with mean score differences of 6.3 to 5.4
The positive differences in the percentages of course participants and the matched comparison group feeling satisfied, worthwhile and happy are no longer statistically significant 12 months after baseline, although the differences between the 2 groups in terms of the proportions feeling happy and feeling life is worthwhile are close to significance. The gap between the 2 groups reduces, largely through improvements in the matched comparison group. Similarly, the mean score differences on life satisfaction and feeling worthwhile are no longer significant at 12 months. However, the mean score difference on the happiness scale is still evident 12 months after baseline, by which time course participants had a mean score of 6.5 against 5.8 among the matched comparison group.
There are no statistically significant differences between course participants and the matched comparison group in anxiety levels, as measured by the ONS wellbeing measure (see Section 6.5 for details on the GAD-7 scale, another measure of anxiety).
Six months after baseline, participants were also statistically significantly less likely than the matched comparison group to rate as being lonely on the UCLA scale. 46% of course participants scored as lonely compared to 55% (the mean score difference was close to, but not statistically significant (p=0.098).
Table 6.5: Impact of Group Work on wellbeing outcomes: impact on participants
At randomisation/baseline:
| Participants | Compar-ison group | p-value | |
|---|---|---|---|
| ONS measures (0-10)1 | |||
| Mean scores[footnote 61] | |||
| Life satisfaction | 5.3 (sd 2.2) | 5.1 (sd 2.4) | 0.475 |
| Life worthwhile | 5.8 (sd 2.3) | 6 (sd 2.4) | 0.514 |
| Happiness | 5.6 (sd 2.5) | 5.6 (sd 2.6) | 0.846 |
| Anxiety | 3.8 (sd 2.9) | 3.5 (sd 2.9) | 0.304 |
| % satisfied with life | 29% | 27% | 0.494 |
| % life worthwhile | 41% | 43% | 0.724 |
| % happier | 40% | 40% | 0.904 |
| % anxious | 28% | 25% | 0.447 |
| UCLA measure (3-9)2 | |||
| % lonely | 47% | 50% | 0.52% |
| Mean score (higher=lonelier) | 5.5 (sd 1.9) | 5.5 (sd 1.8) | 0.968 |
| Base: all | 609 | 533 |
At 6-month follow-up:
| Participants | Compar-ison group | p-value | |
|---|---|---|---|
| ONS measures (0-10)1 | |||
| Mean scores[footnote 61] | |||
| Life satisfaction | 6 (sd 2.6) | 5.4 (sd 2.4) | 0.003* |
| Life worthwhile | 6.3 (sd 2.5) | 5.7 (sd 2.5) | 0.007* |
| Happiness | 6.3 (sd 2.8) | 5.4 (sd 2.7) | 0.000* |
| Anxiety | 3.8 (sd 3.1) | 3.6 (sd 2.9) | 0.387 |
| % satisfied with life | 48% | 34% | 0.002* |
| % life worthwhile | 54% | 38% | 0.001* |
| % happier | 55% | 37% | 0.000* |
| % anxious | 29% | 25% | 0.345 |
| UCLA measure (3-9)2 | |||
| % lonely | 46% | 55% | 0.041* |
| Mean score (higher=lonelier) | 5.4 (sd 2.0) | 5.7 (sd 2.0) | 0.098 |
| Base: all | 609 | 533 |
At 12-month follow-up:
| Participants | Compar-ison group | p-value | |
|---|---|---|---|
| ONS measures (0-10)1 | |||
| Mean scores[footnote 61] | |||
| Life satisfaction | 6.2 (sd 2.5) | 6 (sd 2.4) | 0.331 |
| Life worthwhile | 6.4 (sd 2.6) | 6.1 (sd 2.4) | 0.252 |
| Happiness | 6.5 (sd 2.7) | 5.8 (sd 2.7) | 0.013* |
| Anxiety | 3.7 (sd 3.0) | 3.9 (sd 3.2) | 0.576 |
| % satisfied with life | 49% | 44% | 0.315 |
| % life worthwhile | 54% | 44% | 0.051 |
| % happier | 57% | 48% | 0.068 |
| % anxious | 27% | 34% | 0.124 |
| UCLA measure (3-9)2 | |||
| % lonely | 48% | 51% | 0.484 |
| Mean score (higher=lonelier) | 5.4 (sd 2.0) | 5.6 (sd 1.9) | 0.254 |
| Base: all | 510 | 362 |
Source: Survey data (in the category description 1 denotes the first wave of data comes from the randomisation survey and 2 denotes baseline survey).
Table 6.6 shows the overall LAMB scores of course participants and the matched comparison group, together with their scores on 2 sub-scales which measure individuals’ levels of psychosocial deprivation and their level of financial strain (see Section 3.4 for more detail on these scales).
There is a statistically significant difference at 6 months on the overall LAMB score measuring people’s perceptions of the benefits of work. Looking at the standard four-category LAMB outcome (where a lower score denotes a better LAMB score), 15% of course participants scored in the lowest (best) category compared to 7% of the matched comparison group. However, while the difference across the categories is statistically significant, the mean score difference between the 2 groups is not. This is likely due to the fact that, in the main, the movement was between the lower 2 categories rather than across the whole scale. In other words, participants appear to show a stronger belief in the psychological and financial benefits of work than the matched comparison group. Twelve months after baseline, the pattern is similar but smaller and not statistically significant.
Although there is no statistically significant evidence that Group Work has an impact on people’s levels of psychosocial deprivation and financial strain, using the 2 separate LAMB sub-scales, the differences between course participants and the matched comparison on the groupings for the psychological deprivation score (which indicates someone’s perceived psychological benefits of work) are close to statistical significance (p=0.098). However, the picture is mixed, with course participants more likely than the matched comparison group to be both in the lowest (i.e. best) and highest (i.e. worst) scoring groups.
Table 6.6: Impact of Group Work on the Latent and Manifest Benefits scale: impact on participants
At baseline:
| Participants | Comparison group | p-value | |
|---|---|---|---|
| Overall scale (from 0 to 60, lower score better) | |||
| Mean score | 31.5 (sd 8.9) | 31.5 (sd 9.7) | 0.964 |
| Score 0 to 14 | 3% | 3% | 0.981 |
| Score 15 to 29 | 38% | 38% | |
| Score 30 to 44 | 52% | 51% | |
| Score 45 to 60 | 7% | 7% | |
| Psychosocial deprivation scale (from 0 to 50, lower score better) | |||
| Mean score | 24.9 (sd 9.0) | 25.2 (sd 9.7) | 0.739 |
| Low | 27% | 30% | 0.658 |
| Medium | 58% | 54% | |
| High | 14% | 16% | |
| Financial strain score (from 0 to 10 with lower score better) | |||
| Mean score | 6.7 (sd 2.8) | 6.7 (sd 3.1) | 0.875 |
| Low | 14% | 14% | 0.768 |
| Medium | 42% | 39% | |
| High | 44% | 47% | |
| Base: all | 609 | 533 |
At 6-month follow-up:
| Participants | Comparison group | p-value | |
|---|---|---|---|
| Overall scale (from 0 to 60, lower score better) | |||
| Mean score | 30.5 (sd 12.4) | 30.4 (sd 10.7) | 0.968 |
| Score 0 to 14 | 15% | 7% | 0.019* |
| Score 15 to 29 | 27% | 37% | |
| Score 30 to 44 | 47% | 45% | |
| Score 45 to 60 | 12% | 11% | |
| Psychosocial deprivation scale (from 0 to 50, lower score better) | |||
| Mean score | 24.3 (sd 12.0) | 24.2 (sd 10.3) | 0.875 |
| Low | 33% | 30% | 0.098 |
| Medium | 45% | 54% | |
| High | 21% | 15% | |
| Financial strain score (from 0 to 10 with lower score better) | |||
| Mean score | 6.3 (sd 3.5) | 6.4 (sd 3.1) | 0.696 |
| Low | 23% | 23% | 0.815 |
| Medium | 29% | 32% | |
| High | 47% | 45% | |
| Base: all | 609 | 533 |
At 12-month follow-up:
| Participants | Comparison group | p-value | |
|---|---|---|---|
| Overall scale (from 0 to 60, lower score better) | |||
| Mean score | 30.1 (sd 12.4) | 30.4 (sd 10.9) | 0.781 |
| Score 0 to 14 | 14% | 11% | 0.622 |
| Score 15 to 29 | 28% | 33% | |
| Score 30 to 44 | 48% | 47% | |
| Score 45 to 60 | 9% | 10% | |
| Psychosocial deprivation scale (from 0 to 50, lower score better) | |||
| Mean score | 24 (sd 12.1) | 24.2 (sd 10.8) | 0.858 |
| Low | 35% | 33% | 0.541 |
| Medium | 45% | 51% | |
| High | 20% | 17% | |
| Financial strain score (from 0 to 10 with lower score better) | |||
| Mean score | 6.3 (sd 3.4) | 6.4 (sd 3.2) | 0.784 |
| Low | 23% | 21% | 0.918 |
| Medium | 32% | 32% | |
| High | 45% | 46% | |
| Base: all | 510 | 362 |
Source: Survey data
6.4.4. Mental health outcomes
The evaluation also examined whether Group Work had a positive impact in terms of improving people’s mental health, either by addressing their anxieties and concerns about job search or by helping them enter paid work (with its known associations with improved mental wellbeing).
Six months after baseline, course participants were statistically significantly less likely than the matched comparison group to score as having likely depression or poor wellbeing on the WHO-5 well-being scale (49% compared to 59%). There was also a statistically significant positive difference in the mean scores (12.7 for course participants versus 11.3 out of 25 for the matched comparison group, and effect size of 0.21 standard deviations[footnote 62]). At 12 months after baseline there is a positive but smaller percentage point difference in those having likely depression or poor wellbeing (50% compared to 55%) and this smaller difference is not statistically significant (p=0.094).
Whilst there is the same pattern of positive results for the PHQ-9 measure of depression, the differences between the course participants and the matched comparison group are not as large and not statistically significant, either 6 or 12 months after baseline. Section 3.5 includes a discussion about the relative sensitivity of the PHQ-9 and WHO-5 measures, with some evidence of WHO-5 being more sensitive to identifying depression.
Six months after baseline, 39% of course participants and 48% of the matched comparison group reported anxiety levels on the GAD-7 scale which suggested caseness (i.e. would suggest that they would probably be diagnosed with anxiety).[footnote 63] This substantial difference is very close to, but just above the ceiling of, statistical significance (p=0.051). The mean score difference at 6 months between the 2 groups is positive but not statistically significant, nor are the positive, but smaller, differences observed after 12 months.
Table 6.7: Impact of Group Work on mental health outcomes: impact on participants
At baseline:
| Participants | Compar-ison group | p-value | |
|---|---|---|---|
| WHO-5 wellbeing (score 0-25, higher score better)2 | |||
| Mean score | 11.7 (sd 5.8) | 12.1 (sd 6.3) | 0.505 |
| % with likely depression /impaired wellbeing | 54% | 59% | 0.33 |
| WHO-5 wellbeing categories2 | 0.481 | ||
| Likely depression | 31% | 31% | |
| Poor wellbeing | 23% | 28% | |
| Good wellbeing | 46% | 41% | |
| PHQ-9 depression scale (score 0 to 27, lower score better) | |||
| Mean score | 9.6 (sd 7.1) | 9.7 (sd 7.5) | 0.907 |
| % depression level suggesting caseness | 44% | 45% | 0.928 |
| PHQ-9 depression categories | 0.971 | ||
| None | 31% | 30% | |
| Mild | 25% | 25% | |
| Moderate | 19% | 17% | |
| Moderately severe | 13% | 14% | |
| Severe | 12% | 14% | |
| GAD-7 anxiety scale (score 0 to 21, lower score better) | |||
| Mean score | 8.1 (sd 5.9) | 8.5 (sd 6.3) | 0.564 |
| % anxiety levels suggesting caseness | 49% | 50% | 0.771 |
| GAD-7 anxiety categories | 0.812 | ||
| None | 32% | 33% | |
| Mild | 29% | 25% | |
| Moderate | 23% | 23% | |
| Severe | 16% | 19% | |
| Base: all | 609 | 533 |
At 6-month follow-up:
| Participants | Compar-ison group | p-value | |
|---|---|---|---|
| WHO-5 wellbeing (score 0-25, higher score better)2 | |||
| Mean score | 12.7 (sd 6.7) | 11.3 (sd 6.4) | 0.016* |
| % with likely depression /impaired wellbeing | 49% | 59% | 0.029* |
| WHO-5 wellbeing categories2 | 0.089 | ||
| Likely depression | 33% | 40% | |
| Poor wellbeing | 15% | 19% | |
| Good wellbeing | 51% | 41% | |
| PHQ-9 depression scale (score 0 to 27, lower score better) | |||
| Mean score | 7.7 (sd 7.6) | 8.4 (sd 7.1) | 0.26 |
| % depression level suggesting caseness | 32% | 36% | 0.428 |
| PHQ-9 depression categories | 0.153 | ||
| None | 48% | 38% | |
| Mild | 20% | 27% | |
| Moderate | 12% | 15% | |
| Moderately severe | 10% | 10% | |
| Severe | 10% | 10% | |
| GAD-7 anxiety scale (score 0 to 21, lower score better) | |||
| Mean score | 7 (sd 6.7) | 7.8 (sd 6.3) | 0.168 |
| % anxiety levels suggesting caseness | 39 | 48 | 0.051 |
| GAD-7 anxiety categories | 0.293 | ||
| None | 47% | 40% | |
| Mild | 21% | 27% | |
| Moderate | 13% | 15% | |
| Severe | 18% | 18% | |
| Base: all | 609 | 533 |
At 12-month follow-up:
| Participants | Compar-ison group | p-value | |
|---|---|---|---|
| WHO-5 wellbeing (score 0-25, higher score better)2 | |||
| Mean score | 12.6 (sd 6.7) | 11.3 (sd 7.1) | 0.094 |
| % with likely depression /impaired wellbeing | 50% | 55% | 0.318 |
| WHO-5 wellbeing categories2 | 0.591 | ||
| Likely depression | 35% | 39% | |
| Poor wellbeing | 14% | 16% | |
| Good wellbeing | 50% | 45% | |
| PHQ-9 depression scale (score 0 to 27, lower score better) | |||
| Mean score | 7.9 (sd 7.4) | 8.3 (sd 7.6) | 0.577 |
| % depression level suggesting caseness | 33% | 35% | 0.684 |
| PHQ-9 depression categories | 0.576 | ||
| None | 43% | 42% | |
| Mild | 24% | 23% | |
| Moderate | 10% | 13% | |
| Moderately severe | 12% | 9% | |
| Severe | 11% | 13% | |
| GAD-7 anxiety scale (score 0 to 21, lower score better) | |||
| Mean score | 7 (sd 6.6) | 7.8 (sd 6.6) | 0.233 |
| % anxiety levels suggesting caseness | 40 | 45 | 0.347 |
| GAD-7 anxiety categories | 0.628 | ||
| None | 47% | 43% | |
| Mild | 21% | 19% | |
| Moderate | 14% | 18% | |
| Severe | 19% | 20% | |
| Base: all | 510 | 362 |
Source: Survey data
6.4.5. Wider health outcomes
There are no statistically significant impacts of Group Work on people’s self-reported assessment of their health or on their use of health services either 6 or 12 months after baseline (Table 6.8).
The EQ-5D Value provides an overall measure of someone’s health status, derived from 5 questions which ask people about different aspects of their health. Individuals’ scores are converted into a ‘value’ score by weighting the various health elements according to the extent to which they affect someone’s’ quality of life. The EQVAS is a self-rated health measure, with people asked to rate their health from 0 to 100 (see Section 3.6 for more detail on both measures). On neither measure is there a statistically significant impact of Group Work when comparing course participants and the matched control group, although the positive differences in the EQVAS mean scores of course participants and the matched comparison group (65.6 versus 61.6 out of 100) at 6 months comes close to statistical significance (p=0.099). Similarly, when people were asked about GP visits within the past 2 weeks or Casualty or hospital outpatient visits in the past 3 months, no statistically significant impacts were detected.
Table 6.8: Impact of Group Work on wider health outcomes: impact on participants
At baseline/randomisation:
| Participants | Comparison group | p-value | |
|---|---|---|---|
| EQ-5D health2 | |||
| EQ Value | 0.7 (sd 0.3) | 0.7 (sd 0.3) | 0.959 |
| EQVAS mean score (higher score better) | 54.2 (sd 27.1) | 63.1 (sd 25.1) | 0.000*[footnote 64] |
| Use of health services1 | |||
| % to GP | 27 | 25 | 0.748 |
| % to Casualty or outpatients | 19 | 17 | 0.491 |
| Base: all | 609 | 533 |
At 6-month follow-up:
| Participants | Comparison group | p-value | |
|---|---|---|---|
| EQ-5D health2 | |||
| EQ Value | 0.7 (sd 0.3) | 0.7 (sd 0.3) | 0.531 |
| EQVAS mean score (higher score better) | 65.6 (sd 24.5) | 61.6 (sd 25.3) | 0.099 |
| Use of health services1 | |||
| % to GP | 25 | 19 | 0.121 |
| % to Casualty or outpatients | 16 | 20 | 0.195 |
| Base: all | 609 | 533 |
At 12-month follow-up:
| Participants | Compar-ison group | p-value | |
|---|---|---|---|
| EQ-5D health2 | |||
| EQ Value | 0.7 (sd 0.3) | 0.7 (sd 0.3) | 0.563 |
| EQVAS mean score (higher score better) | 64.9 (sd 25.9) | 62.1 (sd 27.0) | 0.411 |
| Use of health services1 | |||
| % to GP | 25 | 23 | 0.634 |
| % to Casualty or outpatients | 23 | 17 | 0.125 |
| Base: all | 510 | 362 |
Source: Survey data (in randomisation/baseline column 1 denotes randomisation survey and 2 denotes baseline survey)
6.5. Concluding comments
Comparing the outcomes of course participants against a matched comparison group, Group Work had a statistically significant positive impact 6 months after baseline on:
- the number of CVs someone submits
- levels of general self-efficacy
- levels of job search self-efficacy and various measures of individuals’ perceptions and confidence in finding work
- levels of wellbeing, measured by the ONS wellbeing measures
- levels of loneliness
- perceptions of the latent and manifest benefits of work (LAMB)
- levels of depression, measured by the WHO-5 scale
While the differences between the course participants and the matched comparison after 6 months do not reach statistical significance on other measures, including being in paid work, they demonstrate a positive pattern of results. Notably, the impact of Group Work levels of anxiety, measured by the GAD-7 scale, is very close to statistical significance.
Few of the statistically significant impacts 6 months after baseline are sustained after 12 months, with the exceptions being course participants’ job search self-efficacy, the number of CVs being submitted and levels of happiness. However, the 12 month outcomes continue to show a positive pattern of results, albeit that the differences between the course participants and matched comparison group tend to be smaller. In the main statistical significance is lost because, while the participants’ outcomes remained very similar at 6 and 12 months, those of the matched comparison group improved over that period.
Chapter 8 and – in more detail – the Synthesis Report (Knight et al., 2020b) discuss the implications of these findings. Clearly one conclusion that might be drawn is that, given the positive benefits at 6 months, there may be benefit in further intervention to ensure that those are sustained over time. However, the next stage of the analysis was to explore whether particular sub-groups of the eligible benefit claimants appear to benefit more or less from the Group Work course. Chapter 7 details the sub-groups included in the analysis, based on findings from the wider job search literature and international trials of Group Work, and presents findings from 3 key sub-groups where there is evidence of differential impact.
7. Differential impacts across participant sub-groups (Impact on Participants)
7.1. Overview
Eligibility for entry into the Group Work trial was that someone should be a claimant of Jobseeker’s Allowance (JSA), Employment Support Allowance (ESA), Universal Credit (UC) or Income Support (IS) (a lone parent with child(ren) aged 3 and over) who was struggling with their job search and/or feeling low or anxious and lacking in confidence about their job search abilities. This eligibility was based on findings from previous evaluations of Group Work outside of the UK which found the course to be particularly effective for those with mental health conditions and/or low levels of self-efficacy and job search confidence (see Knight et al., 2020b).
While the profile of the Group Work trial participants[footnote 65] reported on in Chapter 4 confirm that Work Coaches recruited substantial proportions of benefit claimants with these characteristics, there was nonetheless a range in terms of their baseline measures. This range enables an analysis of whether Group Work, in the UK context, worked differentially for those with different starting positions in terms of these characteristics. Based on previous evidence, the hypotheses were tested that the impact of Group Work – in terms of employment, job search capability and mental health – will be greatest for those with lower levels of self-efficacy and higher levels of mental health issues.
The analysis included a wide range of related measures, dividing course participants and the matched comparison group into:
- those with higher and lower general self-efficacy (GSE) at baseline
- those with suggested case level[footnote 66] depression at baseline versus those who did not (PHQ-9)
- those with suggested case level[footnote 67] anxiety at baseline versus those who did not (GAD-7)
- those with ‘likely depression’ or ‘poor wellbeing’ at baseline versus those who scored as having higher levels of wellbeing (World Health Organisation-5 Well-being Index (WHO-5))
- those who had better or worse perceptions about the latent and manifest benefits of work (Latent and Manifest Benefits (LAMB))
- those with low, medium and high levels of psychosocial deprivation and financial strain at baseline (LAMB sub-scales)
- those with higher versus lower job search self-efficacy at baseline (JSSE)
In addition to these sub-groups, the analysis also looked for differential impacts by:
- different benefit receipts at the point of randomisation (i.e. in receipt of/not in receipt of ESA; in receipt of/not in receipt of JSA; in receipt of/not in receipt of UC)
- length of unemployment at point of randomisation: in paid work within the past year; in paid work more than 12 months ago; or never in work. The hypothesis is that longer term unemployment will have negatively impacted on benefit claimants’ levels of confidence and wellbeing and, as a result, Group Work will be most effective among those who have been unemployed for longer
- age: 16 to 34; 35 to 49; or 50 plus at baseline: as Group Work may differentially benefit those in different age groups
- whether or not someone felt at the point of randomisation that their health was a constraint to them being in work[footnote 68], with the hypothesis being that those with health conditions will benefit more from Group Work than more general jobseekers
This sub-group analysis focused on a number of key binary[footnote 69] outcomes at 6 and 12 months after baseline:
- whether or not in paid work
- whether or not in paid work of 30 or more hours per week
- higher or lower levels of general self-efficacy
- higher or lower levels of job search self-efficacy
- higher versus lower perceived benefits of employment (LAMB)
- low versus medium/high score on psychosocial deprivation (LAMB)
- low versus medium/high score on financial strain (LAMB)
- whether likely depressed/poor wellbeing versus those with higher levels of wellbeing on the WHO-5 scale
- whether suggested case level depression versus not on PHQ-9 scale
- whether suggested case level anxiety versus not on GAD-7 scale
For all of the sub-groups, and all of the outcomes, the analysis tested for differential impacts (based on whether or not there is a significant interaction between participant/comparison and sub-group) for each outcome in turn. Given that this involves almost 350 tests, it is to be expected that this will generate a fairly large number of false positives (that is, spurious differences in impact across sub-groups[footnote 70]). So rather than report on all of the tests that reach significance, the focus in this chapter is on evidence of clear patterns across sub-groups.
From among all the sub-group analyses, a clear pattern emerged across the range of outcome measures, namely that, broadly in line with the international evidence, Group Work had the greatest impact among those with lower levels of general self-efficacy and higher levels of anxiety and depression. Among those with low levels of general self-efficacy or suggested case level anxiety at baseline, there are statistically significant, and positive, impacts at 6 months on being in paid work, on general and job search self-efficacy and on mental health. For both sub-groups, the work and self-efficacy outcomes were sustained at 12 months. The mental health outcomes were sustained for those low in general self-efficacy at baseline but not for those with suggested case level anxiety. There is a similar, but not so pronounced, pattern of statistically significant impacts among those with suggested case level depression at baseline.
No clear pattern emerged for the other sub-groups (i.e. by benefit receipt; length of unemployment; age; health constraints at baseline; job search self-efficacy; LAMB grouping). This Chapter therefore focuses on the 3 sub-groups where there are conclusive results.
Given previous evidence, there is a particular interest in looking at differential impacts across those with different lengths of unemployment and benefit duration. However, the sample sizes, especially among those unemployed for less than a year, were too small to be able to produce robust estimates. The administrative data gives much larger sample sizes, but only allows for benefit outcomes to be looked at, and for sub-groups defined in terms of the length of time on benefits rather than the length of unemployment. These is no evidence of differential impacts on benefit receipt by length of time on benefits prior to randomisation.
The 3 sub-groups where there are conclusive results (general self-efficacy, anxiety and depression) are related to one another, and to a considerable degree the sub-groups cover the same participants, this being particularly true for the PHQ-9 and the GAD-7. The correlation between PHQ-9 and GAD-7 scores for participants is very high at 0.83. The correlation between these 2 scores and general self-efficacy is lower (at 0.31 for PHQ-9 and 0.33 for GAD-7).
For the participants with either suggested case level depression or anxiety at baseline, 83% had both. Or, put another way, for those with suggested case level depression, 85% had case level anxiety, and for those with suggested case level anxiety, 78% had suggested case level depression.
The overlaps with general self-efficacy are less extreme. Nevertheless, for those with low self-efficacy at baseline, 53% had suggested case level depression and 59% had suggested case level anxiety. For those with higher self-efficacy at baseline, 32% had suggested case level depression and 34% had suggested case level anxiety.
7.2. Table format, statistical tests and p-values
The tables in this Chapter present the Impact on Participants (IoP) impact results for sub-groups. Each table presents the results for each outcome at 6 months after baseline and 12 months after baseline, with the sub-groups presented next to each other. For each survey wave and each sub-group, the tables show the percentage or mean score for those in the Group Work course participant group and for those in the matched comparison group.
Two sets of p-values are provided. The first set, labelled simply ‘p-value’, are based on a test of whether the difference between the course participant and matched comparison group percentages are different – that is, whether there is a significant impact within this sub-group. Where the differences between the participants and the matched comparison group are statistically significant (that is the p-value is less than 0.05), these are highlighted in red and with an asterisk. The term ‘statistically significant’ is often abbreviated in the text to ‘significant’. The text also includes discussion of impacts which are close to statistical significance using, as a rule of thumb, a p-value of less than 0.10. The commentary focuses on these set of tests.
The second set of p-values, labelled ‘p-value for differential impact’ are based on a test of whether the impact is significantly different between the 2 sub-groups[footnote 71]. For example, whether the impact on employment is greater for those starting with higher levels of self-efficacy than for those starting with lower levels of self-efficacy. Where the differences in impact are statistically significant, these are highlighted in blue and asterisked. These p-values are shown for completeness and are not commented on in the text.
7.3. Sub-group findings
7.3.1. Higher and lower levels of general self-efficacy at baseline
Table 7.1 shows the impact of Group Work on the subset of 6 and 12-month outcomes described in Section 7.1, dividing course participants and the matched comparison group into those with higher and lower levels of general self-efficacy at baseline.
Both 6 months and 12 months after baseline, course participants with lower baseline general self-efficacy had statistically significantly better outcomes than their matched comparison group. After 6 months, they were almost twice as likely to be in paid work (21% compared to 11%), and 4 times as likely to be in paid work of 30 hours a week or more (8% compared to 2%). They were more than twice as likely as their matched comparison group to have higher levels of general (46% compared to 18%) and job search self-efficacy (46% versus 19%) after 6 months. They were also statistically significantly less likely than the matched comparison group to score as having likely depression or poor wellbeing on the WHO-5 scale (57% compared to 83%) or suggested case level anxiety on the GAD-7 (46% compared to 67%). A very similar pattern of results is sustained 12 months after baseline, with continued statistically significant impacts. The only impact no longer statistically significant after 12 months is on paid work (although paid work of 30 hours or more remained so).
With the exception of the work outcomes, those with higher levels of baseline general self-efficacy had better 6 and 12-month outcomes than those with lower baseline levels (reflecting their baseline differences), whether a course participant or in the matched comparison group. However, among this sub-group, in contrast to those with lower baseline self-efficacy, Group Work appeared to have very little impact. The only 6-month outcome where a statistically significant impact is observed of Group Work among those with higher levels of baseline general self-efficacy is job search self-efficacy where 73% of the course participants and 58% of the matched comparison group scored as having higher levels.
There are no statistically significant impacts either among those with higher or lower levels of baseline general self-efficacy on levels of depression measured by the PHQ-9 or on the LAMB scales, although the percentage point differences are positive. Section 3.5 provides a commentary on the comparison between the WHO-5 and PHQ-9 scales, pointing to evidence that the WHO-5 scale is a more sensitive measure of depression.
Table 7.1: Impact of Group Work on outcomes by level of general self-efficacy at baseline: Impacts on Participants
At 6 month follow up:
| Higher self-efficacy: Participants | Higher self-efficacy: Comp’n group | Higher self-efficacy: p-value | Lower self-efficacy: Participants | Lower self-efficacy: Comp’n group | Lower self-efficacy: p-value | p-value for differential impact | ||
|---|---|---|---|---|---|---|---|---|
| Higher % better outcome: | ||||||||
| % in paid work | 19 | 21 | 0.72 | 21 | 11 | 0.044* | 0.128 | |
| % in paid work 30 hours or more | 12 | 14 | 0.71 | 8 | 2 | 0.030* | 0.002* | |
| % with higher general self-efficacy | 79 | 82 | 0.592 | 46 | 18 | <.001* | 0.001* | |
| % with higher job search self-efficacy | 73 | 58 | 0.024* | 46 | 19 | <.001* | <.001* | |
| % lower LAMB score | 51 | 61 | 0.23 | 35 | 34 | 0.98 | 0.019* | |
| % low LAMB psychosocial deprivation score | 41 | 49 | 0.29 | 28 | 19 | 0.164 | 0.025* | |
| % low financial LAMB deprivation score | 22 | 28 | 0.344 | 24 | 19 | 0.436 | 0.485 | |
| Lower % better outcome: | ||||||||
| % likely depression/poor wellbeing (WHO-5) | 37 | 30 | 0.38 | 57 | 83 | <.001* | <.001* | |
| % depression suggesting caseness | 21 | 19 | 0.668 | 41 | 50 | 0.222 | <.001* | |
| % anxiety suggesting caseness | 29 | 29 | 0.96 | 46 | 67 | 0.003* | 0.002* | |
| Base: all | 251 | 282 | 349 | 236 |
At 12 month follow up:
| Higher self-efficacy: Participants | Higher self-efficacy: Comp’n group | Higher self-efficacy: p-value | Lower self-efficacy: Participants | Lower self-efficacy: Comp’n group | Lower self-efficacy: p-value | p-value for differential impact | ||
|---|---|---|---|---|---|---|---|---|
| Higher % better outcome: | ||||||||
| % in paid work | 29 | 29 | 0.981 | 18 | 12 | 0.207 | 0.002* | |
| % in paid work 30 hours or more | 16 | 11 | 0.351 | 7 | 2 | 0.024* | <0.001* | |
| % with higher general self-efficacy | 82 | 85 | 0.632 | 41 | 19 | 0.002* | 0.012* | |
| % with higher job search self-efficacy | 69 | 71 | 0.82 | 46 | 18 | <0.001* | <0.001* | |
| % lower LAMB score | 53 | 64 | 0.163 | 36 | 32 | 0.605 | 0.001* | |
| % low LAMB psychosocial deprivation score | 46 | 47 | 0.972 | 26 | 18 | 0.286 | 0.001* | |
| % low financial LAMB deprivation score | 28 | 21 | 0.39 | 20 | 20 | 0.943 | 0.037* | |
| Lower % better outcome: | ||||||||
| % likely depression/poor wellbeing (WHO-5) | 37 | 31 | 0.401 | 59 | 75 | 0.040* | 0.001* | |
| % depression suggesting caseness | 23 | 19 | 0.585 | 41 | 51 | 0.188 | 0.023* | |
| % anxiety suggesting caseness | 33 | 22 | 0.101 | 45 | 67 | 0.007* | 0.002* | |
| Base: all | 215 | 192 | 285 | 159 |
Source: Survey data
7.3.2. Case level anxiety at baseline versus lower level anxiety
Table 7.2 divides course participants and the matched control group into those whose baseline scores on the GAD-7 suggest that they have or do not have case level (that is, their score would suggest they would probably be diagnosed as having) anxiety. Six months after baseline, the pattern of results for those with and without suggested case level anxiety is very similar to those with higher and lower levels of general self-efficacy.
Six months after baseline, course participants with suggested case level anxiety at baseline had statistically significantly better outcomes than their matched comparison group. One in 5 (20%) of course participants with case level baseline anxiety were in paid work compared to 10% of the matched comparison group (with the percentages in work of 30 hours a week or more 9 and 3%). They were around twice as likely as their matched comparison group to have higher levels of general self-efficacy (49% compared to 24%) and job search self-efficacy (46% versus 27%) after 6 months. They were also statistically significantly less likely than the matched comparison group to score as having likely depression or poor wellbeing on the WHO-5 scale (64% compared to 84%) or suggested case level anxiety on the GAD-7 (60% compared to 79%).
For those with suggested case level anxiety at baseline, although the percentage point differences are as wide as after 6 months, the impacts are close to (p=0.054) but no longer statistically significant on being in any paid work 12 months after baseline, likewise the impacts on mental health and wellbeing is not sustained. However, 12 months after baseline, among those with suggested case level baseline anxiety, course participants were significantly more likely to be in paid work of 30 hours or more and to have higher levels of general and job search self-efficacy.
With the exception of the work outcomes, those with lower levels of baseline anxiety had better 6 and 12-month outcomes than those with case level baseline anxiety (reflecting their baseline differences), whether a course participant or in the matched comparison group. However, among this sub-group, in contrast to those with case level anxiety levels at baseline, Group Work appeared to have very little impact. As with the higher general self-efficacy group, the only 6-month outcome showing a statistically significant impact of Group Work among those with lower levels of baseline anxiety is job search self-efficacy where 69% of the course participants and 44% of the matched comparison group scored as having higher levels of job search self-efficacy.
Again, although the percentage point differences between course participants and the matched comparison group are positive, there are no statistically significant impacts either among those with and without case level anxiety at baseline on levels of depression measured by the PHQ-9 or on the LAMB scales at 6 months or 12 months after baseline.
Table 7.2: Impact of Group Work on outcomes according to levels of anxiety at baseline: Impacts on Participants
At 6 month follow up:
| Case level anxiety: Participants | Case level anxiety: Comp’n group | Case level anxiety: p-value | Not case level anxiety: Participants | Not case level anxiety: Comp’n group | Not case level anxiety: p-value | p-value for differ’ial impact | |
|---|---|---|---|---|---|---|---|
| Higher % better outcome: | |||||||
| % in paid work | 20 | 10 | 0.023* | 21 | 23 | 0.641 | 0.030* |
| % in paid work 30 hours or more | 9 | 3 | 0.023* | 10 | 14 | 0.394 | 0.007* |
| % with higher general self-efficacy | 49 | 24 | <.001* | 70 | 65 | 0.505 | <.001* |
| % with higher job search self-efficacy | 46 | 27 | 0.004* | 69 | 44 | 0.001* | <.001* |
| % lower LAMB score | 27 | 34 | 0.366 | 56 | 62 | 0.405 | <.001* |
| % low LAMB psychosocial deprivation score | 22 | 23 | 0.863 | 45 | 40 | 0.521 | 0.005* |
| % low financial LAMB deprivation score | 20 | 20 | 0.97 | 27 | 25 | 0.758 | 0.224 |
| Lower % better outcome: | |||||||
| % likely depression/poor wellbeing (WHO-5) | 64 | 84 | <.001* | 33 | 32 | 0.89 | <.001* |
| % depression levels suggesting caseness | 51 | 59 | 0.254 | 14 | 11 | 0.433 | 0.001* |
| % anxiety levels suggesting caseness | 60 | 79 | 0.001* | 19 | 15 | 0.442 | 0.005* |
| Base: all | 289 | 290 | 300 | 230 |
At 12 month follow up:
| Case level anxiety: Participants | Case level anxiety: Comp’n group | Case level anxiety: p-value | Not case level anxiety: Participants | Not case level anxiety: Comp’n group | Not case level anxiety: p-value | p-value for differ’ial impact | |
|---|---|---|---|---|---|---|---|
| Higher % better outcome: | |||||||
| % in paid work | 24 | 13 | 0.054 | 22 | 25 | 0.561 | 0.13 |
| % in paid work 30 hours or more | 12 | 5 | 0.050* | 10 | 8 | 0.575 | 0.646 |
| % with higher general self-efficacy | 50 | 33 | 0.017* | 67 | 58 | 0.272 | 0.134 |
| % with higher job search self-efficacy | 48 | 27 | 0.004* | 66 | 59 | 0.401 | <0.001* |
| % lower LAMB score | 34 | 33 | 0.888 | 50 | 58 | 0.391 | 0.037* |
| % low LAMB psychosocial deprivation score | 25 | 25 | 0.961 | 44 | 37 | 0.434 | 0.039* |
| % low financial LAMB deprivation score | 17 | 17 | 0.89 | 29 | 24 | 0.413 | 0.005* |
| Lower % better outcome: | |||||||
| % likely depression/poor wellbeing (WHO-5) | 63 | 74 | 0.123 | 36 | 36 | 0.988 | 0.006* |
| % depression levels suggesting caseness | 50 | 58 | 0.298 | 16 | 13 | 0.453 | 0.021* |
| % anxiety levels suggesting caseness | 59 | 72 | 0.069 | 22 | 16 | 0.284 | 0.045* |
| Base: all | 247 | 198 | 247 | 156 |
Source: Survey data
7.3.3. Case level depression at baseline versus lower level depression
The final sub-group table (Table 7.3) divides course participants and the matched control group into those whose baseline scores on the PHQ-9 suggest that they have or do not have case level (that is, their score would suggest they would probably be diagnosed as having) depression.
There is little statistically significant evidence of Group Work having a differential impact on whether course participants were in paid work across those who did or did not have suggested case level depression at baseline. There were no statistically significant impacts 6 months after baseline or on the overall measure of ‘being in paid work’ after 12 months. Being in paid work of 30 hours or more a week was the one outcome for which there was a statistically significant impact among those with suggested case level baseline depression 12 months after baseline, with 12% working 30 or more hours a week compared to 3% of the comparison group.
With the exception of impact on paid work, the pattern of statistically significant results across those who do or do not have suggested case level baseline depression is very similar to those reported in Tables 7.1 and 7.2 which looked across those with higher and lower levels of self-efficacy and anxiety. Given the overlaps between the groups reported in Section 7.1, this is to be expected. Among those with suggested case level depression at baseline, there are statistically significant impacts – 6 and 12 months after baseline - on their levels of general and job search self-efficacy, depression/wellbeing (as measured by the WHO-5 scale) and anxiety (GAD-7). Twice as many course participants as those in the matched comparison group score reported having higher levels of general self-efficacy after 6 months (52% compared to 22%) and 12 months (50% compared to 32%). Similarly, nearly half (47%) of course participants with suggested case level baseline depression had higher levels of job search self-efficacy after 6 months compared to 20% of the matched comparison group, with the percentages after 12 months close to identical to those at 6 months. Two-thirds (65%) of those with suggested case level baseline depression scored as having higher depression/poor wellbeing after 6 months compared to 86% of the matched comparison group, with similarly statistically significant results after 12 months. Likewise, 60% of those with suggested case level baseline depression scored as having suggested case level anxiety after 6 months compared to 77% of the matched comparison group, again with statistically significant impacts sustained after 12 months.
As with the comparison between those with higher and lower levels of self-efficacy and anxiety, with the exception of the work outcomes, those with lower levels of baseline depression had better 6 and 12-month outcomes than those with suggested case level baseline depression (reflecting their baseline differences), whether a course participant or in the matched comparison group. However, again mirroring the findings from Tables 7.1 and 7.2, Group Work appeared to have very little impact on those who do not exhibit suggested case level baseline depression. The only 6-month outcome on which there is a statistically significant impact of Group Work among those with lower levels of baseline depression is job search self-efficacy where 69% of the course participants and 49% of the matched comparison group scored as having higher levels of job search self-efficacy. There are no statistically significant differences 12 months after baseline.
Again, there is no evidence of statistically significant impacts either among those with and without suggested case level depression at baseline on levels of depression measured by the PHQ-9 or on the LAMB scales at 6 or 12 months after baseline.
Table 7.3: Impact of Group Work on outcomes according to level of depression at baseline: Impacts on Participants
At 6 month follow up:
| Case level depression: Participants | Case level depression: Comp’n group | Case level depression: p-value | Not case level depression: Participants | Not case level depression: Comp’n group | Not case level depression: p-value | p-value for differ’ial impact | |
|---|---|---|---|---|---|---|---|
| Higher % better outcome: | |||||||
| % in paid work | 20 | 13 | 0.181 | 20 | 20 | 0.977 | 0.398 |
| % in paid work 30 hours or more | 10 | 5 | 0.178 | 9 | 12 | 0.592 | 0.22 |
| % with higher general self-efficacy | 52 | 21 | <.001* | 70 | 62 | 0.231 | <.001* |
| % with higher job search self-efficacy | 47 | 20 | <.001* | 69 | 49 | 0.005* | <.001* |
| % lower LAMB score | 28 | 36 | 0.337 | 52 | 57 | 0.528 | 0.007 |
| % low LAMB psychosocial deprivation score | 24 | 22 | 0.777 | 42 | 39 | 0.686 | 0.221 |
| % low financial LAMB deprivation score | 20 | 16 | 0.591 | 26 | 26 | 0.96 | 0.194 |
| Lower % better outcome: | |||||||
| % likely depression/poor wellbeing (WHO-5) | 65 | 86 | <.001* | 34 | 36 | 0.773 | <.001* |
| % depression levels suggesting caseness | 55 | 61 | 0.475 | 14 | 15 | 0.728 | 0.822 |
| % anxiety levels suggesting caseness | 60 | 77 | 0.007* | 22 | 22 | 0.967 | 0.001* |
| Base: all | 258 | 245 | 319 | 260 |
At 12 month follow up:
| Case level depression: Participants | Case level depression: Comp’n group | Case level depression: p-value | Not case level depression: Participants | Not case level depression: Comp’n group | Not case level depression: p-value | p-value for differ’ial impact | |
|---|---|---|---|---|---|---|---|
| Higher % better outcome: | |||||||
| % in paid work | 21 | 13 | 0.133 | 24 | 26 | 0.767 | 0.116 |
| % in paid work 30 hours or more | 12 | 3 | 0.016* | 11 | 9 | 0.669 | 0.231 |
| % with higher general self-efficacy | 50 | 32 | 0.021* | 69 | 55 | 0.118 | 0.028* |
| % with higher job search self-efficacy | 45 | 20 | <0.001* | 67 | 63 | 0.587 | <0.001* |
| % lower LAMB score | 32 | 29 | 0.745 | 52 | 56 | 0.635 | 0.001* |
| % low LAMB psychosocial deprivation score | 26 | 22 | 0.632 | 44 | 38 | 0.438 | 0.007* |
| % low financial LAMB deprivation score | 22 | 14 | 0.185 | 25 | 22 | 0.642 | 0.316 |
| Lower % better outcome: | |||||||
| % likely depression/poor wellbeing (WHO-5) | 64 | 79 | 0.037* | 37 | 36 | 0.836 | <0.001* |
| % depression levels suggesting caseness | 54 | 65 | 0.155 | 14 | 11 | 0.31 | 0.086 |
| % anxiety levels suggesting caseness | 57 | 74 | 0.045* | 23 | 17 | 0.273 | <0.001* |
| Base: all | 277 | 167 | 255 | 178 |
Source: Survey data
7.4. Concluding comments
The analysis of the differential impacts across different population sub-groups demonstrates that Group Work was more effective for those with lower levels of general self-efficacy and higher levels of anxiety and depression. There are a range of substantial and statistically significant impacts among these groups usually sustained 12 months after baseline. There is little statistically significant evidence of the course having a positive impact on those with better starting positions on these 3 measures and no evidence of negative impacts. The impacts are most consistent on course participants’ levels of self-efficacy, wellbeing and mental health, with positive but also inconsistent findings on the effects on being in paid employment. There are no statistically significant impacts on course participants’ levels of depression measured by the PHQ-9 (in contrast to the WHO-5 scale) or on their perceptions of the latent and manifest benefits of work (measured by the LAMB scales).
There are no consistent patterns of evidence that Group Work was differentially effective for course participants of different ages, baseline health statuses or benefit receipt. Limited sample sizes mean that it is not possible to robustly estimate the impact of Group Work among those with shorter or longer lengths of unemployment.
8. Concluding comments
The policy and practice implications of the findings from the impact evaluation are fully explored in the Synthesis Report (Knight et al., 2020b), where these findings are triangulated with those of the process evaluation and cost-benefit analysis. Low take-up of the Group Work course made it highly unlikely that statistically significant impacts could be identified across all those offered the course (as per the original Intention to Treat (ITT) design). However, under the Impact on Participants (IoP) analysis, where the 6 and 12 month outcomes of course participants are compared to a matched comparison group, there is some evidence of Group Work having an impact at 6 months. Although it did not appear to impact on employment rates, its ability to impact on mental health, levels of job search self-efficacy, participant confidence and a wider range of mental health and wellbeing outcomes suggests that the course is effective in these respects. Moreover, there is no evidence of Group Work having a negative impact on participants. However, as these positive impacts tend not to be sustained 12 months after baseline, it suggests that some further intervention might be required to capitalise on these early impacts.
A key finding from this evaluation is the differential impact that Group Work appeared to have on sub-groups of participants with different starting points. It was certainly most effective for those with lower levels of general self-efficacy and poorer mental health, where there are statistically significant impacts – importantly, often sustained after 12 months – on employment and mental health outcomes, including self-efficacy and wellbeing. Although this will no doubt give pause for thought about whether the course should be more targeted, it is important to consider whether the same impacts would have been found if the dynamics of the course were changed by having a greater proportion of attendees with these potential barriers to entry into work.
References
Birkin, R., and Meehan, M. (2004). Can the activity matching ability system contribute to employment assessment? An initial discussion of job performance and a survey of work psychologists’ views.
Dolan, P. (1997). Modelling valuations for EuroQol Health States. Medical Care, Vol 35, No. 11, pp 1095-1108.
Eden, D., and Aviram, A. (1993). Self-efficacy training to speed reemployment: Helping people to help themselves. Journal of Applied Psychology, 78(3), 352–360.
EuroQol Group (1990). EuroQol-a new facility for the measurement of health-related quality of life. Health Policy 16(3):199-208.
Henkel, V., Mergl, R., Kohnen R., Maier W., Möller H-J., and Hegerl, U. (2003) Identifying depression in primary care: a comparison of different methods in a prospective cohort study, BMJ 2003; 326
Hughes, M. E., Waite, L. J., Hawkley, L. C., and Cacioppo, J. T. (2004). A Short Scale for Measuring Loneliness in Large Surveys: Results From Two Population-Based Studies. Research on aging, 26(6), 655–672.
Jahoda, M. (1981) Work, employment, and unemployment: Values, theories, and approaches in social research. American Psychologist, 36(2), 184–191.
Kanfer, R., and Hulin, C. L. (1985). Individual differences in successful job searches following lay-off. Personnel Psychology, 38(4), 835–847.
Knight, T., Lloyd, R., Downing, C., Svanaes, S. and Coutts, A. (2021a) Group Work/JOBS II: Process Evaluation Technical Report, DWP Research Report No 989. London.
Knight, T., Lloyd, R., Rayment, M., Purdon, S., Bryson, C., Downing, C., Svanaes, S., Coutts, A., McKay, S. and Mukuria, C. (2021b) Group Work/JOBS II Project: Evaluation Synthesis Report, DWP Research Report No 991. London.
Kovacs, C., Batinic, B., Stiglbauer, B., and Gnambs, T. (2019) Development of a Shortened Version of the Latent and Manifest Benefits of Work (LAMB) Scale, European Journal of Psychological Assessment 35:5, 685-697
Labriola, M., Lund, T., Christensen, K. B., Albertsen, K., Bültmann, U., Jensen, J. N., and Villadsen, E. (2007). Does self-efficacy predict return-to-work after sickness absence? A prospective study among 930 employees with sickness absence for 3 weeks or more. Work: A Journal of Prevention, Assessment & Rehabilitation, 29(3), 233-8.
Levis, B., Benedetti, A., and Thombs, B. (2019) Accuracy of Patient Health Questionnaire-9 (PHQ-9) for screening to detect major depression: individual participant data meta-analysis, BMJ; 365:
Meehan M., Birkin R., Ruby K., and Moore-Purvis H. (Eds.) (2015) UK JOBS II: A Manual for Teaching People Successful Job Search Strategies. London: DWP. (The UK edition is a revision of Curran, J., Wishart, P., and Gingrich, J. (1999) JOBS: A Manual for Teaching People Successful Job Search Strategies. Ann Arbor, MI: University of Michigan).
Muller, J. J., Creed, P. A., Waters, L. E. and Machin, M. A. (2005) The development and preliminary testing of a scale to measure the latent and manifest benefits of employment. European Journal of Psychological Assessment, 21(3), 191–198.
Office for National Statistics (2019) Measuring national wellbeing: domains and measure.
Rayment, M., Knight, T., Lloyd, R., Purdon, S., Bryson, C. and McKay, S. (2021) Group Work/JOBS II: Cost Benefit Analysis Technical Report. DWP Research Report No 990. London.
Saks, A. M. and Ashforth, B. E. (1999). Effects of Individual Differences and Job Search Behaviors on the Employment Status of Recent University Graduates. Journal of Vocational Behavior, 54(2), 335-349.
Torgerson, D.J. and Roland, M. (1998) Understanding Controlled Trials: What Is Zelen’s Design? BMJ: British Medical Journal 316, no. 7131: 606.
Van Stolk, C., Hofman, J., Hafner, M., and Janta, B. (2014) Psychological wellbeing and work: Improving service provision and outcomes. Department for Work and Pensions and Department of Health: London, UK.
Vinokur, A.D., Price, R.H. and Schul, Y. (1995). Impact of the JOBS intervention on unemployed workers varying in risk for depression. American Journal of Community Psychology 23, 39-74.
Vuori, J., Silvonen, J., Vinokur, A. D. and Price, R.H. (2002). The Tyohon Job Search Program in Finland: Benefits for the Unemployed with Risk of Depression or Discouragement. Journal of Occupational Health Psychology 2002 Vol 7, No. 1, 5-19.
Vuori, J. and Tervahartiala, T. (1994). Active job search and subjective health among the unemployed. Studies in Labour Policy 91. Helsinki: Ministry of Labour.
Vuori, J. and Vesalainen, J. (1999). Labour market interventions as predictors of re-employment, job seeking activity and psychological distress among the unemployed. Journal of Occupational and Organizational Psychology, 72(4), 523-538.
Appendices
Appendix A: Derivation of the survey non-response weights
The impact estimates reported on in this document are mostly based on surveys of trial participants at baseline, 6-months and 12-months. All of these surveys were entirely voluntary and inevitably a fairly large percentage of people who were asked to take part declined to do so or could not be contacted. For example, as Figure 1 (Section 2.4) shows, for the control group 3,886 people were selected for the baseline survey but only 1,484 took part. Of these 648 completed the 6-month survey and 427 completed the 12-month survey. If non-respondents have different outcomes to respondents, then there is a risk of bias. The risk is particularly acute in the context of a Randomised Controlled Trial (RCT) because if the profile of non-respondents is different in the 2 arms of the trial then the estimates of impact will be biased.
To minimise the risk of bias in the Group Work II trial the survey data at 6 and 12 months have been weighted so that the profile of respondents closely matches the profile of all those randomised.
The data for non-response weighting comes from 2 sources:
- The questionnaire that was completed by all trial members at the time of randomisation. This includes a reasonably broad range of demographic information as well as some baseline outcomes, including age, gender, qualifications, tenure, the ONS wellbeing scales, and confidence in getting a job.
- Administrative data on benefit receipt and amount for all those randomised, at randomisation, 6-months after randomisation and 12-months after randomisation. Having this data at the 6 and 12 month allows for the non-response weights to take into account non-response bias that is correlated with post-randomisation outcomes as well as controlling for bias on outcomes and characteristics at the time of randomisation.
A single linked dataset was created that included randomisation questionnaire data and the benefits data.
To calculate non-response weights all those taking part in the 6-month survey and 12-month survey in the linked dataset were flagged. Given that not all survey respondents gave consent for data linking to benefits data, this necessitated the surveys being restricted to those giving consent (around 85% of the total). The remaining 15% had to be excluded from the analysis of impact.
The dataset was then divided into 3 groups: participants (n=2,596), decliners (n=9,304) and controls (n=4,293). For each group 2 non-response models were fitted to the data: a 6-month model and a 12-month model. The model in each instance was a logistic regression with a binary dependent variable set equal to one if the 6-month (or 12-month for the 12-month model) survey was completed. Each model generates a predicted probability score per person, interpreted as the probability of completing the survey. The non-response weight per survey respondent is then calculated as the inverse of this probability.
Given the number of independent variables available and the fact that many are correlated, the logistic regressions were fitted forward-stepwise. To avoid having outlier weights, very large or small weights were trimmed. That is, the weights above the 95th percentile were set equal to the weight at the 95th percentile, and the weights below the fifth percentile were set equal to the weight at the fifth percentile.
The independent variables used in each model were:
- gender
- age-group
- qualifications
- whether had the equivalent of a Grade C pass in both English and Maths at GCSE
- ONS wellbeing scores (binary versions)
- ‘success’: factors that individual feels help secure a job (job search effort, fixed effects; things outside my control or refused to answer)
- ‘confidence’: confidence of individual in finding a job
- ‘qualities’: whether agree or disagree that their personal qualities make it easy to get a job
- ‘experience’: whether agree or disagree that their experience is in demand
- ‘health’: self-perceived health
- whether have been to the GP in the 2 weeks before randomisation
- whether on Employment Support Allowance (ESA) at randomisation
- whether on ESA at 6-months
- whether on ESA at 12 months
- whether on Jobseeker’s Allowance (JSA) at randomisation
- whether on JSA at 6-months
- whether on JSA at 12 months
- whether on Income Support (IS) at randomisation
- whether on IS at 6-months
- whether on IS at 12 months
- whether on Universal Credit (UC) at randomisation
- whether on UC at 6-months
- whether on UC at 12 months
- whether on any of ESA/JSA/IS/UC at randomisation
- whether on any of ESA/JSA/IS/UC at 6-months
- whether on any of ESA/JSA/IS/UC at 12 months
- amount of benefits received per week at randomisation (categorised)
- amount of benefits received per week at 6 months (categorised)
- amount of benefits received per week at 12 months (categorised)
- length of time on benefits in the 3 years prior to randomisation (categorised)
- month and year of randomisation
The non-response weights gross the survey data to the total numbers within each group. For instance, the 6-month survey weights for participants gross the 609 survey respondents to the total of 2,596. This automatically puts the participants and decliners into their correct proportions (22% participants versus 78% decliners).
Appendix B: Balance between the 2 arms of the trial
This appendix compares the 2 arms of the trial, randomised to Group Work, and control, at 2 points in time. Firstly, Table B.1 compares the 2 arms at the randomisation stage for all those entered into the trial, for a range of variables collected either using the randomisation tool or available from DWP administrative sources. If the random allocation to the 2 groups worked as intended there would be few, if any, significant differences between the 2 groups. The p-values in the final column of Table B.1 demonstrate this to be the case.
Secondly, Table B.2 compares the 2 arms for those responding to the 6-month and 12-month surveys (after applying non-response weights). For this table balance is checked for a wider range of variables, including those collected as part of the baseline survey.
Balance between the 2 arms at randomisation
Table B.1: Differences between the participants and matched comparison groups at the randomisation stage: administrative and randomisation tool data
| Randomised to GW (%) | Control group (%) | p-value | |
|---|---|---|---|
| Gender | |||
| Male | 59 | 57 | 0.121 |
| Female | 41 | 43 | |
| Age | 0.621 | ||
| 16 to 24 | 14 | 14 | |
| 25 to 34 | 23 | 24 | |
| 35 to 49 | 33 | 32 | |
| 50 to 59 | 24 | 24 | |
| 60 to 65 | 6 | 7 | |
| Qualifications | 0.787 | ||
| Professional/work related | 11 | 11 | |
| University degree/tertiary qualification | 7 | 8 | |
| Diploma in higher education | 9 | 9 | |
| A/AS level/Scottish highers | 7 | 7 | |
| GCSE/Scottish Standard | 34 | 33 | |
| None of the above | 32 | 32 | |
| Not answered | 1 | 1 | |
| Achieved grade C or above for both English and Maths GCSE | |||
| Yes | 43 | 42 | 0.885 |
| No | 54 | 55 | |
| Not answered | 3 | 3 | |
| Length of time on benefits in the 3 years prior to randomisation | 0.47 | ||
| Up to 7 days | 6 | 6 | |
| 8 to 31 days | 7 | 7 | |
| 1 to 6 months | 28 | 28 | |
| 6 to 12 months | 16 | 16 | |
| One to 2 years | 15 | 15 | |
| Over 2 years | 28 | 28 | |
| Amount of benefit received (£ per week) for any of ESA, JSA, IS, UC | 0.747 | ||
| None | 2 | 2 | |
| Up to £60 | 13 | 13 | |
| >£60-£75 | 53 | 53 | |
| >£75-£100 | 14 | 14 | |
| >£100 | 18 | 18 | |
| Confidence in finding job | 0.248 | ||
| Confident will find a job | 58 | 59 | |
| Not confident will find a job | 42 | 41 | |
| ONS well-being measures (at randomisation) | |||
| Satisfaction: | 0.481 | ||
| Satisfied with life | 32 | 33 | |
| Other | 68 | 67 | |
| Life worthwhile: | 0.719 | ||
| Thinking life worthwhile | 44 | 44 | |
| Other | 56 | 56 | |
| Happiness: | 0.155 | ||
| Happy | 40 | 41 | |
| Other | 60 | 59 | |
| Anxiety: | 0.799 | ||
| Anxious | 23 | 23 | |
| Not | 77 | 77 | |
| Bases: | 11900 | 4293 |
Source: Administrative and randomisation data
Balance between the 2 arms for those responding to the surveys
One of the major complicating features of the Group Work design is that the baseline data was not collected at the same point in time for all 3 groups: participants, decliners and controls, nor was it collected in the same way for all 3 groups. For the participant group the baseline was collected via a paper questionnaire on Day 1 of the course, with the course start date being, on average just 20 days after randomisation (median=20 days, mean=38 days). For decliners and controls however, the baseline was collected via a telephone survey and, on average, almost 5 months after randomisation (median=145 days, mean=143 days). The follow-up surveys were then fixed at a uniform 6 and 12 months after baseline, although inevitably there is some variation around that.
The risk that the different baseline data collection mode, and the different baseline dates, generates is that when the participant and decliner group are combined into a single Group Work arm, they are not similar enough to the control group on the baseline data for the data to be analysed as a Randomised Controlled Trial (RCT). In practice, having applied non-response weights to the survey data (see Appendix A), the 2 arms of the trial do look to be very similar, in the sense that there are no statistically significant differences between them. Table B.1 demonstrates this for a range of demographic and outcome variables. The tables in Section 5.4 of the report show the same baseline differences for the 6-month respondents, although sometimes in more detail, for all of the outcomes reported on.
In light of the fact that the 2 arms are well-balanced, the survey data have been analysed as an RCT. (If the 2 arms had been found to be unbalanced, baseline differences would have had to be controlled for in the analysis).
Table B.2: Baseline differences between the 2 arms of the trial (after non-response weighting)
Those responding to 6-month survey:
| Randomised to GW | Control group | p-value | |
|---|---|---|---|
| Gender | 0.243 | ||
| Male | 60 | 57 | |
| Female | 40 | 43 | |
| Age | 0.989 | ||
| 16 to 24 | 13 | 13 | |
| 25 to 34 | 22 | 23 | |
| 35 to 49 | 33 | 32 | |
| 50 to 59 | 25 | 25 | |
| 60 to 65 | 7 | 7 | |
| Qualifications | 0.368 | ||
| Professional/work related | 9 | 11 | |
| University degree/tertiary qualification | 7 | 9 | |
| Diploma in higher education | 9 | 10 | |
| A/AS level/Scottish highers | 7 | 9 | |
| GCSE/Scottish Standard | 33 | 28 | |
| None of the above | 28 | 29 | |
| Not answered | 5 | 4 | |
| Achieved grade C or above for both English and Maths GCSE | 0.676 | ||
| Yes | 42 | 44 | |
| No | 51 | 50 | |
| Not answered | 8 | 7 | |
| Length of time on benefits in the 3 years prior to randomisation | 0.336 | ||
| Up to 7 days | 6 | 5 | |
| 8 to 31 days | 8 | 6 | |
| 1 to 6 months | 29 | 29 | |
| 6 to 12 months | 16 | 14 | |
| One to 2 years | 15 | 16 | |
| Over 2 years | 26 | 30 | |
| When last in work | 0.843 | ||
| In the 6 months before randomisation | 10 | 9 | |
| 6 to 12 months ago | 6 | 5 | |
| 1 to 2 years ago | 5 | 4 | |
| More than 2 years ago | 15 | 14 | |
| Can’t remember | 11 | 12 | |
| Never in paid work | 53 | 55 | |
| Amount of benefit received (£ per week) for any of ESA, JSA, IS, UC (at baseline): | 0.149 | ||
| None | 18 | 21 | |
| Up to £60 | 11 | 9 | |
| >£60-£75 | 45 | 41 | |
| >£75-£100 | 7 | 9 | |
| >£100 | 19 | 21 | |
| General self-efficacy scale (1 to 5) | 0.296 | ||
| Higher self-efficacy | 53 | 56 | |
| Lower self-efficacy | 47 | 44 | |
| Job search self-efficacy scale (1 to 5) | 0.386 | ||
| Higher job search self-efficacy | 48 | 51 | |
| Lower job search self-efficacy | 52 | 49 | |
| Confidence in finding job | 0.608 | ||
| Confident will find a job | 55 | 56 | |
| Not confident will find a job | 45 | 44 | |
| WHO-5 wellbeing | 0.368 | ||
| With likely depression/poor wellbeing | 59 | 61 | |
| Other | 41 | 39 | |
| ONS well-being measures (at baseline[footnote 72]) | |||
| Satisfaction: | 0.087 | ||
| Satisfied with life | 37 | 42 | |
| Other | 63 | 58 | |
| Life worthwhile: | 0.174 | ||
| Thinking life worthwhile | 43 | 47 | |
| Other | 57 | 53 | |
| Happiness: | 0.697 | ||
| Happy | 44 | 45 | |
| Other | 56 | 55 | |
| Anxiety: | 0.610 | ||
| Anxious | 33 | 34 | |
| Not | 67 | 66 | |
| Overall LAMB scale | 0.095 | ||
| Score 0-14 | 9 | 11 | |
| Score 15 to 29 | 33 | 31 | |
| Score 30 to 44 | 46 | 42 | |
| Score 45 to 60 | 12 | 16 | |
| LAMB psychosocial | 0.322 | ||
| Low | 32 | 32 | |
| Medium | 49 | 45 | |
| High | 19 | 23 | |
| LAMB financial strain | 0.936 | ||
| Low | 19 | 19 | |
| Medium | 35 | 34 | |
| High | 46 | 47 | |
| PHQ-9 depression | 0.422 | ||
| Depression suggesting caseness | 45 | 47 | |
| Other | 55 | 53 | |
| GAD-7 anxiety | 0.241 | ||
| Anxiety suggesting caseness | 51 | 54 | |
| Other | 49 | 46 | |
| Bases: | 1496 | 533 |
Those responding to 12-month survey:
| Randomised to GW | Control group | p-value | |
|---|---|---|---|
| Gender | 0.583 | ||
| Male | 59 | 61 | |
| Female | 41 | 39 | |
| Age | 0.851 | ||
| 16 to 24 | 14 | 13 | |
| 25 to 34 | 22 | 24 | |
| 35 to 49 | 33 | 31 | |
| 50 to 59 | 24 | 24 | |
| 60 to 65 | 6 | 8 | |
| Qualifications | 0.585 | ||
| Professional/work related | 8 | 12 | |
| University degree/tertiary qualification | 9 | 9 | |
| Diploma in higher education | 10 | 12 | |
| A/AS level/Scottish highers | 8 | 7 | |
| GCSE/Scottish Standard | 31 | 29 | |
| None of the above | 29 | 26 | |
| Not answered | 5 | 5 | |
| Achieved grade C or above for both English and Maths GCSE | 0.879 | ||
| Yes | 42 | 43 | |
| No | 50 | 49 | |
| Not answered | 8 | 7 | |
| Length of time on benefits in the 3 years prior to randomisation | 0.267 | ||
| Up to 7 days | 7 | 5 | |
| 8 to 31 days | 8 | 6 | |
| 1 to 6 months | 32 | 29 | |
| 6 to 12 months | 14 | 13 | |
| One to 2 years | 15 | 14 | |
| Over 2 years | 25 | 33 | |
| When last in work | 0.07 | ||
| In the 6 months before randomisation | 10 | 5 | |
| 6 to 12 months ago | 5 | 3 | |
| 1 to 2 years ago | 5 | 4 | |
| More than 2 years ago | 14 | 13 | |
| Can’t remember | 14 | 18 | |
| Never in paid work | 52 | 56 | |
| Amount of benefit received (£ per week) for any of ESA, JSA, IS, UC (at baseline): | 0.886 | ||
| None | 20 | 21 | |
| Up to £60 | 9 | 10 | |
| >£60-£75 | 44 | 40 | |
| >£75-£100 | 8 | 8 | |
| >£100 | 19 | 21 | |
| General self-efficacy scale (1 to 5) | 0.163 | ||
| Higher self-efficacy | 53 | 57 | |
| Lower self-efficacy | 47 | 43 | |
| Job search self-efficacy scale (1 to 5) | 0.346 | ||
| Higher job search self-efficacy | 49 | 53 | |
| Lower job search self-efficacy | 51 | 47 | |
| Confidence in finding job | 0.607 | ||
| Confident will find a job | 55 | 53 | |
| Not confident will find a job | 45 | 47 | |
| WHO-5 wellbeing | 0.507 | ||
| With likely depression/poor wellbeing | 59 | 57 | |
| Other | 41 | 43 | |
| ONS well-being measures (at baseline[footnote 72]) | |||
| Satisfaction: | 0.087 | ||
| Satisfied with life | 37 | 43 | |
| Other | 63 | 57 | |
| Life worthwhile: | 0.216 | ||
| Thinking life worthwhile | 45 | 49 | |
| Other | 55 | 51 | |
| Happiness: | 0.152 | ||
| Happy | 44 | 49 | |
| Other | 56 | 51 | |
| Anxiety: | 0.837 | ||
| Anxious | 33 | 32 | |
| Not | 67 | 68 | |
| Overall LAMB scale | 0.288 | ||
| Score 0-14 | 8 | 11 | |
| Score 15 to 29 | 32 | 31 | |
| Score 30 to 44 | 47 | 42 | |
| Score 45 to 60 | 13 | 16 | |
| LAMB psychosocial | 0.309 | ||
| Low | 29 | 31 | |
| Medium | 52 | 46 | |
| High | 19 | 23 | |
| LAMB financial strain | 0.737 | ||
| Low | 18 | 18 | |
| Medium | 35 | 33 | |
| High | 47 | 49 | |
| PHQ-9 depression | 0.916 | ||
| Depression suggesting caseness | 46 | 46 | |
| Other | 54 | 54 | |
| GAD-7 anxiety | 0.272 | ||
| Anxiety suggesting caseness | 51 | 55 | |
| Other | 49 | 45 | |
| Bases: | 1020 | 362 |
Source: Survey data except for benefit receipt which is based on administrative data
Appendix C: Generating the matched comparison samples for participants
Chapter 6 of the report compares outcomes for participants with those of a matched comparison group to generate estimates of Impacts on Participants. The matched comparison group is essentially a weighted version of the control group, with the purpose being to generate a weighted sample that, at baseline, has a very similar profile to the participants. The matched comparison group is then assumed to give an estimate of the counterfactual for participants, with any significant difference in 6- and 12-month outcomes for the participant and matched comparison groups being evidence of impact.
Three matched comparison groups have been generated:
4. Matched comparison group for the 6-month survey participants.
5. Matched comparison group for the 12-month survey participants.
6. Matched comparison group for the participants in the Department for Work and Pensions (DWP) administrative dataset.
For all 3, the matched comparison group was generated using propensity score matching, the main steps of which are:
- the probability (or propensity) of an individual being in the participant group (rather than the control group) is estimated from a logistic regression model of the data. The binary outcome variable in the model is the group (1=participant; 0=control), and the predictors are all the characteristics and outcomes collected at randomisation or baseline
- the control group is then weighted so that the distribution of propensity scores in the control group is the same as in the participant group
The technical details of the matching undertaken are as follows:
- the logistic regression model was fitted within SPSS with forward stepwise selection of variables
- the weights for the control group were calculated as inverse propensity weights (i.e. p/1-p). Control group members that are very similar to participants, and hence have a high propensity score are given a large weight; control group members that are dissimilar to participants, and hence have a low propensity score are given a small weight
- extreme weights (below or above the 2nd and 98th percentiles) were trimmed
In principle the Impact on Participants (IoP) estimates could have been generated using a regression-based approach (that is, controlling for baseline differences in a regression model) rather than propensity score matching. However, this would involve running separate regression models for each outcome in turn. Given that there are a large number of outcomes, and they are of different types (binaries, ordinal, categorical, and continuous) all of which need differently specified models, this was judged not a practical option. However, regressions were run on a small number of outcomes to check that the conclusions on impact were broadly the same irrespective of method. This proved to be the case, although the propensity score estimates seemed to be more consistent across correlated outcomes (where the same pattern of impact would be expected) and hence seemed more stable.
The survey-based matched comparison groups
The matching variables included in the survey propensity score models were:
- demographic characteristics: age; gender; whether has a partner; qualifications
- employment and benefit history: benefit receipt at randomisation; benefit receipt at baseline; amount of benefits (£ per week) in receipt of at randomisation; amount of benefits in receipt of baseline; length of time on benefits in the 3 years prior to randomisation; summary of work history prior to randomisation
- job search efficacy/confidence at baseline: General self-efficacy (binary); job search self-efficacy (binary)
- well-being and Latent And Manifest Benefits (LAMB) baseline scores: ONS well-being scores (binary); LAMB (grouped); LAMB psychosocial (grouped); LAMB financial strain (grouped); UCLA score (binary); self-reported health
- mental health at baseline: World Health Organisation-5 Well-being Index (WHO-5) (binary and grouped); PHQ-9 score (binary and grouped); GAD-7 score (binary and grouped)
Ideally work status at baseline would have been included in the list of matching variables, but unfortunately it was not collected for the trial participants. Given that those doing some paid work can still take up Group Work the comparison group was not reduced to those not in employment at baseline.[footnote 73] Overall, 10% of the matched comparison groups were found to be in paid work at baseline.
A complication for the propensity score matching for the survey respondents is that the control group data has non-response weights attached to it (see Appendix A). These weights adjust for non-response bias observable in randomisation and baseline variables, but even adjusting for these there is evidence that those having moved off benefits at 6 and 12 months were less likely to respond to the 6 or 12 month surveys. Consequently, the control data non-response weights have been calculated to adjust for bias in randomisation, baseline, and in 6/12 month outcomes.
However, propensity score matching has to be restricted to controlling for differences between participants and the control group in terms of randomisation and baseline differences only and not on 6/12 month outcomes. The risk associated with this is that the matched comparison group carries over the (now uncontrolled for) bias on the 6 and 12 month outcomes. To avoid this risk a synthetic version of the control group was generated in advance of the propensity score matching. This synthetic control group is an expanded version of the control group, where each individual case is expanded out a number of times, with the expansion factor being equal to the non-response weight. So, if for instance, a control group member has a non-response weight of 3, they will be replicated 3 times in the synthetic control group. (In practice weights are seldom integers, so a random number between -0.5 and +0.5 was added to each weight and then rounded to the nearest integer.) Once completed, the synthetic control group has the same profile as the standard control group with its non-response weights, and, importantly the bias on the 6 and 12 month outcomes is controlled for. The propensity score model is then fitted using the synthetic control group rather than the standard control group.
A reasonable test of whether the propensity score matching has generated a good matched comparison group is simply to compare the profiles of the 2 groups: participant and matched comparison. The matching is judged to have been successful if there are no statistically significant differences between the 2 groups on any of the matching variables – which is the case. Table C.1 shows the profile of the 2 groups at 6 and 12 months.
Table C.1: Baseline differences between the participants and matched comparison groups: survey data
Those responding to 6-month survey:
| Participants | Matched comparison group | p-value | |
|---|---|---|---|
| Gender | 0.847 | ||
| Male | 63 | 64 | |
| Female | 37 | 36 | |
| Age | 0.992 | ||
| 16-24 | 8 | 8 | |
| 25-34 | 18 | 19 | |
| 35-49 | 33 | 34 | |
| 50-59 | 32 | 31 | |
| 60-65 | 9 | 8 | |
| Qualifications | 0.717 | ||
| Professional/work related | 12 | 9 | |
| University degree/tertiary qualification | 7 | 9 | |
| Diploma in higher education | 7 | 6 | |
| A/AS level/Scottish highers | 9 | 7 | |
| GCSE/Scottish Standard | 33 | 33 | |
| None of the above | 28 | 31 | |
| Not answered | 4 | 5 | |
| Achieved grade C or above for both English and Maths GCSE | 0.7 | ||
| Yes | 41 | 38 | |
| No | 54 | 55 | |
| Not answered | 5 | 7 | |
| Length of time on benefits in the 3 years prior to randomisation | 0.922 | ||
| Up to 7 days | 4 | 4 | |
| 8-31 days | 7 | 5 | |
| 1-6 months | 25 | 23 | |
| 6-12 months | 16 | 17 | |
| One to 2 years | 17 | 17 | |
| Over 2 years | 32 | 34 | |
| When last in work | 0.8 | ||
| In the 6 months before randomisation | 9 | 7 | |
| 6-12 months ago | 6 | 5 | |
| 1-2 years ago | 7 | 9 | |
| More than 2 years ago | 21 | 18 | |
| Can’t remember | 6 | 5 | |
| Never in paid work | 51 | 56 | |
| Amount of benefit received (£ per week) for any of ESA, JSA, IS, UC | 0.449 | ||
| None | 2 | 3 | |
| Up to £60 | 10 | 7 | |
| >£60-£75 | 65 | 63 | |
| >£75-£100 | 6 | 9 | |
| >£100 | 17 | 19 | |
| General self-efficacy scale (1 to 5) | 0.368 | ||
| Higher self-efficacy | 42 | 46 | |
| Lower self-efficacy | 58 | 54 | |
| Job search self-efficacy scale (1 to 5) | 0.823 | ||
| Higher job search self-efficacy | 31 | 31 | |
| Lower job search self-efficacy | 69 | 69 | |
| Confidence in finding job | 0.469 | ||
| Confident will find a job | 50 | 54 | |
| Not confident will find a job | 50 | 46 | |
| ONS well-being measures (at baseline[footnote 74]) | |||
| Satisfaction: | 0.436 | ||
| Satisfied with life | 27 | 30 | |
| Other | 73 | 70 | |
| Life worthwhile: | 0.794 | ||
| Thinking life worthwhile | 36 | 37 | |
| Other | 64 | 63 | |
| Happiness: | 0.896 | ||
| Happy | 38 | 38 | |
| Other | 62 | 62 | |
| Anxiety: | 0.621 | ||
| Anxious | 31 | 29 | |
| Not | 69 | 71 | |
| Overall LAMB scale | 0.981 | ||
| Score 0-14 | 3 | 3 | |
| Score 15 to 29 | 38 | 38 | |
| Score 30 to 44 | 52 | 51 | |
| Score 45 to 60 | 7 | 7 | |
| LAMB psychosocial | 27 | 30 | 0.658 |
| Low | 58 | 54 | |
| Medium | 14 | 16 | |
| High | |||
| LAMB financial strain | 0.768 | ||
| Low | 14 | 14 | |
| Medium | 42 | 39 | |
| High | 44 | 47 | |
| WHO-5 wellbeing | 0.33 | ||
| With likely depression/poor wellbeing | 54 | 59 | |
| Other | 46 | 41 | |
| PHQ-9 depression | 0.928 | ||
| Depression suggesting caseness | 44 | 45 | |
| Other | 56 | 55 | |
| GAD-7 anxiety | 0.771 | ||
| Anxiety suggesting caseness | 49 | 50 | |
| Other | 51 | 50 | |
| Bases: | 609 | 533 |
Those responding to 12-month survey:
| Participants | Matched comparison group | p-value | |
|---|---|---|---|
| Gender | 0.467 | ||
| Male | 61 | 65 | |
| Female | 39 | 35 | |
| Age | 0.999 | ||
| 16-24 | 8 | 9 | |
| 25-34 | 18 | 17 | |
| 35-49 | 34 | 34 | |
| 50-59 | 32 | 31 | |
| 60-65 | 8 | 8 | |
| Qualifications | 0.81 | ||
| Professional/work related | 8 | 9 | |
| University degree/tertiary qualification | 9 | 7 | |
| Diploma in higher education | 8 | 6 | |
| A/AS level/Scottish highers | 7 | 7 | |
| GCSE/Scottish Standard | 36 | 34 | |
| None of the above | 28 | 30 | |
| Not answered | 5 | 8 | |
| Achieved grade C or above for both English and Maths GCSE | 0.164 | ||
| Yes | 42 | 37 | |
| No | 53 | 51 | |
| Not answered | 6 | 12 | |
| Length of time on benefits in the 3 years prior to randomisation | 0.852 | ||
| Up to 7 days | 5 | 4 | |
| 8-31 days | 6 | 4 | |
| 1-6 months | 28 | 26 | |
| 6-12 months | 13 | 14 | |
| One to 2 years | 15 | 17 | |
| Over 2 years | 33 | 35 | |
| When last in work | 0.829 | ||
| In the 6 months before randomisation | 7 | 5 | |
| 6-12 months ago | 5 | 4 | |
| 1-2 years ago | 6 | 7 | |
| More than 2 years ago | 18 | 15 | |
| Can’t remember | 8 | 9 | |
| Never in paid work | 56 | 60 | |
| Amount of benefit received (£ per week) for any of ESA, JSA, IS, UC | 0.385 | ||
| None | 3 | 3 | |
| Up to £60 | 10 | 8 | |
| >£60-£75 | 65 | 60 | |
| >£75-£100 | 7 | 11 | |
| >£100 | 16 | 19 | |
| General self-efficacy scale (1 to 5) | 0.243 | ||
| Higher self-efficacy | 43 | 50 | |
| Lower self-efficacy | 57 | 50 | |
| Job search self-efficacy scale (1 to 5) | 0.383 | ||
| Higher job search self-efficacy | 31 | 35 | |
| Lower job search self-efficacy | 69 | 65 | |
| Confidence in finding job | 0.372 | ||
| Confident will find a job | 49 | 54 | |
| Not confident will find a job | 51 | 46 | |
| ONS well-being measures (at baseline[footnote 74]) | |||
| Satisfaction: | 0.3 | ||
| Satisfied with life | 29 | 33 | |
| Other | 71 | 67 | |
| Life worthwhile: | 0.841 | ||
| Thinking life worthwhile | 38 | 37 | |
| Other | 62 | 63 | |
| Happiness: | 0.935 | ||
| Happy | 37 | 38 | |
| Other | 63 | 62 | |
| Anxiety: | 0.527 | ||
| Anxious | 32 | 29 | |
| Not | 68 | 71 | |
| Overall LAMB scale | 0.945 | ||
| Score 0-14 | 2 | 2 | |
| Score 15 to 29 | 35 | 33 | |
| Score 30 to 44 | 55 | 57 | |
| Score 45 to 60 | 8 | 8 | |
| LAMB psychosocial | 23 | 25 | 0.575 |
| Low | 61 | 56 | |
| Medium | 16 | 19 | |
| High | |||
| LAMB financial strain | 0.492 | ||
| Low | 13 | 16 | |
| Medium | 43 | 37 | |
| High | 43 | 46 | |
| WHO-5 wellbeing | 0.767 | ||
| With likely depression/poor wellbeing | 54 | 55 | |
| Other | 46 | 45 | |
| PHQ-9 depression | 0.877 | ||
| Depression suggesting caseness | 46 | 45 | |
| Other | 54 | 55 | |
| GAD-7 anxiety | 0.641 | ||
| Anxiety suggesting caseness | 50 | 52 | |
| Other | 50 | 48 | |
| Bases: | 510 | 362 |
Source: Survey data expect for benefit receipt which is based on administrative data
The administrative-data matched comparison groups
The propensity score matching using the administrative data was restricted to a narrower set of matching variables, simply because there is no baseline data for most of the control group members in this dataset. So in this instance a much fuller range of randomisation variables were used, as well as benefit receipt variables:
- demographic characteristics: age; gender; qualifications; whether achieved Grade C in both English and Maths at GCSE, tenure
- benefit history: benefit receipt at randomisation; benefit receipt at baseline; amount of benefits (£ per week) in receipt of at randomisation; amount of benefits in receipt of baseline; length of time on benefits in the 3 years prior to randomisation
- job search efficacy/confidence indicators at randomisation:
- ‘success’: factors that individual feels help secure a job (job search effort, fixed effects; things outside my control or refused to answer)
- ‘confidence’: confidence of individual in finding a job
- ‘qualities’: whether agree or disagree that their personal qualities make it easy to get a job
- ‘experience’: whether agree or disagree that their experience is in demand
- well-being: ONS well-being scores (binary); the 4 LAMB randomisation questions (entered as linear terms)[footnote 75]; self-reported health
For the administrative data there is no defined baseline date for most of the control group, so a pseudo-start date was generated for each member of the control group. This was achieved by imputing a randomly selected course start date for a participant who was randomised in the same month as the control group member. The rationale for generating the pseudo-start date is that it allows for a matched comparison group to be generated with the same benefit profile as the participants at the time they started the course, rather than at randomisation. Behind this is an expectation that participants will be drawn from the pool of people who were eligible at randomisation and who still considered themselves in need to help with job search by the time the course began (around 3 weeks after randomisation). The pseudo-start date allows for the generation of a matched comparison group who, based on their benefits receipt on that date, appear to be in a similar level of need. Table C.2 shows the profile of the 2 administrative data groups after matching.
Table C.2: Pseudo-start date differences between the participants and matched comparison groups: administrative data
| Participants | Matched comparison group | p-value | |
|---|---|---|---|
| Gender | 0.968 | ||
| Male | 63 | 63 | |
| Female | 37 | 37 | |
| Age | 0.999 | ||
| 16-24 | 9 | 9 | |
| 25-34 | 18 | 17 | |
| 35-49 | 34 | 34 | |
| 50-59 | 31 | 32 | |
| 60-65 | 8 | 8 | |
| Qualifications | 0.526 | ||
| Professional/work related | 11 | 11 | |
| University degree/tertiary qualification | 7 | 8 | |
| Diploma in higher education | 7 | 8 | |
| A/AS level/Scottish highers | 8 | 6 | |
| GCSE/Scottish Standard | 34 | 33 | |
| None of the above | 32 | 34 | |
| Not answered | 1 | 1 | |
| Achieved grade C or above for both English and Maths GCSE | 0.862 | ||
| Yes | 43 | 42 | |
| No | 54 | 55 | |
| Not answered | 3 | 3 | |
| Length of time on benefits in the 3 years prior to randomisation | 1 | ||
| Up to 7 days | 4 | 4 | |
| 8-31 days | 6 | 6 | |
| 1-6 months | 24 | 24 | |
| 6-12 months | 15 | 15 | |
| One to 2 years | 16 | 16 | |
| Over 2 years | 35 | 35 | |
| Amount of benefit received (£ per week) for any of ESA, JSA, IS, UC | 0.176 | ||
| None | 2 | 2 | |
| Up to £60 | 10 | 10 | |
| >£60-£75 | 55 | 54 | |
| >£75-£100 | 14 | 13 | |
| >£100 | 19 | 21 | |
| Confidence in finding job | 0.875 | ||
| Confident will find a job | 56 | 55 | |
| Not confident will find a job | 44 | 45 | |
| ONS well-being measures (at randomisation) | |||
| Satisfaction: | 0.586 | ||
| Satisfied with life | 30 | 30 | |
| Other | 70 | 70 | |
| Life worthwhile: | 0.39 | ||
| Thinking life worthwhile | 42 | 41 | |
| Other | 58 | 59 | |
| Happiness: | 0.83 | ||
| Happy | 39 | 39 | |
| Other | 61 | 61 | |
| Anxiety: | 0.612 | ||
| Anxious | 21 | 22 | |
| Not | 79 | 78 | |
| Bases: | 2,596 | 4,293 |
Source: Administrative and randomisation data
The use of the matched comparison groups in the sub-group analysis
Although the propensity score matching used to generate the matched comparison groups for the IoP analysis works well for the whole participant group, in the sense that there are no statistically significant differences between the participants and the matched comparison groups on the matching variables, there were some differences between the 2 groups when looking at individual sub-groups. Normally a bespoke matched comparison group would be generated per sub-group, again using propensity score matching, but the small sample sizes within sub-groups make this difficult. Instead, for sub-groups, the ‘all-participant’ matched comparison group was used but adjusting for any baseline differences in the outcome of interest using a logistic regression. That is, a propensity-score-weighted logistic regression was fitted with a 6 or 12-month binary outcome as the dependent variable, and group (participant/comparison) and the baseline version of the outcome as control variables. The odds ratio associated with the comparison group was then used to generate an adjusted comparison group estimate for the sub-group.
Appendix D: Correlation matrix at 6 months for outcomes collected as continuous variables
| Job search self-efficacy | General self- efficacy | WHO-5 | ONS satisfaction | ONS life worthwhile | ONS happiness | ONS anxiety | GAD-7 | PHQ-9 | EQ-5D value | EQVAS | LAMB overall | LAMB psychosocial deprivation | LAMB financial strain | UCLA loneliness | |
|---|---|---|---|---|---|---|---|---|---|---|---|---|---|---|---|
| Job search self-efficacy | 1 | -0.61 | 0.53 | 0.57 | 0.57 | 0.58 | -0.19 | -0.52 | -0.54 | 0.45 | 0.45 | -0.3 | -0.28 | -0.13 | -0.37 |
| General self- efficacy | 1 | -0.63 | -0.58 | -0.59 | -0.59 | 0.25 | 0.6 | 0.59 | -0.45 | -0.44 | 0.35 | 0.33 | 0.12 | 0.45 | |
| WHO-5 | 1 | 0.69 | 0.68 | 0.71 | -0.31 | -0.67 | -0.7 | 0.54 | 0.57 | -0.41 | -0.36 | -0.25 | -0.5 | ||
| ONS satisfaction | 1 | 0.86 | 0.8 | -0.22 | -0.67 | -0.71 | 0.55 | 0.59 | -0.43 | -0.37 | -0.28 | -0.55 | |||
| ONS life worthwhile | 1 | 0.79 | -0.2 | -0.64 | -0.7 | 0.53 | 0.57 | -0.44 | -0.4 | -0.23 | -0.52 | ||||
| ONS happiness | 1 | -0.26 | -0.71 | -0.73 | 0.55 | 0.58 | -0.39 | -0.35 | -0.24 | -0.51 | |||||
| ONS anxiety | 1 | 0.37 | 0.32 | -0.26 | -0.19 | 0.27 | 0.27 | 0.06 | 0.26 | ||||||
| GAD-7 | 1 | 0.88 | -0.61 | -0.55 | 0.41 | 0.37 | 0.23 | 0.55 | |||||||
| PHQ-9 | 1 | -0.64 | -0.59 | 0.44 | 0.39 | 0.24 | 0.58 | ||||||||
| EQ-5D value | 1 | 0.57 | -0.3 | -0.26 | -0.19 | -0.37 | |||||||||
| EQVAS | 1 | -0.32 | -0.27 | -0.22 | -0.42 | ||||||||||
| LAMB overall | 1 | 0.96 | 0.27 | 0.47 | |||||||||||
| LAMB psychosocial deprivation | 1 | 0 | 0.43 | ||||||||||||
| LAMB financial strain | 1 | 0.2 | |||||||||||||
| UCLA loneliness | 1 |
-
Claimants of Jobseeker’s Allowance (JSA), Employment Support Allowance (ESA), Universal Credit Full Services (UC) and Income Support (IS) (Lone Parents with child(ren) aged 3 and over). ↩
-
Randomisation is applied before any potential beneficiaries are informed of the possibility of participating in the intervention. ↩
-
For some outcomes, the baseline measure was collected at the point of randomisation. For others, they were collected for course participants on day 1 of the course and for course decliners and the control group in a survey collected some months after the participant baseline. ↩
-
As measured by the World Health Organisation Five (WHO-5) Index. However, there was no statistically significant difference in the take-up using the Patient Health Questionnaire-9 (PHQ-9) depression scale. ↩
-
For a binary outcome of around 50%. ↩
-
Again, for a binary outcome around 50%. ↩
-
Using either survey measures of employment or administrative data on benefit receipt. ↩
-
Note the discussion of the apparent statistically significant finding on anxiety in Section 5.4.4. ↩
-
See Chapter 3 for more detail on these measures. ↩
-
Using administrative data to look at benefit receipt, 6 months after randomisation, course participants were statistically significantly more likely (85% compared to 83%) to be in receipt of these benefits than those in the matched comparison group. However, 12 months after randomisation, this statistically significant difference had disappeared. ↩
-
A person is described as having suggested case level anxiety if their score on the GAD-7 scale suggests they would exceed the ‘caseness thresholds’ used by Improved Access to Psychological Therapies. Diagnosis of anxiety would be based on a clinical interview and would take account of additional evidence, to which the GAD score may contribute. Please see Chapter 3, Section 3.5 for more details. ↩
-
See chapter 3 for a description of the measures. ↩
-
Using the LAMB scale, see Chapter 3 for further description of this measure. ↩
-
See footnote 10 for definition of suggested case level anxiety ↩
-
A person is described as having suggested case level depression if their scores on the Patient Health Questionnaire (PHQ-9) scales suggest they would exceed the ‘caseness thresholds’ used by Improved Access to Psychological Therapies. Diagnoses of depression would be based on a clinical interview and would take account of additional evidence, to which the PHQ scores may contribute. Please see Chapter 3, Section 3.5 for more details. ↩
-
For some outcomes, the baseline measure was collected at the point of randomisation. For others, they were collected for course participants on day 1 of the course and for course decliners and the control group in a survey collected some months after the participant baseline. ↩
-
The mastery outcome was a composite measure taking into account scores on self-efficacy, self-esteem and internal control orientation. It was designed to be a measure of someone’s emotional and practical ability to cope and take on particular situations. ↩
-
Defined in the Finnish context as being employed in a job not subsidised by the state or running their own business. ↩
-
This unequal allocation was to ensure sufficient numbers participated in Group Work. ↩
-
See Chapter 3 for a full description of the outcomes collected at each stage. ↩
-
There was an additional survey among course participants conducted on the last day of the course. Findings on changes in outcomes from the baseline (for course participants, day 1 of the course) to the end of the course (day 5) are included in the Process Report (Knight et al., 2020a) alongside participants’ perceptions of the course. ↩
-
For a binary outcome of around 50%. ↩
-
Again, for a binary outcome around 50%. ↩
-
Asked at baseline but high levels of missing data among participants means that we cannot use this variable. ↩
-
The randomisation questionnaire included 4 of the items from the LAMB scale. ↩
-
See: Psychological Therapies A guide to IAPT data and publications. ↩
-
It is important to note that a clinical diagnosis of anxiety or depression would take into account a number of factors, rather than rely on a single screening tool. See: Psychological Therapies A guide to IAPT data and publications. ↩
-
As measured by the World Health Organisation Five (WHO-5) Wellbeing Index. However, there was no statistically significant difference in the take-up using the Patient Health Questionnaire-9 (PHQ-9) depression scale. ↩
-
Defined as those who attended at least one day of the course. ↩
-
Once the survey data has been weighted, which puts the participants and decliners into their correct proportions, it is possible to estimate the take-up rate across all baseline survey variables. ↩
-
The benefits included were Jobseeker’s Allowance (JSA), Employment and Support Allowance (ESA), Income Support (IS), Universal Credit (UC), Disability Living Allowance (DLA), Carer’s Allowance, State Retirement Pension, Pension Credit, Widow’s Benefit and Bereavement Benefit. The numbers in the final 4 from this list are very small and have not been included in Table 4.2. ↩
-
The assumption is that with random allocation the profile of the 2 arms will be very similar, and that any difference in outcomes can be attributed to Group Work, other explanations for differences being ruled out. In practice, the non-response to the surveys on each arm could lead to profile differences, but the non-response weights deal with this as far as is feasible. ↩
-
As described in Section 2.4, the baseline data collection was carried out some time after randomisation, with the baseline for the decliners and control group being several months after the baseline for participants. The baseline for participants was collected on Day 1 of the course; the baseline data collection for the decliners and control groups was collected by IFF via a telephone survey. The 2 main reasons for the delay for the decliners and control group were (a) because of the time taken to establish which of the Group Work arm could be assumed decliners, and (b) because a letter had to be sent to those in the decliner and control samples offering a chance to opt out of the surveys. ↩
-
Course participants were not asked if they were doing any paid work at the baseline so unable to provide figures for the intervention group. ↩ ↩2 ↩3
-
Those working 30 or more hours a week are a subset of all those in paid work. ↩ ↩2 ↩3
-
Not included baseline comparison data on work earnings and satisfaction given lack of data for participants. ↩ ↩2 ↩3
-
The mean monetary value includes those not on any benefit (i.e. their claim is £0), so the drop in mean monetary value is driven by a drop in the proportion of benefit claimants. ↩
-
For comparability, the control group for the participants is restricted to those who were out of work at the time of the baseline survey. ↩
-
The participant baseline survey (completed on paper) contains high levels of missing data on the job search activity questions and it was therefore not possible to report on baseline job search activity. ↩ ↩2 ↩3
-
It is not known whether people were in any paid work at the point of randomisation (although all were in receipt of benefits). So, the proportions citing confidence in finding a job at this point may include some already in work. Conversely, these people were not asked the question about confidence at the 6 and 12 month follow ups. ↩ ↩2 ↩3
-
Note those doing voluntary work were not asked about their confidence in finding work. ↩ ↩2 ↩3
-
For life satisfaction, feeling worthwhile and happiness, a higher mean score denotes a more positive outcome while for anxiety, a higher score denotes greater anxiety. ↩ ↩2 ↩3
-
That is, the negative psychological associations with not working. ↩
-
On the LAMB scale a score of 0 to 3 indicates low financial strain, 4 to 7 medium financial strain, and 8 to 10 high financial strain. On this basis, 6.1 and 6.4 are both at the higher end of the ‘medium’ group, so while statistically significant, this impact is not sufficient on average to move individuals into a different category of financial strain. ↩
-
Via a regression. ↩
-
Whereas impacts for percentages are usually presented as simple percentage point differences, impacts for means are usually presented in terms of the difference between the means for the 2 groups (intervention and control) divided by the overall standard deviation. This is termed an ‘effect size’. ↩
-
A difference that was not statistically significant. ↩
-
A regression analysis does suggest that the decliners have lower prevalence of GAD-7 caseness at 6-months than similar people in the control group, and it is this curious result that is driving the overall ITT estimate of impact. ↩
-
Given that the offered Group Work and control group are very well matched on a range of other health and wellbeing measures, and the fact that there were no significant differences at the 6 and 12 month surveys, it is believed that this statistically significant difference in the EQVAS baseline scores are due to differences in the way that the data were collected among course participants (on Day 1 of the course) and decliners/control group (by telephone). ↩
-
As measured by the WHO-5, but not replicated as statistically significant with the PHQ-9. ↩
-
With participants defined as those who attended at least one day of the course. ↩
-
The impact analysis is restricted to survey respondents who consented for their administrative data to be linked to their survey responses. ↩
-
For a binary outcome of around 50%. ↩
-
Again, for a binary outcome around 50%. ↩
-
The more standard acronyms for the impact on participants are ATT (Average Treatment Effect on the Treated), or IoT (Impact on the Treated), but IoP has been used for clarity in this report. ↩
-
The bases for these percentages are all participants and all in the matched comparison group, rather than only those in paid work. ↩
-
Participants were not asked if they were doing any paid work at the baseline. ↩ ↩2 ↩3
-
Baseline comparison data on work satisfaction and earnings were not included due to lack of data for participants. ↩ ↩2 ↩3
-
The mean monetary value includes those not on any benefit (i.e. their claim is £0), so the drop in mean monetary value is driven by a drop in the proportion of benefit claimants. ↩
-
The participant baseline survey (completed on paper) contains high levels of missing data on the job search activity questions and we are therefore unable to report on baseline job search activity. ↩ ↩2 ↩3
-
For life satisfaction, feeling worthwhile and happiness, a higher mean score denotes a more positive outcome while for anxiety, a higher score denotes greater anxiety. ↩ ↩2 ↩3
-
Whereas impacts for percentages are usually presented as simple percentage point differences, impacts for means are usually presented in terms of the difference between the means for the 2 groups (intervention and control) divided by the overall standard deviation. This is termed an ‘effect size’. ↩
-
It is important to note that a clinical diagnosis of anxiety or depression would take into account a number of factors, rather than rely on a single screening tool. ↩
-
This statistically significant difference at baseline is likely an anomaly cause by differences in the data collection mode for course participants and the comparison group at baseline. It is not in line with other similar measures such ONS satisfaction levels asked at randomisation. ↩
-
With participants defined as those who attended at least one day of the course. ↩
-
A person is described as having suggested case level depression if their score on the PHQ-9 scale suggests they would exceed the ‘caseness thresholds’ used by Improved Access to Psychological Therapies. Diagnosis of depression would be based on a clinical interview and would take account of additional evidence, to which the PHQ score may contribute. Please see Section 3.5 for more details. ↩
-
A person is described as having suggested case level anxiety if their score on the GAD-7 scale suggests they would exceed the ‘caseness thresholds’ used by Improved Access to Psychological Therapies. Diagnosis of anxiety would be based on a clinical interview and would take account of additional evidence, to which the GAD score may contribute. Please see Section 3.5 for more details. ↩
-
Trial participants were asked in the randomisation survey about issues which constrained their ability to find work. ↩
-
Although the propensity score matching used to generate the matched comparison group for the Impact on Participants (IoP) analysis works well for the whole participant group, in the sense that there are no statistically significant differences between the participants and the matched comparison group on the matching variables, there are inevitably some differences between the 2 groups when a sub-group is filtered on. Normally a bespoke matched comparison group would be generated per sub-group, again using propensity score matching, but the small sample sizes within sub-groups make this difficult. Instead the ‘all-participant’ matched comparison group has been used but adjusted for any baseline differences in the outcome of interest using a logistic regression. This necessitates reducing the outcomes to binaries. ↩
-
There are multiple occasions where an impact is significant for a sub-group for just one outcome, but not on other correlated outcomes and these have been set aside. ↩
-
A test of a significant interaction. ↩
-
Tables in the main body of the report use the ONS scores collected at randomisation. ↩ ↩2
-
Unfortunately, the impacts on work for participants are very sensitive to this assumption. If the comparison group excluded all those in paid work at baseline, fewer of the matched comparison group would be in paid work at 6 and 12 months, and the impact on participants would be estimated to be several percentage points larger. ↩
-
Tables in the main body of the report use the ONS scores collected at randomisation. ↩ ↩2
-
The 4 LAMB statements included at randomisation were: I rarely engage in social activities with people I don’t know; I seldom meet new people; My income usually allows me to do the things I want; My income usually allows me to socialise as often as I like. ↩