Part 4 – Setting metrics and targets to measure and manage climate-related risk
Updated 23 September 2022

© Crown copyright 2022
This publication is licensed under the terms of the Open Government Licence v3.0 except where otherwise stated. To view this licence, visit nationalarchives.gov.uk/doc/open-government-licence/version/3 or write to the Information Policy Team, The National Archives, Kew, London TW9 4DU, or email: psi@nationalarchives.gov.uk.
Where we have identified any third party copyright information you will need to obtain permission from the copyright holders concerned.
This publication is available at https://www.gov.uk/government/publications/aligning-your-pension-scheme-with-the-taskforce-on-climate-related-financial-disclosures-recommendations/part-4-setting-metrics-and-targets-to-measure-and-manage-climate-related-risk
What this section will cover:
- an introduction to metrics and their role in aligning with TCFD
- minimum legal requirements Trustees must meet when adopting metrics and targets
- the availability of data
- things to consider when selecting metrics and targets
- Outcome Metrics and Process Metrics
- a selection of core and additional metrics for trustees to use (Appendix A)
- examples of targets trustees could set
Metrics and Targets
Key considerations
- metrics have a role to play in activities throughout the pension scheme’s investment decision-making process to measure, manage and disclose climate risk
- target-setting is a useful tool for trustee boards to track their efforts to reduce climate change risk exposure and maximise climate change investment opportunities. Targets should be embedded in governance processes, so that trustees measure their performance against them
- trustees should select both: (a) outcome metrics (measuring the climate change risks and impacts of their investments, such as greenhouse gas emissions); and (b) process metrics – those reflecting governance processes for managing exposure to climate change
- the government is consulting on draft Regulations which would require trustees of pension schemes in scope to calculate and report on certain climate-related metrics. This guidance sets out a number of recommended metrics for getting started, minimum legal requirements and (for leaders) additional reporting – across a variety of asset classes
- all trustees should obtain data on portfolio carbon footprinting, exposure to carbon-related assets, and from their asset manager, information about the share of their portfolio in which climate change is actively considered, including through engagement and voting
1. Introduction to metrics
1. The TCFD report included a recommendation that pension scheme trustees report publicly the metrics they use to govern their fund’s climate change risk exposure. The Taskforce’s report went into further detail about the kind of metrics asset owners should use in line with this recommendation, covering both the fund’s contribution to climate change, including through exposure to carbon-intensive industries, and activities trustees have undertaken to reduce this exposure.
2. In this chapter, the guidance lays out the rationale for disclosure and use of metrics, the current and future status of requirements to update and disclose relevant metrics and targets dependent on scheme size, and provides detail of the sorts of metrics all trustees should consider embedding within their risk governance processes.
2. Role of metrics and targets – measure, manage and disclose
3. Metrics and targets have a role to play in activities throughout the pension scheme’s investment decision-making process, from setting investment beliefs to choosing an asset manager that aligns with these; and from measuring exposure to climate change risks and opportunities, through to setting targets to reduce or increase certain types of exposure and monitoring progress against these targeted outcomes.
4. It is important that the metrics incorporated by the trustees are tailored according to their relevance to the scheme. Calculating and reporting metrics and targets should not be seen as focused solely on disclosing a number to members. It should also be used to measure and manage climate change risk exposure and determine, monitor and update investment strategies accordingly.
5. Trustees can use the information obtained through calculating metrics in a number of ways to inform their investment decision-making:
- trustees should feed metrics data into their investment strategy and risk management processes where financially material
- trustees may also engage with their asset manager(s) and investee companies to focus efforts on the highest greenhouse gas (GHG) emitting firms or the most carbon-intense funds within the portfolio
- investor engagement may directly lead to a company changing its behaviour and improve transition alignment in the interests of investors
3. Minimum legal requirements
6. Trustees have fiduciary and statutory duties to consider and report on how they take into account the financially material risks associated with climate change (see Part I of this guidance).
7. Subject to consultation and Parliamentary approval, regulations will come into force on 1 October 2021 requiring trustees of schemes in scope of the measures to undertake the following activities.
Metrics
Trustees would be required to select:
- a minimum of 2 emissions-based metrics, one of which must be an absolute measure of emissions and one which must be an intensity-based measure of emissions
- a minimum of one other metric to assess the climate-related risks and opportunities which are relevant to the scheme’s assets
Trustees would be required on an annual basis and as far as they are able to:
- obtain the scope 1, scope 2 and scope 3 greenhouse gas emissions of the scheme’s assets
- obtain the data required to calculate their other selected metric or metrics
- use the data obtained to calculate their selected emissions-based and other metrics (see Appendix A); and
- use the metrics they have calculated to identify and assess the climate-related risks and opportunities which are relevant to the scheme
Targets
Trustees would be required to:
- set a minimum of one target for the scheme in relation to at least one of the metrics which they have selected to calculate; and
- on an annual basis and as far as they are able, measure the performance of the scheme against the target, or targets, which they have set and determine whether to retain or replace the target(s) having taken into account the scheme’s performance
4. Expectation by scheme size
8. Regardless of differences in legal requirements, schemes of all sizes carrying out TCFD-aligned reporting should set metrics whatever the nature of benefits offered by a scheme or its time horizons. However, the number and range of metrics they select and the comprehensiveness of their reporting will necessarily vary by scheme size.
9. All schemes should obtain data either from their asset managers or from an independent third party source on exposure to carbon-related assets, carbon foot-printing and engagement. They should analyse that data, and use it to inform decision-making, as well as aggregating the data to an asset class-, fund- or portfolio-level and report it. It is recognised that data needs to come not just from the asset manager but from listed companies, real-asset holders and national governments, sometimes via specialist data providers. In the absence of such data being forthcoming trustees can request that service providers analyse their funds using independent source data, or market average techniques and assumption-based modelling.
10. For schemes which carry out their own engagement and/or voting, schemes should set metrics to assess and report on the extent and effectiveness of those activities. Larger schemes may wish to carry out some of the other activities listed under additional metrics, in the annex, to demonstrate leadership.
5. Availability of Data
11. The lack of available data is a commonly reported pitfall when schemes seek to calculate the TCFD’s recommended metrics. Few, if any, trustees will be able to obtain full underlying data to inform the calculation of metrics or scenario analysis across their entire portfolio in the first instance. Where trustees are able to obtain data but only at a cost they believe to be disproportionately high or only in a format that will require significant further work before it is usable, they may make the decision to treat this data as unobtainable.
12. Pension schemes are internationally diversified, and some jurisdictions will have fewer disclosure requirements for the foreseeable future. However, the number of firms voluntarily committing to TCFD reporting is increasing[footnote 1] and more and better data is becoming available.
13. The statutory requirement for trustees of the largest schemes to comply ‘as far as they are able’ will enable them to produce outputs from scenario analysis and calculations of metrics and targets for only part of the portfolio or using estimation or incomplete data sets. This will still be decision-useful information for trustees. The urgency of climate change means that the trustees cannot wait until it has ‘perfect’ data before it starts putting it to use.
14. Where gaps in data do exist it should be regarded as preferable for trustees to use modelling or estimation to fill them, rather than to leave them unaddressed. Beginning with estimated or proxy data can help identify carbon-intensive hotspots in lending and investment portfolios, and serves as a benchmark for asset-specific data points as and when they become available.
15. In circumstances where the company or asset manager does not report energy use and emissions data for its operations or a particular fund, trustees could use third-party data providers. Trustees may also find this approach generally preferable to ensure consistency of data procurement. Trustees may also utilise proxy data where direct measurement is not possible.
16. For example, where you cannot find data for a specific asset class in which you are invested it may be possible to acquire sector averages and make estimations based on that.
17. Where incomplete data-sets exist for quantitative metrics, additional metrics which do not rely on quantitative data can be used to supplement them when assessing risk. Examples of such metrics are found in the Appendix A.
18. Trustees may also choose to only calculate metrics and set targets for the sections of their portfolio for which reliable data can be found and it may be proportionate to measure at a fund level rather than at an individual company level. Trustees can request that service providers analyse their funds using market average techniques and assumption-based modelling.
6. Selection of metrics
19. The metrics that trustees select to measure their exposure to climate change as a risk to their investments should be dependent on the characteristics of the scheme. But trustees should also look to link their metrics and targets to their investment beliefs and Statement of Investment Principles (SIP).
20. Trustees’ choice of metrics can also include both outcome metrics (see 6.1) – those measuring the climate change risks and impacts of their investments, such as greenhouse gas emissions – and process metrics (see 6.2) – those reflecting governance processes for managing exposure to climate change.
21. Trustees should take into the account the availability and reliability of data when choosing metrics against which to report. Where there are assessments that trustees can make now, even with limited data, they should make them on the basis of the best data available. Re-evaluation of assessments initially made on the basis of comparatively less data may be a legitimate mitigating factor for re-framing of future targets. Moreover, this re-evaluation may be an important means by which to set more challenging targets which may formerly have been determined conservatively.
22. Where possible, schemes should request and collate data in line with the asset class schedules listed in the Appendix A and also at an overall fund level. There are 2 levels of metrics to be collected:
- Core Reporting –these are the metrics that it is reasonable for all schemes to report on
- Additional Reporting – these are the metrics that the largest schemes with greater governance capacity can consider to demonstrate leadership
6.1. Outcome metrics – GHG emissions and others
23. The level of greenhouse gas (GHG) emissions is the key outcome metric by which pension schemes can measure their current transition risk, as well as being the most straightforward. There are difficulties in doing this with some asset classes such as sovereign debt but this is one of the most effective metrics – albeit backward-looking – through which trustees can assess their exposure to climate change.
24. A figure for total carbon emissions (in CO2e) enables trustees to set a baseline for climate action and to understand the climate impact of their investments. Without measuring a clear baseline, trustees are left blind when assessing scenarios and defining their climate targets.
25. An intensity measure uses the Total Carbon Emissions figure and weights it to take account of the size of the investment made. Carbon footprint per million (£ million) invested, the most typical measure, tells trustees how many tonnes of CO2 emissions their investments fund. It can be applied to the company, sector or portfolio level and is useful for internal and external comparative purposes. Different intensity-based metrics are possible by attributing the GHG emissions of the issuer to the investor based on its ownership, either normalised for the size of the investment and/or the company market size.
26. Appendix A provides detail of the different measures trustees can use to assess the GHG emissions associated with their scheme.
27. Some metrics, such as carbon footprint and weighted average carbon intensity (WACI), are better designed to determine a scheme’s exposure to high carbon industries and therefore their exposure to transition to a lower-carbon global economy. These metrics adjust for portfolio value, making comparison much easier with other schemes between equity and fixed income, and between external managers within asset classes.
28. Intensity measure provides an overview of carbon risk across listed equities and corporate bonds that can be monitored year on year. By repeating this exercise, trustees can discover consistent patterns and key emitting companies, that have the potential to be reduced through targeted engagement. This approach promotes both consistency and comparability between pension schemes. It could also be helpful in providing the basis for additional identification of collaborative engagement opportunities, which may be relevant for the purposes of optimising and ultimately delivering on process metrics and targets.
29. However, given that these metrics use a scheme’s proportional share of equity, an increase in share prices, all else equal, will result in a decrease in the scheme’s emissions per £ million invested.
30. Basic metrics, including absolute GHG emissions are more effective in communicating contribution to climate change but they are more difficult to translate into exposure to risk because they will generally fluctuate with changes in investment allocations, or the increase or decline of pension scheme assets.
31. Trustees will need to understand the distinction between an issuer’s direct GHG emissions (Scope 1 and 2) and, where appropriate, indirect GHG emissions (Scope 3):
- Scope 1 – All direct emissions from the activities of an organisation or under their control. Including fuel combustion on site such as gas boilers, fleet vehicles and air-conditioning leaks
- Scope 2 – Indirect emissions from electricity purchased and used by the organisation. Emissions are created during the production of the energy which is eventually used by the organisation
- Scope 3 – All other indirect emissions from activities of the organisation, occurring from sources that they do not directly control. These are sometimes the greatest share of a carbon footprint, covering emissions associated with business travel, procurement, production of inputs, use of outputs, waste and water. Whilst these are not directly within organisations’ control, the emissions are highly sensitive to the decisions issuers make – for example, the outputs they produce, the supply chains they choose and where they opt to locate their business
32. GHG emission calculations should be in line with the GHG Protocol[footnote 2] methodology to allow for aggregation and comparability across asset classes and funds and between schemes.
6.2. Process metrics – governance, stewardship and voting
33. Some outcome metrics enable a trustee or manager to measure their climate change risk and opportunity exposure; process metrics allow them to disclose how they are managing that exposure.
34. Appendix A lists out a number of metrics that can be disclosed as part of core and additional reporting. Broadly, process metrics rely much less on detailed disclosures from others in the investment chain. However, key process metrics such as voting and stewardship records do require information to be passed from asset managers to trustees in order that schemes can disclose their record to members.
35. Trustees can still report the extent to which they engage with issuers on climate change, the extent to which the trustee board takes account of climate change risk and the weight given to climate change in discussions and mandate-setting with their managers without disclosure of full voting and stewardship records to schemes. However, as with outcome metrics, where pension schemes align better with TCFD and ask meaningful questions of their service providers, it should drive improved reporting by asset managers and other intermediaries.
6.3. Selecting Metrics
36. Implementing metrics in line with the TCFD recommendations will help trustees meet forthcoming regulatory requirements around managing climate related risks.
37. Subject to consultation and approval by Parliament, regulations will come into force on 1 October 2021. Trustees can consider the following approaches to metrics based on whether or not they are in scope of the requirements. These are simply guideline examples and where it is proportionate and reasonable to do so trustees should feel encouraged to use additional metrics, regardless of the category their scheme falls into.
| Starting out (not in scope of proposed 2021 legal duties) | Basic: - select one core process metric which does not require quantitative data Moderate: - additionally, select one core outcome metric. Tip: Focus on an absolute emission metric (for example, Total Carbon Emissions in CO2e) where the data may be more easily obtainable and usable. Lots of companies will disclose this information in their annual accounts which can be found on company websites. Where companies do not disclose this information try to obtain proxy data such as averages for the sector the company sits in. Proxy data for metrics which are generally more easily obtainable are also likely to be derived from a more statistically robust base. |
|---|---|
| Good Practice (in scope of proposed 2021 legal duties) | - select 2 (core outcome) emissions-based metrics, one of which must be an absolute measure of emissions (for example, Total Carbon Emissions in CO2e) and one which must be an intensity based measure of emissions (for example, Carbon Footprint) and obtain emissions data as far as trustees are able - additionally, select one (core outcome or core process) other metric (for example, implied temperature rise). |
| Best Practice (in scope of proposed 2021 legal duties) | - select 2 (core outcome) emissions-based metrics, one of which must be an absolute measure of emissions (for example, Total Carbon Emissions) and one which must be an intensity based measure of emissions (for example, Carbon footprint including Scope 3) - obtain emissions data for less straightforward asset classes. Market leaders should look to increase the percentage of assets they get emissions data for - additionally, select one or more (core outcome) other metrics (for example, a portfolio alignment metric, calculated using the Transition Pathway Initiative (TPI) tool[footnote 3]) - select one or more core process based metrics. Larger schemes have much more capacity for engagement with issuers and so should consider measuring it |
7. Targets
38. In addition to establishing metrics, the TCFD report recommends that pension scheme trustees should set quantitative targets for managing climate-related financial risks and opportunities, including time frames for reaching these targets.
39. Target-setting is a useful tool for trustee boards to track their efforts to reduce climate change risk exposure and maximise climate change investment opportunities. Targets should be embedded in governance processes, so that trustees can hold managers and consultants to account for performance against their prescribed objectives. Quantification of commitments, including those made within the Statement of Investment Principles, as targets and key performance indicators (KPIs) not only consolidates a trustee board’s management of climate-related risk but signals to members that schemes consider it to be of sufficient importance to commit in the form of accountable targets.
40. Many listed companies and several pension schemes are beginning to set targets and commitments in relation to climate change, including committing to Net Zero carbon emissions by 2050. Schemes should assess how relevant such commitments are to their funds and build in milestones in the nearer term, setting a clear plan as to how they hope to meet short and medium-term targets.
41. Several benchmarks are publicly available for many of the metrics introduced in this guidance. MSCI produce a free directory of Weighted Average Carbon Intensity for 20 indexes[footnote 4].
7.2. Selecting Targets
| Starting out (not in scope of proposed 2021 legal duties) | Action - maintain a target for a core process metric - measure performance against the target(s) set Examples - percentage of votes against management at companies where there is failure to implement expected climate risk management measures (for example, disclosure in line with TCFD, analysis of company resilience in a 2°temperature rise scenario) - number of conversations/engagements between pension scheme and its asset managers analysing/discussing their voting on ESG matters |
|---|---|
| Good Practice (in scope of proposed 2021 legal duties) | Action - maintain a target for a core outcome emissions-based metric, and another metric - measure performance against the target(s) set Examples Emissions-based - reduction in the carbon footprint of your investment portfolio Other - a X°C reduction in the implied temperature rise of your portfolio |
| Best Practice (in scope of proposed 2021 legal duties) | Action - maintain targets for both core outcome emissions-based metrics, one of which must be an absolute measure of emissions (for example, Total Carbon Emissions) and one which must be an intensity based measure of emissions (for example, Carbon Footprint including Scope 3) - maintain targets for one other core outcome metric (for example, Implied temperature rise) - maintain a target for one process based metric - measure performance against the target(s) set Examples Emissions-based - a reduction in the carbon footprint of your portfolio or of a particular asset class / sector represented in their portfolio - a X% reduction in the total greenhouse gas emissions attributable to your investment portfolio Other - outcome - a X°C reduction in the implied temperature rise of your portfolio - process – Engagement – a X% increase in the number of engagements with high carbon emitters (on-going, closed successful or closed with restrictions) on emission reduction targets aligned with the Paris Agreement - a % increase in the proportion of engagements where positive progress is evidenced - an improvement of the scheme’s TPI score |
Appendix A – List of Metrics
Core Metrics
The metrics that follow in this section are all recommended. There are also others which schemes can enlist to manage their climate-related financial risk. This section covers core metrics, which all trustees should seek to collect.
Listed equity and Corporate Debt
Data availability is greater here than in other asset classes such as private equity/debt or sovereign bonds, although it may still be limited in certain jurisdictions.
Outcome Metrics
Emissions intensity -based
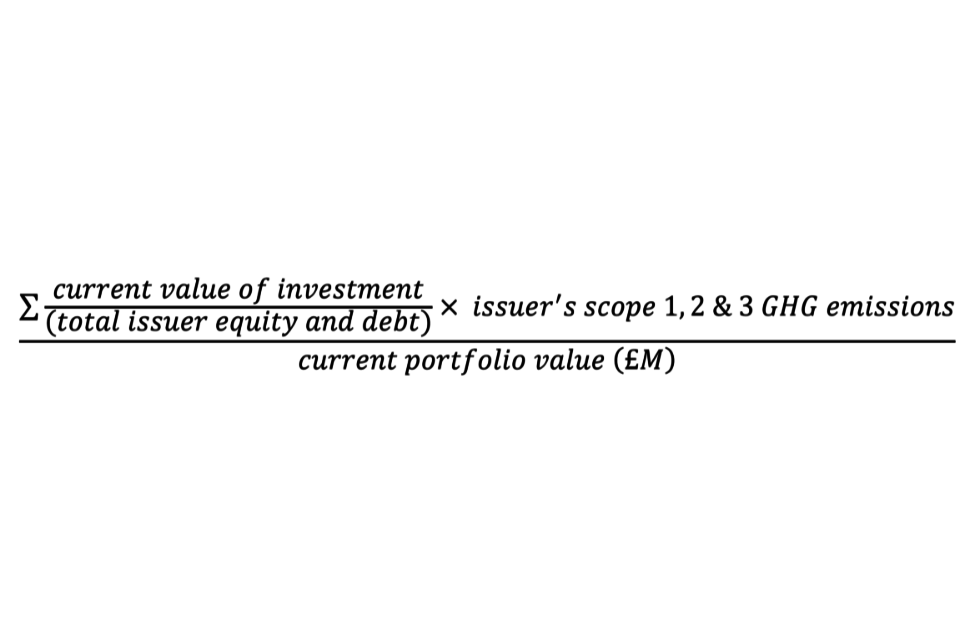
Carbon Footprint
Risk Type: Transition
Dependencies: Company Disclosure
Carbon footprint, the most typical intensity measure, tells trustees how many tonnes of CO2e emissions each million (£ million) they invest causes.
""
(∑(current value of investment / total issuer equity and debt) × issuer’s scope 1,2 & 3 GHG emission) / current portfolio value (£ million)
For this metric, a trustee uses the Total Carbon Emissions normalized by the market value of the portfolio. Scope 1, 2 & 3 GHG emissions are allocated to investors based on an equity ownership approach. Under this approach, if an investor owns 5 percent of a company’s total market value, then the investor owns 5 percent of the company as well as 5 percent of the company’s GHG (or carbon) emissions. This formula allows trustees to understand the relative carbon intensity of their investments. It can be applied to the company, sector or portfolio level and is therefore useful for internal and external comparative purposes.
Advantages over other metrics:
- can be used to compare asset classes/portfolios to one another and/or to a benchmark
- using the portfolio market value to normalise data is fairly intuitive to investors
- metric allows for portfolio decomposition and attribution analysis
Potential drawbacks:
- uses a scheme’s proportional share of equity and debt – an increase in share prices, all else equal, would result in a decrease in the scheme’s total emissions
- metric does not take into account differences in the size of companies (for example, does not consider the carbon efficiency of companies)
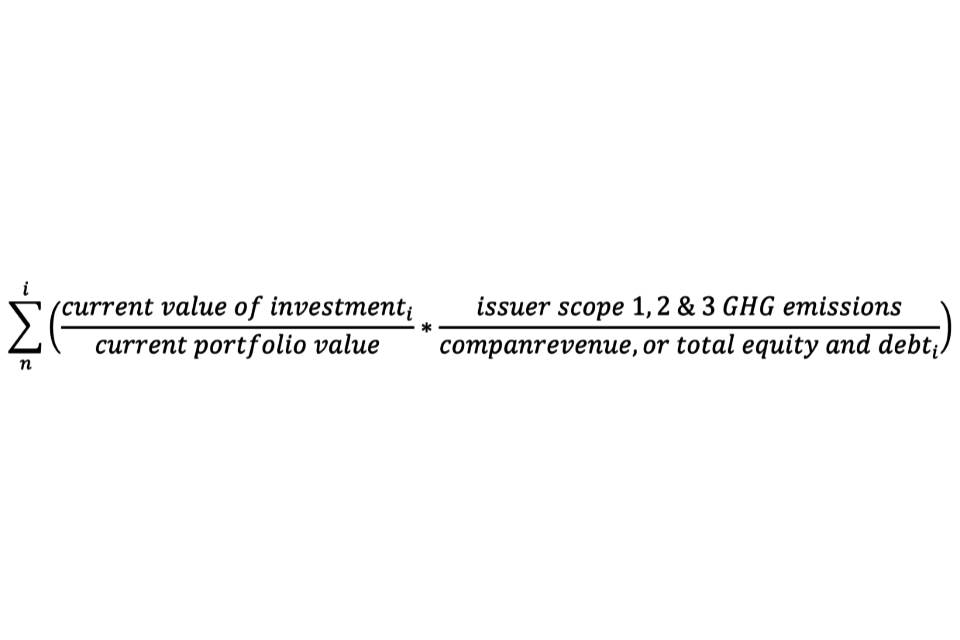
Weighted Average Carbon Intensity
Risk Type: Transition
Dependencies: Company Disclosure
This is a key metric for measuring a fund’s exposure to carbon intensive assets, expressed in tons of CO2e per millions of pounds of revenue (or of value).
""
∑((current value of investmenti / current portfolio value) × (issuer scope 1,2 & 3 GHG emissions / companrevenue, or total equity and debti)), where start at n and go to i
For this metric, a trustee needs the share of their fund invested in a given company (the weight) to multiply by the ratio of a company’s emissions to its revenue, or a measure of company valuation. This is dependent on the issuer’s disclosure of its GHG emissions.
Advantages over other metrics:
- measured relative to portfolio value; agnostic to ownership share of company
- useful indicator of potential exposure to transition risks such as policy intervention and changing consumer behaviour
Potential drawbacks:
- metric will appear lower for those companies with high revenue driven by high prices
- sensitive to outliers (high or low)
- more difficult to communicate than carbon footprint
Absolute emissions based
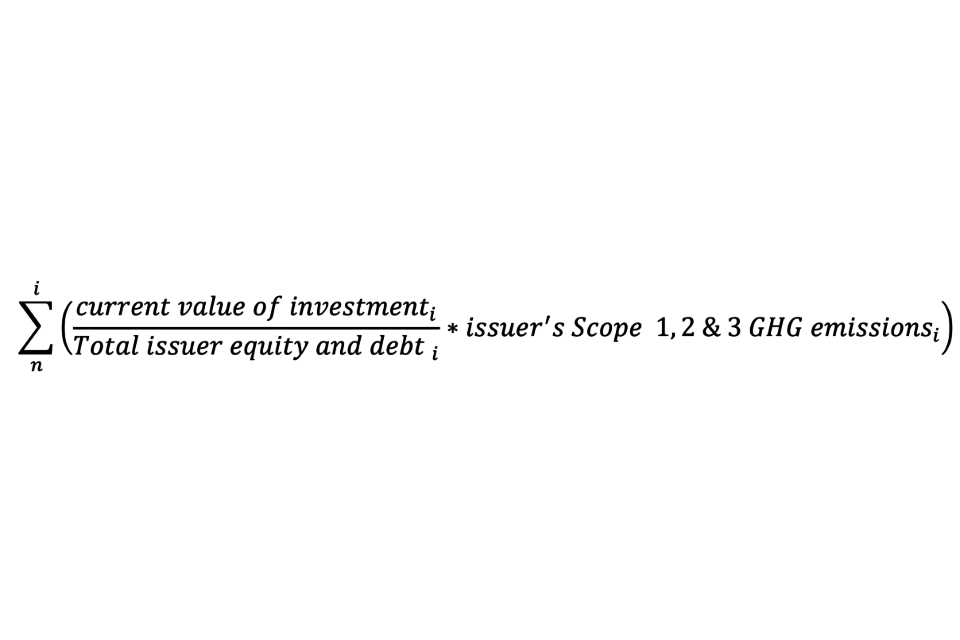
Total Carbon Emissions
Risk Type: Transition
Dependencies: Company Disclosure
This metric measures the total absolute greenhouse gas emissions attributable to a portfolio. This can be used to give a sense of high/medium/low emissions and the associated exposure to a transition to an economy that produces net zero emissions in the future.
""
∑((current value of investmenti / Total issuer equity and debti) × (issuer’s Scope 1,2 & 3 GHG emissionsi)), where start at n and go to i
For this metric, a trustee needs the share of a given company that the pension scheme holds (the weight) to multiply by the company’s emissions, effectively measuring the pension scheme’s share of the company’s emissions. This is dependent on the issuer’s disclosure of its Scope 1, 2 and 3 GHG emissions.
Advantages over other metrics:
- simple to calculate
- easy to communicate to trustees and embers
- enables trustees to set a baseline for climate action and to understand the climate impact of their investments
Potential drawbacks:
- no normalisation between funds;
- an increase in share prices, all else equal, would result in a decrease in the scheme’s total emissions
- difficult to translate into exposure to climate risk
Other
Portfolio Alignment Metrics, for example Implied Temperate Rise
Risk Type: Transition
Dependencies: Company Disclosures / Analysis
Portfolio alignment metrics provide a forward-looking metric of carbon exposure that can be applied to a wide range of industries, companies, and asset classes. Such metrics estimate expected future emissions associated with a given investment portfolio, fund or investment strategy. Using an Implied Temperature Rise (ITR) measure, estimates are translated into a projected increase in global average temperature (in °C) above preindustrial levels. ITR disclosure could help asset owners’ beneficiaries make a forward-looking assessment of an asset owner portfolios’ exposure to climate-related risks, their ability to capitalize on opportunities in the low-carbon transition over time, and overall investment strategy.
Advantages over other metrics:
- lack of widely available, high-quality historical climate-related information, creates need for forward-looking metrics
- addresses the increasing regulatory expectations – forward-looking understanding of climate-related risk
- ITR is expressed in a single temperature unit or range that is comparable to widely understood potential climate outcomes
Potential drawbacks:
- new and still evolving
- several technical and methodological challenges related to calculating ITR
- no ‘one size fits all solution’ to alignment
- further work and input from preparers and users of disclosure will likely be needed to improve its quality and availability
Climate Value at Risk (Climate VaR)
Risk Type: Transition
Dependencies: Scenario analysis
Value-at-Risk metrics – which state the amount of a potential loss, at a certain level of probability over a relevant timeframe – have become standard for measuring financial risk.
Climate VaR aims to assess potential financial sensitivity to climate-related risks and opportunities, with an output expressed as a numeric value or range in a selected currency. For example, a climate VaR of 20% by 2030 at a 90th percentile for a below 2 degrees scenario.
Advantages over other metrics:
- provides a forward looking measure of climate risk – important, given the limitations of historic metrics
- can offer both a central assumption and a range for the effects of each temperature scenario
- depending on the model, can evaluate the impact of climate-related opportunities as well as risks
Potential drawbacks:
- uncertainty – in higher temperature rise scenarios, models might significantly under-estimate the negative impacts stemming from wider societal disruption
- given the multiplicity of numbers – central and upper/lower outcomes for multiple climate scenarios – Climate VaR is less readily usable for target setting
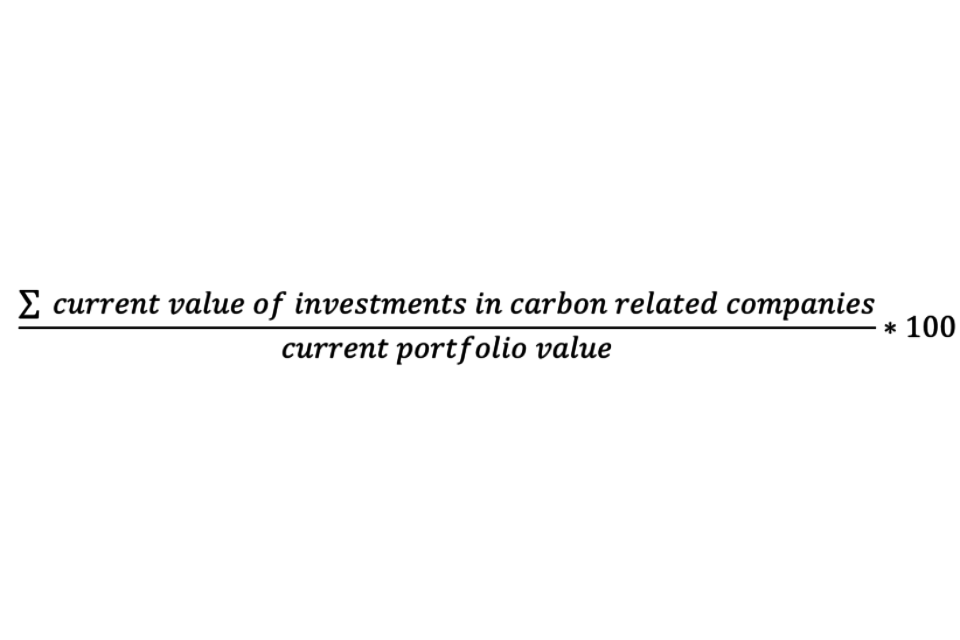
Exposure to Carbon-Related Assets
Risk Type: Transition
Dependencies: N/A
This metric is the most basic calculation of value to trustees attempting to understand the scheme’s exposure to transition risk.
""
((∑current value of investments in carbon related companies) / current portfolio value) × 100
For this metric, a trustee needs to classify whether an investment should be considered ‘carbon-related’; the Global Industry Classification Standard (GICS) is useful for this. The formula then allows trustees to understand how great a share of the fund these assets, the most vulnerable to a transition to a low-carbon economy, represent.
Advantages over other metrics:
- very simple to calculate
- very easy to communicate to trustee board and members
- does not require significant disclosure of data by the asset manager
Potential drawbacks:
- does not account for emissions, merely carbon dependency
- company activities may be a mix of carbon-related and non-carbon-related
Proportion of fund invested in low carbon opportunities
Risk Type: Transition
Dependencies: N/A
This metric enables trustees track the extent to which they are taking advantage of investment opportunities that emerge from an economic shift to a lower carbon industrial system. These includes low carbon/transition sectors such as renewable energy, and electric vehicles amongst others. In theory, this metric should grow over time as more and more listed companies lay out transition pathways that enable them to be classified as low-carbon related.
Advantages over other metrics:
- very easy to calculate
- not dependent on any other part of the investment chain
Potential drawbacks:
- ‘low carbon opportunities’ very vague
- without consensus on definition, open to ’greenwashing’
Process Metrics
Share of portfolio held at year end for which engagement or voting on climate-related risk and opportunities has been a substantive topic
Risk Type: Transition
Dependencies: Asset Manager engagement
Engagement is a key route through which trustees can reduce their exposure to climate change risk. The investments they make give them not just voting rights but significant influence over the direction of a company. Asset managers should be using this influence to manage the scheme’s exposure to climate change risk and opportunities, highlighting any concerns about the direction of a firm during engagement activity that they undertake. This metric allows a trustee to assess the extent to which an asset manager is prioritising engagement and/or voting on the topic of climate change.
Advantages over other metrics:
- does not require data
- useful for monitoring asset managers
Potential drawbacks:
- engagement measure is binary; no measure of influence on company direction
- can be subject to “greenwash”
Share of board meetings per year in which climate-related issues have been a substantive agenda item
Risk Type: Transition
Dependencies: N/A
This is a very basic metric measuring the frequency of discussion of climate risk at trustee board meetings. Discussion at the pension scheme’s highest level of governance is a strong signal that the scheme is actively considering climate risk.
Advantages over other metrics:
- very simple to calculate
- measures senior incorporation of climate risk within governance
Potential drawbacks:
- ‘substantive’ is subjective
- binary; does not measure depth of discussion or actions taken forward
Share of portfolio held at year end for which climate-related metrics of an acceptable quality have been obtained
Risk Type: Transition and Physical
Dependencies: Company Disclosures
The share of the portfolio on which high quality climate-related disclosures are taking place is a good indication of the integration of climate risk and opportunity in trustee and asset manager decision-making. Without such disclosures, the ability of trustees to carry out governance and manage risks associated with climate change is significantly reduced, as is the ability to set out robust strategies.
Advantages over other metrics:
- very simple to understand
- focuses trustee attention on improving data quality as part of asset manager appointment and monitoring decisions
Potential drawbacks:
- will not offer long-term time series – acceptable quality threshold likely to increase over time
- will be sensitive to asset classes held. Disclosure from private and emerging markets very likely to be worse
Fixed Income – Sovereign
This asset class comprises sovereign bonds. Sovereign bonds are generally difficult to analyse in terms of climate change risk as this relies on disclosure and management of risk exposure by national governments, something that asset managers cannot readily lobby for. The process for taking account of embodied emissions from imports and exports also adds complexity and uncertainty. Moreover, sovereign debt is not subject to investor engagement or voting and therefore the influence trustees can have over the management of climate risk is much reduced.
Outcome Metrics
Current forecast of GHG emissions
Risk Type: Transition
Dependencies: N/A
This should be publicly available or easily commissioned. It can measure both the national government commitments (for example, to net-zero emissions) and the current projected trend rate of GHG emissions.
Advantages over other metrics:
- often publicly available research
- easy to calculate/commission
Potential drawbacks:
- any under/over performance against GHG targets potentially already priced in
Process Metrics
To what extent (high/medium/low) does the scheme’s asset managers consider climate change in its analysis of sovereign bonds?
Risk Type: Transition
Dependencies: Asset Manager Disclosure
Sovereign bond/debt analysis typically centres around credit rating evaluation and assessment of default risk. Asset Managers are able to assess the climate risk attached to government bonds. This might include:
- Paris Agreement Alignment
- Net-Zero Commitment
- decarbonisation progress
- Power Generation transition
Advantages over other metrics:
- does not require quantitative data
- covers a large proportion of the typical fund
Potential drawbacks:
- difficult to assess the direct impact of a top-level commitment
- ‘considering’ climate change is not the same as analysing risk in depth
Real assets
Real assets, including real estate, infrastructure, energy, amongst others, is typically the most diverse share of a pension fund. In the absence of daily pricing of these assets, susceptibility to climate change risk is much more difficult to detect and poses a longer-term risk to the assets’ value. However, there is often more data available to an institutional investor on – for example – a particular building project’s environment impact/energy use than other asset classes.
Process Metrics
To what extent does the scheme’s asset manager consider climate change in its analysis of real assets?
Risk Type: Transition and Physical
Dependencies: Asset Manager Disclosure
Asset manager analysis of the viability of real asset investment is often based on the cost-benefit analysis of an investment including forensic assessment of the financials of a particular property investment or infrastructure opportunity. This metric enables trustees to understand the degree to which managers are taking into account both the physical risk, such as weather-related losses, sea level exposure, and the transition risk associated with the movement towards greener infrastructure as a default.
Advantages over other metrics:
- does not require quantitative data
- covers a large proportion of the typical fund
Potential drawbacks:
- difficult to assess the direct impact of a top-level commitment
- ‘considering’ climate change is not the same as analysing risk in depth
Additional Metrics
It is recognised that there exist significant and legitimate constraints on smaller pension schemes that prevent trustees from carrying out extensive, detailed or technical TCFD alignment reporting. That is why the preceding section features core metrics that have been carefully selected based on their appropriateness irrespective of scheme size and resources.
This section is targeted at those trustees and managers who want to go further. This could be large schemes who have capacity and capability and want to demonstrate leadership in a developing area. This could be smaller schemes who have particularly engaged trustees who want to be ahead of the curve on climate change and go beyond minimum reporting on risk and opportunity exposure.
Listed equity and Corporate Debt
Outcome Metrics
Proportion of fund highly exposed to key indicators of physical risk
Risk Type: Physical
Dependencies: Company Disclosure
Physical risk assessment and analysis are generally much more complex than transition risk metrics. Physical risk is much more uncertain in terms of timing and size of impact, and therefore relies on assumption-heavy modelling.
This metric would allow a trustee to track their exposure to the physical risks associated with climate change, including catastrophic weather events. Key indicators of such risk include sea level exposure, heatwave exposure, and drought risk. These are difficult to estimate and may only apply to a limited number of investments. Many listed companies make regular assessment of susceptibility to such risks but disclosure of such assessments may require engagement by the asset manager.
Advantages over other metrics:
- direct measure of those companies or assets held whose operations are most vulnerable
- easy to communicate to trustee board and members
Potential drawbacks:
- indicators of physical risk difficult to pin down and forecast
- requires significant engagement
Process Metrics
Proportion of companies held with climate change risk mitigation plans
Risk Type: Transition
Dependencies: Company Disclosure
This metric is considered advanced as it will require forensic assessment of all companies in which a pension scheme is invested. This will include whether companies are signed up to a transition pathway, have made commitments to net-zero emissions, have published a plan to reduce carbon-dependency and have committed to targets based on science. This will require a high degree of resource such that investment consultants or other service providers may be best placed to conduct this analysis.
Advantages over other metrics:
- simple to calculate and set targets
- easy to communicate to trustee board and members
Potential drawbacks:
- mitigation plans may be weak or insufficient
- may only consider scope 1 and 2 emissions
Fixed Income – Sovereign
Process Metrics
Proportion of sovereign bonds held issued by countries with Net Zero 2050 commitments
Risk Type: Transition
Dependencies: Policy Detail
Basic process metrics that can be used to assess exposure to sovereign bond risk focus on the degree to which an asset manager conducts climate-related sovereign debt analysis. Advanced metrics in this area focus on the results of this analysis. The key signal national governments give to investors on this topic is their commitment to international agreements such as the Paris Agreement. Many other nations have made similar commitments. Stewardship and engagement are both difficult with this asset class, so exposure to countries with no such commitment often reflects carbon-dependency and therefore risk.
Advantages over other metrics:
- does not require complex data, simply adding up commitments
- in the absence of any other tools or intelligence, gives the best estimate on an issuer’s decarbonisation intention
Potential drawbacks:
- difficult to assess the direct impact of a top-level commitment
- ‘given ubiquity of such commitments not as useful as other metrics; little differentiation between schemes
Real assets
Outcome Metrics
Quantification of estimated financial loss in the event of extreme weather events
Risk Type: Physical
Dependencies: Modelling Capability
Schemes with large holdings in infrastructure and real estate should be generally aware of their exposure to the physical risk of such assets being affected by severe climate change, such as flooding, hurricanes etc. This awareness could be considered a core metric. To go further, and quantify this assessment into an anticipated loss to the value of the fund caused by such events should be considered an advanced metric, based on dependency on modelling and data.
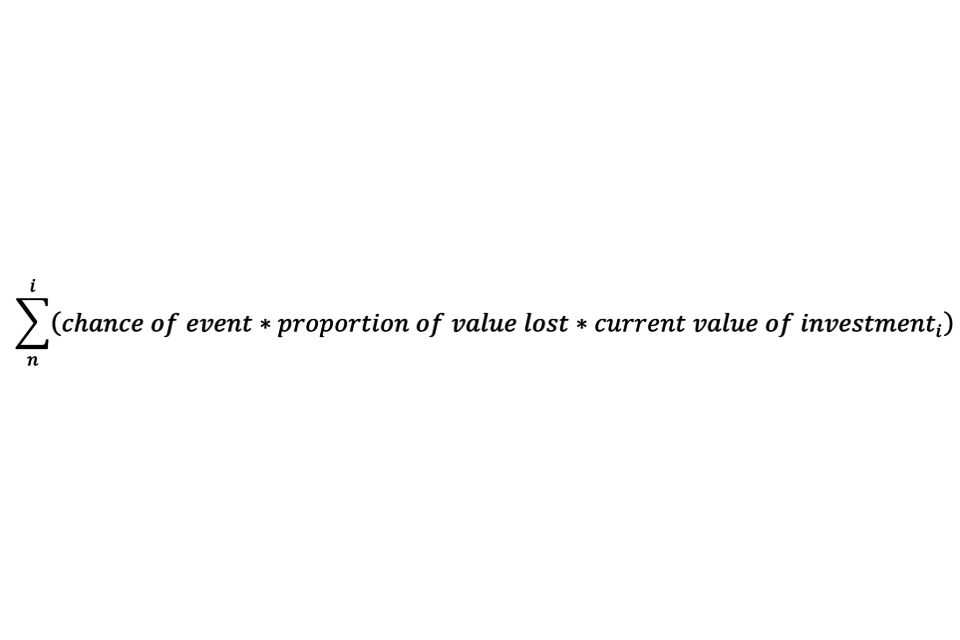
""
∑(chance of event × proportion of value lost × current value of investmenti), where start at n and go to i
Advantages over other metrics:
- direct impact on fund value measured
- allows for sensitivity analysis/varying assumptions
Potential drawbacks:
- requires complex meteorological and financial modelling
Process Metrics
Share of real assets covered by industry standard metrics on climate change/environmental impact
Risk Type: Transition/Physical
Dependencies: Real Asset Holder Disclosure
There are many analytical tools available that will provide investors and their managers with information, including scores and metrics, on the environmental impact, including carbon footprint, of a given real estate project. Examples include the Global Real Estate Sustainability Benchmark (GRESB).
Trustees could work out the number or share of their real asset investments for which – for example – the GRESB data is available.
Advantages over other metrics:
- requires little work on the part of the trustee; simply collation
- very simple to understand
Potential drawbacks:
- typically requires payment for such data/information
- more complex for s those with many real asset investments
- investments may be covered by industry standard metrics such as GRSB but may be relatively low scorers
Appendix B – Case Study
This case study has been provided by The Prince’s Accounting for Sustainability Project (A4S) and the pension scheme in question, who is a member of A4S’s Asset Owners Network.
HSBC bank (UK) Pension Scheme: Putting in place TCFD metrics
What
In order to understand better how exposed our portfolios are to carbon-intensive companies, we started using the weighted average carbon intensity (WACI) metric for our invested defined benefit (DB) and defined contribution (DC) assets. We have disclosed this metric and subsequent data in our TCFD statements since the 2017 financial year. As data has become more available over time, we have covered more assets in this calculation.
WACI is a backward-looking metric, so we wanted to balance it with a metric that is forward looking. So in 2020, we commissioned a second metric: the Transition Pathway Initiative’s management quality score (TPI MQ). TPI MQ gives us insight into how well our investee companies are planning to manage both their greenhouse gas emissions and the risks and opportunities arising from transitioning to a low-carbon economy. We can then benchmark companies’ carbon emissions against international targets and national pledges made as part of the Paris Agreement. We will include the TPI MQ metric in our TCFD statement for the 2021 financial year. Together, WACI and TPI MQ give us valuable insight into the climate risk of our investments.
How
Developing and calculating the metrics: Having researched the options, we then worked closely with external advisers to develop our metrics. We use regular investment consultant advisers for both our DB and DC assets, giving us a broad range of expert input. To give us confidence that we are using good quality, unbiased data, an independent data provider calculates the metrics.
Getting the metrics approved: Our metrics are part of an overarching climate risk management framework and we needed to get use of both metrics approved. We have a 2-step process: our Assets and Liability Committee (ALCO) review and approve metrics, and endorse the overall framework which is sent to the full trustee board for final approval. To equip decision makers with the right information, we facilitated training for ALCO, and then later for the wider board, on our proposed metrics and why we had chosen these over the alternatives. Our investment consultant provided the training through videos, supplemented by written materials, to make the content accessible.
Using the metrics: We use our metrics as a risk management tool and a way to understand how asset managers are managing our portfolios. Metrics are currently imperfect and the data used to produce them are partial in coverage and constantly evolving, so we prefer to treat metrics as sources of information about risk – rather than as a standard that all assets must meet. This becomes a starting point for fruitful conversations with asset managers about climate-related risk management and climate risk policies. Through this engagement, we can push for changes that can better support the shift to a low-carbon economy and ensure our beneficiaries’ investments remain resilient to this transition.
Disclosure
Excerpt from our 2020 Taskforce on Climate-related Financial Disclosures (TCFD) Statement, showing the calculations made using the WACI metric for the main equity exposures of both the DB and DC assets of the scheme as at 31 December 2019.
31 December 2019: Carbon Emissions intensity (Weighted Average Carbon Intensity – Scope 1 & 2) – tonnes CO2/mUSD revenue
| DB | FUM £ million | Fund | Bmk | Diff |
|---|---|---|---|---|
| Global equities | Fund no longer in portfolio | Fund no longer in portfolio | Fund no longer in portfolio | Fund no longer in portfolio |
| Sterling Corporate Bonds – active | 1,477 | 291 | - | - |
| BlackRock Investment Management (UK) Limited | 841 | 287 | - | - |
| M&G Investments | 636 | 297 | - | - |
| Global bonds – active | 5,973 | 228 | ||
| AXA Investment Managers | 2,714 | 212 | - | - |
| BlackRock Investment Management (UK) Limited | 1,399 | 199 | 180 | 11% |
| Legal & General Investment Management | 618 | 63 | - | - |
| Loomis, Sayles & Company | 1,242 | 376 | - | - |
| Liquid Matching Assets (dollar)* – active | 1,182 | 543 | ||
| Insight Investments | 1,182 | 543 | - | - |
| Illiquid Matching Assets – active | 552 | 1,428 |
| DC | FUM £ million | Fund | Bmk | Diff |
|---|---|---|---|---|
| Global equities – passive | 3,079 | 183 | 274 | -33% |
| Global equities – active | 401 | 112 | 172 | -35% |
| Emerging Market Equities – active | 154 | 165 | 300 | -45% |
| UK equities – active | 89 | 68 | 123 | -45% |
| Sustainable & Responsible Equities – active | 33 | 73 | 169 | -57% |
| Shariah Law Equities – passive | 43 | 72 | 222 | -68% |
| UK Equities – passive | 24 | 121 | 123 | -1% |
| North American Equities – passive | 22 | 175 | 175 | 0% |
| Asia (ex Japan) Equites – passive | 6 | 243 | 243 | 0% |
| Europe (ex UK) Equity – passive | 5 | 177 | 181 | -2% |
| Japan Equities – passive | 3 | 104 | 104 | 0% |
31 December 2018: Carbon Emissions intensity (Weighted Average Carbon Intensity – Scope 1 & 2) – tonnes CO2/mUSD revenue
| DB | FUM £ million | Fund | Bmk | Diff |
|---|---|---|---|---|
| Global equities | 1,969 | 209 | 297 | -30% |
| Sterling Corporate Bonds – active | Not previously analysed | Not previously analysed | Not previously analysed | Not previously analysed |
| BlackRock Investment Management (UK) Limited | Not previously analysed | Not previously analysed | Not previously analysed | Not previously analysed |
| M&G Investments | Not previously analysed | Not previously analysed | Not previously analysed | Not previously analysed |
| Global bonds – active | Not previously analysed | Not previously analysed | Not previously analysed | Not previously analysed |
| AXA Investment Managers | Not previously analysed | Not previously analysed | Not previously analysed | Not previously analysed |
| BlackRock Investment Management (UK) Limited | Not previously analysed | Not previously analysed | Not previously analysed | Not previously analysed |
| Legal & General Investment Management | Not previously analysed | Not previously analysed | Not previously analysed | Not previously analysed |
| Loomis, Sayles & Company | Not previously analysed | Not previously analysed | Not previously analysed | Not previously analysed |
| Liquid Matching Assets (dollar)* – active | Not previously analysed | Not previously analysed | Not previously analysed | Not previously analysed |
| Insight Investments | Not previously analysed | Not previously analysed | Not previously analysed | Not previously analysed |
| Illiquid Matching Assets – active | Not previously analysed | Not previously analysed | Not previously analysed | Not previously analysed |
| DC | FUM £ million | Fund | Bmk | Diff |
|---|---|---|---|---|
| Global equities – passive | 2,373 | 209 | 297 | -30% |
| Global equities – active | 383 | 154 | 214 | -28% |
| Emerging Market Equities – active | 74 | 150 | 392 | -62% |
| UK equities – active | 72 | 175 | 138 | +26% |
| Sustainable & Responsible Equities – active | 24 | 292 | 189 | 55% |
| Shariah Law Equities – passive | 24 | 72 | 72 | 0% |
| UK Equities – passive | 17 | 138 | 138 | 0% |
| North American Equities – passive | 11 | 180 | 180 | 0% |
| Asia (ex Japan) Equites – passive | 3 | 238 | 238 | 0% |
| Europe (ex UK) Equity – passive | 3 | 171 | 171 | 0% |
| Japan Equities – passive | 2 | 141 | 141 | 0% |
31 December 2017: Carbon Emissions intensity (Weighted Average Carbon Intensity – Scope 1 & 2) – tonnes CO2/mUSD revenue
| DB | FUM £ million | Fund | Bmk | Diff |
|---|---|---|---|---|
| Global equities | 2,245 | 185 | 296 | -38% |
| Sterling Corporate Bonds – active | Not previously analysed | Not previously analysed | Not previously analysed | Not previously analysed |
| BlackRock Investment Management (UK) Limited | Not previously analysed | Not previously analysed | Not previously analysed | Not previously analysed |
| M&G Investments | Not previously analysed | Not previously analysed | Not previously analysed | Not previously analysed |
| Global bonds – active | Not previously analysed | Not previously analysed | Not previously analysed | Not previously analysed |
| AXA Investment Managers | Not previously analysed | Not previously analysed | Not previously analysed | Not previously analysed |
| BlackRock Investment Management (UK) Limited | Not previously analysed | Not previously analysed | Not previously analysed | Not previously analysed |
| Legal & General Investment Management | Not previously analysed | Not previously analysed | Not previously analysed | Not previously analysed |
| Loomis, Sayles & Company | Not previously analysed | Not previously analysed | Not previously analysed | Not previously analysed |
| Liquid Matching Assets (dollar)* – active | Not previously analysed | Not previously analysed | Not previously analysed | Not previously analysed |
| Insight Investments | Not previously analysed | Not previously analysed | Not previously analysed | Not previously analysed |
| Illiquid Matching Assets – active | Not previously analysed | Not previously analysed | Not previously analysed | Not previously analysed |
| DC | FUM £ million | Fund | Bmk | Diff |
|---|---|---|---|---|
| Global equities – passive | 2,400 | 185 | 296 | -38% |
| Global equities – active | 433 | 301 | 489 | -38% |
| Emerging Market Equities – active | 77 | 207 | 437 | -53% |
| UK equities – active | 83 | 194 | 152 | +28% |
| Sustainable & Responsible Equities – active | 27 | 233 | 544 | -57% |
| Shariah Law Equities – passive | 20 | 84 | 84 | 0% |
| UK Equities – passive | 18 | 152 | 152 | 0% |
| North American Equities – passive | Not previously analysed | Not previously analysed | Not previously analysed | Not previously analysed |
| Asia (ex Japan) Equites – passive | Not previously analysed | Not previously analysed | Not previously analysed | Not previously analysed |
| Europe (ex UK) Equity – passive | Not previously analysed | Not previously analysed | Not previously analysed | Not previously analysed |
| Japan Equities – passive | Not previously analysed | Not previously analysed | Not previously analysed | Not previously analysed |
This analysis is our starting point, and we gain greater insight into the carbon implications and risks as we analyse our funds further. For example, the Sustainability & Responsible Equities – Active Fund has shown a significant degree of variability in the calculated WACI figures year on year. There are many possible reasons behind the variability in figures which may include, but are not limited to, changes in underlying fund managers; changes in underlying investment positions; improvements in data coverage and accuracy; and/or allocations to transition leaders, in which the current WACI numbers may initially be high but the expected future improvement pathway is better eg construction companies with the most ambitious carbon reduction .
Next steps
Over the next few years, we will keep up with research findings and industry practice on existing and emerging metrics by being active members of platforms such as the Cambridge Institute for Sustainability Leadership, the UN’s Principles for Responsible Investment (PRI) and Climate Action 100+. It’s inevitable that we will start to see new metrics being developed. Where these are more useful than our current metrics, or work well alongside them, we will change our practice and adapt our disclosures.
Ultimately, we aim to have a dashboard of metrics. No single number can give us a full picture of our climate risks, but a carefully selected combination of metrics can offer a much more rounded view.
At the moment, because we have only 2 metrics and companies are only beginning to analyse scope 3 emissions, we haven’t set specific targets. As industry practice and data quality evolves, though, we hope to develop targets that we can integrate into decision making – with the goal of building portfolios aligned with the Paris Agreement.
Top tips
Train decision makers: Training trustees helps them to be informed decision makers. Our training described the proposed metrics and their methodology. We also presented alternative metrics, so trustees could see the advantages and disadvantages of different options.
Understand your metrics: Learn how your metrics can be used, what they can tell you and the data you need to calculate them. Be aware of their limitations, too. This will help you clarify how best to include the metrics in your work – and where you should be cautious.
Plan your disclosures: Start planning your disclosures early based on the data you need, incorporating enough time to ask and receive data from different stakeholders so you can build them into your TCFD reports.
Keep metrics under review: This area is changing rapidly, with research organizations developing new metrics and companies generating better data. Build in regular reviews to make sure that you stay up to date.
Use external advisers: Talk to a range of people – including advisers and fund managers – so you can get new ideas and different perspectives. The more diverse your advisory team, the better your outcomes.
-
The TCFD Status Report in 2020 reviewed reports for over 1,700 reporting companies, and Report by Vigeo Eiris and Four Twenty Seven that presents findings from the disclosures of 2855 companies. ↩