Alcohol Duty Reforms Evaluation: Accompanying technical annex
Published 28 October 2026

© Crown copyright 2026
This publication is licensed under the terms of the Open Government Licence v3.0 except where otherwise stated. To view this licence, visit nationalarchives.gov.uk/doc/open-government-licence/version/3 or write to the Information Policy Team, The National Archives, Kew, London TW9 4DU, or email: psi@nationalarchives.gov.uk.
Where we have identified any third party copyright information you will need to obtain permission from the copyright holders concerned.
This publication is available at https://www.gov.uk/government/publications/alcohol-duty-reforms-evaluation-report/alcohol-duty-reforms-evaluation-accompanying-technical-annex
Introduction
This is an accompanying document to the final evaluation of the Alcohol Duty reforms introduced in August 2023. It provides details of the data sources, research and analysis used to inform the evaluation. It also includes the evaluation questions, information on commissioned research and stakeholder engagement, and additional analysis that is not presented in the main report.
A1: Evaluation questions
A set of evaluation questions were developed from the Theory of Change presented in Section 3.1 of the main evaluation report. The questions were designed to test the key stages and assumptions within the Theory of Change using available evidence. They also informed the selection of data sources, metrics and analytical approaches used throughout the evaluation. The evaluation questions are set out below.
Evaluation questions
Objective 1: Greater consumer choice, particularly of low-strength products
Impact: Consumer choice
- has the availability of low-strength products between 1.3% and 3.4% ABV increased?
Objective 2: Reduced alcohol-related harm
Outcome: Price effect
-
are higher duty rates reflected in prices?
-
has the price of products with the lowest prices per unit of alcohol increased more than other products?
-
has the price of the strongest products increased more than other products?
Outcome: Consumption and reformulation effect
-
has the average ABV of alcohol cleared for consumption fallen?
-
have producers reformulated products in response to the reforms?
Impact: Reduced crime-related harms
- have alcohol-related crime rates fallen?
Impact: Reduced health-related harms
-
has alcohol consumption decreased, as measured by drinking frequency and average units consumed?
-
have alcohol-related health harms, including alcohol-specific deaths, related health conditions and hospital admissions decreased?
Objective 3: Support on-trade business via Draught Relief
Input: Usage of Draught Relief (DR)
-
how much DR has been received?
-
has the proportion of clearances receiving DR increased?
Outcome: Price effect – lower relative prices
- have on-trade prices decreased relative to off-trade prices?
Impact: Draught sales and on-trade activity
-
has the proportion of clearances consumed in on-trade settings increased since the reforms?
-
how has the size of the pub sector in the UK changed since the reforms?
Objective 4: Support small producers via Small Producer Relief
Input: Usage of Small Producer Relief (SPR)
-
how much SPR has been received by small producers?
-
has the share of clearances receiving SPR increased?
Impact: Small producer numbers and growth
-
has the number of small producers increased?
-
have small brewers increased their production volumes?
Objective 5: Reduced administrative burden and a simplified process for users
Outcome: Lower administrative burden and simplified process
-
how have the changes to the approval and digital returns systems impacted the time and resources producers spend engaging with the Alcohol Duty system?
-
how have the structural changes to Alcohol Duty impacted the process of calculating Alcohol Duty due?
A2: Evidence sources
The evaluation draws on multiple sources of evidence to assess the impacts of the reforms. These include quantitative analysis undertaken by HMRC, independent social research, academic evidence and stakeholder engagement. Together, these sources provide evidence across the evaluation objectives.
HMRC data
Producer returns and published receipts and clearances data available in the Alcohol Duty bulletins.[footnote 1]
Includes pre-reform data on:
- litres of alcohol cleared by ABV for beer only
- litres of alcohol cleared claiming Small Brewers Relief for beer only
Includes post-reform data on:
- litres of alcohol cleared by ABV for all alcohol types
- litres of alcohol cleared claiming SPR for all alcohol types
- litres of alcohol cleared claiming DR for all alcohol types
Time period covered:
- pre-reform data: 2018 to August 2023
- post-reform data: August 2023 to March 2026
ONS Consumer Price Index (CPI)
Monthly consumer price index time series.
Includes pre and post-reform data on:
- off-trade CPI for spirits, wine and beer
- off-trade CPI for all alcoholic beverages
- CPI for all items
Time period covered: 2019 to 2026.
ONS on and off-trade sales and average prices
Includes pre and post-reform data on:
- volume of product sold on-trade for all alcohol types
- average price of product sold on-trade for all alcohol types
- volume of product sold off-trade for all alcohol types
- average price of product sold off-trade for all alcohol types
Time period covered: 2017 to 2026.
NHS Health Survey for England
Annual survey which includes core questions about alcohol.
Includes pre and post-reform data on:
- frequency of alcohol consumption
- estimated weekly alcohol consumption
- prevalence of at-risk drinking behaviour
Time period covered: 2011 to 2024, excluding 2020 and 2023.
Web-scraped price and product data from a major UK supermarket
Weekly web-scraped dataset of alcoholic products listed on the website of a major UK supermarket.
Includes pre and post-reform data on:
- listed price
- volume
- alcoholic strength (ABV)
Time period covered:
- beer, cider, OFPs and spirits: May 2023 to September 2024
- wine: October 2023 to September 2024
ONS Crime Survey for England and Wales (CSEW)
Annual survey about people’s experiences of, and attitudes towards, crime.
Includes pre and post-reform data on:
- share of people self-reporting driving whilst over the legal alcohol limit
- perception of high-level drink-related behaviour in public spaces
Time period covered: 2015 to 2025.
ONS alcohol-specific deaths in the UK
ONS alcohol-specific deaths in the UK.
Includes age-standardised alcohol-specific deaths per 100,000 people in the UK.
Time period covered: 2001 to 2024.
OECD Health Statistics
Includes pre and post-reform data on:
- litres of pure alcohol consumed per capita in OECD countries among people aged 15 and over
Time period covered: 2013 to 2026.
DHSC Local Alcohol Profiles for England and Public Health Scotland Alcohol dashboard
Department of Health and Social Care (DHSC) Local Alcohol Profiles for England (LAPE) and the Public Health Scotland (PHS) Alcohol dashboard
Public health data collections on alcohol and alcohol-related conditions.
Includes pre and post-reform data on:
- annual admission episodes for alcohol-specific conditions
Time period covered: 2016 to 2025.
ONS UK Index of Services
Includes an index of services for food and beverage serving activities.
Time period covered: 2019 to 2026.
Valuation Office stock of properties
Valuation Office stock of properties.
Administrative dataset on non-domestic rating stock.
Includes pre and post-reform data for England and Wales on:
- hereditament counts for pubs, coaching inns and bars (SCat codes 062, 226, 227 and 303), used as a proxy for the number of licensed pubs and bars
Time period covered: 2011 to present.
A3: Independent social research
This section provides supplementary information on the commissioned social research. The findings from the research are referenced throughout the evaluation report. Table 1 presents the profile of producers who participated in the research, by producer size, alcohol type and relief claimed.
Table 1: Profile of producers for social research
| Producer Size | No. Interviews |
| Small | 22 |
| Medium | 27 |
| Large | 11 |
| Type(s) of alcohol produced | No. Interviews |
| Beer | 26 |
| Wine | 10 |
| Spirits | 13 |
| Cider | 10 |
| Other fermented products | 9 |
| Type(s) of relief claimed | No. Interviews |
| Small Producer Relief | 34 |
| Draught Relief | 25 |
Notes:
-
participants could produce more than one type of alcohol and claim more than one relief. Totals therefore exceed number of interviews
-
producer size categories were based on total alcohol production volumes. Approximately the smallest 60% of producers were classified as small, the next 30% as medium and the largest 10% as large
A4: Stakeholder evidence
To better inform the evaluation of the reforms, HMRC and HMT invited producers, trade bodies, public health groups, academics, and other stakeholders to submit relevant qualitative data on the impacts[footnote 2]. A total of 49 responses were received from across industry, health and academia. In addition, a series of roundtables were held to complement the data gathering exercise, which provided the opportunity for stakeholders to share their experiences of the reforms in greater depth. Those discussions helped provide additional context and qualitative insight.
A5: Additional crime-related harm metrics
This section presents additional crime-related harm metrics considered as part of the evaluation but not included in the main report. Given the limited post-reform period available and the range of factors influencing crime-related outcomes, it is difficult to attribute any observed changes to the reforms. These metrics therefore provide supplementary evidence on alcohol-related harms and are based on data from the Crime Survey for England and Wales (CSEW). Due to disruption to face-to-face data collection during the COVID-19 pandemic data is missing for the years ending March 2021 and March 2022.
A5.1 Self-reported driving over the legal alcohol limit
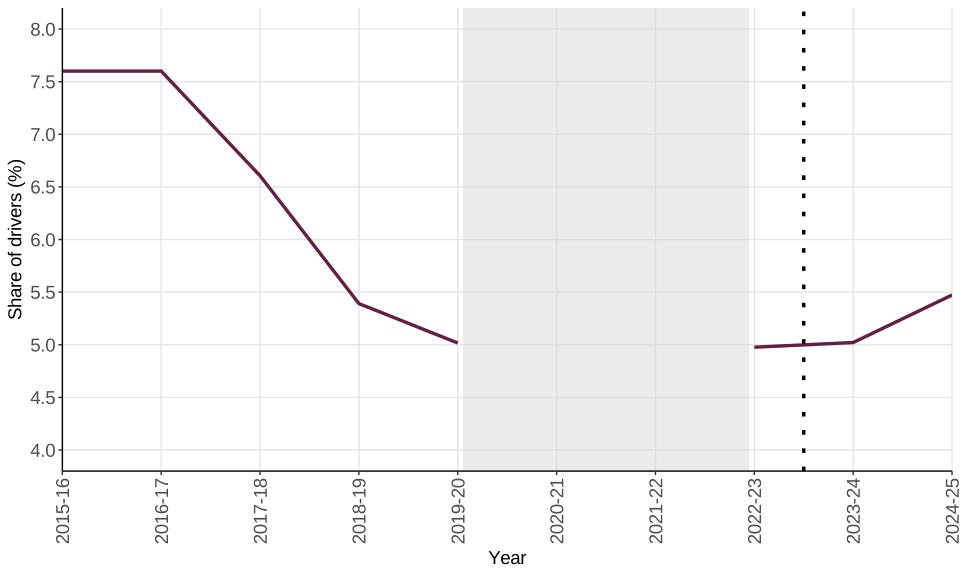
Figure 1 shows the share of drivers who report driving while over the legal alcohol limit. The measure is based on the Crime Survey for England and Wales (CSEW) and captures the proportion of drivers who report driving at least once in the previous 12 months when they believed they may have been over the legal alcohol limit, even if only by a small amount. A reduction in this measure would be consistent with a reduction in alcohol-related harms because drink-driving is associated with an increased risk of road traffic collisions, injuries and fatalities.
The share of drivers reporting that they had driven while over the legal alcohol limit decreased from 7.6% in 2017 to 5.4% in 2019. The measure then remained broadly stable, fluctuating around 5% until 2024. Following the reforms, the share increased from 5.0% in 2024 to 5.5% in 2025. The chart therefore does not provide clear evidence that self-reported drink-driving levels changed following the reforms.
Figure 1: Share of drivers self-reporting driving over the legal alcohol limit
Source: HMRC analysis, Crime Survey for England and Wales (CSEW).
Notes:
-
the dotted line marks the August 2023 duty reforms
-
estimates are based on self-reported survey responses from adults aged 16 and over who reported driving a motor vehicle in the previous 12 months
A5.2 Perceptions of drink-related behaviour in public spaces
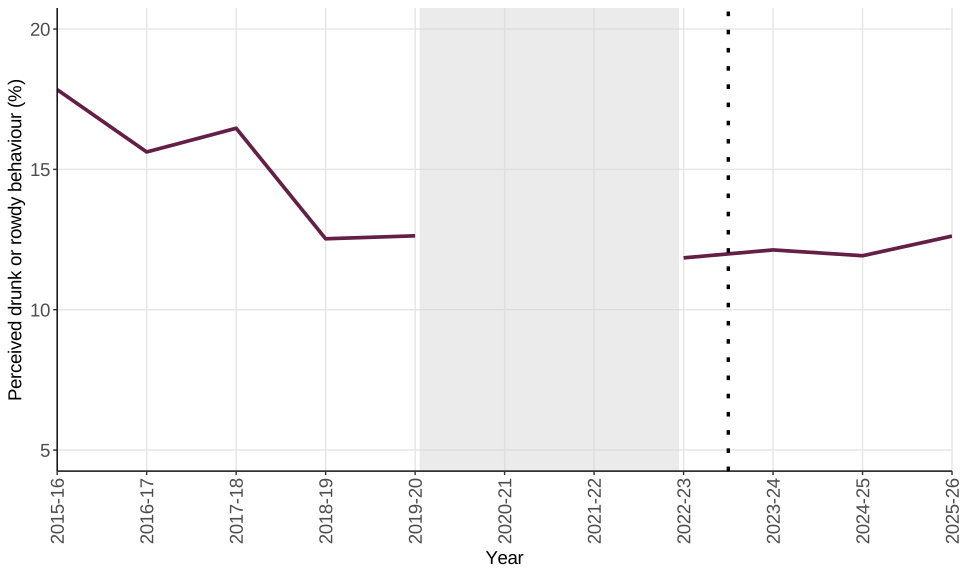
Figure 2 shows the share of respondents in England and Wales who report that drunk or rowdy behaviour in public places is a very or fairly big problem in their local area. The measure is based on perceptions rather than recorded incidents of crime or disorder.
The share of respondents reporting drunk or rowdy behaviour as a problem in their local area decreased from 18% in 2015 to 2016 to 13% in 2018 to 2019. The measure then remained broadly stable between 2022 to 2023 and 2024 to 2025. The evidence from this measure does not indicate a clear change in perception of drunk or rowdy behaviour following the reforms.
Figure 2: Share of respondents perceiving drunk or rowdy behaviour as a problem in their local area
Source: HMRC analysis, ONS CSEW
Notes: the dotted line marks the August 2023 duty reforms
-
This evaluation uses both internal Alcohol Duty returns data and aggregated statistics published in HMRC’s Alcohol Duty Bulletins. ↩