Advanced Connectivity Technologies Sector Study 2026
Published 5 June 2026

© Crown copyright 2026
This publication is licensed under the terms of the Open Government Licence v3.0 except where otherwise stated. To view this licence, visit nationalarchives.gov.uk/doc/open-government-licence/version/3 or write to the Information Policy Team, The National Archives, Kew, London TW9 4DU, or email: psi@nationalarchives.gov.uk.
Where we have identified any third party copyright information you will need to obtain permission from the copyright holders concerned.
This publication is available at https://www.gov.uk/government/publications/advanced-connectivity-technologies-sector-study-2026/advanced-connectivity-technologies-sector-study-2026
1. Executive Summary
Introduction
In December 2025, the Department for Science, Innovation and Technology (DSIT) commissioned Deecon Consulting to undertake the Advanced Connectivity Technologies (ACT) Sector Study.
Advanced Connectivity Technologies are emerging and advanced technologies that enable the transmission of data via communications networks and network infrastructure in an increasingly digitised economy and society, connecting both people and things. These include technologies that make up advanced wireless systems, such as 5G and the transition to 6G, non-terrestrial networks, and advanced optical networks.
This study was commissioned to build on DSIT’s earlier ACT market scoping analysis, published in June 2025, and to provide a fuller assessment of the scale, profile and economic contribution of the UK ACT sector. The work included reviewing DSIT’s ACT definition and taxonomy, refining and validating the methodology used to identify ACT firms, producing UK-specific estimates of economic contribution, undertaking primary research and stakeholder engagement, assessing future workforce and skills requirements, and developing forward-looking market projections.
Key findings
Sector scale
- 501 companies were identified as providing ACT products or services within the UK, representing around 4% of the wider telecommunications company base. 64% of companies focus solely on ACT, while 36% offer ACT as part of a broader portfolio.
Economic contribution
-
ACT activity is estimated to account for £32.9 billion in revenue and £13.2 billion in approximate Gross Value Added (aGVA) in 2025.
-
ACT companies employed approximately 109,400 people in the UK in 2025.
-
ACT companies are geographically concentrated in line with wider UK business patterns, with 54% based in London and the South East. ACT employment is even more concentrated, with nine of the top 10 employers located in these regions.
-
The UK’s strongest relative position is in Non-Terrestrial Networks, which includes airborne platforms and satellite communication platforms, while the other technology categories remain more heavily shaped by overseas-owned firms.
Future workforce
Long-term strength of the ACT sector will depend partly on whether the UK can develop, attract and retain people with the right technical skills. The analysis of the graduate and postgraduate ACT talent pipeline resulted in 3 main findings.
-
The undergraduate pipeline is too generic in places. ACT-related provision is stronger at postgraduate than undergraduate level, with relatively few undergraduate courses or modules explicitly focused on ACT.
-
The postgraduate pipeline is deeper, but also more vulnerable. In 2024–25, 79% of undergraduate entrants to ACT-related courses were UK permanent residents, compared with 32% of postgraduate entrants, indicating a much heavier reliance on international students at postgraduate level. Some technologies, including Satellite Communication Platforms, also appear to have relatively limited course coverage.
-
Workforce pressures extend beyond graduate supply into core delivery roles. Secondary research from 2024 indicates that around 60% of UK telecoms engineers are aged over 50, and that the sector could face a 30,000-person engineering shortfall over the next 10 years.
Investment and innovation
-
Approximately £140 million of grant funding was received from the ACT company base, from 2018 through to February 2026, which is concentrated in Non-Terrestrial Networks, though is broadly distributed across firm sizes. Interview feedback suggested the current application process can be burdensome, particularly for smaller firms and lower-value awards.
-
Equity funding into UK-headquartered ACT companies totalled just over £300 million between 2022 and 2025, but later-stage funding remains more limited. This is a particular challenge for ACT firms, given their longer development cycles and higher capital requirements.
-
Free Space Optics appears to be one of the UK’s clearer innovation strengths within the emerging ACTs. Although the UK’s patent position is modest overall, it is relatively strongest in Free Space Optics, with weaker positions in areas such as 6G Radio Technologies.
Forecasted revenue growth
-
UK ACT revenue is expected to reach £62.8 billion by 2031. This is anchored to the 2025 UK ACT revenue baseline and applies relevant industry forecast growth rates on a ceteris paribus basis. Actual outcomes could differ materially if the UK gains or loses share, or if adoption, investment and commercialisation conditions evolve differently from the underlying market assumptions.
-
ACT Service Providers and Operators are forecast to remain the dominant category by revenue through to 2031, reflecting their existing scale, customer access and stronger commercial maturity.
-
Private Enterprise Networks is the technology category forecast to see the biggest absolute rise in revenue, increasing by £1.7 billion over the period.
-
Very Low Earth Orbit (VLEO) Satellite Systems and LiFI are forecast to record the highest growth rates, with each expected to record a compound annual growth rate of over 45% during the period.
2. Introduction
2.1 ACT definition
In 2025, the UK Government’s Industrial Strategy set out the 8 sectors most critical to driving growth and innovation over the next 10 years. The Digital and Technology sector is one of these critical sectors, within which Advanced Connectivity Technologies (ACT) was identified as a priority frontier technology.
The definition for ACT utilised in this study is:
Advanced Connectivity Technologies are emerging and advanced technologies that enable the transmission of data via communications networks and network infrastructure in an increasingly digitised economy and society, connecting both people and things. These include technologies that make up advanced wireless systems, such as 5G and the transition to 6G, non-terrestrial networks, and advanced optical networks.
2.2 ACT taxonomy
The technologies and services included in this study were identified through a structured review of the 2025 ACT scoping study, supplemented by analysis of industry and analyst literature to reflect how the market is currently defined and evolving. Technologies were included where they form a direct part of advanced connectivity systems or services and were defined to ensure that each sub-element has broadly similar characteristics, including maturity, adoption trajectory and market dynamics. Technologies and services are grouped into broader categories based on similar functions and market characteristics.
The technologies and services in scope for this study are:
Figure 1: In Scope technologies and services
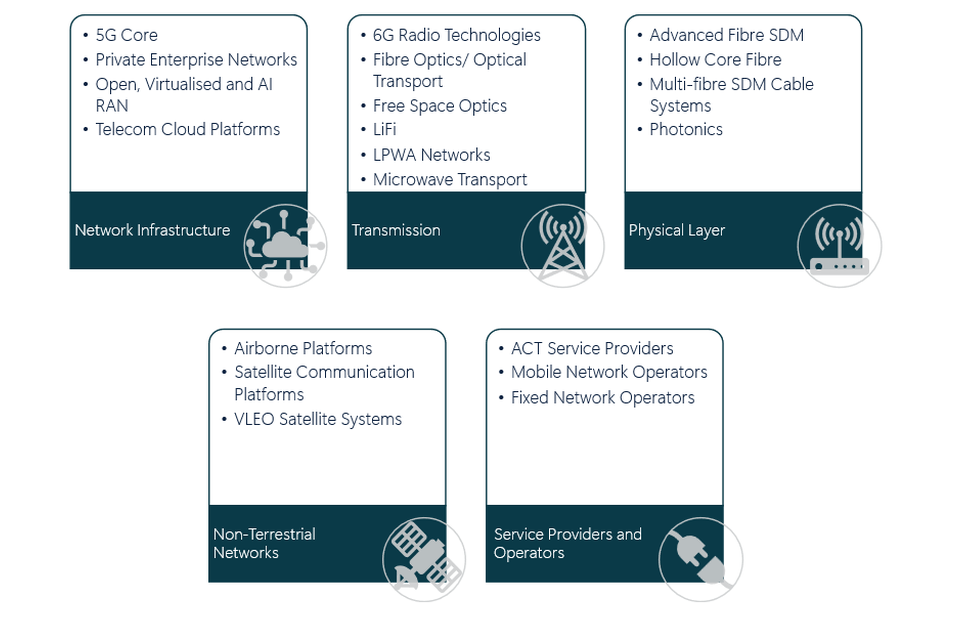
The scope excludes standard connectivity and networking products. Enabling technologies, such as advanced materials, semiconductors, quantum and cyber security, are not treated as standalone ACT categories. Instead, they are considered as drivers or constraints on ACT adoption, performance and cost where relevant, to avoid overlap and double counting across the wider Industrial Strategy framework.
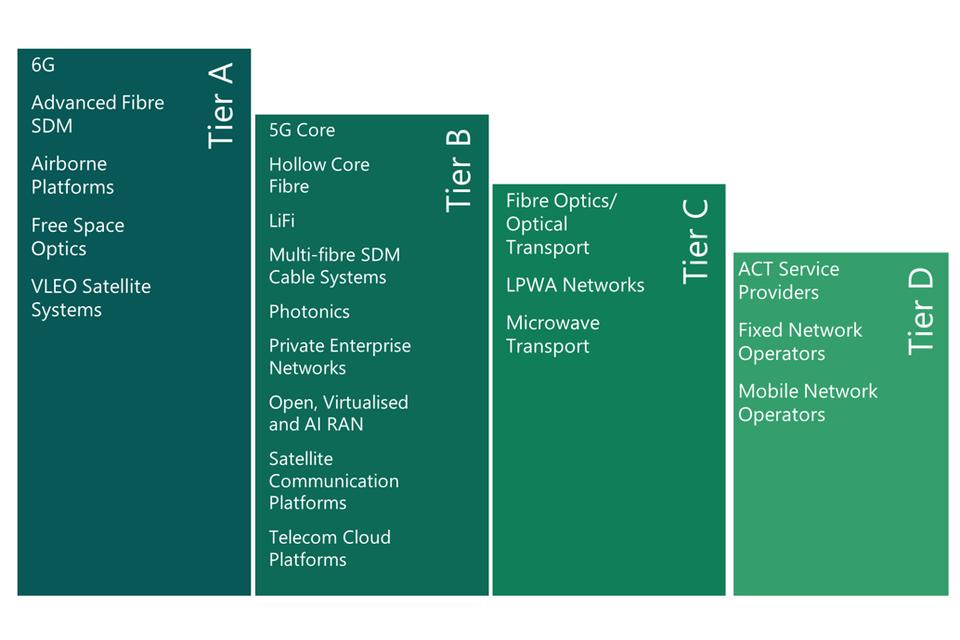
2.3 ACT tiering
For the purposes of this study, a bespoke maturity tiering system was defined to inform the depth and form of analysis applied and to reflect both the strength of available evidence and where government intervention can most plausibly influence commercialisation, scale-up and the UK’s global competitive position. The system draws on aspects of the Technology Readiness Level (TRL) scale for Tiers A and B, but extends beyond technical maturity to reflect commercial adoption, market dynamics and policy relevance. Tiers C and D sit outside the TRL framework, as they capture technologies that are already commercially established and organisations that offer relevant services:
-
Tier A – Nascent/ Emerging: Technologies where recent step-change innovation has created a credible pathway to new connectivity capabilities, but where commercial adoption and market structure remain highly uncertain.
-
Tier B – Scaling / Early Commercial: Technologies with validated technical feasibility and increasing market traction, transitioning from pilots to repeatable deployments, but not yet embedded as business as usual.
-
Tier C – Established / Mature: Technologies that are widely deployed and commercially established, with predictable adoption dynamics and innovation that is largely incremental.
-
Tier D – Services: Organisations that deploy, operate, integrate or manage services using ACTs, rather than primarily developing or manufacturing the underlying ACTs.
The technology maturity for each ACT is as follows:
Figure 2: Tiering for in scope technologies
3. Sector Profile
3.1 Company identification
The initial ACT company population was constructed using a structured approach combining searches by relevant telecommunications SIC codes and keyword-based filtering to capture emerging and cross-cutting activities not fully reflected in standard classifications. Each company was subject to manual validation against the ACT taxonomy to confirm in-scope activity and remove inactive or duplicate entities. Companies solely providing ACT goods and services were classified as ‘Core’, while those that develop or utilise ACT as part of their broader activities such as telecoms operators and providers were classified as ‘Hybrid’.
3.2 Size and distribution
In total, 501 UK-based companies are identified as operating fully or partially within the ACT scope. This number includes companies both domiciled in the UK and companies registered in the UK but ultimately owned by parent companies outside the UK. ACT companies represent a small minority of the wider telecommunications company base (around 4%).
Table 1: Snapshot of ACT companies, 2026
| Type of company | Companies |
|---|---|
| Core ACT | 320 |
| Hybrid ACT | 181 |
| Total | 501 |
Compared with the ACT Market Scoping Analysis 2025, the refined methodology used in this study identifies fewer companies as Hybrid ACT. This reflects more detailed company-level assessment, which removed many firms that could not credibly be treated as partly in scope.
The size distribution of identified ACT companies is broadly mixed, with micro, small and medium firms forming a substantial part of the company base, alongside a smaller number of large and enterprise-scale firms.
Figure 3: ACT companies by size, 2026
| Company size | Percentage |
|---|---|
| Micro | 27% |
| Small | 24% |
| Medium | 29% |
| Large | 13% |
| Enterprise | 7% |
ACT company geographic distribution broadly mirrors national business patterns, with the highest concentration in London and the South East, which together account for 54% of the company base.
Figure 4: ACT companies by region, 2026
| Region | Percentage |
|---|---|
| South East | 28% |
| London | 26% |
| East of England | 11% |
| South West | 9% |
| Scotland | 6% |
| Yorkshire and the Humber | 5% |
| North West | 5% |
| West Midlands | 5% |
| East Midlands | 3% |
| Wales | 2% |
| North East | 1% |
| Northern Ireland | 1% |
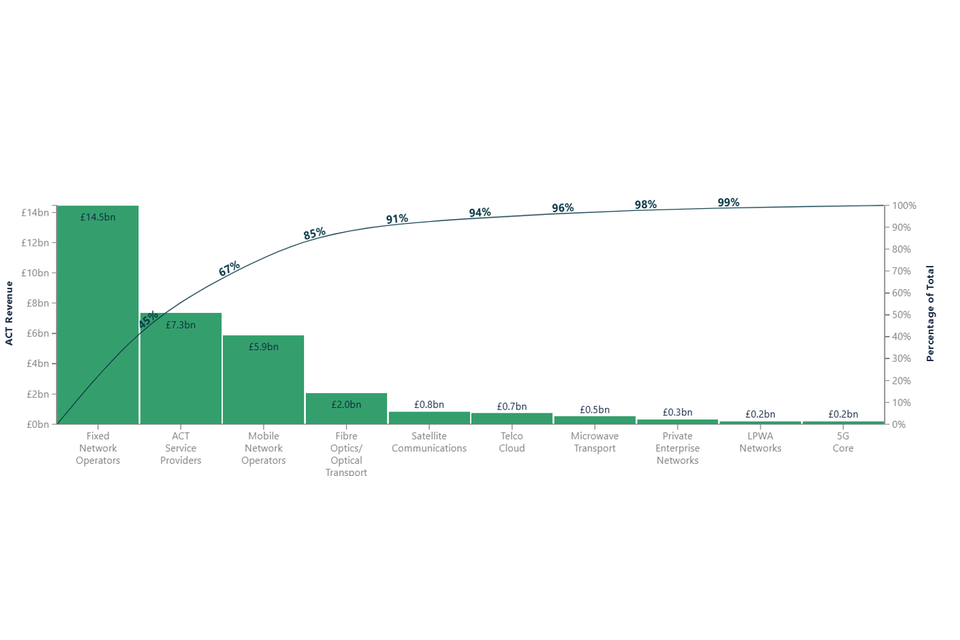
On a company-count basis, the UK ACT landscape is weighted more towards service provision than proprietary technology development, with ACT Service Providers representing the largest segment. This matters because service providers - those that deploy, integrate, and offer managed services - help diffuse ACT across multiple technology areas, but are less likely than technology developers to retain proprietary intellectual property or strategic control over the underlying technologies, which may limit the share of long-term value captured in the UK.
Figure 5 is a Pareto chart in which the bars show the number of companies in each category, ordered from largest to smallest, while the line shows the cumulative share of the total company count.
Figure 5: Top ACTs by company count, 2026
| Company count | |
|---|---|
| ACT service providers | 164 |
| Satelitte Communication | 69 |
| Fibre Optics/ Optical transport | 68 |
| Fixed Network Operators | 63 |
| Telco Cloud | 43 |
| RAN | 25 |
| Private Enterprise Networks | 24 |
| LPWA Networks | 20 |
| Microwave Transport | 18 |
| Photonics (PIC) | 16 |
4. Economic Contribution
Current economic contribution matters because it shows where ACT activity is already generating revenue, employment and value in the UK economy, and how the sector’s present structure may shape future growth potential. The findings indicate that ACT already makes a meaningful contribution to the UK economy in terms of revenue, approximate Gross Value Added (aGVA) and employment.
4.1 Revenue and GVA
Revenue estimates are drawn from the most recent available company disclosures for all in-scope companies and are baselined to the 2025 price year. For hybrid companies, revenue and employment were apportioned to UK ACT activity, using company disclosures where possible and standardised assumptions where necessary. Where there were no revenue disclosures available, a further review of company materials was conducted. Estimates were revised where responses were received to a structured survey issued to in-scope companies. ONS Annual Business Survey aGVA-to-turnover ratios are applied to ACT revenues to estimate aGVA. The methodology is set out in further detail in sections 8.4 and 8.5.
Together, the ACT company base generated an estimated £32.9 billion in ACT revenue and £13.2 billion in approximate Gross Value Added (aGVA) to the UK economy in 2025.
Table 2: ACT sector estimates by type of company, 2025
| Type of Company | Revenue | aGVA |
|---|---|---|
| Core ACT | £8.4bn | £3.3bn |
| Hybrid ACT | £24.4bn | £9.9bn |
| Total | £32.9bn | £13.2bn |
Note: Given the updated methodology used in this study, these estimates are not directly comparable to those in the Market Scoping Analysis Report.
ACT Service Providers and Operators account for around 85% of total ACT revenue, suggesting that much of the sector’s current economic value is being realised through deployment, operation and service delivery rather than through the development and ownership of underlying technologies.
-
Fixed Network Operators, which provide broadband services, account for approximately 45% of total ACT revenue.
-
ACT Service Providers, while the largest by company count, account for the second largest revenue share with 22%.
-
Mobile Network Operators, including MVNOs that utilise their core infrastructure, represent the third-largest revenue share at 18%. Only a proportion of their revenue is included, based on the current share of their connections using 5G. Revenue is also more concentrated in this segment than among Fixed Network Operators or ACT Service Providers.
-
This leaves only around 15% of total ACT revenue attributable to technology-led segments. Within this, Fibre Optics/Optical Transport accounts for 6% and Satellite Communication Platforms for 3%.
Figure 6: ACT revenue by technology, 2025
This indicates that ACT service provision is central to the current success of the UK ACT ecosystem. As service providers and operators account for the large majority of ACT revenue, their investment plans, procurement choices and deployment models have an outsized effect on which technologies gain traction in the UK.
4.2 UK relative position
Excluding service providers and operators, the UK’s strongest relative position is in Non-Terrestrial Networks, where 44% of revenue is associated with UK-headquartered parent groups. This is materially higher than in the other ACT technology categories, all of which are more heavily shaped by firms ultimately owned overseas. Looking at ultimate parent headquarters gives a clearer sense of where proprietary capability, strategic control and a greater share of long-term value are likely to sit within the ACT landscape. It suggests that, while the UK has a more credible ownership position in Non-Terrestrial Networks, much of the wider ACT revenue base remains dependent on technologies and businesses controlled from outside the UK.
Table 3: Revenue proportion by headquarters, 2025
| Technology Group | United Kingdom | Other |
|---|---|---|
| Network Infrastructure | 19% | 81% |
| Non-Terrestrial Networks | 44% | 56% |
| Transmission Technologies | 30% | 70% |
| Physical Layer | 23% | 77% |
Strengthening the position of UK-headquartered firms in more nascent Tier A technologies may offer greater scope for impact, as market leaders and commercial structures have not yet been firmly established. For scaling or mature ACTs, the more realistic route may be to influence the procurement and deployment choices of ACT Service Providers and Operators, including creating space for smaller UK-headquartered suppliers with credible capability to compete.
4.3 Employment
Employment estimates are drawn from the most recent available company disclosures for all in-scope companies. As no consistent relationship between prior employment data and subsequent headcount change was found, a conservative approach was taken, and the aggregate estimate is baselined assuming no growth. Where possible, estimates were further validated through a structured survey. The methodology is set out in further detail in sections 8.4 and 8.5.
Table 4: Employment estimates by type of company, 2025
| Type of Company | Employment |
|---|---|
| Core ACT | 31,700 |
| Hybrid ACT | 77,700 |
| Total | 109,400 |
4.4 Potential areas for further research
Overall, the analysis also points to 3 areas that may warrant further investigation:
-
How could the UK create the conditions for more ACT firms to develop and scale domestically? Much of the current ACT company base is service-led. Further research could examine what wider conditions are needed for more technology-led ACT firms to develop, commercialise and grow in the UK, including access to customers, routes to market, skills, testing environments and international partnerships.
-
Does the UK’s stronger position in Non-Terrestrial Networks point to a clearer opportunity? Non-Terrestrial Networks appear to have higher UK representation than several other ACT categories, including a stronger share of UK-headquartered activity. Further research could test whether this reflects a durable area of UK comparative strength, and whether it provides a stronger basis for future capability-building than areas more heavily shaped by overseas-owned firms.
-
How could concentration in the ACT sector be interpreted? ACT employment and revenue appear concentrated in a relatively small number of firms. Further work could examine whether this creates benefits through scale and clustering, or risks through dependence on a narrow group of large employers. Where location is considered, analysis could distinguish between company headquarters, registered offices and actual workplace locations.
5. Future Workforce
Future workforce development through higher education pathways is critical because the long-term strength of the ACT sector will depend not only on technology and investment, but also on whether the UK can develop, attract and retain people with the right skills. The analysis focuses on the graduate and post graduate pathways and draws on data from the Higher Education Statistics Agency (HESA), the Joint Council for Qualifications (JCQ), and the University and Colleges Admissions Service (UCAS) in the UK. The methodology is set out in further detail in section 8.6. More broadly, secondary evidence suggests that the future workforce will not depend solely on graduate supply and non-graduate and delivery roles are discussed in section 5.5.
5.1 ACT course coverage
The UK has stronger ACT-related provision at postgraduate than undergraduate level. Undergraduate provision remains largely anchored in broader Electrical and Electronic Engineering courses, with relatively few courses or modules explicitly focused on ACT. This suggests the issue is not simply a lack of specialist degrees, but that the future pipeline depends heavily on whether broader undergraduate engineering courses provide sufficient exposure to communications, networking and connectivity-related content.
Table 5: Number of courses by tier and level of study, 2025
| Bachelors | Integrated Masters | Masters | |
|---|---|---|---|
| Tier A | 8 | 3 | 20 |
| 6G Radio Technologies | 8 | 3 | 20 |
| Tier B | 14 | 5 | 13 |
| RAN | 0 | 0 | 1 |
| Photonics | 0 | 5 | 6 |
| Satellite Communication Platforms (inc. VLEO) | 0 | 0 | 4 |
| Telecom Cloud | 14 | 0 | 2 |
| Tier C | 0 | 9 | 17 |
| 5G Core | 0 | 0 | 1 |
| Fibre Optics/Optical Transport | 0 | 0 | 5 |
| LPWA | 0 | 0 | 8 |
| Microwave Transport | 0 | 9 | 4 |
| Total | 20 | 15 | 34 |
Note: Where a course covers several ACTs, it is counted once in the relevant aggregate total to avoid double counting.
-
Tier A has the strongest academic footprint, driven mainly by 6G-related provision. This suggests emerging wireless technologies are receiving more visible academic attention than other parts of the ACT landscape.
-
Tier B coverage is more uneven. Areas such as Photonics appear to have stronger representation, while others rely more heavily on broader engineering and technology pathways rather than clearly identifiable specialist provision. Private Enterprise Networks and LiFi lacked course coverage.
-
Satellite-related provision appears relatively limited given the strategic importance attached to NTN in the wider market analysis. This may indicate a weaker pipeline in an area where long-term capability could matter disproportionately.
-
There may also be a broader alignment issue between academic provision, market signals and innovation support. For example, Network Infrastructure appears to attract relatively little Innovate UK-aligned funding and offers very few courses. This does not by itself establish causality, but it may indicate that some parts of the ACT landscape are receiving weaker signals across both the skills and innovation pipeline.
One practical implication is that strengthening the pipeline may depend as much on encouraging broader undergraduate engineering courses to include more communications and connectivity-related modules as on creating new specialist ACT degrees.
Doctoral provision is inherently harder to observe than taught-course provision. PhD opportunities are often contingent on the availability of funded projects, supervisor expertise and student-led proposals, and can therefore vary materially from year to year.
5.2 Geographic distribution of courses
The UK has a geographically distributed undergraduate skills pipeline.
Figure 7: Distribution of ACT related university courses, 2025
Comparison with the geographic distribution of ACT companies suggests a potential mismatch between where skills are developed and where ACT jobs are concentrated. In particular, Wales and parts of the Midlands appear to host relevant academic provision without a corresponding concentration of ACT employers.
While not specific to ACT or the technology sector, wider ONS evidence on graduate mobility provides important context for interpreting the geographic distribution of higher education provision. Analysis shows that 36% of graduates were living in a different area from where they completed compulsory schooling, compared with 29% of non-graduates with Level 3 to Level 5 qualifications. This suggests that ACT-relevant higher education provision may benefit employers beyond the immediate region in which courses are delivered. [footnote 1]
However, graduate mobility is uneven and concentrated in a limited number of locations. Only 26 out of more than 1,000 English towns and cities had an inward graduate migration rate above 30%. Centre for Cities analysis similarly shows wide variation in retention, with London retaining 77% of students for work compared with around 50% in cities such as Manchester, Belfast and Birmingham, and only 15% of graduates who moved city to study remaining there for work. This suggests that while graduates are mobile, they tend to concentrate in a small number of urban centres. [footnote 2]
As a result, HE course location indicates where ACT-relevant skills are developed but is not a direct proxy for where graduates enter the workforce.
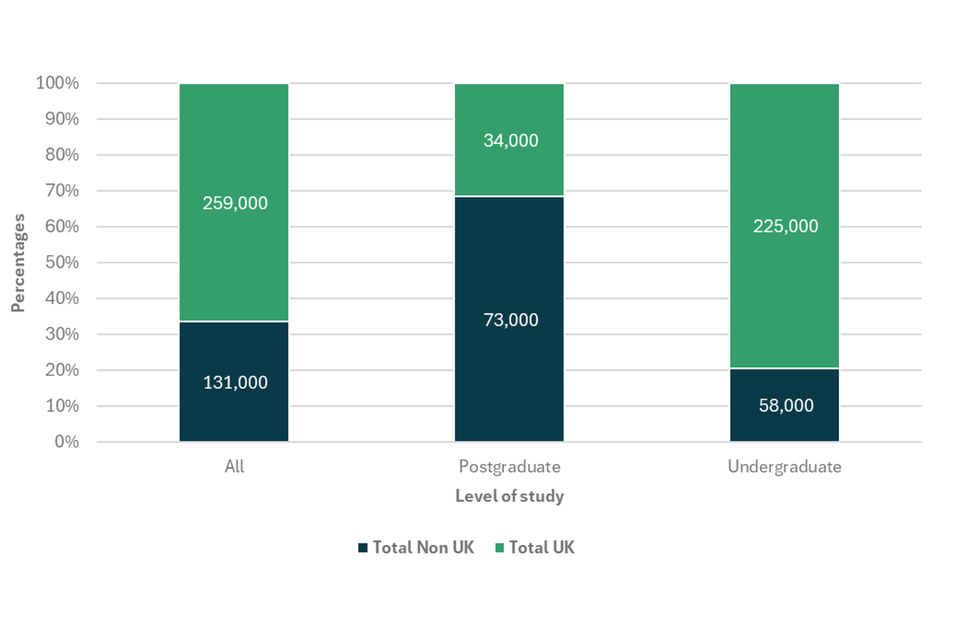
5.3 Domicile of entrants
For university entrants for the academic year 2024-25, there is a much greater proportion of undergraduate entrants enrolling for ACT-related courses that are UK permanent residents (79%) compared with postgraduate entrants (32%).
Figure 8: Domicile of entrants to ACT related courses by level of study, 2024-25
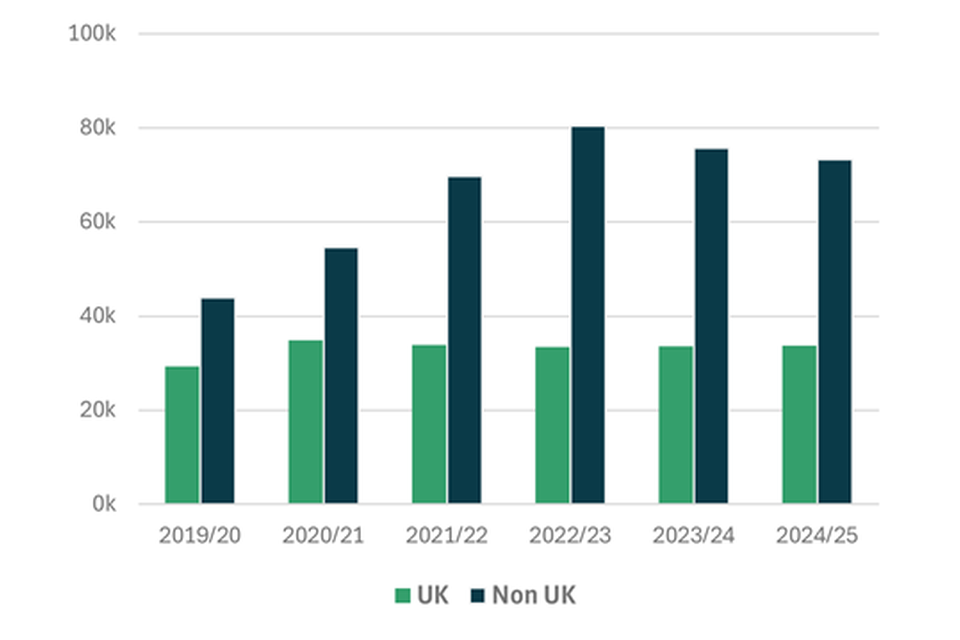
The number of undergraduate entrants from outside the UK has been relatively flat, while the number of UK-domiciled students has gradually increased. For postgraduate courses, entrant numbers from outside the UK rose year-on-year between 2020 and 2023, before declining over the following 2 years. This aligns with changes to UK immigration policy introduced in July 2023, including restrictions on dependants, limits on switching into work routes before course completion, and stronger enforcement. Overall, postgraduate enrolment across ACT-related courses is still around 10% higher than 5 years earlier, but the recent decline underlines how exposed this part of the pipeline is to immigration-policy change.
Figure 9: Undergraduate entrants to ACT related courses
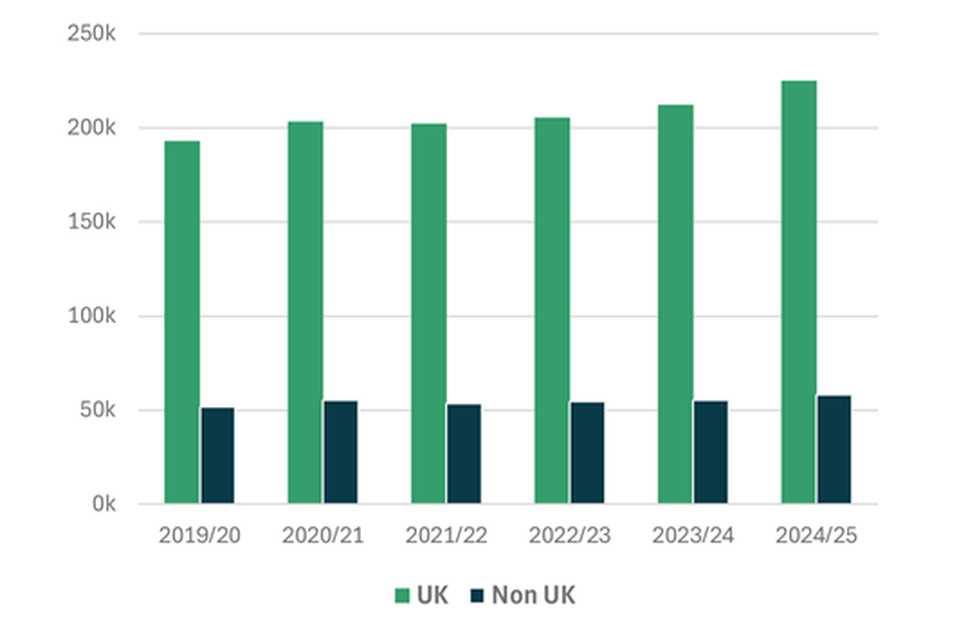
Figure 10: Postgraduate Entrants to ACT related courses
The talent pipeline is being shaped by 2 opposing trends. UK‑domiciled undergraduate entrants are increasing gradually, which strengthens the long‑term domestic supply of ACT talent. However, postgraduate supply remains highly dependent on international students and is therefore more sensitive to visa changes. If international entrant numbers fall further, the postgraduate pipeline may weaken by the late 2020s unless domestic participation grows sufficiently.
Strengthening the domestic pipeline matters not only for skills supply but also for retaining future economic activity in the UK. If firms cannot recruit the engineering talent they need domestically, they may increasingly expand delivery and development capacity overseas. This suggests interventions that widen the domestic pipeline could help retain a greater share of ACT-related employment and value creation in the UK.
Historic employer-sponsored bursary schemes may offer one possible model for widening the pipeline. Interview evidence suggested such schemes were previously an effective route into the sector and may have helped attract capable students who might otherwise have chosen more commercially attractive fields. While a robust public time series on employer-sponsored bursaries was not identified, wider evidence indicates that employer-backed study routes remain important and that universities’ own bursary funding is under increasing pressure. This suggests there may be value in exploring whether targeted industry-supported bursaries or sponsorship schemes could help attract talent into strategically important but less visible ACT-related disciplines. [footnote 3]
5.4 Gender diversity in the future pipeline
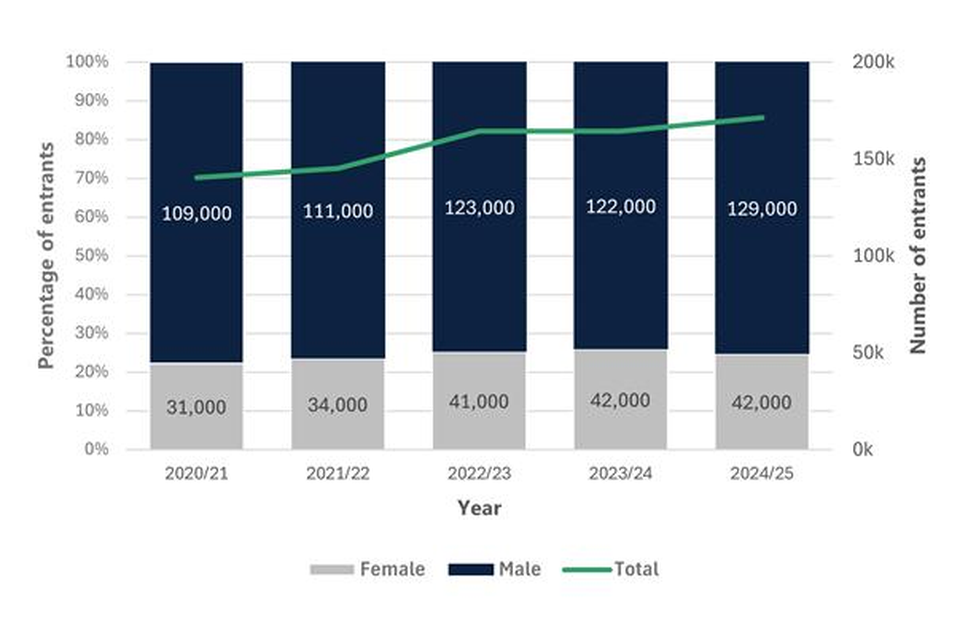
Female participation in ACT-related subjects has increased by around 10,000 over the past 5 years, equivalent to an average annual growth of around 8%. However, the gender balance has changed little, as male participation has also continued to rise.
Figure 11: Proportion of female and male entrants to ACT related courses over time
Government programmes aimed at increasing participation in STEM, such as through the National Centre for Computing Education launched in 2018 and their “I Belong” programme to encourage female participation, operate earlier in the pipeline. This means effects may not appear in university data for several years.
Data from the Joint Council for Qualifications indicates that between 2018 and 2025 for Computing, Mathematics and Science: [footnote 4]
-
A-Levels: Higher participation by females across the board (same as for males) but relative proportion dropping for Maths and Further Maths
-
GCSEs: For elective subjects, female participation is up proportionally in Computing, down proportionally in Design & Technology, while Engineering shows a higher female proportion but declining overall entry volumes
This indicates that while the female talent pipeline into ACT-related study is expanding, it is not yet growing at a rate that will materially change overall gender balance in the near term. This suggests broad STEM measures may not be sufficient on their own and that more targeted interventions may be needed at key transition points into ACT-relevant study and work.
5.5 Non-graduate and delivery roles
While non-degree routes were outside the scope of detailed analysis in this study, secondary research and interview evidence suggest the future ACT workforce will not depend solely on graduate supply.
This is particularly relevant in technical and delivery roles. As discussed in the ACT Service Provider section, the industry faces skills shortages across both advanced network operations and field delivery functions. Around 60% of UK telecoms engineers are over 50, and the sector is estimated to face a 30,000-person engineering shortfall over the next 10 years.
This has practical implications for workforce policy. In areas such as network construction, installation and field engineering, shortages cannot easily be offset through overseas hiring because the work must be carried out in the UK. This suggests apprenticeships, retraining and other non-degree pathways may be particularly important in sustaining deployment capacity and avoiding delays to network build and maintenance activity.
5.6 Potential areas for further research
The analysis indicates that 3 areas may warrant further investigation:
-
How could the UK strengthen the undergraduate pipeline into ACT careers? Further research could explore the feasibility, costs and benefits of options to increase the number and diversity of students entering ACT-related degrees. This could include more ACT content in existing engineering courses, new specialist degrees, employer-backed bursaries and sponsorships, and earlier school or college interventions to widen participation beyond current demographic patterns.
-
What role does postgraduate talent play in growing UK ACT capability? The extent to which postgraduate talent contributes to UK ACT growth is not yet clear. Further research could examine the relationship between postgraduate student numbers, entry into ACT careers, UK company formation and innovation activity. This could help assess how changes to international student flows or immigration policy may affect the future supply of advanced ACT skills, and whether postgraduate provision is likely to support a stronger UK position in global ACT markets.
-
How could non-university routes help address technical and delivery workforce gaps? Further research could examine workforce shortages in roles that typically do not require degree-level education, the skills needed to close those gaps, and the role apprenticeships, retraining and other non-degree routes could play. It could also assess what support employers need to train, retrain and retain more workers in the UK.
6. Investment and Innovation
6.1 Methodology overview
Innovate UK project data (2018–February 2026) provides the primary source for company-level public R&D funding, with awards classified to ACTs using keyword and programme-based mapping to project descriptions and metadata. While this represents the most consistent structured dataset for business-facing innovation funding, it captures only a subset of total public R&D support, excluding some university- and consortium-led funding. Venture capital investment is assessed using CB Insights data over the 2022 - 2025 period for UK-headquartered ACT companies, with totals based on disclosed funding amounts and therefore representing minimum observed values. Patent analysis is undertaken using Espacenet and applied to Tier A ACTs as a directional indicator of early-stage innovation, based on keyword and classification searches; automated search logic may include adjacent technologies or exclude relevant but differently described inventions, and results should therefore be interpreted as indicative rather than exhaustive.
6.2 Public grants
Public grants continue to represent a critical source of funding for firms developing and commercialising ACT, particularly for early-stage organisations operating in capital-intensive, R&D-driven segments of the telecommunications ecosystem. Grants can play an important catalytic role in enabling technical validation, de-risking innovation, and accelerating commercial readiness.
Scale of ACT grant activity
Innovate UK has funded a substantial portfolio of ACT-relevant projects in line with UK Industrial and Digital Strategy priorities. Between 2018 and February 2026:
-
There were 2,227 Innovate UK participant-awards aligned to ACT technologies, collectively offering approximately £800.2 million in funding across the UK.
-
These awards involved around 963 unique firms participating in at least one ACT-aligned Innovate UK grant and when mapped against the ACT company ecosystem indicates that 92 of 501 ACT companies participated in at least one Innovate UK-funded project, equating to a participation rate of approximately 18 % and approximately £140 million of funding.
The difference between the Innovate UK ACT-aligned firm population and the ACT companies identified in this study reflects differences in dataset scope and classification, rather than a gap in analysis. Innovate UK captures all organisations participating in relevant innovation projects, regardless of their primary sector classification. This includes a wide range of actors contributing to ACT development, such as:
-
Semiconductor and advanced materials firms
-
Software and AI firms supporting network functionality
Importantly, a proportion of ACT-related funding is awarded to universities and public research organisations, often as lead partners in collaborative R&D projects. In these cases, funding is recorded at the institutional level and is not always disaggregated to individual company participants. As a result, elements of ACT-related funding are not directly attributable to companies within the dataset. However, the prevalence of consortium-based awards highlights the importance of collaborative R&D structures linking SMEs, large firms, technology incubators, research institutes and universities.
Distribution of grant funding by ACT technology category
The mapping of Innovate UK awards to the ACT taxonomy demonstrates that public funding has been directed towards technologies critical to future connectivity infrastructure and enabling hardware.
Table 6: Number and value of ACT related Innovate UK, 2018 – February 2026
| Technology category | Awards | Award Offered |
|---|---|---|
| Non-Terrestrial Networks | 1,006 | £442.5m |
| Transmission | 676 | £179.8m |
| Physical Layer | 271 | £101.9m |
| Network Infrastructure | 274 | £76.0m |
The average award was just over £360,600 across the 4 technology categories, although the median award value is lower at £115,500, reflecting a right-skewed distribution with a small number of higher-value grants increasing the mean.
Figure 12: Number and value of ACT related Innovate UK awards by technology, 2018 to 2026
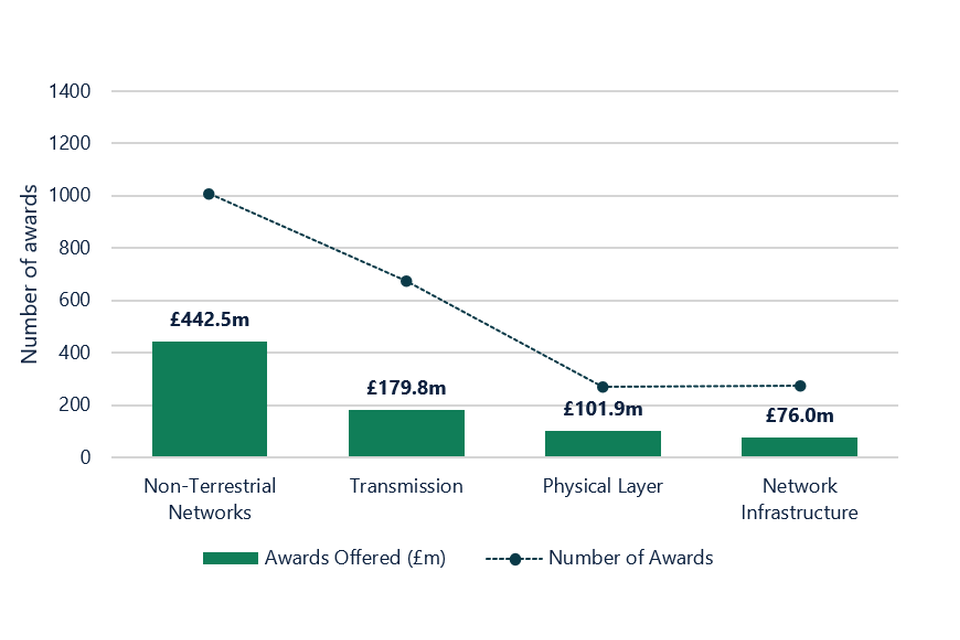
This distribution indicates a concentration of funding in Non-Terrestrial Networks, reflecting UK policy emphasis on coverage resilience and future space-integrated connectivity. In particular:
-
Satellite Communication Platforms account for the largest share of grant awards, with approximately £415.1m across around 876 awards, reflecting strong public investment in space-telecom integration .
-
Airborne Communication Platforms (HAPS/UAV) received roughly £27.1m, indicating sustained investment in high-altitude and non-traditional connectivity testbeds.
In addition to Innovate UK delivery mechanisms, wider public R&D funding, particularly through UK Research and Innovation (UKRI) Federated Telecoms Hubs and related programmes, reinforces this direction of travel, supporting research in areas such as fibre, LiFi and next-generation network technologies.
Across both Innovate UK and UKRI programmes, public grant activity highlights several consistent thematic areas of strategic focus:
-
Integrated satellite-terrestrial communications and Non-Terrestrial Network (NTN) services
-
Photonics and advanced network optics
-
6G-enabling radios and advanced wireless platforms
-
End-to-end resilient communications architectures, spanning cloud-native core to edge networks
These themes align closely with stated priorities from UKRI and DSIT on future communications research missions, and reinforce the observed concentration of funding in areas such as Non-Terrestrial Networks and advanced transmission technologies.
Firm size distribution and funding dynamics
The scale of all awards suggests broad ecosystem engagement:
-
963 organisations participated in ACT-aligned Innovate UK projects
-
Grant participation is skewed towards SMEs and scale-ups, consistent with Innovate UK’s mandate to stimulate innovation
-
Repeated participation is common among specialist ACT developers (e.g. photonics, satellite, Open RAN vendors)
Analysis of the study-matched ACT firms (92 companies) shows that participation in Innovate UK funding is broad-based across firm sizes, with both SMEs and large firms represented.
Within this subset:
-
Enterprise firms account for the greatest share of total funding, reflecting their role in leading higher-value collaborative projects.
-
Micro and small firms represent the majority of participants, consistent with Innovate UK’s focus on supporting early-stage innovation.
-
Medium-sized firms account for a smaller share of total funding, indicating a less prominent role within the funded cohort.
While annual totals fluctuate due to competition cycles, overall public support for connectivity-relevant R&D has remained robust. Figure 13 reflects total Innovate UK ACT-aligned awards across the wider dataset, not just those awarded directly to ACT companies identified in this study:
Figure 13: Actual and projected ACT related Innovate UK award values by year
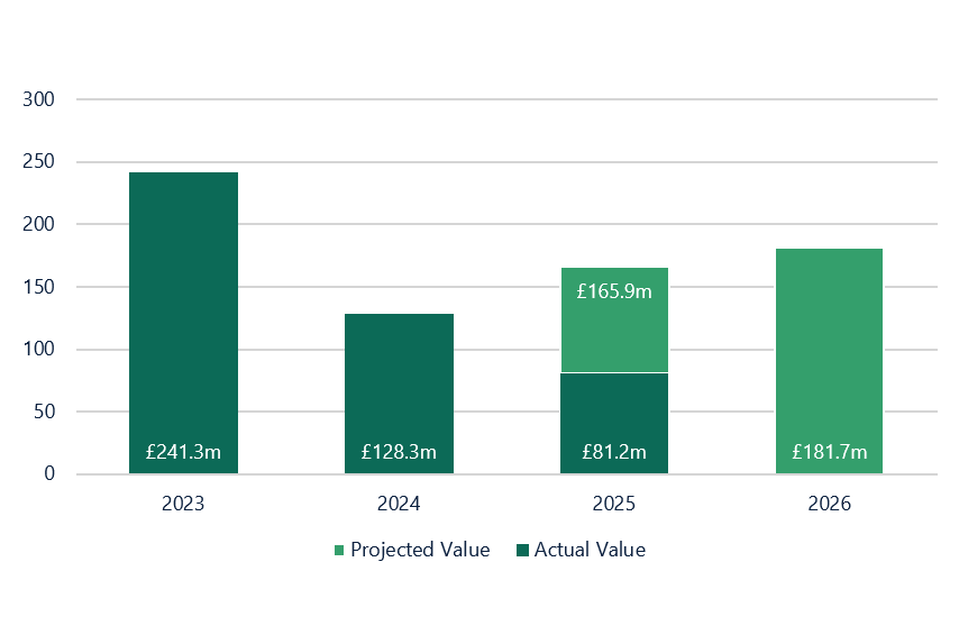
-
2023 stands out as a peak year in award value, with approximately £241.3m disbursed across 363 technology-aligned awards.
-
2024 continues a strong trend with around £128.3m.
-
Early 2025 data (partially represented) already show continued activity with approximately £81.2m in award offers (noting that awards may continue to be recorded retroactively based on start dates and reporting delays).
While the Innovate UK dataset includes records for 2025 and 2026, the year-by-year analysis presented here is based on ACT-aligned project classifications and project start dates, which are subject to reporting lags and ongoing updates. As a result, data for the most recent years is not yet fully complete or directly comparable with earlier periods. By contrast, the aggregate totals presented above (e.g. total funding and firm participation) are less sensitive to these timing effects and therefore provide a more complete view of overall activity across the full dataset. Innovate UK data represents a subset of total public R&D funding and does not include all programmes or funding awarded to universities and consortia, which is not consistently captured at company level.
To provide a more complete view of recent trends, indicative projections for 2025 and 2026 have been included based on observed funding levels in recent years. These projections are derived using a stabilised average of the most recent fully reported years (2023 and 2024), smoothing short term volatility and accounting for the effects of competition cycles. Data for the most recent years is subject to reporting lags and ongoing updates within the Innovate UK dataset, meaning that recorded values for 2025 and 2026 are currently incomplete. As such, projected values are intended to illustrate the underlying trajectory of ACT-related funding rather than represent final award totals.
6.3 Private investment
The development of new growth industries depends not only on research strength and technical talent, but also on the conditions that allow firms to form, attract investment and scale.
UK equity funding
Equity funding excludes normal debt financing, loans and grants, though convertible notes may be included. It is usually a good indicator of investor confidence in a company’s growth potential and of the market’s willingness to back businesses that are still scaling rather than generating steady cash flows. Equity typically comes from venture capital funds, corporate venture arms or private equity firms.
Equity funding into UK headquartered ACT companies totalled just over £300 million over a four-year period from 2022-2025. The number of investment transactions remained relatively stable, with the 2024 funding spike driven by NTT DOCOMO and Space Compass’s $100 million investment into AALTO (in which Airbus remains a major shareholder).
Figure 14: Total equity funding and deals by year
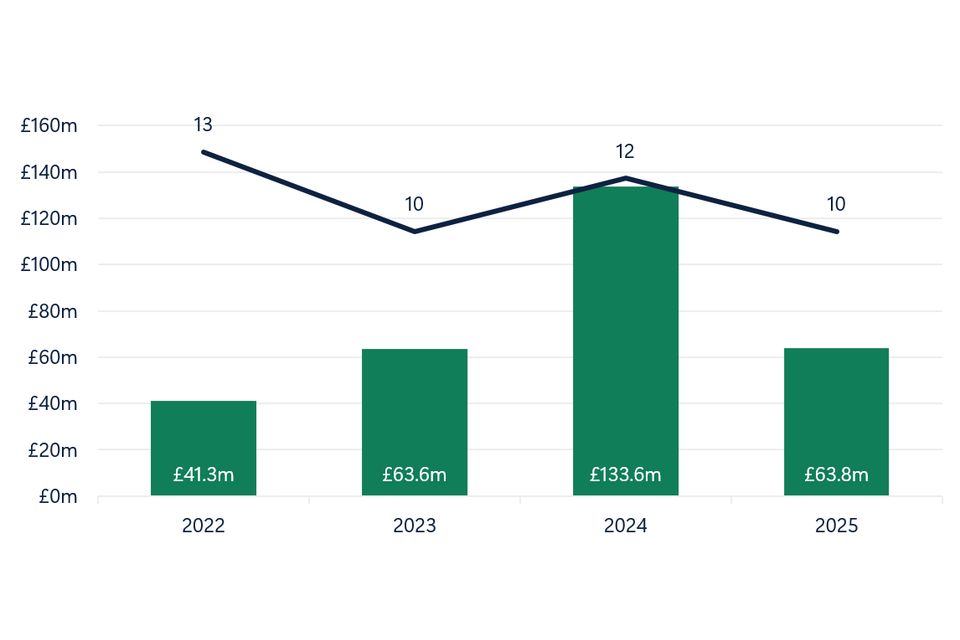
Note: The estimates from the 2025 market scoping report covered a broader company population, a longer time period and were heavily skewed by OneWeb raising over £1.25bn in 2019, so are not directly comparable with the estimates presented here.
6.4 Innovation
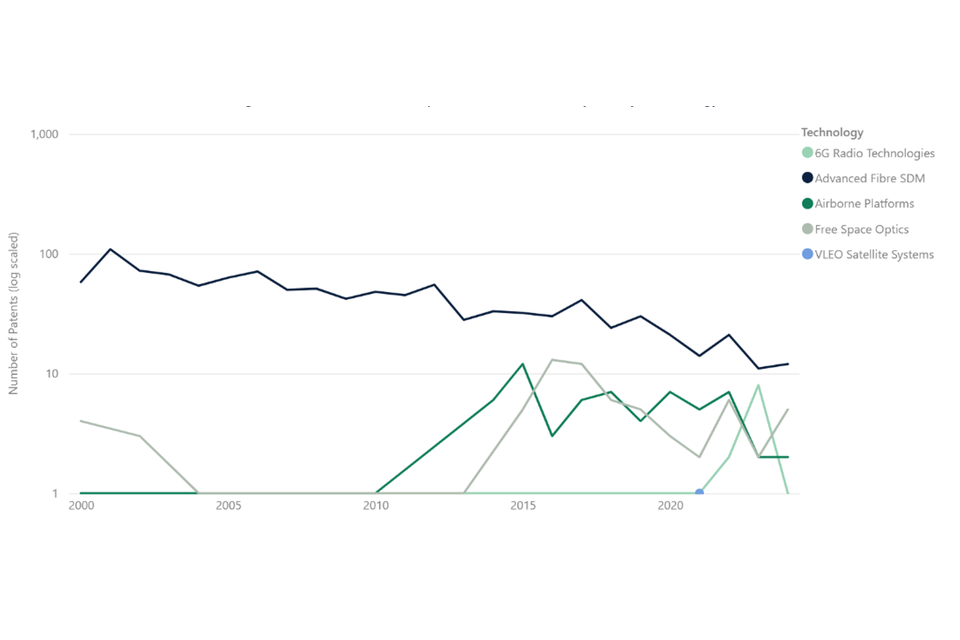
The patent time-series charts are based on patent family data retrieved from Espacenet and are presented on a logarithmic scale so that trends can be compared across technologies with very different patent volumes. On a log scale, a straight line indicates steady year-on-year growth, while a steepening curve indicates accelerating (exponential) growth. Patents with a 2024 priority year are excluded because patent publications typically appear around 18 months after filing, meaning 2024 data would be incomplete.
Figure 15: Global count of new patents released each year, by technology
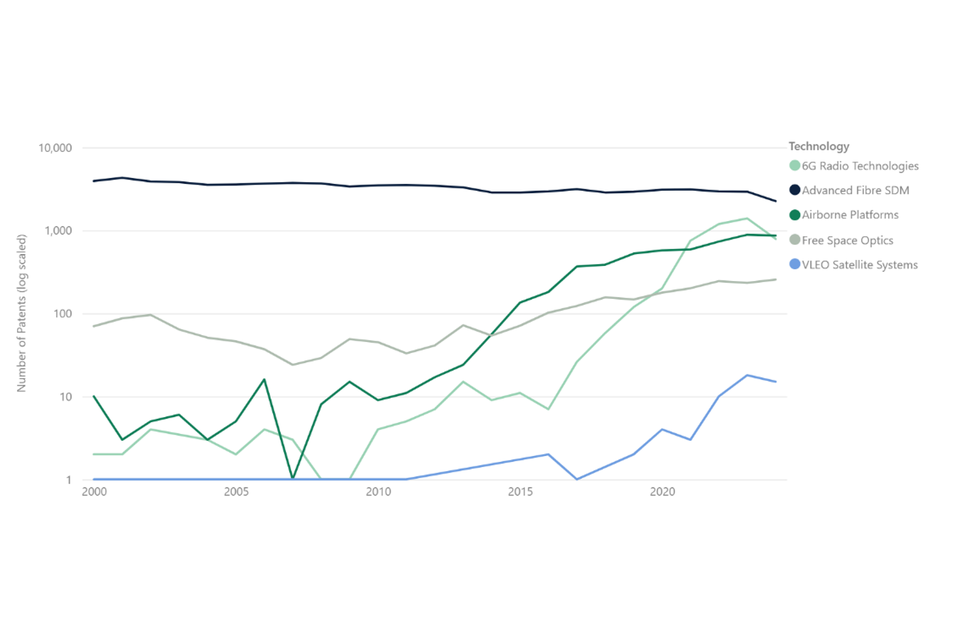
Figure 16: UK count of new patents released each year, by technology
-
VLEO Satellite Systems are the most nascent, with little to no global patenting activity before 2016.
-
6G Radio Technologies and VLEO show the strongest acceleration in global patenting activity, while Free Space Optics and Airborne Platforms also display upward growth trends.
-
Advanced Fibre SDM shows a substantially higher and more stable level of patenting over time, suggesting a more established and consistently active innovation landscape.
-
Across all Tier A ACTs, the UK’s patent position remains modest.
Figure 17: UK Share of global patents, by technology (2000 – 2024)
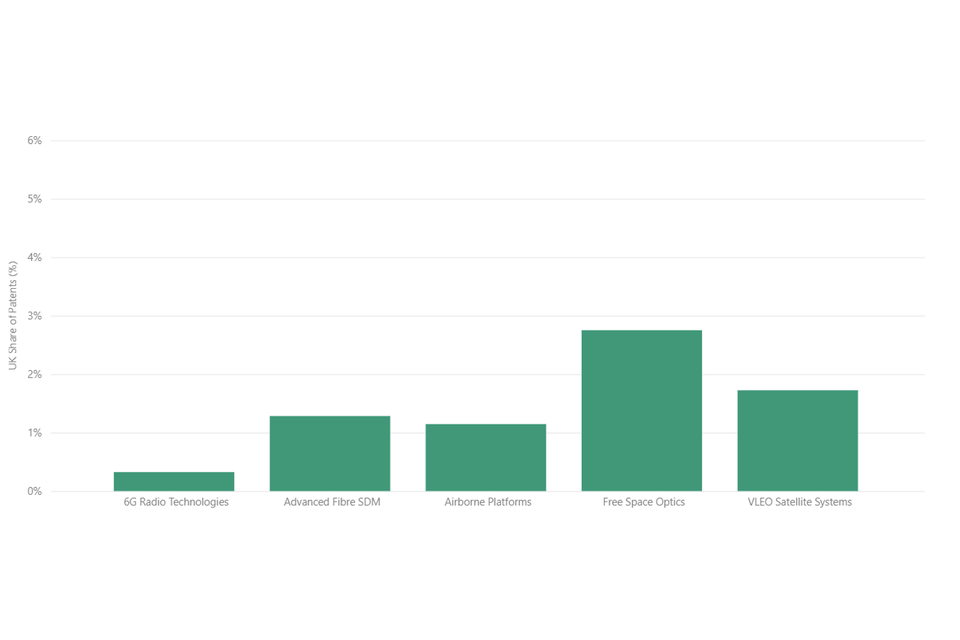
- The UK’s relative position is strongest for Free Space Optics with Archangel Lightworks, a London-based company founded in 2017, holding patents for wide-field-of-view optical receiver design for laser communication systems within the aerospace and telecommunications sectors.
6.5 Potential areas for further research
The analysis indicates that 3 areas may warrant further investigation:
-
Which emerging ACT areas have the strongest scale-up potential? Further research could examine which ACTs, or specific sub-areas within them, offer the clearest opportunity for the UK to build globally competitive firms. This could include assessing whether current grant funding patterns align with the UK’s relative strengths, and where future public support is most likely to help firms develop exportable products, scale internationally and retain value in the UK.
-
How could public funding better support ACT firms from early-stage development to global scale-up? Further research could examine how public funding could be designed for different types and stages of ACT firms. This could include whether smaller grants could be delivered through a more proportionate process, and whether larger or more targeted support could help high-potential firms scale internationally and develop into globally recognised UK-headquartered companies.
-
How could more private investment into UK ACT firms be encouraged? Further research could examine how to strengthen both sides of the private investment market for ACT: whether UK ACT start-ups have the networks and support needed to raise larger funding rounds, and whether UK-based investors have sufficient appetite and fund capacity to back them at scale. This would help assess whether a deeper private investment market could help more UK ACT firms grow into globally competitive companies.
7. ACT Revenue Forecast
7.1 Methodology overview
Growth trajectories are informed by published analyst forecasts, with compound annual growth rates applied to each ACT and adjusted where necessary using triangulation with industry evidence, company guidance and policy analysis. UK-specific forecasts are used in place of global growth rates where market dynamics differ materially, and where robust forecasts are unavailable, assumptions are informed by qualitative evidence including analyst commentary and expert interviews. Uncertainty is reflected through the application of upper- and lower-bound forecast ranges for each ACT, with variation in range width reflecting differences in data quality, maturity and evidence availability across the taxonomy. This approach prioritises transparency and consistency, while recognising that translating sector-level trends to UK company-level outcomes introduces uncertainty and that forecast outputs should be interpreted as indicative rather than precise.
7.2 ACT revenue forecast
The overall ACT revenue forecast provides a high-level view of how the current UK ACT ecosystem could evolve to 2031 if it broadly maintains its present market position.
The central forecast indicates UK ACT revenue rising from £32.9 billion in 2025 to £62.8 billion in 2031, with the uncertainty band reflecting variation in technology-specific market assumptions and revenue apportionment.
Figure 18: UK ACT sector revenue forecast
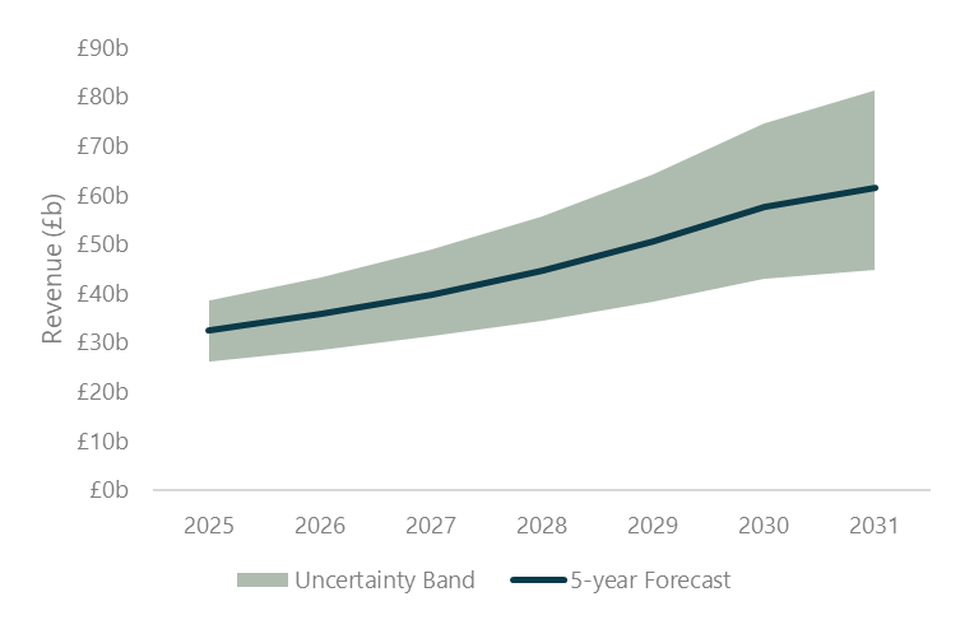
-
Mobile Network Operators are forecast to see the largest absolute increases in ACT-attributable revenue, rising from around £5.9 billion in 2025 to £21.2 billion by 2031. This is driven primarily by the steep rise in the share of mobile connections using 5G, which increases the proportion of mobile service revenue treated as ACT within this study.
-
Private Enterprise Networks is the technology forecast to see the largest absolute rise in revenue, increasing by around £1.7 billion over the period. This reflects strong projected growth in enterprise demand for secure, high-performance local connectivity in settings such as factories, ports, utilities and logistics sites, where private networks support automation, industrial IoT and real-time data processing. The market is also moving beyond pilots towards more repeatable sector-specific deployments.
-
VLEO Satelitte Systems and LiFi are forecast to record the highest growth rates, each at over 4% CAGR (Compound Annual Growth Rate) during the period. For VLEO Satellite Systems, very high growth is projected from a very low starting point, reflecting the emergence of a new technical regime with growing interest in direct-to-device, IoT and other non-terrestrial communications use cases. For LiFi, this reflects growth from a small base and rising demand in dense, RF-constrained and security-sensitive indoor environments such as defence, healthcare and transport. For LPWA Networks, the growth outlook is driven by wider IoT adoption and the expansion of mature low-power connectivity offers across the UK market.
These forecasts provide a point-in-time view based on the best available market forecasts and are anchored to the 2025 UK ACT revenue baseline. Relevant industry forecast growth rates are applied to each technology area on a ceteris paribus basis. In this context, ceteris paribus means that the UK’s current market position and revenue-apportionment assumptions are held constant from 2025, while market growth reflects the adoption, investment and commercialisation assumptions embedded in the underlying analyst forecasts.
Actual outcomes could differ materially if the UK gains or loses market share, if future policy or commercial developments diverge from those assumed in the source forecasts, or if wider external events, such as geopolitical conflict, trade restrictions or supply-chain disruption, materially affect the market. The results should therefore be read alongside the drivers and constraints analysis rather than as fixed predictions.
8. Methodology
8.1 Methodology Principles
The analysis is designed to be proportionate, comparative and transparent. Given data availability and the heterogeneous maturity of ACT technologies, outputs are intended to be directional rather than point precise.
Evidence is triangulated across official statistics, company disclosures, commercial datasets and stakeholder inputs to improve robustness and to identify material discrepancies. Where data are incomplete or uncertain, assumptions are applied consistently and documented transparently, with uncertainty reflected through ranges, scenarios and sensitivity testing rather than false precision.
8.2 ACT Definitions
The ACT taxonomy is defined through a structured, evidence-led process to ensure alignment with industry practice and support robust economic analysis.
This approach comprises:
-
Definition and scope refinement: The starting point is the ACT Scoping Study 2025 taxonomy, which is reviewed against industry standards and widely used technical and commercial definitions to ensure alignment with current market practice. Technologies are redefined, merged or added to reflect distinct, addressable markets aligned to the definition of Advanced Connectivity Technologies. Technologies are removed where they do not meet this definition, are considered legacy, or function primarily as enabling features with broader applications beyond ACT. A key limitation of this approach is that boundaries between technologies can be fluid and may evolve over time, particularly where innovation is rapid or convergence occurs across domains.
-
Treatment of supporting technologies: Technologies with broader applications beyond ACT, such as semiconductors and edge computing, are treated as drivers or constraints on ACT adoption, performance and cost rather than as distinct, addressable markets.
-
Grouping for economic analysis: Technologies are grouped according to shared market characteristics, including demand drivers, investment profiles, regulatory influences and routes to commercialisation. This enables consistent modelling while allowing for technology-specific assumptions on maturity, adoption and market size.
-
Maturity-based tiering: ACTs are grouped into 4 maturity tiers to guide the depth and form of analysis applied. Tiering reflects both the stage of commercial development (from nascent to mature) and the strength of available evidence. A separate services tier captures organisations focused on deployment and operation rather than technology development, and informs the depth and approach to analysis.
8.3 ACT Company Identification
The ACT company identification methodology combines sector classification, keyword-based discovery and analyst validation to establish a consistent and defensible population of ACT companies operating in the UK. It underpins the current-state baseline assessment, five-year forecasting and related analytical outputs.
This approach comprises:
-
SIC code review and application: Company identification begins with the SIC codes used in the 2025 study: 61.100 Wired telecommunications activities, 61.200 Wireless telecommunications activities, 61.300 Satellite telecommunications activities and 61.900 Other telecommunications activities. A key limitation is that SIC codes may not accurately reflect current or specific company activities.
-
Keyword refinement: SIC codes alone do not fully capture emerging or fast-changing activity. Keyword search terms are therefore reviewed and updated to reflect the revised ACT definition. Terms that no longer align with the definitions are removed, and additional standards-based and commercial descriptors are introduced to improve identification of relevant activity across development, infrastructure and network-enabling capabilities. The keyword framework incorporates acronyms and full terminology, as well as UK and US spelling variations (e.g. fibre/fiber), to improve coverage of relevant activity while reducing non-relevant matches. A key limitation is that some relevant companies may still be missed or misclassified where terminology is inconsistent or not clearly disclosed.
-
Company database search and validation: Refined SIC codes and keyword filters are applied in company databases, including Companies House and CBInsights, to identify potentially in-scope companies. Results are then manually reviewed against the ACT definition and taxonomy. Subsidiaries are checked to avoid double counting, and entities with no evidence of current activity, such as no live website or recent statutory accounts, are excluded. For smaller companies (typically fewer than 50 employees), activity is, in most cases, assumed to be either fully ACT-aligned or out of scope, reflecting the practical limitations of detailed assessment at scale. Key limitations include reliance on publicly available information, which may not fully capture the extent of ACT-related activity, and the use of analyst judgement in manual validation, which introduces a degree of subjectivity.
-
Company size: Company size was determined using employee headcount as the primary metric. Where UK-specific headcount data was unavailable, total employment figures (ACT employment) were used as a proxy to ensure consistent classification across all companies. Organisations were then categorised into standard size bands based on headcount thresholds: Micro (≤10 employees), Small (11–50), Medium (51–250), Large (251–1,000), and Enterprise (1,001–100,000). In cases where no employment data was available, companies were flagged for further review.
8.4 Current State Baselining
This section establishes the current baseline for the UK ACT sector. It provides a consistent Year 0 view for FY 2025–26, covering the number of in-scope companies and their economic footprint in terms of employment, revenue, approximate gross value added (aGVA), investment and R&D activity. This baseline is used to anchor subsequent forecasting and scenario analysis.
This approach comprises:
-
Revenue and employment estimation: Revenue and employment estimates draw on the most recent available company disclosures for all in-scope companies from Companies House, typically from Q4 2024 and Q1 2025. Where revenue was not disclosed, a proxy of £100,000 per employee was used and treated as a low-confidence estimate. A key limitation is that this proxy may over- or under-estimate actual revenue, as analysis of available data did not identify consistent revenue-to-employee relationships by ACT or maturity that could support a more tailored approach.
-
Standardisation: All revenue figures were standardised to a 31 December 2025 level using the Consumer Price Index - the standard measure for economy-wide inflation adjustment - to provide a consistent basis for comparison across companies. No consistent relationship between prior employment data and subsequent headcount change was found so a conservative approach was taken, and estimates were standardised assuming no growth. . A key limitation is that year-on-year revenue performance varies widely across the company base, with no observed pattern by ACT or company size. As a result, standardised revenue figures may not fully reflect underlying company performance, particularly for firms experiencing rapid growth or contraction.
-
Company size classification: Company size categories are determined using employee headcount as the primary metric based on the following bands: Micro (≤10 employees), Small (11–50), Medium (51–250), Large (251–1,000), and Enterprise (1,001–100,000). In cases where no employment data was available, companies were flagged for further review.
-
aGVA estimation: aGVA is estimated by applying benchmark aGVA-to-turnover ratios to ACT revenue estimates. These ratios are drawn from the ONS Annual Business Survey data using the most relevant SIC level available for each ACT. The latest data from 2023 is applied for all categories except Non-Terrestrial Networks and Fixed Network Operators where 2021 data is applied due to total aGVA being available in later years. Historical ABS data shows that aGVA-to-turnover ratios can vary materially over time, with some segments exhibiting structural shifts and others showing high volatility: as a result, the use of a single-year benchmark introduces uncertainty, particularly where recent ratios may not be representative of longer-term sector dynamics. These SIC-based ratios should therefore be treated as indicative economic benchmarks rather than precise estimates. aGVA was also normalised to 31 December 2025 level using the same CPI approach.
-
Rounding and totals: Figures are rounded to one decimal place. As a result, totals may not sum exactly due to rounding. Company counts are reported on a distinct-entity basis at the total ACT and category levels. Where a company operates across more than one technology category, it is counted once in the relevant aggregate total to avoid double counting. As a result, the sum of company counts across individual technology rows may exceed the category or total ACT company count.
8.5 Hybrid and Global Company Apportionment
Many ACT companies operate across multiple technologies and geographies. To estimate UK ACT employment and revenue on a consistent basis, company activity is apportioned along 2 dimensions: technology scope (ACT versus non-ACT) and geography (UK versus non-UK).
A structured, evidence-led approach is used to estimate the share of company activity attributable to UK-based ACT operations, prioritising company-specific disclosures and applying standardised assumptions only where direct evidence is limited.
This approach comprises:
-
Materiality threshold and default treatment: Companies with fewer than 50 employees are treated by default as primarily ACT-focused and mainly located in their headquarters geography. Detailed ACT and UK apportionment is prioritised for larger firms, where hybrid activity and multinational footprints are more likely to materially affect estimates. A key limitation is that this approach may over-simplify the activity of smaller firms; however, given their relatively limited revenue contribution, the impact on aggregate ACT estimates is expected to be minimal.
-
Identification of hybrid and global companies: The ACT company population is reviewed to identify firms for which ACT represents only part of wider activity and/or whose operations span multiple geographies. This review draws on company descriptions, product portfolios, keyword alignment to the ACT taxonomy, office locations, regional disclosures and public statements on international operations. Company websites, annual reports and other public disclosures are reviewed where needed and triangulated to derive indicative estimates and sense-check assumptions.
-
Fallback ACT revenue apportionment: Where companies do not disclose revenue at individual technology level, relevant product lines within the reported revenue segment are identified through review of company materials. A neutral starting assumption is then applied in which revenue is distributed evenly across identified product lines within that segment. Maturity-based realisation weights are applied only to ACT-relevant products to reflect differences in commercial realisation across technologies, while non-ACT products contribute zero to the ACT estimate. These weighted shares are used to derive an indicative ACT proportion of the reported revenue segment. A key limitation is that, in the absence of disaggregated reporting, these estimates may over- or under-estimate the true level of revenue attributable to ACT activity.
-
Fallback UK revenue apportionment: Where companies disclose revenue only at global or regional level and no credible company-specific basis exists for a UK split, a GDP-based proxy is applied using nominal GDP data from the IMF World Economic Outlook (October 2025). For globally reported revenue, the UK share is estimated as a proportion of global GDP. For regionally reported revenue, regional GDP totals are constructed using the company’s stated regional definition where available, or a standard geographic reference where not. Revenue reported in non-sterling currencies is converted to pounds sterling using published HMRC average exchange rates. A key limitation is that GDP-based proxies do not capture firm-specific geographic revenue distribution and may over- or under-estimate UK activity for globally integrated businesses.
-
ACT revenue apportionment for ACT services: For Mobile Network Operators, the proportion of mobile network connections on 5G reported in Ofcom’s Mobile Matters 2025 is used as a proxy to estimate ACT-attributable revenue within the relevant UK mobile service revenue line. For Fixed Network Operators whose core offer is gigabit-capable access, UK service turnover is treated as ACT-aligned connectivity revenue unless public evidence indicates material non-connectivity business lines.
-
Confidence ratings and scenario ranges: Each estimate is assigned a confidence rating based on the strength of underlying evidence and the extent of modelling required. High-confidence estimates rely primarily on explicit company disclosures; medium-confidence estimates combine partial disclosures with triangulated evidence; and low-confidence estimates rely more heavily on modelled assumptions. Best- and worst-case ranges are then applied in line with confidence level to support transparent communication of uncertainty and sensitivity testing of aggregate UK ACT estimates, reflecting the varying quality and completeness of underlying data.
8.6 Future Workforce
The assessment of the future UK skills pipeline relevant to Advanced Connectivity Technologies is limited to higher education pathways. The analysis focuses on the undergraduate and postgraduate data from the Higher Education Statistics Agency (HESA), the Joint Council for Qualifications (JCQ), and the University and Colleges Admissions Service (UCAS) in the UK. The analysis is intended to identify patterns in skills coverage and potential areas of constraint, rather than to provide a comprehensive assessment of workforce readiness.
This approach comprises:
-
Undergraduate provision assessment: Relevant programmes are identified using UCAS and university course listings, with Electrical and Electronic Engineering (EEE) as the primary entry route, supplemented by degrees in computing, networking and cyber security to reflect increasing convergence across connectivity and digital systems. A set of ACT-relevant skills, derived from the ACT taxonomy and supporting policy and technical literature, is used to assess course content, including module descriptions and learning outcomes. Courses are classified as ACT-relevant where there is clear and material alignment with these skill areas, based on evidence from course documentation rather than title alone.
-
Postgraduate provision assessment: Postgraduate provision is reviewed separately to assess the depth of more specialised ACT-relevant skills, particularly for earlier-stage and research-intensive technologies. Relevant programmes are identified using the same ACT-aligned keyword and skills framework as the undergraduate analysis, applied to UCAS and university course listings. Given the greater specialisation of postgraduate courses, alignment to ACT is typically clearer and more directly evidenced in course content and research focus. Integrated Masters programmes are assessed separately from standalone Masters and PhD provision. This provides an indication of where advanced technical capability is concentrated across technologies, institutions and locations.
-
Geographic distribution analysis: The geographic distribution of ACT-relevant courses is assessed to understand how the academic pipeline is spread across the UK and how this compares with the location of ACT companies. This is used to identify broad areas of alignment or mismatch between where skills are developed and where ACT employment opportunities are currently concentrated, recognising that graduate mobility means course location is not a direct proxy for workforce location.
-
Entrant and graduate analysis: Entrant and graduate data are analysed using Higher Education Statistics Agency (HESA) data for higher education participation and outcomes, and Joint Council for Qualifications (JCQ) data to provide context on the pre-university pipeline. Relevant subject classifications are mapped to ACT-aligned disciplines to assess the scale and trajectory of the talent pipeline over time. HESA’s approach includes a Full-Person Equivalent calculation to adjust for joint courses. A key limitation is that subject classifications do not map perfectly to ACT categories, requiring the use of judgement in aligning courses to ACT-relevant disciplines.
-
Domicile and demographic analysis: The composition of the pipeline is reviewed using Higher Education Statistics Agency (HESA) data, by domicile (UK vs international) and gender to assess the extent to which ACT-relevant skills provision depends on different entrant groups. This is used to highlight structural features of the future workforce pipeline, including areas where continued reliance on particular cohorts may create vulnerabilities or where participation remains uneven. Gender and domicile analysis draws on different HESA tables, which are reported at different levels of subject granularity. Domicile data is available at CAH Level 3, allowing closer alignment to ACT-related courses, while gender data is only available at CAH Level 1. As a result, the two breakdowns should be interpreted as directional indicators rather than directly comparable totals. A further limitation is that the available data does not allow for more granular demographic analysis (e.g. by ethnicity, socio-economic background or sexuality), and these factors may also be important in understanding participation and access within the ACT talent pipeline.
8.7 Five-Year Forecasting
This section sets out the methodology used to develop a five-year forecast of ACT sector revenue in the UK. The forecast reflects differences in technology maturity, market structure and evidence availability across the ACT taxonomy, and is designed to be transparent and updateable as assumptions evolve.
This approach comprises:
-
Baseline and analogue-informed forecasting: Forecasts are anchored to the FY 2025–26 current-state baseline, with Year 1 beginning in FY 2026–27. Growth trajectories are informed by a review of published analyst forecasts to identify the compound annual growth rates to apply. Where necessary, CAGRs were averaged or amalgamated where a single forecast for the ACT was unavailable.
-
Triangulation with external evidence: Forecast assumptions are triangulated against reputable third-party forecasts, published industry evidence and relevant policy analysis, including sources such as Mordor Intelligence, Grand View Research and MarketsandMarkets. Publicly available company guidance and forward-looking statements are also reviewed where relevant to sense-check near term growth expectations. Where available, UK-specific forecasts are used in place of global growth rates where evidence indicates that UK market dynamics differ materially from global trends. In cases where robust market forecasts are not available, assumptions are informed by qualitative evidence, including analyst commentary and industry interviews, to reflect expected growth trajectories. These sources are used to inform the direction and pace of forecast growth, recognising differences in scope, geography and methodology; however, the translation of sector-level trends to UK company-level outcomes introduces uncertainty, particularly where individual firms may not follow broader market growth trajectories.
-
Uncertainty and sensitivity treatment: Uncertainty is reflected primarily through the treatment of the current-state baseline and through the use of forecast ranges for each ACT, representing reasonable lower- and upper-bound scenarios. Given differences in data quality and company disclosure across ACTs, greater emphasis is placed on understanding the confidence of the baseline estimates than on applying complex uncertainty modelling to later-year projections. Tier A technologies are treated with wider uncertainty ranges, while Tier C technologies are treated with narrower uncertainty ranges. Taken together, this approach prioritises credibility, transparency and usability over model complexity, ensuring that forecast outputs are suitable for strategic decision-making and can be refined as further evidence becomes available.
8.8 Investment and Innovation
This section sets out the methodology used to assess investment and innovation activity across ACT. The analysis draws on a combination of public and commercial datasets to provide directional indicators of research intensity, capital investment and early-stage innovation activity, supporting interpretation of market maturity and ecosystem development across technologies.
This approach comprises:
-
Grant Analysis: This draws primarily on Innovate UK funded projects dataset, the most consistent and structured source of company-level public innovation grant data in the UK. The dataset includes project participants, award values, and funding timelines, enabling analysis of firm-level participation and funding distribution. The analysis covers activity from 2018 to the most recent available data (February 2026). Data is recorded at participant-award level, meaning that a single collaborative project may generate multiple awards across participating organisations. Awards are classified to the ACT taxonomy using keyword and programme-based rules applied to project titles, descriptions and competition metadata. A key limitation is that Innovate UK does not capture the full universe of public R&D funding, with additional support delivered through UKRI and defence programmes, often via universities or consortia without disaggregated company-level allocations. As a result, Innovate UK is used as a proxy for business-facing funding, with under-representation more likely in nascent ACTs.
-
Investment indicators: Venture capital investment activity is assessed over the 2022 - 2025 period using CB Insights data. The analysis covers in-scope ACT companies that are ultimately headquartered in the UK, for which CBInsights has a record. Investment totals reflect disclosed funding amounts only and therefore represent minimum observed values rather than complete measures of capital raised. In addition, the analysis considers contextual evidence on investment intensity, ecosystem maturity, and to help identify UK start-ups showing particularly strong recent investment activity within emerging ACT areas. A key limitation is that investment data is incomplete and may not capture undisclosed or smaller funding rounds.
-
Innovation signal analysis: Patent analysis is used as a directional indicator of early-stage innovation activity and is applied only to Tier A ACTs, where patenting provides the most meaningful signal of technological development. Searches are conducted using Espacenet, combining ACT taxonomy terms, targeted keyword searches and relevant patent classifications. A key limitation is that automated search logic may include adjacent technologies or exclude relevant but differently described inventions, with false negatives more likely than false positives. Manual validation is limited to targeted spot checks, meaning absolute counts should be interpreted with caution. Patent counts are therefore used as a comparative indicator of innovation activity across ACT areas.
8.9 Stakeholder Engagement
This section sets out the stakeholder engagement methodology used to support validation of the ACT company dataset and to gather qualitative insight into market dynamics, skills constraints, scale-up pathways and innovation trajectories. It combines a structured company survey with a programme of qualitative interviews, complementing the quantitative analysis and providing additional evidence from across the ACT ecosystem.
-
Survey design: Two tailored survey versions were issued to validate ACT-attributable revenue, employment and technology classification across the company population. One for firms where baseline revenue estimates were derived using proxy assumptions (e.g. £100,000 per employee), and another for firms where estimates were based on the most recent available Companies House disclosures. In both cases, baseline estimates of revenue and employment were pre-populated within the survey to support validation. Respondents were asked to indicate whether these estimates were above, broadly in line with, or below actual values, with the option to provide exact figures in GBP where they were willing to do so. Respondents were also asked to confirm whether the ACT technologies assigned to their organisation were accurate.
-
Survey distribution and follow-up: Initial contact details were compiled using publicly available company information, including corporate websites and professional networking platforms. The survey was distributed through a structured email campaign (using Mailchimp) and supplemented by targeted follow-up and outreach via professional channels, including LinkedIn, to maximise engagement.
-
Treatment of survey responses: Survey responses were received from approximately 10% of the contacted firm population. For firms that did not respond, estimates were retained. Where exact values were provided, these replaced the estimates. Where banded responses were selected, a consistent, rules based adjustment was applied to uplift or reduce the estimate accordingly. Where respondents confirmed that the estimate was within a ±10% range, the estimate value was retained unchanged. Validated and adjusted values from respondents were integrated systematically, resulting in a final dataset that combines primary survey inputs with transparent, rules‑based proxy assumptions.
-
Expert interviews: In parallel, a programme of 11 qualitative interviews was conducted with experts from industry, academia and the investment community. Interviewees were identified through a combination of the ACT company dataset, targeted research, and relevant professional networks. While the sample is not statistically representative, it is designed to be indicative of current market thinking and to capture a range of informed views across different parts of the ACT ecosystem. Interviews were conducted using a consistent discussion framework to guide coverage of key topics, while allowing flexibility to reflect the expertise and perspectives of individual participants. All engagement was undertaken in line with standard data protection and confidentiality expectations.
-
Use of interview evidence: These interviews were used to provide contextual insight into market dynamics, skills constraints, scale‑up pathways and innovation trajectories, complementing the quantitative analysis. As the number of interviews was limited, evidence may be skewed towards the perspectives of the organisations and experts that were available and willing to participate, rather than being statistically representative of the full ACT company population. Where possible, findings from engagement were cross-checked against market reports, public company information, policy documents and sector data, and used to support interpretation rather than as the sole basis for quantified conclusions.