Abandoned metal mines in England: baseline length of rivers and estuaries polluted by harmful metals
Published 12 March 2025
Applies to England

© Crown copyright 2025
This publication is licensed under the terms of the Open Government Licence v3.0 except where otherwise stated. To view this licence, visit nationalarchives.gov.uk/doc/open-government-licence/version/3 or write to the Information Policy Team, The National Archives, Kew, London TW9 4DU, or email: psi@nationalarchives.gov.uk.
Where we have identified any third party copyright information you will need to obtain permission from the copyright holders concerned.
This publication is available at https://www.gov.uk/government/publications/abandoned-metal-mines-in-england-baseline-length-of-rivers-and-estuaries-polluted-by-harmful-metals/abandoned-metal-mines-in-england-baseline-length-of-rivers-and-estuaries-polluted-by-harmful-metals
Executive summary
The UK has a long history of metal mining and thousands of abandoned metal mines remain across England. Metals continue to pollute rivers because contaminated groundwater drains the vast network of underground mine workings and rainfall washes metals out of the extensive areas of contaminated mine wastes left at the surface.
The government’s Environmental Improvement Plan (2023) stated that abandoned metal mines are the largest source of metal pollution to English rivers and into the marine environment. In 2023, a statutory target was set to halve the length of rivers and estuaries polluted by target substances from abandoned metal mines by 31 December 2038 against the baseline polluted length in 2022.
The target substances are:
- arsenic
- cadmium
- copper
- lead
- nickel
- zinc
This report explains how the Environment Agency has determined the baseline length of rivers and estuaries polluted by any of the target substances from abandoned metal mines as required under the Environmental Targets (Water) (England) Regulations 2023.
Water quality samples were collected from rivers at more than 500 locations over a 12 month period to allow the ‘annual average’ concentration to be calculated. The annual average takes account of metal concentrations fluctuating with rainfall and river flows, and reflects the long-term environmental exposure of aquatic wildlife to these metals.
For a river water quality sample to be considered polluted, concentrations of one or more of the target substances must exceed the Environmental Quality Standards (EQS). The EQS are derived using ecotoxicology data and set at a level that should prevent harmful environmental impacts. When the concentration of a substance in a water sample is higher than the EQS, adverse impacts on the aquatic ecosystem can occur, and the sample is considered to be polluted.
To understand the severity of pollution, we calculated a numeric ‘pollution level’ by dividing the measured concentration of the target substances by the EQS. If the pollution level is greater than 1, the monitoring site is considered polluted by that target substance. Therefore, the higher the numeric pollution level, the greater the likelihood of harm to aquatic life.
The Environment Agency has determined that the baseline length of rivers and estuaries polluted by one or more of the target substances from abandoned metal mines is 1,491 km.
Therefore, to achieve the statutory target to halve the length of rivers and estuaries polluted by target substances from abandoned metal mines by 31 December 2038, pollution must be addressed in at least 746km of rivers.
1. Pollution from abandoned metal mines
The government’s Environmental Improvement Plan (2023) stated that abandoned metal mines are the largest source of metal pollution in English rivers and into the marine environment. It also explained that because there are few, or no other causes of river pollution in most of the catchments polluted by abandoned metal mines, tackling inputs of harmful metals from these mines will support the aim of achieving the objective of good ecological and chemical status in these rivers as set out in river basin management plans.
Our monitoring shows that the elevated metal concentrations in some rivers polluted by abandoned metal mines cause harm to fish and river insects (invertebrates) and adversely affect the overall health of aquatic ecosystems. This negatively impacts wider amenity value, ecosystem services, natural capital, and in some cases, economic activity, often for many tens of kilometres downstream of the abandoned mines.
There are 2 main ways in which these abandoned mines pollute rivers. One way is from mine water discharges (point sources) where contaminated groundwater flows out of old tunnels dug to drain the mines when they were operating (also known as adits or levels). These discharges typically flow all year round, contain high concentrations of metals and may provide the majority of baseflow in upland rivers. Discharges from mine adits cause the most severe water pollution at lower river flows because there is less dilution of the metals they release into rivers. The total length of polluted river is generally longer in dry weather when river flows are lower. An example of a mine water discharge from the Bunton Lead Level, located in the Gunnerside Gill catchment in Swaledale, North Yorkshire is shown in Figure 1.
Figure 1. Example showing metal contaminated groundwater (mine water) flowing out of a point discharge known as Bunton Lead Level in Swaledale, North Yorkshire

© Environment Agency
The other way that abandoned mines pollute rivers is from diffuse sources. Many thousands of tonnes of metal-contaminated mine wastes were left at mine sites when the mines closed. Downstream of the mines, metal concentrations are elevated in river sediments and floodplain soils, often for many tens of kilometres. Metals are washed into rivers from these ‘diffuse sources’ by rainfall. The amount of metals that enter rivers from these sources significantly increases after rainfall. However, whilst this increases the mass (in kilograms) of metals being transported into and down river systems, the severity of water pollution is decreased because dilution by rainfall lowers the concentration of metals in rivers. The total length of polluted river is typically shorter in wetter weather when river flows are higher.
The Carrshield Tailings Dam shown in Figure 2 is an example of a diffuse source. Prior to remediation measures being completed in 2020, up to 3 tonnes of target metals were being washed into the River West Allen each year, contributing to pollution in up to 40km of rivers. For more information, see Project cuts pollution in Northumberland.
Figure 2. Example of diffuse sources
The Carrshield Tailings Dam contains about 1,000 tonnes of lead, cadmium and zinc and prior to intervention by the Water and Abandoned Metal Mines (WAMM) Programme, was polluting the River West Allen in Northumberland
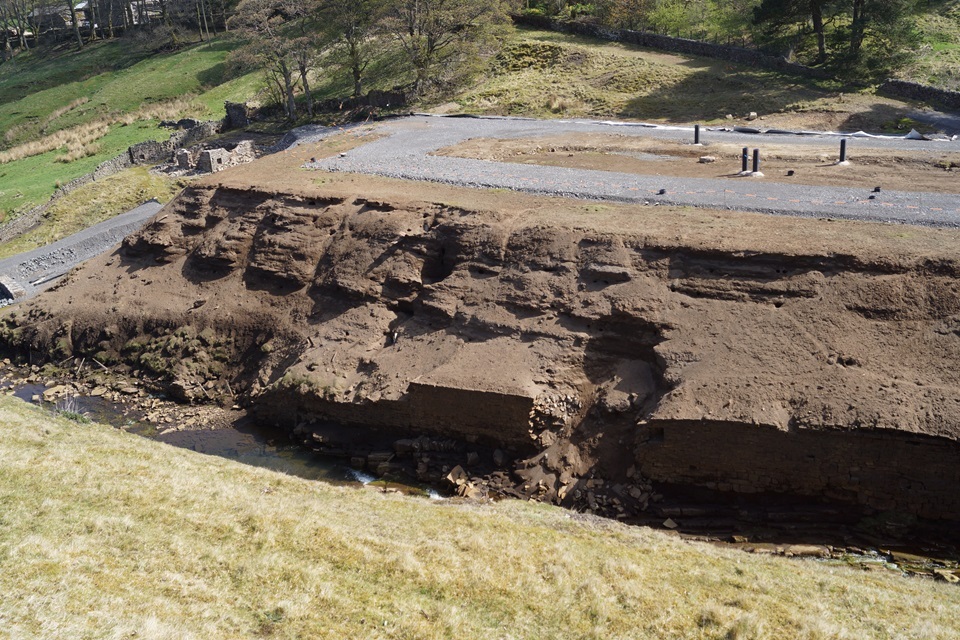
© Environment Agency
2. Abandoned metal mines in England
The UK has a long history of metal mining with evidence of Bronze Age, Roman and medieval activity. Mining output peaked in the 18th and 19th centuries as a key part of the industrial revolution. Almost all these mines were abandoned in the early 20th century and the final deep mines extracting metals or industrial minerals had closed before 2000. However, after centuries of mining activity, thousands of abandoned metal mines remain across England with a vast network of underground mine workings from which contaminated groundwater continues to provide baseflow to rivers, often causing serious pollution.
Until 2000, mining operators could abandon a mine without any liability for dealing with ongoing water pollution issues. Today, abandoned metal mines continue to release up to half of the metals found in surface waters, as much as all authorised discharges from industry, polluting rivers across England, and are the largest source of metals entering estuarine, coastal and marine waters.
Most polluting mines were abandoned long before 2000 and so no one can be held legally responsible for the ongoing water pollution. Unlike coal mines, the rights to mine metals and the mines themselves were always privately owned so no government agency has ever been established to pick up the liabilities and manage the legacy of the pollution left behind.
Instead, in 2011, the UK government set up the ‘Water and Abandoned Metal Mines’ (WAMM) Programme to tackle this polluting industrial legacy. This is a partnership between the Department for Environment, Food and Rural Affairs (Defra) as sponsor and primary funder, and the Environment Agency and the Mining Remediation Authority as joint delivery partners. For more information, please visit Water and Abandoned Metal Mines Programme.
Figure 1 shows the English river management catchments that are polluted by abandoned metal mines along with known sources of metals. Please note, any questions about pollution of Welsh or Scottish rivers by abandoned metal mines should be directed to Natural Resources Wales or the Scottish Environmental Protection Agency.
Figure 3. Map showing the 20 management catchments across England in which there are known discharges to rivers from abandoned metal mines, closed metal mining waste sites and areas of mine spoil (mine waste)

© Environment Agency
3. Environment Act Abandoned Metal Mines Water Target
In January 2023, several legally binding long-term targets for England under the Environment Act 2021 were set . The government’s Environmental Improvement Plan refer to these targets and other environmental commitments as part of the first 5 year review of the Plan.
The Environmental Targets (Water) (England) Regulations 2023 set the long-term targets in respect of 4 matters within the water priority area. Part 4 of these Regulations requires that by 31 December 2038, the length of relevant waters polluted by any of the target substances (arsenic, cadmium, copper, lead, nickel and zinc) from abandoned metal mines is at least 50% lower than the baseline.
The baseline is defined in the Regulations as:
The length of relevant waters considered polluted by any of the target substances from abandoned metal mines in the year from 1 January 2022 to 31 December 2022.
For the purposes of this target, the relevant waters are freshwaters and estuaries (but not coastal waters), and the baseline is the length of relevant waters considered polluted by any of the target substances in 2022. This is explained further in the section on ‘Relevant waters for the Environment Act metal mines target: rivers, streams and estuaries’.
The legal basis for the Environment Agency’s approach to assessing whether target substances are causing pollution is set out in The Water Framework Directive (Standards and Classification) Directions (England and Wales) 2015 (referred to henceforth as the ‘2015 Ministerial Directions’). This approach is explained in the section on ‘assessing pollution’. The target will be achieved for a particular length of river or estuary when our water quality monitoring shows that none of the target substances (arsenic, cadmium, copper, lead, nickel and zinc) are causing pollution.
4. Identifying rivers and estuaries polluted by abandoned metal mines
To identify rivers and estuaries that were likely to be polluted by target substances from abandoned metal mines and therefore should be included when determining the baseline length for the Environment Act target, we used existing information held by the Environment Agency.
The first comprehensive assessment of pollution by abandoned metal mines in England and Wales was a research project carried out by Newcastle University, the Mining Remediation Authority and a specialist consultancy, Atkins, for the Environment Agency, Defra and Welsh government between 2007 and 2009: Prioritisation of abandoned non-coal mine impacts on the environment. The results were also published in several peer-reviewed journal articles, for example Mayes and others, 2009, 2010, 2013.
In 2012, the Environment Agency published the Inventory of closed mining waste facilities which focused on river pollution from mine wastes (diffuse sources).
We have subsequently carried out extensive investigations in many catchments as part of the Water and Abandoned Metal Mines (WAMM) Programme. This was set up in 2011 as a partnership between the Environment Agency, Defra and the Mining Remediation Authority, to clean up this type of river pollution. Our main role is to identify key sources of metal pollution requiring remediation measures. We pass priority sources to the Mining Remediation Authority, who develop options for mine water treatment schemes and interventions to limit inputs from diffuse sources. Numerous unpublished catchment studies have improved our understanding of which rivers are polluted by abandoned metal mines, helping us to identify the key sources of metals. All water quality data collected by the Environment Agency are freely available from our water quality data archive.
Additional data sources include:
- geological mapping by the British Geological Survey, particularly the locations of mineral veins
- Defra and Environment Agency ‘Source apportionment of pollution from non-coal mines’ research project by Newcastle University and Hull University (unpublished, 2012 to 2015)
We used these information sources to carry out targeted monitoring in rivers already known to be polluted by abandoned metal mines. See the section on ‘Reports on pollution from abandoned metal mines in individual management catchments’ for summaries of the baseline data for each of the 20 management catchments.
5. Water quality monitoring to determine the baseline polluted length
The Environment Agency is responsible for determining the baseline length, which we previously estimated to be approximately 1,500km. However, water quality samples prior to 2022 were not collected specifically to measure the length of rivers and estuaries polluted by the target substances. We estimated that the figure of 1,500km had a margin of error of plus or minus 20%. Therefore, we needed to collect additional water quality samples to improve confidence in the accuracy of the baseline polluted river length.
The length of rivers polluted by abandoned metal mines fluctuates in response to natural variation in rainfall and river flows. However, this length will not materially change unless remediation measures like mine water treatment schemes or diffuse interventions are installed to decrease inputs of metals. Therefore, data collected after 31 December 2022 are considered to be representative of rivers, provided no new remediation measures had been constructed since 2022. In catchments where new remediation measures were in place, we only used data collected before those measures were installed.
Water quality data collected between 1 January 2022 and 31 March 2024 have been used to determine and validate the baseline length of rivers and estuaries considered polluted in 2022. Some baseline monitoring took place during 2022, but most water quality samples were collected during 2023. We carried out monthly monitoring at more than 500 locations across the 20 management catchments highlighted in Figure 3. Monthly monitoring meant we captured a range of river flows. Generally, at least 12 samples were collected from each sampling location to allow the annual average concentration to be calculated with high confidence. The measured concentrations of the target substances in rivers can fluctuate substantially in response to river flows over short periods (hours to days). The annual average reflects the overall range of higher and lower concentrations that occur within a year, and therefore the long-term environmental exposure experienced by aquatic wildlife.
Water quality data from before 2022 were used to identify polluted rivers, to increase confidence in the long-term nature of this pollution, and to confirm river pollution between some of the more recent sampling locations. However, we only used water quality samples collected between January 2022 and March 2024 to calculate the annual average concentrations and formally determine the baseline polluted length.
You can see the 20 management catchments where we monitored for baseline water quality in Figure 3.
Selecting the monitoring locations
To select the monitoring locations in each impacted catchment we first carried out a desk-based review of previous water quality data, maps and other information available to the Environment Agency. We then carried out initial site visits to collect water quality samples and to assess the suitability of locations for continued sampling. This included safe access and whether results from the site were allowing us to determine the length of polluted rivers. We aimed to collect water samples both upstream and downstream of abandoned mines to find out exactly where the pollution starts and stops, although in several catchments, mine water discharges form the most upstream start of the river.
Defining the baseline polluted river length
We used the detailed Ordnance Survey (OS) water network geographical information systems (GIS) mapping layer to calculate the baseline polluted river length. This OS layer shows the precise course of all rivers, streams, lakes and canals in Great Britain from their source to the coast. There’s more information on the OS water network in the OS MasterMap Networks.
Relevant waters for the Environment Act metal mines target: rivers, streams and estuaries
Part 4 of the Environmental Targets (Water) (England) Regulations 2023 defines ‘relevant waters’ as meaning freshwaters and estuaries but not coastal waters. For this report, ‘freshwaters’ includes rivers and lakes but not groundwater. In practice, more than 95% of relevant waters polluted by abandoned metal mines are rivers or streams. Some lakes and reservoirs which are supplied by polluted rivers are also included. Some rivers are polluted until they enter the sea and therefore some estuaries are polluted downstream of the freshwater limit. The figures below show examples of how the baseline polluted length has been determined for different types of relevant waters.
Figure 4. Rivers and streams – example from the Wharfe and Ouse Lower management catchment showing how the OS Water Network was used to calculate the baseline polluted length
In this example, the polluted 9km of Hebden Beck is highlighted in red. The blue lines represent rivers and streams in the OS Water Network that are not polluted by abandoned metal mines.

© Environment Agency
Figure 5. Lakes and reservoirs – example from the Derwent North West management catchment showing how the OS Water Network was used to calculate the baseline polluted length
In this example, the polluted 7.3km of Bassenthwaite lake, highlighted in red, is included because upstream and downstream rivers are polluted. The blue lines represent the OS water network that is not polluted by abandoned metal mines.

© Environment Agency
Estuaries: the polluted length is calculated using water quality results from monitoring points overlaid on the OS layer from the tidal limit to the coast (see Figure 6).
Figure 6. Estuaries. Example from the Tyne management catchment showing how the OS Water Network was used to calculate the baseline polluted length of the Tyne estuary
The polluted estuary length is shown in red.

© Environment Agency
Water quality sampling and analysis
Water quality samples were collected in accordance with standard Environment Agency guidelines. Samples were filtered in the field through a 0.45µm membrane syringe filter to allow analysis of the operationally defined ‘dissolved’ metal concentration. Parameters including pH, dissolved oxygen (DO), conductivity and temperature were monitored in the field.
Samples were then transported to the Environment Agency’s National Laboratory Service (NLS) for analysis using the ‘METD’ dissolved metal suite which includes:
- dissolved nickel, cadmium, copper, lead and zinc via inductively coupled plasma mass spectrometry (ICP-MS)
- calcium and magnesium via inductively coupled plasma optical emission spectroscopy (ICP-OES)
- dissolved organic carbon
The environmental quality standard (EQS) for cadmium depends on the ‘hardness’ of the water sample, which is calculated using the concentrations of calcium and magnesium (see Table 1). The METD lower reporting level for cadmium is 0.1µg/L (parts per billion) which is above the cadmium EQS in low hardness waters. Therefore, where cadmium concentrations were recorded between 0.08 and 0.1µg/L during initial sampling, the METDLO suite was then used for future analysis since the lower reporting level for cadmium with this suite is 0.01µg/L. The lower reporting levels for the other target substances are higher than the EQS set out in the 2015 Ministerial Directions.
Analysis for arsenic was undertaken via ICP-MS using the NLS METDAS analysis suite. We only analysed for arsenic on samples collected from certain rivers in Devon, Cornwall and Cumbria. This is because we know from previous mine water data and information on the local geology that arsenic only poses a pollution risk in certain rivers, and to avoid the cost of unnecessary analysis.
6. Assessing pollution
For a river water quality sample to be considered polluted, concentrations of one or more of the target substances must exceed the relevant Environmental Quality Standards (EQS) set by government when assessed as an ‘annual average’. The EQS are set out in the 2015 Ministerial Directions.
The EQS are derived using ecotoxicology data and set at a level that should prevent harmful environmental impacts. When the concentration of a substance in a water sample is higher than the EQS, adverse impacts on the aquatic ecosystem can occur, and the sample is considered to be polluted.
Pollution in freshwaters: streams, rivers and lakes
The EQS for each of the Environment Act metal mines target substances are presented in Table 1 and refer to the dissolved concentration (which is the dissolved phase of a water sample obtained by filtration through a 0.45μm filter). The EQS for most of the target substances varies with the bulk water chemistry.
For nickel, lead, copper and zinc, the EQS is based on the ‘bioavailable’ metal which takes account of how much of a metal in the water column is ‘available’ to organisms (fish, invertebrates or algae), and therefore the fraction of the dissolved metal likely to result in toxic effects. Bioavailability is primarily affected by pH, calcium concentration and dissolved organic carbon (DOC). DOC is the carbon remaining in a water body after bacteria have broken down organic matter in the water. Some metals form extremely strong complexes with DOC which reduces the bioavailability of these metals to organisms.
The bioavailable metal concentration is calculated using the Rivers and Lakes - Metal Bioavailability Assessment Tool (M-BAT) which uses the ‘biotic ligand model’ (BLM) to calculate the site-specific bioavailable concentration of a metal based on the dissolved metal concentration, pH, DOC and calcium concentration. For lead, the bioavailable metal is calculated with the DOC only.
For cadmium, the EQS varies depending on the hardness of the water, which is a function of the concentration of magnesium and calcium.
The EQS for arsenic does not vary with water chemistry.
Table 1. Freshwater environmental quality standards for all target substances
See The Water Framework Directive (Standards and Classification) Directions (England and Wales) 2015).
| Substance | EQS | Notes |
|---|---|---|
| Arsenic (As) | 50µg/L | Dissolved fraction |
| Cadmium (Cd) | ≤0.08µg/L (<40mg CaCO3/L) 0.08µg/L (40 to <50mg CaCO3/L) 0.09µg/L (50 to <100mg CaCO3/L) 0.15µg/L (100 to <200mg CaCO3/L) 0.25 µg/L (≥200mg CaCO3/L) |
EQS depends on hardness (reported as CaCO3/L) |
| Copper (Cu) | 1µg/L | Bioavailable fraction |
| Lead (Pb) | 1.2µg/L | Bioavailable fraction |
| Nickel (Ni) | 14µg/L | Bioavailable fraction |
| Zinc (Zn) | 10.9µg/L plus ABC [Note 1] | Bioavailable fraction and ABC [Note 1] |
Note 1: ambient background concentration (ABC) values are listed in Table 2.
Naturally occurring metal concentrations in rivers depend on the local geology and can vary over orders of magnitude. In catchments where mining activity has taken place, the background concentrations will often be elevated compared to non-mineralised catchments.
The 2015 Ministerial Directions require an ‘ambient background concentration’ (ABC) to be applied when assessing compliance with the zinc EQS and allow the natural background concentrations to be considered for other metals. The 2015 Ministerial Directions state that the ‘ABC is the environmental concentration expected where no (or only minor) anthropogenic inputs are present’. For this report, the ABC has only been considered for zinc because ABC values have not been approved for other substances.
The zinc ABCs for the 20 management catchments known to be polluted by abandoned metal mines across England are shown in Table 2. For catchments where no ABC is specified, the default zinc ABC concentration of 1.4µg/L has been applied in accordance with the 2015 Ministerial Directions. When assessing compliance with the EQS, the ABC value is subtracted from the concentration measured in the sample, before the bioavailable zinc is calculated.
Table 2. Ambient background concentrations for dissolved zinc in the relevant management catchments
Values applied from the 2015 Ministerial Directions.
| Management catchment | ABC (µg/L) [Note 1] |
|---|---|
| Aire and Calder | 1.4 [Note 2] |
| Avon Bristol and Somerset North Streams | 1.4 [Note 2] |
| Derwent North West | 1.4 [Note 2] |
| Derwent Derbyshire | 1.4 [Note 2] |
| Dove | 1.4 [Note 2] |
| Eden and Esk | 1.2 |
| Kent or Leven | 1.4 [Note 2] |
| North Cornwall, Seaton, Looe and Fowey | 1.4 [Note 2] |
| Severn Uplands | 1.4 [Note 2] |
| Somerset South and West | 1.4 [Note 2] |
| South Devon | 1.7 |
| South West Lakes | 1.4 [Note 2] |
| Swale, Ure, Nidd and Upper Ouse | 2.9 |
| Tamar | 2.9 |
| Tees | 4.1 |
| Teme | 1.4 [Note 2] |
| Tyne | 4.8 |
| Wear | 1.4 [Note 2] |
| West Cornwall and the Fal | 5.8 |
| Wharfe and Lower Ouse | 2.9 |
Note 1: ABC is an estimate of background concentration based on a low percentile of monitoring data.
Note 2: In these management catchments, the 2015 Ministerial Directions do not provide an ABC and therefore the value of 1.4µg/L for ‘other freshwaters’ has been applied.
The zinc ABCs in Table 2 are not true background concentrations for a particular catchment in the absence of anthropogenic (for example, mining) inputs. They were calculated as the 5th percentile of the distribution of water quality monitoring data for a specific hydrometric area (see WFD UKTAG, 2014). Therefore, these ABCs do not represent the elevated dissolved zinc concentrations that would have naturally been found in mineralised catchments before any mining activity took place.
Pollution in estuaries
In some rivers, pollution from abandoned metal mines extends downstream from the freshwater limit into the estuary. The 2015 Ministerial Directions specify different EQS values for saltwater and freshwater. The salt water EQS have been applied to samples collected in estuaries. The saltwater EQS are presented in Table 3. Note that in the marine environment, all EQS are based on the dissolved (filtered) concentrations.
Table 3: Marine environmental quality standards for the target substances as an annual average
See the 2015 Ministerial Directions.
| Substance | EQS | Notes |
|---|---|---|
| Arsenic (As) | 25µg/L | Dissolved fraction |
| Cadmium (Cd) | 0.2µg/L | Dissolved fraction |
| Copper (Cu) | 3.76µg/L | Dissolved fraction where DOC is less than or equal to 1 milligram per litre (mg/L) |
| Copper (Cu) | 3.76 + (2.677 × ((DOC/2) − 0.5)) μg/L | Dissolved fraction where DOC is greater than 1mg/L |
| Lead (Pb) | 1.3µg/L | Dissolved fraction |
| Nickel (Ni) | 8.6µg/L | Dissolved fraction |
| Zinc (Zn) | 6.8µg/L | Dissolved fraction plus ABC – for saltwater, an ABC of 1.1µg/L is applied |
‘Pollution levels’
For nickel, lead, zinc and copper, the M-BAT tool calculates a ‘risk characterisation ratio’ (RCR) from dividing the bioavailable metal concentration by the EQS. For cadmium and arsenic, we applied a similar approach and divided the measured concentration by the EQS to calculate an RCR.
In this report, we use the term ‘pollution level’ to represent the RCR. If the pollution level is greater than 1, the monitoring site is considered polluted by that target substance. The pollution level indicates the severity of pollution by the target substances. Therefore, the higher the numeric pollution level, the greater the likelihood of harm to aquatic life.
Determining the length of river polluted by abandoned metal mines
The length of a river polluted by abandoned metal mines is not fixed. It is continually fluctuating in response to changing river flows, rainfall and the total amount of metals entering rivers via mine water and from diffuse sources like mine wastes. As such, the concentrations of target substances at a particular location will inevitably vary between sampling events.
Figure 7 illustrates how the length of polluted river naturally fluctuates using a hypothetical example. In this catchment, the total length of the river is 50km. At lower river flows, 40km of the river is polluted by a mine water discharge. However, when rainfall causes higher river flows, the polluted length decreases to 20km because the rainfall means there is more clean water to dilute the substances causing pollution. To report the baseline length of polluted river for the Environment Act target, the pollution level was calculated for each sampling location, and only those locations with an annual average pollution level greater than 1 were used to measure the length of river that is considered polluted for the baseline.
Figure 7. Example showing how the polluted river length fluctuates with changing flow conditions

It was not feasible to monitor water quality along the full length of potentially polluted rivers for financial and practical reasons, for example unsafe access to the river to collect samples. Therefore, it was necessary to use expert judgement to estimate pollution levels between sampling locations, particularly at the downstream end of polluted rivers.
For example, in rivers where the pollution level for one or more of the target substances decreases to below 1 between sampling points, expert judgement and local knowledge were used to make an informed decision on the length of polluted river between the 2 sampling points (see Figure 8). In most instances, the downstream extent of pollution is assumed to be the point where a tributary (or series of tributaries) with no known sources of pollution from abandoned metal mines joins the watercourse being monitored. We consider that downstream of this point, the pollution level in the watercourse is likely to be less than 1 due to dilution by the incoming tributaries.
Figure 8. Example showing how the polluted length is determined where the pollution level decreases to below 1 between sampling points

This approach will be followed in future monitoring to assess progress against the statutory target, including the final monitoring in 2038.
In some instances, the measured pollution level at the farthest downstream monitoring point may be only just above 1 (usually lower than 1.5). In such cases, we have used expert judgement and local knowledge to determine that the river is polluted down to where the next downstream tributary joins the river. This is illustrated in Figure 9.
Figure 9. Example showing how the polluted length is determined in a scenario where the pollution level in the farthest downstream sampling point is just above 1 (for example, 1.2)

7. Results of the baseline water quality monitoring
Based on our water quality monitoring across England, we have determined that 1,491km of rivers and estuaries are polluted by target substances from abandoned metal mines.
The polluted length for each of the 6 target substances in the 20 management catchments impacted by abandoned metal mines is presented in Table 4. The lengths of rivers failing the EQS due to pollution from abandoned metal mines is also shown visually in Figure 10.
We have produced an individual report for each of the 20 management catchments which provide a more detailed description of the monitoring results. Links to these reports can be found in section 8.
Table 4. Length of rivers and estuaries (km) polluted by one or more target substances in each management catchment due to abandoned metal mines
| Management catchment | Environment Agency area | Total length of polluted rivers and estuaries (km) | Length polluted by each substance [Note 1] |
|---|---|---|---|
| Eden and Esk | Cumbria and Lancashire | 59 | Arsenic (2km) Cadmium (30km) Lead (24km) Zinc (53km) |
| Derwent North West | Cumbria and Lancashire | 58 | Cadmium (13km) Copper (4km) Lead (20km) Nickel (1km) Zinc (42km) |
| Kent and Leven | Cumbria and Lancashire | 9 | Copper (8km) Zinc (6km) |
| South West Lakes | Cumbria and Lancashire | 12 | Cadmium (12km) Lead (3km) Zinc (11km) |
| West Cornwall and Fal | Devon, Cornwall and Isles of Scilly | 264 | Arsenic (4km) Cadmium (206km) Copper (174km) Lead (20km) Nickel (68km) Zinc (249km) |
| Devon South | Devon, Cornwall and Isles of Scilly | 21 | Cadmium (21km) Copper (1km) Lead (2km) Nickel (1km) Zinc (14km) |
| North Cornwall, Seaton, Looe and Fowey | Devon, Cornwall and Isles of Scilly | 49 | Cadmium (27km) Copper (25km) Lead (15km) Nickel (14km) Zinc (40km) |
| Tamar | Devon, Cornwall and Isles of Scilly | 90 | Cadmium (62km) Copper (67km) Lead (10km) Nickel (4km) Zinc (81km) |
| Derwent Derbyshire | East Midlands | 143 | Cadmium (112km) Lead (23km) Zinc (107km) |
| Tyne | North East | 217 | Cadmium (185km) Lead (89km) Zinc (209km) |
| Tees | North East | 46 | Cadmium (44km) Lead (45km) Zinc (35km) |
| Wear | North East | 86 | Cadmium (97km) Lead (50km) Zinc (85km) |
| Avon Bristol and Somerset North Streams | Wessex | 25 | Cadmium (23km) Lead (7km) Zinc (25km) |
| Somerset South and West | Wessex | 45 | Cadmium (12km) Lead (38km) Zinc (45km) |
| Dove | West Midlands | 69 | Cadmium (69km) |
| Severn Uplands | West Midlands | 44 | Cadmium (43km) Lead (18km) Nickel (3km) Zinc (34km) |
| Teme | West Midlands | 37 | Cadmium (37km) Lead (21km) Zinc (37km) |
| Aire and Calder | Yorkshire | 2 | Cadmium (2km) Lead (2km) Zinc (2km) |
| Swale, Ure, Nidd, Ouse Upper | Yorkshire | 206 | Cadmium (193km) Copper (3km) Lead (118km) Zinc (129km) |
| Wharfe and Ouse Lower | Yorkshire | 9 | Cadmium (9km) Lead (9km) Zinc (9km) |
Note 1: The polluted length of rivers and estuaries across England for each of the 6 target substances is presented in Table 5.
Table 5. Length of rivers and estuaries (km) polluted by each of the 6 target substances due to abandoned metal mines across England
| Target substance | Length of polluted rivers and estuaries |
|---|---|
| Arsenic (As) | 6km |
| Cadmium (Cd) | 1,157km |
| Copper (Cu) | 282km |
| Lead (Pb) | 510km |
| Nickel (Ni) | 93km |
| Zinc (Zn) | 1,172km |
Figure 10. Map showing the baseline length of rivers polluted by target substances from abandoned metal mines in England

© Environment Agency
8. Reports on pollution from abandoned metal mines in individual management catchments
There’s more information on the baseline data for each of the 20 polluted management catchments in the reports published alongside this document on GOV.UK.
9. References
Coal Authority, 2020. Project cuts pollution in Northumberland.
Defra, 2023. Environmental Improvement Plan 2023.
Environment Agency, 2012a. Prioritisation of abandoned non-coal mine impacts on the environment.
Environment Agency, 2012b. Inventory of closed mining waste facilities.
Environment Agency, 2022. River basin management plans, updated 2022: introduction.
Mayes, W.M, Johnston, D, Potter, H.A.B., and Jarvis A.P. 2009. A national strategy for identification, prioritisation and management of pollution from abandoned non-coal mine sites in England and Wales. I. Methodology development and initial results. Science of the Total Environment, 407(21), 5435-5447.
Mayes, W.M., Potter, H.A.B., and Jarvis, A.P. 2010. Inventory of aquatic contaminant flux arising from historical metal mining in England and Wales. Science of the Total Environment, 408, 3576-3583.
Mayes, W.M., Potter, H.A.B., and Jarvis, A.P. 2013. Riverine flux of metals from historically mined orefields in England and Wales. Water, Air, and Soil Pollution, 224, 1-14.
Ordnance Survey. OS MasterMap Networks - Water Layer, Data Products.
UKSI, 2015. The Water Framework Directive (Standards and Classification) Directions (England and Wales) 2015.
UKSI, 2023. The Environmental Targets (Water) (England) Regulations 2023.
WFD UK TAG, 2014. Environmental Standards Phase 3 Final Report.