72nd annual report to Parliament on smallholdings in England, 1 April 2021 to 31 March 2022
Published 26 July 2023
Applies to England

© Crown copyright 2023
This publication is licensed under the terms of the Open Government Licence v3.0 except where otherwise stated. To view this licence, visit nationalarchives.gov.uk/doc/open-government-licence/version/3 or write to the Information Policy Team, The National Archives, Kew, London TW9 4DU, or email: psi@nationalarchives.gov.uk.
Where we have identified any third party copyright information you will need to obtain permission from the copyright holders concerned.
This publication is available at https://www.gov.uk/government/publications/72nd-annual-report-to-parliament-on-smallholdings-in-england-1-april-2021-to-31-march-2022/72nd-annual-report-to-parliament-on-smallholdings-in-england-1-april-2021-to-31-march-2022
Introduction
This report is required under section 59 of the 1970 Agriculture Act (1970 Act). It provides statistical details to Parliament of the land let as smallholdings by local authorities across England, for the financial year 1 April 2021 to 31 March 2022.
Local authority smallholdings, or council farms (or county farms) as they are now more commonly known are administered under Part III of the 1970 Act. Under that legislation smallholdings authorities are required to make it their general aim to provide opportunities for persons with sufficient experience to be a farmer on their own account as well as to have regard to the general interests of agriculture and of good estate management. These council farms are generally capable of providing full-time employment for not more than two people.
The 1970 Agriculture Act defines smallholdings authorities as county councils for England. However, there have been many changes to local authority structures since the 1970 Act and consequently, some unitary authorities and borough and district authorities have continued the responsibilities of former county councils in letting land as smallholdings. Hence, it was decided in 2015 that it is important to include data in this report from these authorities as well as county councils where possible to extend the coverage and value of this report in providing more accurate details of land let as smallholdings from councils across England.
Council farms have an important role to play within their communities and in providing new entrants with opportunities to establish and develop farming businesses. These farms bring benefits to the wider public through educational visits, environmental enrichment and local food. The value of the council farm structure in supporting new entrants and progressive tenants as well as delivering wider public benefits is demonstrated in the case studies provided by Cambridgeshire and Devon county councils. Defra wants to encourage local authorities to retain and invest in their farm estates.
Defra is developing a New Entrant Support Scheme to create lasting opportunities for new entrants to establish successful and innovative businesses. Since last year, Defra has been piloting different models of support for both new entrants as well as recent entrants seeking to scale up their businesses, to increase their opportunities to access land and finance. These involved about 200 participants in five different pilots which have just completed. Defra is now beginning a systemic evaluation to inform the scheme’s next steps to be announced in the Autumn.
The data in this report are taken from the most recent annual survey on council farms conducted by the Chartered Institute for Public Finance and Accountancy (CIPFA) which includes responses from 27 local authorities that let land as smallholdings. This report includes statistical information on the area and number of smallholdings held by reporting local authorities, and details on tenancies and the financial position of the authorities in relation to their farm estates.
Defra thanks CIPFA and all the local authorities who have kindly provided the statistical information presented in this report and to Cambridgeshire and Devon county councils for providing the case study information.
Statistical information on authority smallholdings
From the 43 authorities approached (21 unitary authorities and 22 county councils) 27 submitted details of the smallholdings they let. However, some authorities did not complete the survey in full. As a result, the totals for some sections of the survey (financial information, for example) might be represented by fewer authorities than responded to the survey.
Total area of smallholding land
As of 31 March 2022, the total area of land estimated to be let as smallholdings by the 26 reporting authorities in England that provided data was 63,652 hectares. Table 1 provides a breakdown of the estimated area let as smallholdings by reporting authority. The land area reported as let for smallholdings is lower than the last financial year. However, it should be noted that there were 4 fewer reporting authorities this year. Furthermore, the area let as smallholdings is only an estimate based on the number and average size of smallholdings per authority. Therefore, the change in land area between surveys will not be accurate. The data on acquisitions and disposals indicates a decrease (0.6%) in the area of land held by reporting authorities (see Acquisitions and Disposals sections) which may be a better indicator of land area change between surveys.
Farming sectors
Each reporting authority classifies themselves to a farming sector based on the predominant farming activity (by area) carried out within that authority. The distribution (as at 31 March 2022) is shown in Figure 1. The most common sector was Arable and the least common was Horticulture, which none of the reporting authorities stated as the predominant farming activity.
Figure 1: Percentage of authorities by predominant farming sector
| Farming sector | Per cent |
|---|---|
| Arable | 34.6 |
| Dairy | 19.2 |
| Dairy/Stock Rearing | 19.2 |
| Horticulture | 0.0 |
| Mixed/General | 23.1 |
| Stock Rearing | 3.8 |
Notes:
-
Each authority is classified to one farming sector based on the predominant farming activity (by area) carried out within that authority. The farming sector definitions were established and agreed as a result of consultations between the data provider (CIPFA) and the authorities themselves.
-
For the 26 authorities that provided a farm business sector
Numbers of smallholding lets
The 27 authorities that provided data reported that they owned and let 1,958 smallholdings as at 31 March 2022. Table 2 provides a breakdown by each authority.
Rent due for smallholdings
For those 24 authorities that provided data, a total of around £21 million in rent was due for smallholdings as at 31 March 2022. Table 3 provides figures for the rent due by each authority. Table 4 shows average rent per hectare values by farm business sector for the 23 authorities where sector, rent and area data were all available. Of the total area of land let as smallholdings, the average rent was £333 per hectare for the 24 authorities where both rent and area data were available. When this rental value is split into agriculture licences (equipped and bare land farms) it reveals that an equipped farm on average costs £38 (12.5%) more per hectare when compared to a bare land farm.
Acquisitions and disposals
There has been a decrease (372 hectares; 0.6%) in the area of land held by the 27 reporting authorities that provided data, as of 31 March 2022. Table 5 provides figures for land acquired and disposed of by each authority in 2021/2022: a total of 103 hectares were acquired by 2 authorities and a total of 475 hectares were sold or otherwise disposed of by 14 authorities.
Number of smallholding tenants
For the 27 authorities that provided data, there were 1,396 tenants as at 31 March 2022. Table 6 provides figures on the number of tenants by each authority in 2021/2022: 85 tenancies were granted and 99 tenancies were terminated. Table 7 provides a breakdown of tenancies granted and terminated. For the 27 authorities that provided data, a total of 34 equipped farms were granted to new tenants. These are first time entrants to the individual estate, who have not previously occupied a council farm. In addition, there were 15 internal promotions, 1 tenancy was transferred from another estate, and 11 tenancies were ended due to the tenant leaving the estate in order to seek other opportunities.
Type of smallholdings tenancy
Of the 26 authorities that provided information there were a total of 258 lifetime tenancies, 140 retirement tenancies, 970 Farm Business Tenancies, as well as 329 secondary lettings. Figures for each of the authorities are provided in Tables 8. Farm Business Tenancies represent 71% of the agreements however these can vary in duration. Figure 2 demonstrates the type of tenancy agreements in place. Lifetime tenancies represent 19% of all tenancy agreements, 18% were Farm Business Tenancies that run for less than 5 years, 19% were Farm Business Tenancies that run between 5 and 10 years, and 35% were Farm Business Tenancies that run for more than 10 years. Retirement tenancies represent 10% of all tenancy agreements.
Figure 2: Percentage of smallholdings by tenancy duration
| Tenancy duration | Per cent |
|---|---|
| Lifetime | 18.9 |
| Retirement | 10.2 |
| Farm Business Tenancy < 5 years | 17.5 |
| Farm Business Tenancy 5 - 10 years | 18.6 |
| Farm Business Tenancy 10 - 15 years | 15.4 |
| Farm Business Tenancy > 15 years | 19.4 |
Notes:
-
Equipped and bare land farms only
-
For the 26 authorities that provided tenancy information
Financial position of authorities
Total revenue in the year ending 31 March 2022 for the 22 authorities that provided complete financial data showed a total operational income of £21,710,100 against a total operational expenditure of £7,674,700, giving an operational surplus of £14,035,500. Total non-operational income was £1,010,400, against a total non-operational expenditure of £2,926,800, giving a non-operational deficit of £1,916,400. The revenue account net surplus was therefore £12,119,000. Table 9 summarises the total revenue account for land held by authorities for the year ended 31 March 2022. Please note that the financial position is for the 22 authorities that provided complete financial data and is therefore not comparable to other years.
Case studies
Cambridgeshire County Coucil
Cambridgeshire County Council’s Farms Estate covers an area of about 33,000 acres across Cambridgeshire, providing rural business opportunities for more than 160 tenants. Cambridgeshire’s Estate is the largest public sector holding of its type in England and Wales.
The Estate offers an entry point into farming for people to operate their own enterprises and supports existing rural businesses within the Estate to grow and expand. The breadth of new tenants joining the County Farms Estate is an excellent example of this commitment, these range from young entrepreneurs to mature farmers with extensive experience.
The Estate also works to promote both the enhancement of biodiversity in the natural environment as well as evolving farming practices to address climate change threats. It runs farm walks and organises benchmarking and discussion groups to encourage adoption of innovative approaches and incentives.
Cambridgeshire County Council have identified a 140 hectare farm south of Cambridge as a Biodiversity Net Gain (BNG) land bank. Cambridge and South Cambridgeshire are busy growth areas and developers are required to provide at least 10% BNG as a requirement of the new Environment Act. The farm is part of a chain of existing strategic environmental sites running from Trumpington to Great Wilbraham Fen and is one of the vital missing links in this ecosystem network.
Work commenced late in 2022 on half the area with 8,000 trees and 18,000 hedge plants planted and grass sown on what was previously intensively famed arable land. Chalk grassland will be established when fertility levels drop which might happen in 2 years. The intention is to let the farm to a tenant farmer who can graze animals and care for the newly established chalk grassland. The first developer to sign up to take BNG credits is Network Rail who require them for the new Cambridge South station which serves the Cambridge Biomedical Campus.
Last year the County Farms Estate received over forty applications for holdings. Following the selection process, the Estate welcomed seven successful new tenants in 2022.
Ian Wilks – Car Dyke Farm, Landbeach
Ian has been involved in farming all his working life, he runs his own agronomy and farm management consultancy service in Essex and South Suffolk and now wants to farm in his own right. Ian is passionate about farming in a sustainable way and intends to farm Car Dyke Farm in a way that protects soil, water, and the existing environment, alongside creating new and varied wildlife habitats.

Ian Wilks – Car Dyke Farm, Landbeach
Joshua Dennis – Fen Bridge Farm, Cottenham
Joshua and his partner Kate are two young and enthusiastic individuals with a keen interest in the agricultural industry. Coming from arable and livestock backgrounds, they have had careers on farms and around agriculture. They hope to make their mark on an ever-changing industry by farming for a future everyone can be proud of while establishing a sustainable farming system to protect the environment.

Joshua and Kate – Fen Bridge Farm, Cottenham
Charles Deller – Fosters Farm, Whittlesford
Charles has been working alongside his father since leaving university and is actively involved in all aspects of running a medium sized mixed farm which includes arable and livestock enterprises. He now wants to farm on his own and plans to establish an arable farm together with a small lambing unit. Charles is particularly interested in soil health and farmland ecology and will take steps to improve the environment and reduce carbon emissions.
Charles Deller – Fosters Farm, Whittlesford
Robert Fletcher – Halls Farm, Guyhirn
Robert is an experienced farmer. He and his family previously rented a farm at Nordelph and have now moved to Halls Farm. They plan to run Halls Farm as a mainly arable farm with an additional lambing enterprise. Robert is looking forward to work in cooperation with other tenants on the Council’s wider estate.
Robert Fletcher – Halls Farm, Guyhirn
David Mwanaka – Limes Farm and Walnut Farm, Landbeach
David and his family have been running a farming business for the past 20 years, growing non-traditional crops but on short term lettings which offer less security. David grows African crops and other high value exotic vegetables. They are looking forward to getting actively involved in the local community, part of their vision is to reduce both carbon output and food waste.

David Mwanaka – Limes Farm and Walnut Farm, Landbeach
Kate Bull – Throckenholt Farm, Parson Drove
Kate has been involved in farming all her life and has developed a contracting business. She is looking forward to building a sustainable farm at Throckenholt Farm. The farm will be used as an arable business with enhanced environmental features and use of regenerative farming.
Joe Rabicano – Whitehall Farm, Littleport
At 21, Joe is the youngest entrant this year and is already a very entrepreneurial farmer and a contractor in Norfolk. Whitehall Farm is a step up the farming ladder for him where he will grow a range of arable crops.
Devon County Council
Following the incredibly successful farm lettings campaign in 2022, the Devon County Farms Estate has awarded another large crop of new farming entrants their first farms, all commencing Lady Day 2023!
Five starter farms were advertised to let on the open market to new entrants. These include:
- Lower Northchurch Farm, Yarnscombe – a 122 acre residential stock farm
- Little Stone Farm, South Molton – a 101 acre residential dairy holding
- Endfield Farm, Sandford – a 120 acre residential dairy holding
- Hurlditch Farm, Lamerton – a 131 acre residential dairy holding
- Lower Parks Farm, Crediton – a 69 acre residential stock farm
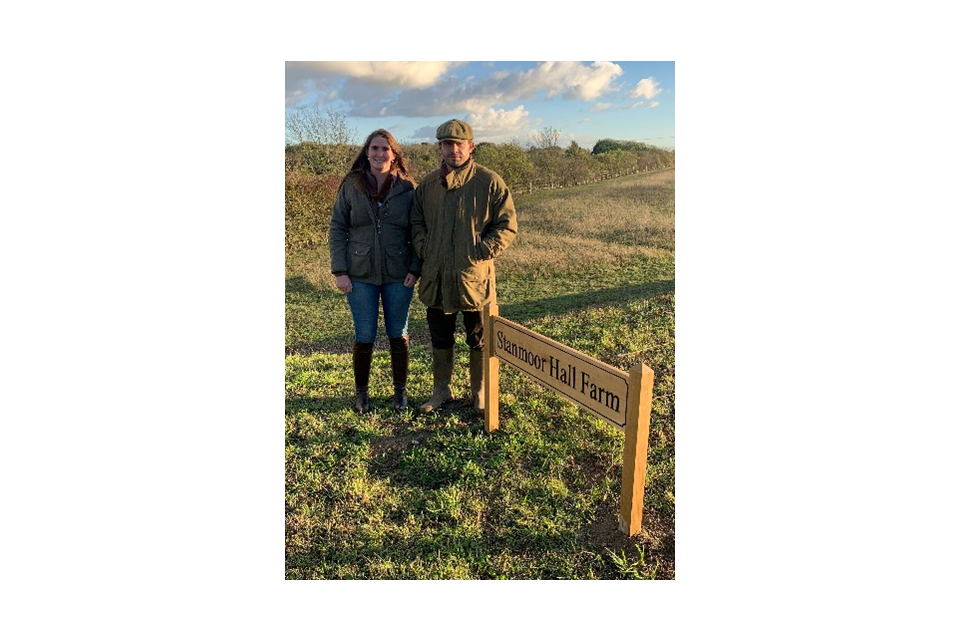
One of the new entrants awarded a tenancy of a starter farm is Adam Garthwaite who secured the tenancy of Lower Northchurch Farm, Yarnscombe.
Adam said:
I have worked on farms all my life but always dreamt of becoming a farmer in my own right. As a new entrant to farming I have had to work really hard to build a small sheep enterprise renting bits of grass keep all around me in several different parishes. Although not easy to farm profitably, it did allow me to build equity in livestock and machinery whilst working fulltime. It also gave me the opportunity to prove I had all the skills and experience to run my own farm business. Until recently, I never thought that I would get the chance to rent an affordable whole farm complete with house and buildings but when I heard about the Devon County Farms Estate and attended the farm viewing day for Lower Northchurch Farm, I realised it could actually happen! Securing the tenancy of Lower Northchurch was tough - we had to put our all in to preparing a comprehensive business plan supported by detailed cashflows and budgets. It took a huge amount of time but it was all worth it. We will now be able to grow our business in a sustainable and efficient way with the full security of the County Council as landlord.
Photos below of Adam Garthwaite and his partner Megan Chapman:


Closing summary
This report indicates that council farms continue to play an important role in the tenanted agricultural sector across England. Although the data set is incomplete it reveals that council farms cover approximately 63,652 hectares of agricultural land. This land provides approximately 1,958 holdings for around 1,396 tenant farmers.
Approximately 54% of the lettings are equipped farms (1,055 equipped holdings) and 34 lettings were made to new entrants during 2021/2022. The report shows that the 22 reporting authorities who submitted full financial information generated a revenue account net surplus of around £12.1 million in 2021/2022.
Tables
Table 1: Area of smallholdings land held by smallholdings authorities as at 31 March 2022
| Local authority | Equipped farm let area (ha) | Bare land farm let area (ha) | Agricultural license let area (ha) | Total let area (ha) |
|---|---|---|---|---|
| Bedford | x | x | x | x |
| Brighton & Hove | x | x | x | x |
| Buckinghamshire | x | x | x | x |
| Cambridgeshire | 11,424 | 1,841 | x | 13,265 |
| Central Bedfordshire | x | x | x | x |
| Cheshire East | 1,770 | 0 | 150 | 1,920 |
| Cheshire West and Chester | 562 | 0 | 220 | 782 |
| Cornwall | 3,721 | 182 | 360 | 4,263 |
| Cumbria | 0 | 65 | 24 | 89 |
| Devon | 3,350 | 120 | 388 | 3,858 |
| Dorset | 2,090 | 123 | 133 | 2,346 |
| Durham | x | x | x | x |
| East Riding of Yorkshire | 1,548 | 910 | 0 | 2,458 |
| Essex | 68 | 11 | 0 | 79 |
| Gloucestershire | x | x | x | x |
| Hampshire | x | x | x | x |
| Hartlepool | 0 | 85 | 0 | 85 |
| Herefordshire | 108 | 94 | 0 | 202 |
| Hertfordshire | 1,125 | 271 | 267 | 1,663 |
| Hillingdon | x | x | x | x |
| Leicestershire | 2,232 | 63 | 430 | 2,725 |
| Lincolnshire | 5,531 | 1,070 | 0 | 6,601 |
| Medway | x | x | x | x |
| Milton Keynes | x | x | x | x |
| Norfolk | 4,999 | 1,599 | 91 | 6,689 |
| North Lincolnshire | 0 | 14 | 0 | 14 |
| North Somerset | 90 | 76 | 0 | 166 |
| North Yorkshire | x | x | x | x |
| Nottinghamshire | 189 | 319 | 0 | 508 |
| Oxfordshire | 16 | 332 | 5 | 353 |
| Shropshire | x | x | x | x |
| Somerset | 784 | 268 | 29 | 1,081 |
| South Gloucestershire | x | x | x | x |
| Staffordshire | 2,290 | 55 | 381 | 2,726 |
| Suffolk | 3,447 | 714 | 686 | 4,847 |
| Surrey | 646 | 129 | 20 | 795 |
| Swindon | 480 | 32 | 3 | 515 |
| Warwickshire | 1,589 | 299 | 1,888 | 3,776 |
| West Berkshire | x | x | x | x |
| West Sussex | x | x | x | x |
| Wiltshire | 1,566 | 280 | x | 1,846 |
| Worcestershire | x | x | x | x |
| York | x | x | x | x |
| TOTAL | 49,625 | 8,952 | 5,075 | 63,652 |
Notes:
-
Column totals (‘TOTAL’) are underestimations due to an absence of information (indicated by ‘x’).
-
Values are estimates of the area of land let as smallholdings by each authority calculated by multiplying the number of lettings by the average size of those lettings in hectares.
Table 2: Number of smallholding lets held by smallholdings authorities as at 31 March 2022
| Local authority | Equipped farm lets (n) | Bare land farm lets (n) | Agricultural license lets (n) | Total smallholdings lets (n) |
|---|---|---|---|---|
| Bedford | x | x | x | x |
| Brighton & Hove | x | x | x | x |
| Buckinghamshire | x | x | x | x |
| Cambridgeshire | 164 | 109 | 0 | 273 |
| Central Bedfordshire | x | x | x | x |
| Cheshire East | 49 | 0 | 12 | 61 |
| Cheshire West and Chester | 22 | 0 | 6 | 28 |
| Cornwall | 87 | 7 | 18 | 112 |
| Cumbria | 0 | 5 | 11 | 16 |
| Devon | 65 | 8 | 26 | 99 |
| Dorset | 41 | 7 | 9 | 57 |
| Durham | 1 | 17 | 0 | 18 |
| East Riding of Yorkshire | 49 | 73 | 1 | 123 |
| Essex | 2 | 2 | 0 | 4 |
| Gloucestershire | x | x | x | x |
| Hampshire | x | x | x | x |
| Hartlepool | 0 | 2 | 0 | 2 |
| Herefordshire | 3 | 1 | 0 | 4 |
| Hertfordshire | 34 | 16 | 14 | 64 |
| Hillingdon | x | x | x | x |
| Leicestershire | 66 | 3 | 34 | 103 |
| Lincolnshire | 87 | 76 | 0 | 163 |
| Medway | x | x | x | x |
| Milton Keynes | x | x | x | x |
| Norfolk | 97 | 75 | 35 | 207 |
| North Lincolnshire | 0 | 3 | 0 | 3 |
| North Somerset | 4 | 9 | 0 | 13 |
| North Yorkshire | x | x | x | x |
| Nottinghamshire | 7 | 15 | 0 | 22 |
| Oxfordshire | 2 | 27 | 6 | 35 |
| Shropshire | x | x | x | x |
| Somerset | 23 | 10 | 8 | 41 |
| South Gloucestershire | x | x | x | x |
| Staffordshire | 63 | 5 | 24 | 92 |
| Suffolk | 64 | 30 | 38 | 132 |
| Surrey | 34 | 12 | 11 | 57 |
| Swindon | 14 | 1 | 1 | 16 |
| Warwickshire | 46 | 24 | 70 | 140 |
| West Berkshire | x | x | x | x |
| West Sussex | x | x | x | x |
| Wiltshire | 31 | 15 | 27 | 73 |
| Worcestershire | x | x | x | x |
| York | x | x | x | x |
| TOTAL | 1,055 | 552 | 351 | 1,958 |
Notes:
- Column totals (‘TOTAL’) are underestimations due to an absence of information (indicated by ‘x’).
Table 3: Rent due for smallholdings by smallholdings authorities as at 31 March 2022
| Local authority | Rent due for equipped farms (£) | Rent due for bare land farms (£) | Rent due for agricultural licenses (£) | Total rent due for land let as smallholdings (£) |
|---|---|---|---|---|
| Bedford | x | x | x | x |
| Brighton & Hove | x | x | x | x |
| Buckinghamshire | x | x | x | x |
| Cambridgeshire | 4,107,000 | 604,000 | 0 | 4,711,000 |
| Central Bedfordshire | x | x | x | x |
| Cheshire East | 673,000 | 0 | 37,700 | 710,700 |
| Cheshire West and Chester | 175,300 | 0 | 60,300 | 235,600 |
| Cornwall | 1,246,500 | 56,100 | 48,900 | 1,351,500 |
| Cumbria | 0 | 13,300 | 3,800 | 17,100 |
| Devon | 1,100,200 | 20,500 | 70,200 | 1,190,900 |
| Dorset | 649,200 | 27,000 | 32,400 | 708,600 |
| Durham | 0 | 0 | 0 | 0 |
| East Riding of Yorkshire | 382,500 | 341,400 | 100 | 724,000 |
| Essex | 8,500 | 2,800 | x | 11,300 |
| Gloucestershire | x | x | x | x |
| Hampshire | x | x | x | x |
| Hartlepool | 0 | 31,700 | 0 | 31,700 |
| Herefordshire | 38,700 | 9,400 | 0 | 48,100 |
| Hertfordshire | 406,200 | 93,600 | 66,600 | 566,400 |
| Hillingdon | x | x | x | x |
| Leicestershire | 811,800 | 14,200 | 117,200 | 943,200 |
| Lincolnshire | 1,762,500 | 339,500 | 0 | 2,102,000 |
| Medway | x | x | x | x |
| Milton Keynes | x | x | x | x |
| Norfolk | 1,833,000 | 463,400 | 24,500 | 2,320,900 |
| North Lincolnshire | 0 | 2,100 | 0 | 2,100 |
| North Somerset | 34,100 | 10,900 | 0 | 45,000 |
| North Yorkshire | x | x | x | x |
| Nottinghamshire | 61,200 | 86,200 | 0 | 147,400 |
| Oxfordshire | 5,100 | 48,200 | 5,300 | 58,600 |
| Shropshire | x | x | x | x |
| Somerset | 175,500 | 172,800 | 12,500 | 360,800 |
| South Gloucestershire | x | x | x | x |
| Staffordshire | 910,600 | 13,000 | 91,000 | 1,014,600 |
| Suffolk | 1,021,800 | 221,300 | 220,700 | 1,463,800 |
| Surrey | x | x | x | x |
| Swindon | 0 | 0 | 0 | 0 |
| Warwickshire | 710,800 | 73,100 | 783,900 | 1,567,800 |
| West Berkshire | x | x | x | x |
| West Sussex | x | x | x | x |
| Wiltshire | 426,400 | x | x | 426,400 |
| Worcestershire | x | x | x | x |
| York | x | x | x | x |
| TOTAL | 16,539,900 | 2,644,500 | 1,575,100 | 20,759,500 |
Notes:
-
Column totals (‘TOTAL’) are underestimations due to an absence of information (indicated by ‘x’).
-
All values are rounded to the nearest £100.
-
Rent due refers to what could be collected if every farm paid (see ‘Glossary of terms’ section for a definition of ‘Rent from holdings - operational account’)
Table 4: Rent/hectare values for smallholdings farms, expressed in terms of the authority’s farm business sector, as at 31 March 2022
| Authority sector | Rent per hectare due for equipped farms (£/ha) | Rent per hectare due for bare land farms (£/ha) | Rent per hectare due for agricultural licenses (£/ha) | Total rent per hectare for land let as smallholdings (£/ha) |
|---|---|---|---|---|
| Arable | 344 | 311 | 299 | 336 |
| Dairy | 342 | 87 | 250 | 322 |
| Dairy/Stock Rearing | 340 | 249 | 201 | 321 |
| Horticulture | x | x | x | x |
| Mixed/General | 325 | 378 | 412 | 359 |
| Stock Rearing | 319 | 145 | 1,060 | 166 |
| ALL TENANCIES | 341 | 303 | 312 | 333 |
Notes:
-
For authorities that provided a business sector as well as complete rent and area data (i.e. 23 out of 43 authorities).
-
No authorities stated themselves as primarily Horticulture so no data are available (indicated by ‘x’)
Table 5: Total area acquired and disposed of by smallholdings authorities between April 2021 and March 2022
| Local authority | Acquired - Newly acquired (ha) | Disposed - Sold/exchanged (ha) | Acquired - Formerly leased (ha) | Disposed - Leased land (ha) | Total land acquired (ha) | Total land disposed (ha) |
|---|---|---|---|---|---|---|
| Bedford | x | x | x | x | x | x |
| Brighton & Hove | x | x | x | x | x | x |
| Buckinghamshire | x | x | x | x | x | x |
| Cambridgeshire | 96 | 0 | 0 | 0 | 96 | 0 |
| Central Bedfordshire | x | x | x | x | x | x |
| Cheshire East | 0 | 1 | 0 | 0 | 0 | 1 |
| Cheshire West and Chester | 0 | 13 | 0 | 0 | 0 | 13 |
| Cornwall | 0 | 0 | 0 | 0 | 0 | 0 |
| Cumbria | 0 | 8 | 0 | 0 | 0 | 8 |
| Devon | 7 | 8 | 0 | 0 | 7 | 8 |
| Dorset | 0 | 0 | 0 | 0 | 0 | 0 |
| Durham | 0 | 0 | 0 | 0 | 0 | 0 |
| East Riding of Yorkshire | 0 | 17 | 0 | 0 | 0 | 17 |
| Essex | 0 | 4 | 0 | 0 | 0 | 4 |
| Gloucestershire | x | x | x | x | x | x |
| Hampshire | x | x | x | x | x | x |
| Hartlepool | 0 | 0 | 0 | 0 | 0 | 0 |
| Herefordshire | 0 | 0 | 0 | 0 | 0 | 0 |
| Hertfordshire | 0 | 0 | 0 | 0 | 0 | 0 |
| Hillingdon | x | x | x | x | x | x |
| Leicestershire | 0 | 0 | 0 | 0 | 0 | 0 |
| Lincolnshire | 0 | 53 | 0 | 0 | 0 | 53 |
| Medway | x | x | x | x | x | x |
| Milton Keynes | x | x | x | x | x | x |
| Norfolk | 0 | 13 | 0 | 0 | 0 | 13 |
| North Lincolnshire | 0 | 36 | 0 | 0 | 0 | 36 |
| North Somerset | 0 | 0 | 0 | 0 | 0 | 0 |
| North Yorkshire | x | x | x | x | x | x |
| Nottinghamshire | 0 | 12 | 0 | 0 | 0 | 12 |
| Oxfordshire | 0 | 0 | 0 | 0 | 0 | 0 |
| Shropshire | x | x | x | x | x | x |
| Somerset | 0 | 10 | 0 | 0 | 0 | 10 |
| South Gloucestershire | x | x | x | x | x | x |
| Staffordshire | 0 | 272 | 0 | 0 | 0 | 272 |
| Suffolk | 0 | 0 | 0 | 0 | 0 | 0 |
| Surrey | 0 | 0 | 0 | 0 | 0 | 0 |
| Swindon | 0 | 20 | 0 | 0 | 0 | 20 |
| Warwickshire | 0 | 8 | 0 | 0 | 0 | 8 |
| West Berkshire | x | x | x | x | x | x |
| West Sussex | x | x | x | x | x | x |
| Wiltshire | 0 | 0 | 0 | 0 | 0 | 0 |
| Worcestershire | x | x | x | x | x | x |
| York | x | x | x | x | x | x |
| TOTAL | 103 | 475 | 0 | 0 | 103 | 475 |
Notes:
-
Column totals (‘TOTAL’) are underestimations due to an absence of information (indicated by ‘x’).
-
Total areas, comprising freehold (the number of hectares let as council farms/rural estates and owned by the authority) and leasehold (the number of hectares let as council farms/rural estates but not owned by the authority) areas.
Table 6: Number of smallholding tenancies granted for the first time or terminated by smallholdings authorities between April 2021 and March 2022
| Local authority | Number of tenancies in 2022 | Net change since 2021 | Tenancies granted (n) | Tenancies ceased (n) |
|---|---|---|---|---|
| Bedford | x | x | x | x |
| Brighton & Hove | x | x | x | x |
| Buckinghamshire | x | x | x | x |
| Cambridgeshire | 183 | 9 | 7 | 2 |
| Central Bedfordshire | x | x | x | x |
| Cheshire East | 45 | 1 | 1 | 0 |
| Cheshire West and Chester | 17 | -1 | 0 | 1 |
| Cornwall | 94 | 2 | 5 | 3 |
| Cumbria | 5 | -1 | 0 | 1 |
| Devon | 73 | -1 | 7 | 8 |
| Dorset | 48 | 0 | 2 | 2 |
| Durham | 15 | 0 | 0 | 0 |
| East Riding of Yorkshire | 91 | 5 | 10 | 5 |
| Essex | 3 | -1 | 0 | 1 |
| Gloucestershire | x | x | x | x |
| Hampshire | x | x | x | x |
| Hartlepool | 2 | 0 | 0 | 0 |
| Herefordshire | 4 | 0 | 0 | 0 |
| Hertfordshire | 50 | 1 | 3 | 2 |
| Hillingdon | x | x | x | x |
| Leicestershire | 62 | -2 | 0 | 2 |
| Lincolnshire | 163 | -9 | 21 | 30 |
| Medway | x | x | x | x |
| Milton Keynes | x | x | x | x |
| Norfolk | 105 | -3 | 6 | 9 |
| North Lincolnshire | 3 | -1 | 0 | 1 |
| North Somerset | 13 | 0 | 0 | 0 |
| North Yorkshire | x | x | x | x |
| Nottinghamshire | 22 | -1 | 1 | 2 |
| Oxfordshire | 29 | 1 | 6 | 5 |
| Shropshire | x | x | x | x |
| Somerset | 31 | -3 | 0 | 3 |
| South Gloucestershire | x | x | x | x |
| Staffordshire | 67 | -8 | 3 | 11 |
| Suffolk | 94 | 1 | 1 | 0 |
| Surrey | 44 | 0 | 1 | 1 |
| Swindon | 12 | 1 | 1 | 0 |
| Warwickshire | 82 | -1 | 9 | 10 |
| West Berkshire | x | x | x | x |
| West Sussex | x | x | x | x |
| Wiltshire | 39 | 1 | 1 | 0 |
| Worcestershire | x | x | x | x |
| York | x | x | x | x |
| TOTAL | 1,396 | -10 | 85 | 99 |
Notes:
-
Column totals (‘TOTAL’) are underestimations due to an absence of information (indicated by ‘x’).
-
Equipped and bare land farms only.
Table 7: Specific details of smallholding tenancies granted and ended by smallholdings authorities between April 2021 and March 2022
| Local authority | New tenants - equipped farms (n) | Internal promotion (n) | Transfer to other estates (n) | Leave estate for other opportunities (n) |
|---|---|---|---|---|
| Bedford | x | x | x | x |
| Brighton & Hove | x | x | x | x |
| Buckinghamshire | x | x | x | x |
| Cambridgeshire | 7 | 0 | 1 | 0 |
| Central Bedfordshire | x | x | x | x |
| Cheshire East | 1 | 0 | 0 | 0 |
| Cheshire West and Chester | 0 | 0 | 0 | 0 |
| Cornwall | 2 | 0 | 0 | 1 |
| Cumbria | 0 | 0 | 0 | 0 |
| Devon | 7 | 4 | 0 | 6 |
| Dorset | 1 | 1 | 0 | 0 |
| Durham | 0 | 0 | 0 | 0 |
| East Riding of Yorkshire | 3 | 4 | 0 | 0 |
| Essex | 0 | 0 | 0 | 0 |
| Gloucestershire | x | x | x | x |
| Hampshire | x | x | x | x |
| Hartlepool | 0 | 0 | 0 | 0 |
| Herefordshire | 0 | 0 | 0 | 0 |
| Hertfordshire | 2 | 0 | 0 | 0 |
| Hillingdon | x | x | x | x |
| Leicestershire | 0 | 0 | 0 | 0 |
| Lincolnshire | 2 | 0 | 0 | 0 |
| Medway | x | x | x | x |
| Milton Keynes | x | x | x | x |
| Norfolk | 1 | 5 | 0 | 0 |
| North Lincolnshire | 0 | 0 | 0 | 0 |
| North Somerset | 0 | 0 | 0 | 0 |
| North Yorkshire | x | x | x | x |
| Nottinghamshire | 1 | x | x | x |
| Oxfordshire | 1 | 0 | 0 | 0 |
| Shropshire | x | x | x | x |
| Somerset | 0 | 0 | 0 | 0 |
| South Gloucestershire | x | x | x | x |
| Staffordshire | 2 | 1 | x | 2 |
| Suffolk | 1 | 0 | 0 | 0 |
| Surrey | 0 | 0 | 0 | 0 |
| Swindon | 0 | 0 | 0 | 0 |
| Warwickshire | 2 | 0 | 0 | 2 |
| West Berkshire | x | x | x | x |
| West Sussex | x | x | x | x |
| Wiltshire | 1 | 0 | 0 | 0 |
| Worcestershire | x | x | x | x |
| York | x | x | x | x |
| TOTAL | 34 | 15 | 1 | 11 |
Notes:
-
Column totals (‘TOTAL’) are underestimations due to an absence of information (indicated by ‘x’).
-
Equipped and bare land farms only.
-
‘New tenants’ are lettings to first time entrants to the individual estate (i.e. those who have not previously occupied a smallholdings authority farm)
Table 8: Breakdown of the number of smallholding tenancies held between April 2021 and March 2022
| Local authority | Lifetime (n) | Retirement (n) | Farm Business Tenancies (n) | Secondary lettings (n) | Total lettings and tenancies (n) |
|---|---|---|---|---|---|
| Bedford | x | x | x | x | x |
| Brighton & Hove | x | x | x | x | x |
| Buckinghamshire | x | x | x | x | x |
| Cambridgeshire | 31 | 0 | 152 | 81 | 264 |
| Central Bedfordshire | x | x | x | x | x |
| Cheshire East | 16 | 11 | 18 | 2 | 47 |
| Cheshire West and Chester | 8 | 4 | 5 | 0 | 17 |
| Cornwall | 11 | 13 | 70 | 17 | 111 |
| Cumbria | 0 | 0 | 5 | 0 | 5 |
| Devon | 8 | 5 | 60 | 26 | 99 |
| Dorset | 4 | 4 | 40 | 8 | 56 |
| Durham | 0 | 0 | 0 | 0 | 0 |
| East Riding of Yorkshire | 18 | 15 | 58 | 31 | 122 |
| Essex | 0 | 0 | 3 | x | 3 |
| Gloucestershire | x | x | x | x | x |
| Hampshire | x | x | x | x | x |
| Hartlepool | 0 | 0 | 2 | 0 | 2 |
| Herefordshire | 0 | 1 | 3 | 1 | 5 |
| Hertfordshire | 9 | 4 | 37 | 14 | 64 |
| Hillingdon | x | x | x | x | x |
| Leicestershire | 8 | 13 | 41 | 21 | 83 |
| Lincolnshire | 47 | 17 | 99 | 0 | 163 |
| Medway | x | x | x | x | x |
| Milton Keynes | x | x | x | x | x |
| Norfolk | 12 | 8 | 85 | 67 | 172 |
| North Lincolnshire | 2 | 0 | 1 | 0 | 3 |
| North Somerset | 1 | 0 | 12 | 0 | 13 |
| North Yorkshire | x | x | x | x | x |
| Nottinghamshire | 5 | 0 | 17 | 0 | 22 |
| Oxfordshire | 1 | 0 | 28 | 0 | 29 |
| Shropshire | x | x | x | x | x |
| Somerset | 10 | 14 | 7 | 9 | 40 |
| South Gloucestershire | x | x | x | x | x |
| Staffordshire | 7 | 5 | 55 | 18 | 85 |
| Suffolk | 26 | 12 | 56 | 30 | 124 |
| Surrey | 15 | 0 | 29 | 1 | 45 |
| Swindon | 1 | 0 | 11 | 3 | 15 |
| Warwickshire | 9 | 11 | 50 | x | 70 |
| West Berkshire | x | x | x | x | x |
| West Sussex | x | x | x | x | x |
| Wiltshire | 9 | 3 | 26 | x | 38 |
| Worcestershire | x | x | x | x | x |
| York | x | x | x | x | x |
| TOTAL | 258 | 140 | 970 | 329 | 1,697 |
Notes:
-
Column totals (‘TOTAL’) are underestimations due to an absence of information (indicated by ‘x’).
-
Equipped and bare land farms only.
Table 9: Revenue account for land held by smallholdings authorities between April 2021 and March 2022
Table 9a: Operational acount income
| Operational account - Income | £ |
|---|---|
| Rent from holdings | 19,958,200 |
| Other rents | 420,300 |
| Other income | 1,331,600 |
| TOTAL | 21,710,100 |
Table 9b: Operational acount expenditure
| Operational account - Expenditure | £ |
|---|---|
| Repairs and maintenance | 4,086,700 |
| Rents, rates, annuities and water charges | 780,000 |
| Net tenant rights valuations | 148,300 |
| Estate management | 2,197,800 |
| Other expenditure | 461,800 |
| TOTAL | 7,674,700 |
Table 9c: Non-operational acount income
| Non-operational account - Income | £ |
|---|---|
| Indirect income | 1,010,400 |
| TOTAL | 1,010,400 |
Table 9d: Non-operational acount expenditure
| Non-operational account - Expenditure | £ |
|---|---|
| Central support costs | 214,800 |
| Other expenditure | 2,712,000 |
| TOTAL | 2,926,800 |
Table 9e: Revenue account net surplus
| Revenue account net surplus | £ |
|---|---|
| Operational account surplus | 14,035,500 |
| Non-operational account deficit | -1,916,400 |
| NET SURPLUS | 12,119,000 |
Notes:
-
For authorities that provided complete financial information (i.e. 22 out of 43 authorities)
-
All values are rounded to the nearest £100.
Glossary of terms
Agricultural letting farms - Farms possessing, for example, grazing licences, contract farming agreements, 364 day licences / agricultural lettings for less than one year, etc.
Bare land farms - Farms comprising land only, including short term lets.
Equipped farms - Farms with a farmhouse, farm buildings or both.
Farm Business Tenancies - These tenancies comprise all principal lettings entered into under the provisions of the Agricultural Tenancies Act 1995 and relating to the original term of the current letting.
Lifetime tenancies - These tenancies are for those lettings made prior to the Agricultural Holdings Act 1986.
New tenants - These tenancies are lettings to first time entrants to the individual estate, i.e. those who have not previously occupied a local authority farm.
Number of smallholding lets - This is equal to the number of equipped farm lets plus the number of bare land farm lets plus the number of agricultural lets.
Number of smallholding tenancies - These comprise equipped and bare land farms only. Joint tenancies are counted as a single entity. Where tenants occupy more than one farm they have only been counted once. Hence the total number of tenants may be less than the number of farms.
Rent due for land let as smallholdings (£) - Rent due refers to what would be expected to be collected if all farms/licenses are occupied and if every farm paid. This is equal to rent due for equipped farms plus rent due for bare land farms plus rent due for agricultural licence farms. Abatements, allowances, rent forgone and not collected are disregarded for these figures.
Retirement tenancies - These tenancies are for tenants that may be required to vacate holdings when they reach the age of 65 or prevailing retirement age, i.e. lettings made under the provisions of the Agricultural Holdings Act 1986, but before the Agricultural Tenancies Act 1995.
Secondary lettings - Secondary lettings describe additional land let as part of a Farm Business Tenancy to tenants of principal holdings, i.e. equipped or bare land holdings and managed as an integral part of principal holding.
Total area acquired and disposed of by local authorities (hectares) - This is comprised of freehold (the number of hectares let as council farms/rural estates and owned by the authority) and leasehold (the number of hectares let as council farms/rural estates but not owned by the authority) areas.
Glossary of terms employed within the operational and non-operational accounts
Operational account
Income
Rent from holdings (£) - This is net rent from land being farmed, including grazing licenses, after deductions of allowances, abatements and rent not collected. Only farm rents are included, including secondary lettings.
Other rents (£) -This is rent from cottage tenancies, commercial lettings, staff housing, wasteland, woodland, telecom sites, wind turbines and rent received from non-Farm Business Tenancies.
Other income (£) - This includes royalties, wayleaves, easements, shooting and fishing rights, licences to extract gravel, insurance claims, sales of timber, trees, produce, materials, farm equipment and vehicles, etc., other fees and charges etc. This also includes single farm payments or environmental initiatives paid direct to the estate. This does not include contributions by tenants towards revenue improvements, repairs to equipment, rates, water charges etc.
Expenditure
Repairs and maintenance (£) - This includes revenue expenditure on repairs and maintenance of houses, buildings, drainage and ditching work. This is net of any amounts recovered from tenants but excludes grant-aided schemes of a capital nature. This also includes corporately funded property initiatives, e.g. asbestos, electrical tests and inspections, structural and tree surveys, as well as Legionnaires’ disease testing. This also includes the cost of associated manual labour forces, plants and materials.
Rents, rates, annuities and water charges (£) - This includes rents, rates, utility charges (e.g. water, electricity), tithes and perpetual annuities, net of recovery of rates and water charges.
Net tenant right valuations (£) - This includes expenditure paid by the landlord to an outgoing tenant, less income received from an incoming tenant for tenant right valuations and dilapidations. This also includes any milk quota compensation payments charged to revenue. This excludes capital payments for equipment/buildings.
Estate management (£) - This includes professional (e.g. surveyors), administrative and clerical support employee costs, office accommodation charges, including expenditure on repairs and maintenance, transport costs, other sundry expenses, etc. as well as any other ad-hoc specialist advice (e.g. payments to consultants). Employee costs include salaries, national insurance, training, pension, removal and resettlement costs, conference expenses, etc. This also includes the net cost (e.g. client/commissioning costs) of contracting out estate management functions.
Other expenditure (£) - This includes the cost of cleaning materials, fire and farm buildings insurance, furniture and fittings, equipment, tools and materials, transport and moveable plant, vehicles and vehicle running costs, etc.
Non-operational account
Indirect income (£) - This includes revenue grants, interest received and other non-operational income. This also includes publication sales, recovery of fees and charges, etc.
Central support costs (£) - This includes charges received from other departments within the estate not identified within the Estate Management section, e.g. legal/secretariat, financial (including audit), valuation (excluding corporate disposals), personnel and IT service costs.
Other expenditure (£) - This includes subscriptions, external audit fees, stamp duty, external legal and professional fees, etc.