2021 Global accounts of private registered providers (accessible version)
Updated 24 February 2022
Applies to England

© Crown copyright 2022
This publication is licensed under the terms of the Open Government Licence v3.0 except where otherwise stated. To view this licence, visit nationalarchives.gov.uk/doc/open-government-licence/version/3 or write to the Information Policy Team, The National Archives, Kew, London TW9 4DU, or email: psi@nationalarchives.gov.uk.
Where we have identified any third party copyright information you will need to obtain permission from the copyright holders concerned.
This publication is available at https://www.gov.uk/government/publications/2021-global-accounts-of-private-registered-providers/2021-global-accounts-of-private-registered-providers-accessible-version
Executive summary
The Global Accounts cover the year up to the end of March 2021, a period dominated by the coronavirus pandemic. No sector of the economy or society has been unaffected by these unprecedented events. However, this publication demonstrates that private registered providers (referred to as providers in this document) responded well to the pandemic, maintaining essential services whilst delivering a robust financial performance.
The closure of most construction sites during the lockdowns and other subsequent restrictions, inevitably resulted in delays to capital investment programmes. This disruption is evidenced in lower levels of investment in both new supply and existing stock in 2021.
In the year to March 2021 investment in new supply was £10.9bn, a 20% decrease on the previous year. The number of social homes completed in the year fell by 9,000 to 40,000.
Total spend on maintenance and repairs decreased by 5% on the previous year to £5.4bn. Levels of spend on routine maintenance were maintained, reflecting providers’ focus on delivering essential works during the pandemic. However, some major repair programmes were paused or delayed as access to properties were restricted. Capitalised investment in existing stock dropped by 19% from £1.9bn in 2020 to £1.6bn in 2021.
Despite the challenges, financial performance was generally robust. The ‘underlying surplus’ (excluding movements in fair value) fell slightly from £2.7bn to £2.6bn. This decrease was attributable to non-operating items of income and expenditure. The main factors were a £0.2bn fall in the surplus from the sale of properties held for rent (fixed asset sales) and an increase in net finance costs. The latter was mainly the result of refinancing activity in a small number of large providers.
The surplus generated by operating activities actually increased from £4.7bn to £4.9bn. The increase is a result of improved performance on core social housing lettings activity. Following four years of rent reductions, permitted rent increases returned to Consumer Price Index +1% from 1 April 2020. This led to a £0.2bn increase in the surplus from SHL to £4.6bn.
Although the pandemic has affected rent collection indicators, at a sector level the financial impact has not been material. Rent loss from voids increased from £210m in 2020 to £270m in 2021. Void losses are highest in providers specialising in the provision of care homes, housing for older people and supported accommodation.
Many providers continue to develop units for sale. Although the lockdowns resulted in some delays to house sales, the housing market remained strong with average prices increasing across the country. The combined contribution from first tranche shared ownership sales and outright market sales stayed at £0.5bn. The margin on these activities fell from 15% to 14%. Development for sale, particularly market sale, remains concentrated in a small number of providers.
Following two years of decreasing levels of cover, 2021 saw an increase in EBITDA MRI interest cover of 14 percentage points to 151%. This was a consequence of the increase in the surplus from social housing lettings and the decrease in capitalised major repairs spend. The Regulator of Social Housing continued to monitor individual providers and engaged where financial viability was affected by the pandemic and financial indicators were weak.
The robust financial performance in the year was backed up by strong liquidity. Debt reported on balance sheets increased by £3.2bn (4%) to £86.3bn in 2021. The funding markets continued to function throughout the pandemic and the sector remains an attractive prospect for investors. Including refinancing, in the year to March 2021, the sector agreed new facilities of £15.1bn - Quarterly survey - 2020-21 Q4. This was the highest level ever recorded as providers capitalised on historically low interest rates. The effective interest rate, excluding one-off breakage costs, dropped from 4.1% in 2020 % to 4.0% in 2021.
The sector remains committed to future growth, with capital commitments of £38.7bn (a 5% increase on 2020) of which £20.8bn had been contracted. The Financial Forecast Return Annex examines the nature of these commitments. The early years of forecasts include an element of ‘catch-up’ spend following the disruption of 2021. However, increased investment, particularly in relation to existing stock, is sustained in the longer-term in latest plans.
Business plans have included significant levels of investment in building safety for a number of years. Increasingly, forecasts are also being adapted for decarbonisation costs. Most providers are beginning to plan for enhanced energy efficiency standards and the move towards net-zero by 2050. As the Annex sets out, forecast investment in existing stock and new supply results in lower projected operating margins and more reliance on debt.
The Global Accounts for 2021 demonstrates a resilient financial performance in the face of testing economic and operating conditions. Despite the removal of most pandemic restrictions, there remains a degree of economic uncertainty as the course of the virus continues to change. At the same time, providers are adapting plans for a different set of challenges and potential trade-offs. It is vital they continue to manage their resources and risks effectively to ensure that their financial viability is maintained and they remain capable of delivering effective services and their responsibilities to tenants.
1. Introduction
1.1 The 2021 Global Accounts of registered providers (Global Accounts) provides a financial overview of the social housing sector based on an analysis of the regulatory returns of private registered providers. The publication excludes social housing stock held by local authorities.
1.2 The social housing sector is diverse in both the size of providers that operate within it and the range of activities each undertakes. In total, there are around 1,400 active providers, of which the majority have fewer than 1,000 homes. This publication is concerned with the financial analysis of 209 large provider groups which own or manage at least 1,000 social homes, together representing more than 95% of the sector’s stock.
1.3 The provision of homes for rent is the main activity. Many providers also generate income from the sale of homes, by providing homes for ownership, either on a shared ownership basis or for outright sale. This activity exposes providers to a different risk profile to that for traditional renting and has changed the financial profile of several providers.
1.4 Most large providers are part of a group structure; these can include multiple registered providers and non-registered entities. The development of properties for outright sale and other non-social housing activity is often delivered by non-registered entities or joint ventures within group structures. This leads to differences between the accounts prepared by registered entities (entity level) and those prepared on a consolidated group basis (consolidated level). This publication presents results both at consolidated and entity level.
1.5 Further differences exist between providers in the degree to which they provide specialist housing. Whilst most providers have some supported housing or housing for older people, there are a small but significant number of primarily specialist providers. These providers face additional challenges in securing care and support contracts from local authorities and other public bodies. A sub-set of supported housing providers operate a lease-based business model. These providers comprise a small part of the sector. The majority of providers are designated as not-for-profit. The Global Accounts dataset includes the results of one for-profit provider which holds more than 1,000 units.
1.6 A financial review of the 2020/21 Global Accounts is presented in Part 2. Part 3 comprises the aggregate financial statements. Part 4 contains notes to the primary statements showing further detail of key entries and balances. The Annex includes an analysis of providers’ latest financial forecasts. This compares aggregate current projections and business plans against those submitted in previous years.
2. Financial review
Operating environment
2.1 The operating environment was dominated by the coronavirus pandemic and the range of measures introduced by the Government to offset its impact.
- The UK was first put into full lockdown on 23 March 2020 with staged easing of measures between May and July.
- A three-tiered system of restrictions was introduced in autumn. This was then replaced with a second national lockdown which came into force for four weeks starting 5 November.
- A third national lockdown came into effect on 4 January 2021 with restrictions not being lifted until March 2021.
2.2 At the start of the pandemic, the regulator wrote to providers setting out adaptations to its overall approach to regulation - RSH statements on Coronavirus. In addition to a temporary shift in focus towards short-term viability, this included the introduction of a new monthly survey to establish the operational impacts of the pandemic. The Coronavirus operational response survey was collected regularly up to March 2021.
2.3 Although the operational performance in the year reflected some of the challenges arising from the pandemic, providers generally responded well to the unprecedented circumstances. By March 2021, providers reported completing all or most safety checks, gas safety compliance was broadly back to pre-coronavirus levels and there was no material backlog in emergency repairs.
2.4 During the first lockdown, construction works and non-essential repairs were not permitted. Although programmes could continue later in the year, heightened safety guidance and other restrictions continued to constrain planned construction and repairs work throughout the period covered by the Global Accounts.
2.5 Across the UK, average construction costs on new properties increased by 3.0% - Construction Output Price Indices - ONS - over the 12-month period to 31 March 2021. In April 2020, due to the first national lockdown, construction output decreased sharply in the month by 40%. However, as restrictions began to ease gradual recovery commenced, by March 2021 construction output had recovered to 2.4% - Construction output in Great Britain, March 2021 - ONS - above the February 2020 pre-pandemic level. Despite this recovery, the number of new home registrations in 2020 (statistics reported for the calendar year) fell by 23% relative to the previous year 2020 new home statistics review - NHBC.
2.6 In a bid to boost the housing market the Chancellor announced a temporary rise in the Stamp Duty threshold from July 2020 to June 2021. The average house price in England during the period covered by the Global Accounts increased by 10.2% - (UK House Price Index - ONS](https://www.ons.gov.uk/economy/inflationandpriceindices/bulletins/housepriceindex/march2021) . Within the first month of the lockdown the number of property transactions reduced by 56%. However, following the easing of restrictions the number of residential transactions in the year increased by 3% - Monthly property transcations - compared to 2020. There are also notable regional variations in housing market performance. Yorkshire and the Humber were the fastest growing region with annual growth of 14.0%. The lowest annual growth was in London, where prices increased by 3.7%.
2.7 In response to the expected economic impact of coronavirus, the Bank of England reduced interest rates to 0.25% on 11 March 2020. In a further emergency response this was reduced for a second time on 19 March 2020 to 0.10%, where it currently remains. The three-month London Interbank Offered Rate also decreased over the year, from 0.595% to 0.088% - GBP LIBOR interest rate.
2.8 Despite concern at the onset of the pandemic, credit ratings for the sector remained stable and funding remained accessible to providers. The sector agreed a record £15.1bn of new facilities in the year with capital market funding accounting for £9.8bn of this.
2.9 Capital market facilities were boosted by the availability of the Covid Corporate Financing Facility. The fund was launched in March 2020 and was designed to support short-term liquidity amongst larger firms, helping them to bridge disruption to their cash flows. Between March 2020 and March 2021 (when the scheme closed to new purchases) the CCFF had lent over £37bn, £2.9bn of which was to 15 providers.
2.10 Providers are primarily debt funded and fix interest rates (for more than one year) on more than 75% - RSH quarterly survey - of all borrowing. Interest rates are significantly below the long-term average, a 2% increase in LIBOR could theoretically increase interest costs of variable rate financing by approximately £600m per year. It is therefore essential that providers effectively manage interest rate risk and plan for any interest rate increases in the future.
2.11 The Coronavirus Job Retention Scheme was introduced in March 2020 to allow employers to claim grant to cover the salary costs of furloughed workers. The scheme was extended until 31 March 2021 with claimants receiving 80% of their usual salary for hours not worked (up to £2,500 per month). A range of other financial support measures were introduced by Government to assist businesses during coronavirus, including business support grants which were accessed by a number of providers; the largest of those being made to care providers to assist with infection control.
2.12 The number of people on Universal Credit was 6.0 million - Official statistics overview: Universal Credit statistics, 29 April 2013 to 8 April 2021 at 11 March 2021. This was a 3.0 million (100%) increase in the number from 12 March 2020, the last count date before the coronavirus pandemic. The number of households on Universal Credit in England claiming housing entitlement with a social rented landlord increased from 740,000 in March 2020 to 1.1 million in March 2021 - DWP benefit statistics - DWP.
2.13 CPI inflation decreased by 0.8% to 0.7% in the year to March 2021 - Consumer price inflation, UK - ONS. Inflation fluctuated during the 12-month period, peaking in July at 1.0% before declining again. Average weekly wages increased by 4.0% - National statistics overview: UK labour market: May 2021](https://www.gov.uk/government/statistics/uk-labour-market-may-2021) in the 12-month period covered by the Global Accounts.
2.14 After a four-year period of rent reductions on general needs social housing and most supported housing properties, April 2020 saw the introduction of an annual maximum rent increase of CPI +1% for five years for the majority of properties. Permitted rent increases were based on the September 2019 CPI of 1.7%.
2.15 Coronavirus caused the biggest economic shock in modern history. The Government and Bank of England introduced policies designed to mitigate some of the negative economic impacts from the pandemic. Although some sectors fared worse than others, the overall resilience of the housing sector and the effectiveness of the measures introduced has meant that providers were generally able to weather the economic storm relatively unscathed.
2.16 There remains material uncertainty over the future course of the pandemic. A further wave of the virus is possible, which may result in renewed restrictions, including the implementation of contingency plans (‘Plan B’) as set out in the Government autumn and winter plan. The period after that covered in this publication has also seen delays in the supply of construction materials, labour shortages, rising prices and higher inflation. Providers will need to ensure they constantly monitor performance and forecasts and be prepared to mitigate growth in any new or existing risks.
Financial highlights
Investment
2.17 Total investment in new or existing properties, including social housing properties, properties developed for sale, and investment properties was £12.5bn. This was a decrease of 20% on spend of £15.6bn in 2020.
2.18 Construction works were significantly impacted by the pandemic. The first lockdown resulted in a temporary pause on most sites. Thereafter, ongoing restrictions and disruption continued to delay progress. The decrease in investment in new supply was widespread across the sector, almost 60% of providers reported a drop of more than 10% relative to the previous year.
2.19 Investment attributable to the development of new social housing properties decreased by 22% to £7.9bn (Figure 1). Despite the challenges of the pandemic in 2021, this was a higher level of investment in new social housing supply than any year before 2020.
Figure 1: Investment in new and existing social housing properties (consolidated)
| Investment (£bn) | Capitalised major repairs (£bn) | Spend on new social properties (£bn) | Total (£bn) |
|---|---|---|---|
| 2018 | 1.7 | 7.3 | 9.0 |
| 2019 | 1.9 | 7.7 | 9.6 |
| 2020 | 1.9 | 10.2 | 12.2 |
| 2021 | 1.6 | 7.9 | 9.5 |
2.20 In aggregate, 40,000 social housing properties for rent were completed in the year. This is a significant decrease on the 49,000 social housing units developed in 2020 and the lowest number of completions since 2017. The total number of social homes owned by providers increased by 1% to 2,736,000.
2.21 The total investment figure above includes capital investment in existing properties. Major repair activity was also heavily impacted by the periods of lockdown and ongoing difficulties in accessing properties. Total capitalised major repairs spend decreased by 19% on 2020 to £1.6bn, falling below levels reported in recent years.
2.22 The reduction in investment to £9.5bn identified above relates only to social housing properties held for rent. Providers also spent less on the supply of properties developed for sale and market rent units.
- In 2021, investment in properties developed for outright sale and the expected first tranche element of shared ownership properties was £2.7bn (2020: £3.0bn).
- Properties held for market rent and other properties held for a non-social housing purpose are categorised as investment properties in financial statements. Investment in the development of such new properties was £0.3bn (2020: £0.5bn).
2.23 The total value of housing assets held by the sector increased by £5.6bn to £180.0bn. This includes £166.1bn of social housing properties held for rent, £6.9bn of investment properties (predominantly market rent) and £7.1bn of properties held for sale (mainly land and properties under construction).
2.24 Beyond the disruption caused by the pandemic, the sector remains committed to future growth. The Annex shows that latest business plans include increased levels of investment, in both new and existing stock over the next five years. In respect of the 2021 financial results, this is reflected in reported capital commitments. Total capital commitments as at the end of 2021 were £38.7bn, a 5% increase on last year, of which £20.8bn had been contracted.
Spend on existing stock
2.25 The investment in existing properties shown in Figure 1 includes spend on stock which is capitalised (that which adds to the reporting value of the asset). This does not include the majority of repairs and maintenance spend which is disclosed as expenditure in the Statement of Comprehensive Income (SOCI). This is illustrated in Figure 2 below.
Figure 2: Total major repairs and maintenance spend (consolidated)
| Year | Maintenance (£bn) | Major repairs (£bn) | Capitalised major repairs (£bn) | Total |
|---|---|---|---|---|
| 2018 | 2.8 | 0.5 | 1.7 | 5 |
| 2019 | 3.0 | 0.5 | 1.9 | 5.4 |
| 2020 | 3.2 | 0.5 | 1.9 | 5.7 |
| 2021 | 3.3 | 0.5 | 1.6 | 5.4 |
2.26 In aggregate, total repairs and maintenance spend fell by 5% to £5.4bn. Although a decrease on 2020, this level of spend is in line or above that reported in previous years.
2.27 The decrease relative to last year is attributable to delays and stoppages to planned capital investment works. The regulator used the Coronavirus operational response survey to monitor operational risks to providers’ essential services arising from the pandemic. During the pandemic, providers focussed on ensuring essential services and repairs were maintained for tenants. Over the course of the year, routine and planned maintenance works were mostly sustained, with expenditure increasing by 1%.
Debt and funding
2.28 The investment in existing properties and new supply was primarily funded through operating surpluses, debt and capital grant. Total debt in the sector increased by £3.2bn (4%) to £86.3bn (Figure 3). This was below the comparable increases reported in 2020 (£6.2bn) and 2019 (£4.4bn).
2.29 New grant totalling £1.4bn was received during the year. As at 31 March 2021, total capital grant recognised on the balance sheet was £39.0bn, a 2% increase on 2020.
Figure 3: Total debt (consolidated)
| 2018 | 2019 | 2020 | 2021 | |
|---|---|---|---|---|
| Debt (£bn) | 72.5 | 76.9 | 83.1 | 86.3 |
| Debt to turnover | 3.6x | 3.8x | 4.0x | 4.0x |
2.30 The funding markets continued to function throughout the pandemic and the sector remains an attractive prospect for investors. Including refinancing, in the year to March 2021, the sector agreed new facilities of £15.1bn. This was the highest level ever recorded - RSH quarterly survey Q4 2020-2021 - (2020: £10.4bn, 2019: £13.5bn, 2018: £10.1bn). At the end of March 2021, available undrawn facilities were £27.8bn (March 2020: £21.9bn).
2.31 Providers increasingly accessed funding through the capital markets with £9.8bn raised in the year (2020: £4.1bn). In comparison, new bank lending of £4.8bn was arranged in the year (2020: £5.9bn). As of 31 March 2021, around 55% of existing facilities were in the form of bank loans.
2.32 The figures in 2021 were impacted by the availability of the CCFF. Over the course of the year 15 providers arranged short-term facilities (classified as capital market funding) of £2.9bn through the fund. As at 31 March 2021, 10 providers had drawn CCFF funds totalling £1.6bn.
Table 1: Indebtedness metrics
| Consolidated | Entity | |||
|---|---|---|---|---|
| Defined in brackets | 2021 | 2020 | 2021 | 2020 |
| Gearing (debt as % of social housing assets) | 52% | 52% | 52% | 53% |
| Debt to turnover (as a multiple) | 4.0 | 4.0 | 4.4 | 4.3 |
| Debt per unit (£ per social housing unit) | 30,939 | 29,974 | 30,405 | 29,667 |
2.33 Indebtedness metrics mostly remained stable in the year. The increase in debt of 4% was mirrored by similar increases in the net book value of social housing assets and growth in turnover. The latter was boosted by the permitted rent increases returning to CPI +1%.
Figure 4: Growth in debt, social housing assets value and turnover (consolidated)
| Debt | Social Housing Assets | Turnover | |
|---|---|---|---|
| 2018 | 3.9% | 3.9% | 2.3% |
| 2019 | 6.1% | 4.0% | 2.0% |
| 2020 | 7.6% | 6.3% | 1.8% |
| 2021 | 3.6% | 4.0% | 4.0% |
2.34 Debt per unit has increased by 3%. Net of demolitions and sales, the number of social housing properties owned by providers has increased by 1% in the reporting period.
Financial performance
Surplus
Table 2: Summary of income statement
| Consolidated | Entity | |||
|---|---|---|---|---|
| £ billion | 2021 | 2020 | 2021 | 2020 |
| Turnover | 22.1 | 21.2 | 19.8 | 19.4 |
| Total operating costs | (17.2) | (16.5) | (15.0) | (14.6) |
| Operating surplus | 4.9 | 4.7 | 4.9 | 4.8 |
| Net interest payable | (3.3) | (3.1) | (3.1) | (2.9) |
| Surplus on sale of fixed assets | 0.9 | 1.0 | 0.9 | 1.1 |
| Other | 0.4 | 0.8 | 0.3 | (0.1) |
| Surplus for the year | 2.9 | 3.5 | 2.9 | 2.8 |
2.35 Based on consolidated financial statements, the surplus reported in 2021 was £2.9bn, below the £3.5bn reported in 2020. However, the reported surplus fluctuates year-on-year as a result of movements in fair value. This is particularly true in consolidated financial statements which often include fair value gains from group merger activity. The underlying surplus, excluding these ‘non-cash’ gains and losses has moved slightly from £2.7bn in 2020 to £2.6bn in 2021.
2.36 The chart below highlights the key drivers behind the reported surplus; these are examined overleaf.
Figure 5: The main factors impacting the surplus (consolidated)
| Surplus | Increase/Decrease | |
|---|---|---|
| Total Surplus 2020 | £3.5bn | |
| (A) Fair value | (£0.4bn | Decrease |
| (B) Fixed asset sales | (£0.2bn) | Decrease |
| (C) Net finance costs | (£0.2bn) | Decrease |
| (D) Operating activity | £0.2bn | Increase |
| Total surplus 2021 | £2.9bn |
2.37 (A) A decrease in fair value gains of £0.4bn
- The 2020 consolidated surplus included fair value gains of £0.8bn. This was mainly attributable to a number of significant business combinations (mergers) in the year.
- In comparison the 2021 surplus includes a fair value gain of just £0.4bn. Of this £0.2bn is attributable to a gain in the fair value of financial instruments. There were also fewer mergers in the year, resulting in a gain of just £0.1bn from business combinations.
2.38 (B) A decrease in the profit recognised from fixed asset sales of £0.2bn
- In 2021 the sector reported a profit on fixed asset sales of £0.9bn (2020: £1.0bn).
- Fixed asset sales mainly relate to the sale of properties held for rent. Although this includes staircasing by shared ownership tenants and the sale of properties between providers, the movement in the year was largely attributable to Right to Buy (RTB) / Right to Acquire (RTA) sales.
- The Voluntary Right to Buy pilot scheme in the West Midlands (ending in April 2020) supported a surplus on RTB / RTA sales of £0.3bn in 2020. In 2021, the surplus on RTB / RTA sales dropped to £0.1bn.
2.39 (C) An increase in net finance costs of £0.2bn
- Net finance costs, including interest payable (and similar charges) and interest receivable, increased from £3.1bn in 2020 to £3.3bn in 2021.
- The increase is attributable to loan breakage costs. Such costs increased from £0.1bn in 2020 to £0.3bn in 2021, mostly a result of refinancing activity in two large providers.
2.40 (D) An increase in the surplus on operating activities from £4.7bn to £4.9bn. Further detail on the sector’s operating performance is in the section below. In summary:
- SHL activity accounts for more than 90% of the total operating surplus generated by the sector. The operating surplus from SHL increased from £4.4bn to £4.6bn.
- Following four years of 1% rent reductions, the rent policy changed on 1 April 2020, permitting providers to increase rents by CPI+1% for the year.
- The operating surplus on all other activities, including both shared ownership 1st tranche sales and outright market sales, was £0.35bn (2020: £0.34bn).
2.41 The reported surplus of £2.9bn decreased by £1.0bn to give a total comprehensive income for the period of £1.9bn. This decrease is a result of actuarial losses of £1.4bn recognised in respect of pension schemes. The loss is attributable to changes in underlying financial and economic assumptions underpinning valuations.
Operating margins
Table 3: Margins
| Consolidated | Entity | |||
|---|---|---|---|---|
| % | 2021 | 2020 | 2021 | 2020 |
| Operating margin | 22.4% | 22.1% | 24.5% | 24.6% |
| Operating margin on social housing lettings | 28.4% | 27.8% | 28.1% | 27.4% |
| Operating margin on 1st tranche sales | 16.2% | 20.2% | 17.1% | 19.5% |
| Operating margin on outright sale | 11.4% | 10.2% | 8.1% | 8.7% |
| Operating margin on other activities (excluding Gift Aid) | (5.9%) | (6.1%) | (2.9%) | 3.4% |
2.42 The operating surplus increased by £0.2bn to £4.9bn driven primarily by a growth in rental income and an uptick in the margin on SHL activity. Almost three quarters of turnover is generated through this core activity (Figure 6).
Figure 6: Breakdown of turnover (consolidated)
| Turnover | Social Housing Lettings (£bn) | LCHO 1st tranche (£bn) | Properties developed for sale (£bn) | Other activities (£bn) | Total (£bn) |
|---|---|---|---|---|---|
| 2018 | 15.4 | 1.2 | 1.4 | 2.5 | 20.5 |
| 2019 | 15.5 | 1.4 | 1.5 | 2.5 | 20.9 |
| 2020 | 15.7 | 1.6 | 1.6 | 2.4 | 21.2 |
| 2021 | 16.1 | 1.6 | 1.9 | 2.4 | 22.1 |
2.43 Operating performance in respect of SHL and development for sale (including 1st tranche sales and properties developed for outright sale) is examined in detail in the sections below. Figure 6 includes ‘other activities’ which encompasses a range of both social and non-social activity.
- Other activities include £0.8bn of social income associated with the provision of care services, development services and other miscellaneous activities. In 2021 a combined loss of £0.2bn was reported on these activities (2020: loss of £0.3bn)
- Income from other non-social activities totalled £1.6bn in 2021. This included income from non-social rent of £0.6bn. An operating contribution of £0.1bn was reported on other non-social activities (2020: £0.1bn contribution).
Social housing lettings
2.44 The surplus on SHL has increased by £0.2bn to £4.6bn. Of this increase, 40% is attributable to an improvement in the margin and 60% to increased turnover.
2.45 The year ending March 2020 was the fourth and final year of 1% rent reductions. It was also the third consecutive year that the surplus and margin on SHL had declined. The year ending March 2021 saw the return to permitted rent increases (capped at the September 2019 CPI of 1.7% plus 1%). This has resulted in rents receivable (net of voids) increasing by 3% to £14.0bn and an uptick in the margin.
Figure 7: SHL income and expenditure growth (consolidated)
| Growth in turnover | Growth in expenditure | Margin | |
|---|---|---|---|
| 2018 | 1.6% | 3.7% | 32.8% |
| 2019 | 0.6% 4.1% | 30.5% | |
| 2020 | 1.4% | 5.2% | 27.8% |
| 2021 | 3.0% | 2.3% | 28.4 % |
2.46 In 2021 the return to inflation linked rent increases has coincided with SHL cost growth being held back. Lower SHL cost increases in 2021 are partially attributable to the disruptive impact of the pandemic.
2.47 Between 2017 and 2020 ‘operating’ maintenance and major repairs costs (excluding capitalised major repairs) increased by an average of 6% per annum. By comparison, although providers generally adapted well to restrictions and were able to deliver essential maintenance activities, costs increased by just 2% in 2021.
2.48 Between 2017 and 2020 management and service charge costs increased by an average of 5% per annum. The comparable increase in 2021 is just 2%. In some cases, the shift to remote working and the focus on essential services resulted in a reduction in management costs. However, for some providers costs increased as they responded to the challenges of operating in a pandemic. In many cases, this included delivering additional support and care services to tenants.
Social housing lettings: Operating performance
2.49 Bad debts, void losses and current tenant arrears are key performance indicators in assessing the efficiency of letting and rent collection. Throughout 2021, the operational impact of the pandemic was monitored through the Quarterly survey return and Coronavirus operational response survey.
Table 4: Indicators of operating performance
| Consolidated | Entity | |||
|---|---|---|---|---|
| % of gross rent | 2021 | 2020 | 2021 | 2020 |
| Rent loss from void properties | 1.9% | 1.5% | 1.9% | 1.5% |
| Bad debts for the year | 0.7% | 1.0% | 0.7% | 1.0% |
| Current tenant arrears | 5.0% | 4.9% | 4.9% | 4.9% |
2.50 Current tenant arrears have increased from £674m to £705m. As a percentage of gross rent this represents only a slight increase. Providers have taken a range of different approaches to estimating provisions for bad debts and writing off arrears. Although the overall provision for bad or doubtful debts has increased, some providers reversed provisions made in 2020 accounts. The aggregate impact results in bad debt charges (as reported in the SOCI) decreasing relative to 2020.
2.51 As we have seen through the Quarterly survey, the most materially impacted operating indicator has been voids. Rent loss from voids increased from £210m to £270m. As a percentage of gross rent, void losses were 1.9% which is the highest level since 2010.
Figure 8: Voids as a % of gross rent (consolidated)
| Rent loss from voids (£m) | Rent loss from voids (% of gross rent | |
|---|---|---|
| 2018 | £196m | 1.5% |
| 2019 | £203m | 1.5 % |
| 2020 | £210m | 1.5% |
| 2021 | £270m | 1.9% |
2.52 At a sector level the increase in voids has not had a material impact on the operating performance of the sector. If voids had remained at 2020 levels the operating margin, would have been 28.6% rather than the 28.4% reported.
2.53 However, the highest void rent losses are typically reported by providers with a large proportion of supported housing units, care home units or housing for older people. Void losses on rent from supported and housing for older people were 5.6% of gross rent. The comparable figure on general needs rented units was 1.2%.
Sales
2.54 House prices grew in 2021 across all regions of the country. However, the lockdowns did result in disruption to sales activity and the housing market remains a risk because of the high degree of economic uncertainty.
2.55 Total sales receipts increased to £5.7bn (2020: £5.4bn). The corresponding surplus on sales decreased to £1.3bn (2020: £1.5bn).
Figure 9: Profit on sales (consolidated)
| Sales surpus (£bn) | Surplus on fixed sales assets | Surplus on 1st tranche sales | Surplus on outright sales | Total |
|---|---|---|---|---|
| 2018 | 0.9 | 0.4 | 0.3 | 1.6 |
| 2019 | 0.9 | 0.4 | 0.2 | 1.4 |
| 2020 | 1.0 | 0.3 | 0.2 | 1.5 |
| 2021 | 0.9 | 0.3 | 0.2 | 1.3 |
2.56 The profit realised on the sale of fixed assets decreased by £0.2bn to £0.9bn.
2.57 The decrease in the profit on fixed asset sales is mainly attributable to a drop in RTB / RTA sales. The proceeds from such sales dropped by 51% to £251m and the surplus dropped by 54% to £127m. The higher level of sales and surplus in the previous year were driven by the Voluntary Right to Buy pilot in the Midlands region which concluded in April 2020.
2.58 The total surplus on fixed asset sales also includes staircasing sales to shared ownership tenants. In 2021 such sales generated a surplus of £0.3bn (2020: £0.3bn). Other fixed asset sales (mainly the sale of rented properties to other providers) generated a surplus of £0.5bn (2020: £0.5bn)
2.59 Providers also develop properties for sale. These may be units for outright sale at market values or low-cost home ownership (LCHO) units where a proportion of the property is sold as a 1st tranche. Both types of sale are classified as current asset sales and are included in operating activities.
- LCHO 1st tranche sales receipts were £1.6bn (2020 £1.6bn) and the contribution was £270m (2020: £320m). The margin fell from 20% to 16% on 1st tranche sales. The decrease was widespread, 66% of providers with 1st tranche sales income reported a drop in margin resulting from rising build costs.
- Outright sale receipts were £1.9bn (2020: £1.6bn) and the contribution was £220m (2020: £160m). Around half of the increase in sale receipts in 2021 was attributable to the bulk sale of units made by one provider.
2.60 Development for sale is concentrated in a small number of large providers with significant exposure to the housing market. In respect of outright sales, 85% of the sectors total receipts are reported by 20 providers.
Interest cover
2.61 The sector’s key measure of its ability to cover ongoing finance costs is EBITDA MRI interest cover. This metric deteriorated between 2018 and 2020 as the sector implemented rent cuts whilst continuing to invest in existing stock and building safety.
2.62 The chart below illustrates that, despite the pandemic, there has been an increase in aggregate interest cover.
Figure 10: EBITDA MRI interest cover (consolidated)
| EBITDA MRI interest cover | |
|---|---|
| 2018 | 174% |
| 2019 | 153% |
| 2020 | 138% |
| 2021 | 151% |
2.63 Total EBITDA MRI reported by the sector has increased by £0.7bn to £5.7bn. The corresponding margin has increased from 24.3% to 26.5%. This improvement is attributable to two factors.
- A £0.2bn increase in operating surplus, driven by SHL performance and assisted by the return to permitted rent increases of CPI +1%.
- A £0.4bn decrease in capitalised major repairs spend, largely a result of disruptive impact of the pandemic and lockdowns.
2.64 Whilst total debt has increased, this has been matched by growth in turnover. The effective interest rate, based on total finance costs, has also remained stable.
Table 5: Interest cover metrics
| Consolidated | Entity | |||
|---|---|---|---|---|
| % (unless otherwise stated) | 2021 | 2020 | 2021 | 2020 |
| EBITDA MRI interest cover | 151% | 138% | 155% | 147% |
| EBITDA MRI interest cover SHL | 142% | 129% | 145% | 133% |
| EBITDA MRI margin | 26.5% | 24.3% | 30.1% | 27.8% |
| Debt to turnover (as a multiple) | 4.0 | 4.0 | 4.4 | 4.3 |
| EIR | 4.4% | 4.4% | 4.4% | 4.4% |
| EIR (excluding breakage costs) | 4.0% | 4.1% | 4.0% | 4.1% |
2.65 Each year there are a small number of providers who incur breakage or other exceptional finance costs when refinancing. When breakage costs are excluded from both years metric results, EIR actually decreased in 2021.
2.66 The median value for EBITDA MRI interest cover was 182% (2020: 170%) with 87% of providers reporting a figure greater than 100%. There are several reasons why individual providers may have relatively low levels of interest cover. For example, stock transfer organisations typically have high levels of repairs and maintenance costs linked to stock improvement programmes. Other providers will incur one-off breakage costs as noted above.
2.67 The interest cover measure used by the regulator includes all major repairs spend. This ensures a consistent comparison of performance across providers, regardless of capitalisation policies. Most providers have interest cover loan covenants with limits typically between 110% and 125%. The basis used for covenant calculations may exclude elements of major repair spend, particularly where they relate to exceptional costs. The regulator monitors the financial viability, including covenant compliance, of all providers on an ongoing basis through the Quarterly survey return.
2.68 The sector responded well to the challenges of the pandemic. Liquidity remained strong and performance in the year was robust in respect of both lettings and sales activities. We will continue to engage with providers to gain assurance where there are indicators to the contrary.
3. Financial statements
Table 6: Statement of comprehensive income
| Consolidated | Entity | ||||
|---|---|---|---|---|---|
| £ billion | Note | 2021 | 2020 | 2021 | 2020 |
| Turnover | 2 | 22.1 | 21.2 | 19.8 | 19.4 |
| Operating expenditure | 2 | (14.1) | (13.9) | (13.3) | (13.0) |
| Cost of sales | 2 | (3.0) | (2.7) | (1.7) | (1.6) |
| Operating surplus/(deficit) | 2 | 4.9 | 4.7 | 4.9 | 4.8 |
| Gain/(loss) on disposal of fixed assets | 4 | 0.9 | 1.0 | 0.9 | 1.1 |
| Operating surplus/(deficit) including fixed asset disposals | 5.8 | 5.8 | 5.7 | 5.8 | |
| Other items | 5 | 0.2 | 0.9 | 0.2 | 0.0 |
| Interest receivable | 0.1 | 0.2 | 0.3 | 0.4 | |
| Interest payable and financing costs | 6 | (3.4) | (3.3) | (3.5) | (3.3) |
| Movements in fair value | 7 | 0.2 | (0.1) | 0.2 | (0.1) |
| Surplus/(deficit) before tax | 2.9 | 3.5 | 2.9 | 2.8 | |
| Taxation | 0.0 | 0.0 | (0.0) | 0.0 | |
| Surplus/(deficit) for the period | 2.9 | 3.5 | 2.9 | 2.8 | |
| Unrealised surplus/(deficit) on revaluation of housing properties | 0.1 | 0.1 | 0.1 | 0.1 | |
| Actuarial (loss)/gain in respect of pensions | 20 | (1.4) | 1.1 | (1.3) | 1.1 |
| Change in fair value of hedged instruments | 7 | 0.4 | (0.3) | 0.3 | (0.2) |
| Total comprehensive income for the period | 1.9 | 4.4 | 2.0 | 3.7 | |
Table 7: Statement of changes in reserves
| £ billion | Income and expenditure reserves | Revaluation reserves | Other reserves | Total |
|---|---|---|---|---|
| Consolidated | ||||
| Closing balance 2020 | 44.5 | 12.1 | (0.9) | 55.7 |
| Restatements | (0.1) | (0.2) | 0.0 | (0.2) |
| Balance at start of period | 44.4 | 11.9 | (0.9) | 55.5 |
| Surplus/(deficit) for the period | 2.9 | NA | NA | 2.9 |
| Other comprehensive income | (1.3) | 0.1 | 0.3 | (1.0) |
| Transfer from revaluation reserve | 0.1 | (0.1) | 0.0 | (0.0) |
| Other transfers | 0.1 | 0.0 | (0.1) | 0.0 |
| Closing balance 2021 | 46.2 | 11.9 | (0.7) | 57.4 |
| Entity | ||||
| Closing balance 2020 | 43.1 | 12.4 | (0.6) | 54.9 |
| Restatements | (0.2) | (0.2) | (0.0) | (0.4) |
| Balance at start of period | 42.9 | 12.2 | (0.6) | 54.5 |
| Surplus/(deficit) for the period | 2.9 | NA | NA | 2.9 |
| Other comprehensive income | (1.2) | 0.1 | 0.2 | (0.9) |
| Transfer from revaluation reserve | 0.1 | (0.1) | 0.0 | (0.0) |
| Other transfers | 0.0 | (0.0) | (0.1) | (0.1) |
| Closing balance 2021 | 44.7 | 12.2 | (0.5) | 56.4 |
Table 8: Statement of Financial Position
| Consolidated | Entity | |||||
|---|---|---|---|---|---|---|
| £ billion | Note | 2021 | 2020 | 2021 | 2020 | |
| Fixed assets | ||||||
| Tangible fixed assets: housing properties at cost & valuation | 8 | 166.1 | 160.3 | 161.0 | 155.3 | |
| Other fixed assets | 9 | 3.0 | 3.0 | 2.7 | 2.7 | |
| Investment properties | 9 | 6.9 | 6.7 | 3.9 | 3.9 | |
| Other investments | 9 | 1.8 | 1.9 | 4.1 | 3.9 | |
| Total fixed assets | 177.8 | 171.9 | 171.7 | 165.8 | ||
| Current assets | ||||||
| Properties held for sale | 10 | 7.1 | 7.4 | 3.2 | 3.3 | |
| Trade and other debtors | 10 | 2.1 | 2.1 | 1.5 | 1.7 | |
| Cash and short-term investments | 10 | 8.6 | 7.4 | 7.4 | 6.9 | |
| Other current assets | 10 | 2.0 | 1.9 | 8.8 | 8.6 | |
| Total current assets | 19.7 | 18.8 | 20.9 | 20.5 | ||
| Creditors: | ||||||
| amounts falling due within one year | ||||||
| Short-term loans | 12 | 3.6 | 2.6 | 3.2 | 2.6 | |
| Deferred capital grant: due within one year | 13 | 0.5 | 0.5 | 0.5 | 0.5 | |
| Other current liabilities | 11 | 6.5 | 6.2 | 6.9 | 6.1 | |
| Total creditors: | ||||||
| amounts falling due within one year | 10.6 | 9.3 | 10.6 | 9.2 | ||
| Net current assets/liabilities | 9.1 | 9.5 | 10.3 | 11.3 | ||
| Total assets less current liabilities | 186.9 | 181.4 | 182.1 | 177.2 | ||
| Creditors: | ||||||
| amounts falling due after more than one year | ||||||
| Long-term loans | 12 | 81.7 | 79.5 | 62.4 | 63.0 | |
| Amounts owed to group undertakings | 12 | 0.3 | 0.4 | 18.1 | 15.7 | |
| Finance lease obligations | 12 | 0.6 | 0.7 | 0.5 | 0.5 | |
| Deferred capital grant: due after more than one year | 13 | 38.5 | 37.7 | 37.5 | 36.7 | |
| Other long-term creditors | 14 | 4.1 | 4.6 | 3.3 | 3.7 | |
| Total creditors: | ||||||
| amounts falling due after more than one year | 125.2 | 122.8 | 121.8 | 119.6 | ||
| Provisions for liabilities | ||||||
| Pension provision | 20 | 3.4 | 2.1 | 3.1 | 1.9 | |
| Other provisions | 15 | 0.9 | 0.8 | 0.8 | 0.8 | |
| Total net assets | 57.4 | 55.7 | 56.4 | 54.9 | ||
| Reserves | ||||||
| Income and expenditure reserve | 16 | 46.2 | 44.5 | 44.7 | 43.1 | |
| Revaluation reserves | 16 | 11.9 | 12.1 | 12.2 | 12.4 | |
| Other reserves | 16 | (0.7) | (0.9) | (0.5) | (0.6) | |
| Total reserves | 57.4 | 55.7 | 56.4 | 54.9 | ||
4. Notes to the Accounts
Global Accounts methodology
4.1.1 This analysis is based on a database of information derived from housing providers’ audited financial statements. The database contains data from the annual account regulatory returns (known as Financial Viability Assessments) which must be submitted by providers that own or manage 1,000 or more homes.
4.1.2 The database excludes regulatory returns submitted by two providers with non-standard financial year ends. These providers have year ends of 30 September 2020 and 31 October 2020. The period covered in their financial statements would not be commensurate with the rest of the dataset (based mainly on the period 1 April 2020 to 31 March 2021). Neither of the excluded providers materially impact the figures in this publication.
4.1.3 Where a provider is a parent of a group structure that produces consolidated financial statements, it submits both an entity and a consolidated FVA.
4.1.4 These regulatory returns are aggregated to produce the Statement of Financial Position, Statement of Changes in Reserves and SOCI. The statements and notes within this document are based on the entity and consolidated datasets for 2020/21. Comparative figures for 2019/20 are also provided.
4.1.5 Figures have been rounded to the nearest £billion to one decimal place. This can result in rounding differences in totals as the individual returns are denominated in £000s.
Aggregate SOCI
4.1.6 The aggregate SOCI reflects the sum of private registered provider activity for all accounting periods ending between 1 April 2020 and 31 March 2021.
Aggregate SOFP
4.1.7 The aggregate SOFP is the sum of individual statements where the financial year end falls within the period from 1 April 2020 to 31 March 2021.
Additional information
4.1.8 Additional information is provided on other activities, selected notes to the financial statements and the number of homes in management.
Changes to FVA return
4.1.9 There were no changes to the FVA template for 2021.
Particulars of turnover, operating expenditure and operating surplus
a. Social housing lettings
4.2.1 Turnover from SHL increased by 3% in both the consolidated and entity returns, reaching £16.1bn and £15.9bn respectively. Factors contributing to the small difference between the consolidated and entity figures include turnover from small registered providers with fewer than 1,000 units where these form part of group structures, and social housing letting activity undertaken outside England.
Table 9: Income and expenditure from SHL
| Consolidated | Entity | |||
|---|---|---|---|---|
| £ billion | 2021 | 2020 | 2021 | 2020 |
| Income | ||||
| Rents | 14.0 | 13.5 | 13.7 | 13.3 |
| Service charge income | 1.5 | 1.5 | 1.5 | 1.4 |
| Net rental income | 15.4 | 15.0 | 15.2 | 14.7 |
| Capital grant released to income | 0.5 | 0.5 | 0.5 | 0.5 |
| Other & revenue grant | 0.2 | 0.2 | 0.2 | 0.3 |
| Turnover from SHL | 16.1 | 15.7 | 15.9 | 15.4 |
| Expenditure | ||||
| Management | 3.0 | 3.0 | 3.0 | 2.9 |
| Service charge costs | 1.9 | 1.8 | 1.8 | 1.8 |
| Routine maintenance | 2.3 | 2.2 | 2.3 | 2.2 |
| Planned maintenance | 1.0 | 1.0 | 1.0 | 1.0 |
| Major repairs expenditure | 0.5 | 0.5 | 0.5 | 0.5 |
| Bad debts | 0.1 | 0.1 | 0.1 | 0.1 |
| Depreciation of housing properties | 2.4 | 2.3 | 2.4 | 2.3 |
| Impairment of housing properties | 0.0 | 0.0 | 0.0 | 0.0 |
| Other costs (including lease costs) | 0.3 | 0.3 | 0.3 | 0.3 |
| Expenditure on SHL | 11.6 | 11.3 | 11.4 | 11.2 |
| Operating surplus / (deficit) on SHL | 4.6 | 4.4 | 4.5 | 4.2 |
| Void rent loss | 0.3 | 0.2 | 0.3 | 0.2 |
4.2.2 Rental income increased by £444m (3.3%) in the consolidated returns, reflecting the return to permitted rent increases. These were capped at CPI at September 2019 of 1.7% + 1%. For the rental element of shared ownership units, increases were capped at RPI + 0.5%, which for providers using September 2019 as their review date would equate to an increase of 2.9%. A net increase in the overall number of housing units during the year has further increased the level of rental income recorded, whilst changes to the population of providers in the dataset has had a negligible impact.
4.2.3 At consolidated group level, void rent losses increased by 29% to reach £0.3bn. Providers have experienced increased void repair times due to lockdown and social distancing restrictions, and challenges in letting properties, particularly in communal sheltered schemes. Void losses relating to Supported Housing and Housing for Older People accounted for 35% of total void losses, although these units represent just 13% of total social housing units.
4.2.4 Total expenditure on SHL increased by 2% to £11.6bn. Planned maintenance, bad debt charges and ‘other’ costs saw a decline in expenditure, whilst all other areas of expenditure have experienced increases in costs.
4.2.5 Total maintenance and major repairs costs (recognised as operating expenditure) increased by just 2% in 2021. Within this, planned maintenance expenditure decreased by £14m (1%) over the year as lockdown restrictions impacted providers’ ability to carry out planned programmes. Instead, providers prioritised essential repairs and building safety works, which was reflected by an increase in routine maintenance spend of £58m (3%), and in major repairs expenditure of £32m (6%).
4.2.6 Service charge costs increased by £58m (3%), with the corresponding income increasing by £39m (3%). The ratio of service charge income to associated costs remained at 79%.
4.2.7 Depreciation charges increased by £121m (5%) over the year, reflecting the continued investment in new and existing properties over recent years. Impairment charges were £10m (34%) higher than in 2020 and included the write-down of property values where building safety issues had been identified, the impairment of properties earmarked for demolition and a provision for increased development costs following contractor insolvency. Bad debt charges, including the movement in provisions and amounts written off, were £41m (30%) lower than in the previous year.
4.2.8 Management costs increased by £45m (2%) over the year. Around two-thirds of providers reported an increase in management costs relative to 2020. Other costs, including lease payments, reduced by £16m (5%).
4.2.9 On a consolidated basis, operating surplus has increased by £223m (5%), with the operating margin increasing from 27.8% to 28.4%. The margin on an entity basis is not materially different.
b. Other social housing activities
Table 10: Other social housing activities
| Consolidated | Entity | |||
|---|---|---|---|---|
| £ billion | 2021 | 2020 | 2021 | 2020 |
| First tranche LCHO sales | ||||
| Turnover | 1.6 | 1.6 | 1.6 | 1.5 |
| Expenditure / Cost of sales | 1.4 | 1.3 | 1.3 | 1.2 |
| Surplus | 0.3 | 0.3 | 0.3 | 0.3 |
| Other social housing activities | ||||
| Turnover | 0.8 | 0.7 | 1.1 | 1.0 |
| Expenditure / Cost of sales | 1.0 | 1.0 | 1.1 | 1.1 |
| Surplus | (0.2) | (0.3) | (0.1) | (0.1) |
| Total | ||||
| Turnover | 2.4 | 2.3 | 2.6 | 2.5 |
| Expenditure / Cost of sales | 2.4 | 2.3 | 2.4 | 2.3 |
| Surplus | 0.0 | 0.0 | 0.2 | 0.2 |
4.2.10 Turnover from first tranche LCHO sales in the consolidated statements increased slightly by £31m (2%) to £1.6bn. Expenditure / Cost of sales increased by £90m (7%) to £1.4bn. The margin on LCHO sales has fallen for a fourth consecutive year (32% in 2017), from 20% in 2020 to 16% in 2021, resulting in a surplus of £0.3bn; an 18% decrease from 2020. The fall in margin is widespread with 66% of providers who reported turnover from this source experiencing a decrease in comparison to 2020. Although 76% of providers report some turnover from this source, it is heavily concentrated amongst a small number of providers with 30 accounting for two-thirds of the sector total.
4.2.11 Data from the Quarterly Financial and Risk Survey shows that in the year to March 2021, the volume of first tranche units sold increased by 2% on the previous year. Although sales values per unit increased, the growth in cost per unit was greater resulting in a reduction in margin from this activity.
4.2.12 The income from other non-letting social housing activity rose by 11%, an increase of £79m to £0.8bn. Costs increased by 3% to £1.0bn, resulting in a deficit of £0.2bn, a 15% improvement from 2020 when the deficit was £0.3bn. Almost half of this activity consisted of income relating to support services which saw a £22m (6%) increase. The overall loss reported on this activity remained unchanged at £12m. Support service income is heavily concentrated with 13 providers reporting income in excess of £10m each from this source, and in aggregate accounting for almost 70% of the sector.
4.2.13 The remainder of other social housing activity includes development services, community and neighbourhood activities, gift aid, management services and a range of other activities. The sector reported a loss on these activities of £231m (2020: £276m), a 16% improvement on last year’s consolidated returns.
c. Non-social housing activities
Table 11: Non-social housing activities
| Consolidated | Entity | |||
|---|---|---|---|---|
| £ billion | 2021 | 2020 | 2021 | 2020 |
| Properties developed for sale | ||||
| Turnover | 1.9 | 1.6 | 0.3 | 0.3 |
| Expenditure / Cost of sales | 1.7 | 1.4 | 0.2 | 0.2 |
| Surplus | 0.2 | 0.2 | 0.0 | 0.0 |
| Other non-social housing activities | ||||
| Turnover | 1.6 | 1.7 | 1.0 | 1.2 |
| Expenditure / Cost of sales | 1.5 | 1.5 | 0.9 | 0.9 |
| Surplus | 0.1 | 0.1 | 0.2 | 0.3 |
| Total | ||||
| Turnover | 3.5 | 3.2 | 1.3 | 1.4 |
| Expenditure / Cost of sales | 3.2 | 2.9 | 1.1 | 1.1 |
| Surplus | 0.3 | 0.3 | 0.2 | 0.3 |
4.2.14 Turnover for properties developed for outright sale increased by £376m (24%) to £1.9bn in the consolidated returns. Approximately half of this increase is attributable to bulk sales of a completed site made by one provider.
4.2.15 This activity is primarily undertaken by non-registered entities within group structures and so is materially greater in the consolidated returns. The margin on this activity slightly increased from 10% to 11% resulting in an overall increase of £61m (38%) in the surplus reported of £0.2bn.
4.2.16 Outright sale activity is concentrated in a comparatively small number of providers, with one-third reporting some turnover from this activity. Three providers reported turnover in excess of £200m, collectively accounting for over a third of the sector total.
4.2.17 Some providers deliver units for outright sale through joint ventures. Income and expenditure from outright sale activity undertaken in joint ventures is not reported separately. The net surplus from joint ventures is included in the income statement under “Other items” (see section 5).
4.2.18 In aggregate, the turnover from other non-social activity was £1.6bn, a 6% decrease from 2020. Of this total, £0.6bn is reported by just three providers, attributing to almost 40% of the overall total. The nature of the non-social housing activity varies for each of the three providers, which include specialisms in land sales, leisure facilities management, property management services and the provision of student accommodation and nursing homes.
4.2.19 The surplus from other non-social activity decreased by £36m (25%) to £108m in comparison to 2020. This includes market rent, student rent and nursing homes, activities for which there was a combined surplus of £148m (2020: £193m). However, nursing homes experienced a loss of £11m, compared to a surplus of £4m in the previous year. This is mainly due to the impact of the pandemic which resulted in lower levels of occupancy and unprecedented cost increases. A loss of £40m was reported for other items which include commercial and office lettings, development costs not capitalised, management services to group companies, and telecare services.
Gift aid
4.3.1 Gift aid receipts are now included within turnover, following a change in data collection in 2020, and disclosed as part of either ‘other social housing’ or ‘non-social housing’ activities. Receipts in entity returns totalled £256m in 2021, a 33% decrease on the £383m reported in 2020, and gift aid payments came to £69m.
4.3.2 The gift aid receipts in entity returns reflect non-social housing activity carried out by non-registered entities within group structures. There is a strong correlation between gift aid received in the entity returns and surplus on properties developed for sale in non-registered entities within consolidated returns.
Disposal of fixed assets
4.4.1 Based on consolidated returns, total fixed assets sales during the year generated proceeds of £2.1bn and a surplus of £0.9bn. This is a reduction in sale proceeds of 7% from 2020 and a decrease in surplus of 18%, with 63% of providers reporting a reduction in surplus compared to the previous year.
4.4.2 Decline in RTB sales had the biggest impact. In total, proceeds from RTB and RTA sales dropped by over 50% to £251m (2020: £514m), resulting in the surplus also decreasing by 54% to £127m (2020: £274m).
4.4.3 This was driven by the cessation of the Voluntary RTB pilot. The VRTB Midlands pilot which launched across the East and West Midlands in August 2018 ended in April 2020. Over 30% of the overall RTB reduction was derived from two providers who participated in the scheme.
4.4.4 Receipts from staircasing sales decreased by 8% to £639m (2020: £698m), resulting in a reduction in surplus of 9% to £257m (2020: £283m). The margin on staircasing remained stable at 40%.
4.4.5 Other housing property sales generated proceeds of £571m, a 9% decrease from 2020, resulting in a 13% reduction in surplus to £287m (2020: £331m). This category includes stock rationalisation, sale of void properties and to a lesser extent the sale of non-social housing assets.
4.4.6 Proceeds from sales to other RPs increased by a third to £447m with surplus also increasing to £176m (2020: £147m). This was driven by two providers who engaged in a stock transfer in March 2021, accounting for almost 70% of overall surplus, with joint proceeds of £273m.
4.4.7 Sales of other assets proceeds more than doubled to £208m (2020: £100m). However, costs recognised on the sale of assets also significantly increased, resulting in a surplus reduction of 9% to £13m.
Table 12: Disposal of fixed assets
| Consolidated | Entity | |||
|---|---|---|---|---|
| £ billion | 2021 | 2020 | 2021 | 2020 |
| Staircasing | ||||
| Proceeds | 0.6 | 0.7 | 0.6 | 0.7 |
| Costs of Sales | 0.4 | 0.4 | 0.4 | 0.4 |
| Surplus | 0.3 | 0.3 | 0.3 | 0.3 |
| RTB/RTA | ||||
| Proceeds | 0.3 | 0.5 | 0.2 | 0.5 |
| Costs of Sales | 0.1 | 0.2 | 0.1 | 0.2 |
| Surplus | 0.1 | 0.3 | 0.1 | 0.3 |
| Other housing property sales | ||||
| Proceeds | 0.6 | 0.6 | 0.6 | 0.6 |
| Costs of Sales | 0.3 | 0.3 | 0.3 | 0.3 |
| Surplus | 0.3 | 0.3 | 0.3 | 0.3 |
| Sales to other RPs and other | ||||
| Proceeds | 0.7 | 0.4 | 0.6 | 0.5 |
| Costs of Sales | 0.5 | 0.3 | 0.4 | 0.3 |
| Surplus | 0.2 | 0.2 | 0.2 | 0.2 |
| Total | ||||
| Proceeds | 2.1 | 2.3 | 2.1 | 2.3 |
| Costs of Sales | 1.3 | 1.2 | 1.2 | 1.3 |
| Surplus | 0.9 | 1.0 | 0.9 | 1.1 |
Other items
Table 13: Other items
| | Consolidated | | Entity | | | £ billion | 2021 | 2020 | 2021 | 2020 | |——————————————————————–|———————|————-|—————|————-| | Other items | 0.1 | 0.8 | 0.2 | 0.0 | | Share of operating surplus in joint ventures or associates | 0.1 | 0.1 | 0.0 | 0.0 | | # Total | 0.2 | 0.9 | 0.2 | 0.0 | 4.5.1 Other items include gains resulting from business combinations where the acquisition method of accounting has been used [footnote 1]. Based on the consolidated returns, there were five providers who reported net gains on business combinations amounting to £115m (2020: £837m). The comparable figure for entity returns was £178m (2020: £14m), which was higher than the consolidated figure due to one provider participating in an intercompany transfer.
4.5.2 Providers account for activity undertaken in joint ventures using ‘equity’ accounting principles. In the SOCI, income and expenditure are not reported separately. The net surplus from joint ventures is included as a separate line item.
4.5.3 The net surplus from joint ventures has decreased by £17m (18%) to £77m in 2021, following an increase of £21m in 2020. This is partly due to one provider incurring significant impairment charges, bringing the net surplus down. Two providers each reported more than £15m of income from this source, together accounting for 73% of the total.
4.5.4 The majority of the surplus from joint ventures is generated through the provision of homes for outright sale. The turnover associated with the net surplus figure is not included in financial statements. Outright sales income of £0.6bn underpins the net surplus on joint ventures reported in the year, and the share of turnover from joint ventures totalled £733m.
Interest payable and finance costs
4.6.1 Total interest and finance costs increased by £145m (4%) in the consolidated statements to a total of £3.4bn. This increase comprised a small (£33m, 1%) increase in interest payable on liabilities and a larger (£126m, 37%) increase in ‘other amounts payable’ (Table 14).
4.6.2 The primary item within ‘other amounts payable’ is loan breakage costs. These are typically incurred by providers when undertaking re-financing activity and can vary substantially from year to year. In 2021 loan breakage costs were reported by 29 providers (2020: 18 providers) and came to £337m in total (2020: £136m). Five providers reported breakage costs in excess of £10m, together accounting for 75% of the total.
Table 14: Interest payable and finance costs
| Consolidated | Entity | |||
|---|---|---|---|---|
| £ billion | 2021 | 2020 | 2021 | 2020 |
| Interest payable on liabilities | 3.3 | 3.2 | 3.2 | 3.1 |
| Defined benefit pension charges | 0.0 | 0.1 | 0.0 | 0.1 |
| Other amounts payable | 0.5 | 0.3 | 0.5 | 0.3 |
| Less: interest capitalised in housing properties | (0.4) | (0.4) | (0.3) | (0.3) |
| Total interest payable and financing costs | 3.4 | 3.3 | 3.5 | 3.3 |
Movements in fair value and remeasurements
Movements in the fair value of investment properties
4.7.1 Properties held for market rent and other properties held for a non-social housing purpose are categorised as investment properties. They are re-measured annually at their fair value, with any change in fair value being reported in the surplus for the year.
4.7.2 Based on consolidated returns, the increase in the fair value of investment properties held by the sector was £14m (56%) to £40m on re-measurement. This follows the steep decline in fair value re-measurements in 2020 due to uncertain market conditions at the start of the pandemic. 79 providers reported positive fair value movements in the year, with one provider accounting for 40% of the overall fair value re-measurements. The figure based on entity returns was £5m, reflecting the extent to which market rent properties are held by non-registered entities within group structures.
Movements in the fair value of financial instruments
4.7.3 Interest rate swaps and a minority of loans are classified as ‘non-basic’ or ‘other’ financial instruments under FRS102 and must be re-measured annually at fair value. Swap rates increased over the year, for example, the 15-year swap rate improved from 0.62% in March 2020 to 1.21% in March 2021.
4.7.4 Non-hedged financial instruments had a favourable movement of £212m, mainly driven by seven providers with favourable movements of over £10m. In respect of hedged financial instruments, providers reported a favourable movement of £349m, with one provider accounting for over 20% of this. Movement in the value of non-hedged financial instruments are included within the surplus, whereas hedged financial instruments are included within other comprehensive income. Whether hedge accounting can be applied is determined by the economic relationship between the hedged item and the hedging instrument.
Fixed assets – housing properties
Table 15: Fixed asset housing properties
| £ billion | Consolidated | Entity |
|---|---|---|
| Housing properties at cost or valuation | ||
| Properties held at cost | 180.1 | 174.6 |
| Properties held at valuation | 2.3 | 2.3 |
| Total properties held at start of period | 182.5 | 176.9 |
| Additions | ||
| Additions (new properties) | 7.9 | 7.7 |
| Additions (existing properties) | 1.6 | 1.5 |
| Disposals | -1.4 | -1.2 |
| Transfers and reclassifications [footnote 2] | 0.2 | 0.5 |
| Revaluation and other | 0 | 0 |
| Total properties held at end of period | 190.8 | 185.4 |
| Depreciation and impairment | ||
| Total depreciation and impairment at start of period | 22.6 | 22.3 |
| Depreciation and impairment charged in period | 2.5 | 2.5 |
| Released on disposal | -0.4 | -0.3 |
| Revaluation and other | -0.1 | -0.1 |
| Total depreciation and impairment at end of period | 24.7 | 24.3 |
| Net book value at end of period: | ||
| Properties held at cost | 164.4 | 158.6 |
| Properties held at valuation | 1.7 | 2.5 |
| Total net book value | 166.1 | 161 |
| Net book value at start of period [footnote 3] | 159.8 | 154.6 |
4.8.1 The consolidated results for the sector reported an increase of £8.4bn over the year in the gross book value of housing properties, to reach a total of £190.8bn at the end of March 2021. Movements during the year included.
- £7.9bn of investment in new supply
- £1.6bn worth of works to existing properties
- Stock disposals with a book value of £1.4bn
- Transfers (including transfers of engagements) from other RPs of £0.5bn less reclassifications of £0.3bn
4.8.2 Although investment in new supply for social housing properties decreased by £2.3bn (22%), this follows a peak in 2020 with many providers partaking in significant development programmes. Despite the challenges of the pandemic in 2021, levels of investment in new social housing supply remain above those seen before 2020. Investment in new properties is fairly concentrated in a small number of providers with almost 50% of investment attributable to only 20 providers.
4.8.3 Works to existing properties, which includes capitalised major repairs spend, decreased by £0.4bn (19%). Almost 70% of providers experienced a reduction in their capitalised major repairs spend. Seven providers reported a reduction in spend of over £15m compared to 2020, accounting for 40% of the overall decrease. This was driven by the periods of lockdown where property access restrictions, and supply issues in materials and labour impacted activity.
4.8.4 Transfers from other registered providers and reclassifications significantly decreased by £1.9bn (90%), due to reduced merger activity and stock transfers in the year compared to 2020. However, this included the largest stock swap recorded in the housing sector to date which took place in March 2021.
4.8.5 A total of £2.1bn was added to the sector’s cumulative depreciation and impairment balance, resulting in a net book value of £166.1bn at March 2021. This represents an increase of £6.3bn [footnote 4] (4%) during the year.
Other fixed assets and investments
Table 16: Other fixed assets
| Consolidated | Entity | |||
|---|---|---|---|---|
| £ billion | 2021 | 2020 | 2021 | 2020 |
| Tangible fixed assets: other | 2.0 | 2.0 | 1.8 | 1.9 |
| HomeBuy loans receivable | 0.6 | 0.7 | 0.6 | 0.6 |
| Intangible fixed assets and goodwill | 0.4 | 0.3 | 0.2 | 0.2 |
| Total | 3.0 | 3.0 | 2.7 | 2.7 |
4.9.1 Based on consolidated returns, other fixed assets were valued at £3.0bn, remaining in line with the previous year. This consists mainly of tangible fixed assets other than housing properties, which account for 66% of the total. This includes items such as office buildings and IT equipment.
4.9.2 At the entity level, other fixed assets total £2.7bn. Intangible fixed assets and goodwill account for 9% of the total. This includes goodwill arising on acquisition and IT software.
Table 17: Investments
| Consolidated | Entity | |||
|---|---|---|---|---|
| £ billion | 2021 | 2020 | 2021 | 2020 |
| Investment properties | 6.9 | 6.7 | 3.9 | 3.9 |
| Investment in joint ventures | 1.1 | 1.2 | 0.1 | 0.1 |
| Investment in associates | 0.1 | 0.1 | 0.0 | 0.0 |
| Investment in subsidiaries | 0.0 | 0.0 | 3.4 | 3.1 |
| Other investments | 0.5 | 0.6 | 0.6 | 0.6 |
| Total | 8.6 | 8.6 | 8.0 | 7.9 |
4.9.3 Investment in joint ventures decreased by £0.1bn (5%) to £1.1bn. A total of 48 out of 209 groups in the dataset reported investments in joint ventures, with two large providers dominating the sector accounting for 42% of the overall total. The value of investments in joint ventures is substantially lower in the entity level accounts as much of the activity is managed through non-registered entities.
4.9.4 The total value of investments in subsidiaries reported in the entity level accounts increased by £0.2bn (7%) to reach £3.4bn. Of the £0.2bn increase, almost 10% of this is attributable to the re-classification of investments between ‘investment in associates’ and ‘investment in subsidiaries’. One large provider reported investment in subsidiaries of over £1bn, accounting for 35% of the sector total.
Table 18: Investment properties
| Consolidated | Entity | |
|---|---|---|
| £ billion | 2021 | 2021 |
| Opening valuation | 6.7 | 3.9 |
| of which under construction | 0.4 | 0.3 |
| Additions | 0.3 | 0.2 |
| Transfers & reclassifications | (0.0) | (0.0) |
| Movement in fair value | 0.0 | 0.0 |
| Disposals | (0.1) | (0.1) |
| Closing valuation | 6.9 | 3.9 |
| of which under construction | 0.4 | 0.2 |
Current assets
4.10.1 Total current assets held by consolidated groups increased by £0.9bn over the year (5%), to reach £19.7bn. At entity level, an increase of £0.4bn (2%) was reported. The largest increase recorded at both group and entity level was in cash and short-term investments, which grew by £1.2bn and £0.5bn respectively.
| Consolidated | Entity | |||
|---|---|---|---|---|
| £ billion | 2021 | 2020 | 2021 | 2020 |
| Properties held for sale | 7.1 | 7.4 | 3.2 | 3.3 |
| Trade and other debtors | 2.1 | 2.1 | 1.5 | 1.7 |
| Cash and short-term investments | 8.6 | 7.4 | 7.4 | 6.9 |
| Other current assets | 2.0 | 1.9 | 8.8 | 8.6 |
| Total current assets | 19.7 | 18.8 | 20.9 | 20.5 |
4.10.2 The total value of properties held for sale is considerably higher at consolidated level (£7.1bn compared to £3.2bn in entity returns). This reflects market sale developments undertaken by unregistered entities (56% of the consolidated figure relates to market sale development, compared to just 14% in entity accounts).
4.10.3 Over 80% of the £7.1bn total relates to land and properties under construction rather than unsold completed properties. Properties held for sale are concentrated in a small number of providers; a total of 20 provider groups reported values in excess of £100m, and between them accounted for 75% of the sector total.
Table 20: Cash and short-term investments
| Consolidated | Entity | |||
|---|---|---|---|---|
| £ billion | 2021 | 2020 | 2021 | 2020 |
| Cash | 7.8 | 6.7 | 6.2 | 5.4 |
| Short-term investments | 0.8 | 0.7 | 1.2 | 1.5 |
| Total | 8.6 | 7.4 | 7.4 | 6.9 |
4.10.4 Based on consolidated returns, cash and short-term investments increased by £1.2bn (16%) to £8.6bn. Cash held by the sector increased by 17% to £7.8bn, and short-term investments increased by 7% to £0.8bn. At entity level, cash increased by 15% to £6.2bn, whilst short-term investments reduced by 20% to £1.2bn.
4.10.5 At both consolidated and entity level, the increase in cash reflects the additional debt raised during the year. A record £9.8bn of capital market facilities were agreed. Bonds and private placements typically involve a single large drawdown on issue. The number and scale of the issues in 2021 has increased the level of cash held by providers. Delays experienced in development and capitalised major repairs programmes are also a factor in increased cash balances.
Table 21: Other current assets
| Consolidated | Entity | |||
|---|---|---|---|---|
| £ billion | 2021 | 2020 | 2021 | 2020 |
| Amounts owed by group undertakings | 0.1 | 0.1 | 7.4 | 7.2 |
| Refurbishment obligations | 0.4 | 0.4 | 0.4 | 0.4 |
| Fair value of derivative financial instruments | 0.0 | 0.1 | 0.0 | 0.1 |
| Other debtors due after one year | 0.8 | 0.5 | 0.5 | 0.3 |
| Any other current assets | 0.8 | 0.7 | 0.6 | 0.6 |
| Total | 2.0 | 1.9 | 8.8 | 8.6 |
4.10.6 Amounts owed by group undertakings make up 83% of other current assets in entity level accounts. Of the £7.4bn total reported, over 75% is attributable to 15 associations reporting balances in excess of £100m. Amounts owed by group undertakings are eliminated on consolidation in group accounts. The small balance reported at consolidated level relates to groups where there is an unregistered parent.
4.10.7 Refurbishment obligations decreased by 10% at consolidated level to £0.4bn. This balance relates to cases where a provider has entered into an agreement with a local authority to undertake refurbishment on transferred stock.
4.10.8 The fair value of derivative financial instruments reduced to £38m in consolidated group accounts. This is reported by providers making use of freestanding interest rate swaps or currency hedges, where the value of the cash flows due to the provider is greater than those due to the counterparty. In 2021 returns, there were five provider groups reporting a derivative financial instrument current asset.
Other current liabilities
4.11.1 Total other current liabilities, as reported in consolidated accounts, increased by £0.2bn (4%) over the year. At entity level the increase amounted to £0.8bn (13%), largely due to a £0.5bn increase in amounts due to group undertakings which are eliminated on consolidation in group accounts.
Table 22: Other current liabilities
| Consolidated | Entity | |||
|---|---|---|---|---|
| £ billion | 2021 | 2020 | 2021 | 2020 |
| Trade creditors | 0.7 | 0.8 | 0.5 | 0.6 |
| Rent and service charges received in advance | 0.6 | 0.5 | 0.6 | 0.6 |
| Amounts owed to group undertakings | 0.0 | 0.0 | 1.8 | 1.3 |
| Recycled Capital Grant Funds and Disposal Proceeds Funds | 0.4 | 0.4 | 0.4 | 0.4 |
| Accruals and deferred income | 3.0 | 2.7 | 2.1 | 1.9 |
| Other | 1.7 | 1.7 | 1.4 | 1.3 |
| Total | 6.5 | 6.2 | 6.9 | 6.1 |
4.11.2 The largest item is accruals and deferred income, which represent 46% of the consolidated group total. Since 2020, balances have increased by 8% (£226m) in group accounts.
4.11.3 Recycled Capital Grant Funds and Disposal Proceeds Funds balances have not changed materially over the year. The majority of this balance now relates wholly to RCGF, as DPF balances were required to be utilised by 6 April 2020.
4.11.4 ‘Other’ current liabilities have remained at £1.7bn in consolidated group accounts and have increased by £0.1bn (10%) in entity accounts. This category includes various miscellaneous creditor balances, including development retention balances, grant received in advance and leaseholder sinking funds.
Debt
4.12.1 At consolidated group level, total debt held by the sector increased by £3.2bn (4%) to reach £86.3bn. In entity returns debt increased by £2.6bn (3%) to £84.3bn.
4.12.2 Quarterly Financial and Risk Survey data collected in the year to March 2021 shows that two-thirds of new finance agreed in the year was raised on the capital market with the remaining third in the form of bank loans.
| Consolidated | Entity | |||
|---|---|---|---|---|
| £ billion | 2021 | 2020 | 2021 | 2020 |
| Short-term loans | 3.6 | 2.6 | 3.2 | 2.6 |
| Long-term loans | 81.7 | 79.5 | 62.4 | 63.0 |
| Amounts owed to group undertakings | 0.3 | 0.4 | 18.1 | 15.7 |
| Finance lease obligations | 0.6 | 0.7 | 0.5 | 0.5 |
| Total | 86.3 | 83.1 | 84.3 | 81.8 |
4.12.3 There was a substantial (£1bn, 39%) increase in the amount of debt held as short-term loans in the consolidated group accounts. Over half (£2.1bn, 59%) of the total short-term debt is held by ten providers holding CCFFs at the balance sheet date. The total amount of CCFF held was £1.6bn all of which was repayable within one year.
4.12.4 At group level, long-term loans have increased by £2.2bn (3%) to reach £81.7bn. A total of 12 providers reported an increase in long-term debt of £0.1bn or more. At entity level, long-term debt has decreased by £0.5bn (1%) to £62.4bn.
4.12.5 Amounts owed to group undertakings account for 21% of total debt in the entity accounts and increased by 15% during the year to reach £18.1bn. These liabilities are mainly eliminated on consolidation in group accounts. The balance of £0.3bn disclosed at group level relates mainly to one provider with an unregistered parent.
Capital grant
4.13.1 At consolidated group level, the total capital grant reported within creditors (due within one year and after one year) has increased by £0.9bn (2%), to reach £39.0bn. The increase in the year includes the following:
- New grant totalling £1.4bn was received during the year.
- Grant of £476m was amortised and recognised in income. The majority of housing properties are held at cost with deferred capital grant being held as a creditor in the SOFP and released to income over the useful life of the asset (the accrual model).
- A net total of £156m grant was released on disposal of housing properties, which includes balances transferred to RCGF. Other movements, including transfer of grant between registered providers and reclassifications, gave a net addition of £75m grant.
Other long-term creditors
4.14.1 At consolidated group level, other long-term creditors have decreased by £0.6bn (13%) to reach £4.1bn. At entity level, a decrease of £0.4bn (11%) has been reported.
Table 24: Other long-term creditors
| Consolidated | Entity | |||
|---|---|---|---|---|
| £ billion | 2021 | 2020 | 2021 | 2020 |
| Fair value derivative financial instruments | 2.1 | 2.6 | 1.5 | 1.9 |
| HomeBuy grant | 0.3 | 0.3 | 0.3 | 0.3 |
| RCGF | 0.7 | 0.7 | 0.7 | 0.7 |
| Other | 1.0 | 1.0 | 0.8 | 0.7 |
| Total | 4.1 | 4.6 | 3.3 | 3.7 |
4.14.2 A total of 38 groups disclosed derivative financial instruments at fair value as a long-term creditor. These are mainly providers that have utilised standalone interest rate swaps to fix the interest payable on variable rate debt, or in some cases, where currency swaps have been utilised to fix the exchange rate on interest payable in a currency other than Sterling. A liability arises when the value of cash flows due to the counterparty is greater than those due to the provider. Over half of the sector total is reported by eight providers that have recognised a liability in excess of £80m.
4.14.3 The total liability reported in consolidated group accounts in respect of derivative financial instruments has decreased by £0.6bn (21%) since 2020. For most providers utilising vanilla interest rate swaps, the liability decreases as interest rates rise, and the decrease from 2020 reflects the rise in swap rates experienced over the year after falling sharply at the outbreak of the coronavirus pandemic in early 2020.
Provisions
4.15.1 The provision reported in respect of pension liabilities is covered in Note 20 Pensions.
4.15.2 Based on consolidated returns, other provisions disclosed by the sector increased by 7% to £0.9bn. Of this, £0.5bn (2020: £0.5bn) relates to obligations to undertake refurbishment work where a stock transfer provider has entered into an agreement with a local authority. Providers must report both a payment in advance (creditor) and a prepayment (debtor), the latter is reported within current assets – see Table 21: Other current assets.
Reserves
4.16.1 The total reserves within the consolidated group accounts (Table 7) increased by 3% during the year to £57.4bn (entity: 3%, £56.4bn). The majority of this relates to the annual surplus recognised in the year.
4.16.2 Reserves are not ‘cash backed’ as the surpluses transferred to the SOFP are reinstated in providers’ businesses, including major repairs of existing stock and the development of new homes.
4.16.3 Based on consolidated returns, the income and expenditure reserves increased by 4% to £46.2bn and the revaluation reserve reduced by 1% to £11.9bn. Other reserves, as reported in the SOFP (Table 8) are further broken down in Table 25 below.
Table 25: Other reserves
| Consolidated | Entity | |||
|---|---|---|---|---|
| £ billion | 2021 | 2020 | 2021 | 2020 |
| Restricted reserves | 0.2 | 0.2 | 0.1 | 0.2 |
| Cashflow hedge reserves | (1.2) | (1.5) | (1.0) | (1.2) |
| Other reserves | 0.3 | 0.5 | 0.3 | 0.5 |
| Total | (0.7) | (0.9) | (0.5) | (0.6) |
4.16.4 In most cases where providers have applied hedge accounting in respect of interest rate swaps, a negative hedge reserve is recognised. The aggregate hedge flow reserve reported by the sector increased by £0.3bn reflecting the favourable movement in valuation linked to interest rates.
Operating leases
4.17.1 The total amount of future obligations under operating leases disclosed in the financial statements has increased by £0.1bn (6%) to £2.0bn. There are four providers with operating lease commitments in excess of £100m, together accounting for 60% of the total.
Table 26: Operating leases
| Consolidated | Entity | |||
|---|---|---|---|---|
| £ billion | 2021 | 2020 | 2021 | 2020 |
| Amounts payable not later than one year | 0.2 | 0.2 | 0.2 | 0.2 |
| Amounts payable between one and five years | 0.5 | 0.5 | 0.5 | 0.5 |
| Amounts payable later than five years | 1.3 | 1.2 | 1.2 | 1.2 |
| Total | 2.0 | 1.9 | 1.9 | 1.8 |
4.17.2 Two providers operating a lease-based business model together account for 30% (£0.6bn) of the total lease obligations.
Capital commitments
4.18.1 As a note to published accounts, providers must disclose the value of contracts for capital expenditure that are not provided for in the primary financial statements. In addition, they must also disclose the value of capital expenditure that has been approved by the board but not contracted for.
Table 27: Capital commitments
| Consolidated | Entity | |||
|---|---|---|---|---|
| £ billion | 2021 | 2020 | 2021 | 2020 |
| Expenditure contracted but not accounted for | 20.8 | 19.4 | 16.8 | 15.3 |
| Expenditure approved but not contracted for | 17.9 | 17.5 | 13.7 | 13.1 |
| Total | 38.7 | 36.8 | 30.5 | 28.4 |
4.18.2 Based on consolidated returns, future capital expenditure contracted for has increased by 7% to £20.8bn. The value of capital expenditure approved but not yet contracted for has increased by 3% to £17.9bn.
4.18.3 Future capital expenditure commitments are concentrated in several large provider groups. Eleven providers disclosed capital commitments in excess of £750m each, together these accounted for 46% of the £38.7bn total.
4.18.4 The Annex below summarises the latest financial forecasts submitted by providers. This includes analysis of projected investment in new and existing supply.
Units
Table 28: Social housing units owned
| Unit numbers (‘000s) | Consolidated | Entity |
|---|---|---|
| 2020 closing units owned | 2,717 | 2,682 |
| Restatements | (12) | (14) |
| Opening units owned | 2,706 | 2,668 |
| Units developed | 40 | 39 |
| Units sold / demolished | (13) | (13) |
| Transfers | 9 | 12 |
| Other movements | (5) | (6) |
| Closing units owned | 2,736 | 2,701 |
| Units managed but not owned | 53 | 72 |
| Units managed and / or owned | 2,789 | 2,773 |
4.19.1 The number of social units developed decreased from 49,000 in 2020 to 40,000 in 2020. Based on consolidated returns, the total number of units owned increased by 19,000 (1%) to 2,736,000. The number owned based on entity returns is slightly lower. For a small number of providers, the consolidated returns include entities operating outside of England.
4.19.2 In total, providers also reported a further 53,000 social units which they manage on behalf of another organisation but do not own. These units are concentrated in a small number of providers, with the top ten accounting for 56% of the total.
4.19.3 Restatements between the 2020 and 2021 returns include some reclassifications between social and non-social stock. However, restatements are mainly the result of merger activity where units included in the 2020 closing total are not shown in the 2021 opening total. Where this is the case the units will instead be included in the ‘transfers’ line of the acquiring provider following the completion of the merger.
Table 29: Non-social housing units owned and managed
| Unit numbers (‘000s) | Consolidated | Entity |
|---|---|---|
| 2020 closing units | 94 | 46 |
| Restatements | 1 | 2 |
| Opening units | 95 | 48 |
| Units developed | 2 | 1 |
| Units sold / demolished and other | (1) | (1) |
| Transfers and other movements | (1) | (2) |
| Closing units | 94 | 46 |
4.19.4 The number of non-social homes owned or managed in consolidated returns is greater than that included in entity returns. This reflects the extent to which non-social housing activity is delivered within non-registered entities within group structures.
4.19.5 Based on consolidated returns, 1,500 new non-social rent units were developed or acquired in the year. Excluding restatements, the total number of non-social homes owned by the sector remained at 94,000. Around 40% of total non-social units are managed on behalf of another organisation.
4.19.6 In addition to the note on non-social housing units, the FVA return includes disclosures relating to the number of outright sale units developed and sold. Based on consolidated returns, 4,300 new outright sale units were completed in the year. In total 59 providers reported outright sale development activity with 13 completing more than 100 units and accounting for 72% of the total.
Pensions
4.20.1 Actuarial gains and losses on pension schemes fluctuate year on year. In 2021, based on consolidated returns, an overall actuarial loss of £1.4bn was reported. This is a reverse of a £1.1bn gain recognised in 2020. The actuarial loss is reflected by the movement in total pension provision for liabilities, which has increased by £1.3bn (63%) to £3.4bn (2020: £2.1bn).
4.20.2 The change in provision and associated gain or loss in terms of defined benefit schemes is reported in other comprehensive income and arises as a result of movements in underlying actuarial assumptions and changes in the value of plan assets. These include projected changes in inflation, the rate of increase in the level of pensions paid, future salary increases, a discount rate linked to gilts, and mortality assumptions in relation to how long a pension is expected to be paid.
4.20.3 In 2021 the actuarial loss on pension schemes is a result of changes to underlying financial assumptions. This was driven by market disruption due to the effects of the pandemic, including volatility in yields, lower discount rates and high future inflation and salary projections.
5. Annex – Financial forecasts
5.1 This section of the report provides an overview of data submitted to the regulator in relation to providers’ current business plans.
Background
5.2 Financial forecast returns (FFRs) are collected from all private registered providers owning and/or managing more than 1,000 units. The returns set out the financial elements of providers’ business plans in a standardised form and include 30 year [footnote 5] projections of the key financial statements plus further details of development plans and the key financial assumptions used.
Context
5.3 The data in this report is based on the 203 FFRs submitted in June 2021 and focusses on the first five years of the plans, that is the period from April 2021 to March 2026. It also draws on the submissions from previous years to identify some of the key changes in this round of forecasts. Business plans are considered commercially sensitive and therefore the dis-aggregated data source will not be made publicly available.
5.4 Providers’ business plans represent their view of a range of key factors at a given point in time. As such there can be substantial changes made to forecasts between years.
5.5 The 2020 forecasts saw some marked changes as providers responded to the initial impacts of the coronavirus pandemic [footnote 6]. The latest forecasts generally represent a consolidation of this position. There remain several key factors impacting providers’ business plans that are likely to lead to further changes. These include:
- Longer term impact of the coronavirus pandemic
- Wider economic conditions including supply-chain disruption and cost inflation
- Changes to interest rate forecasts
- Developing detailed understanding of the investment requirements for existing stock in relation to:
- Building and fire safety
- Decent homes
- Energy efficiency and decarbonisation
Financial Statements
5.6 At an aggregate level, the sector continues to forecast surpluses as set out in Table 30 below.
Table 30: Headline SOCI (FFR 2021)
| £ billion | 2022 (FY1) | 2023 (FY2) | 2024 (FY3) | 2025 (FY4) | 2026 (FY5) |
|---|---|---|---|---|---|
| Turnover | 23.3 | 24.9 | 26.4 | 27.6 | 28.7 |
| Operating costs | (18.1) | (19.0) | (19.8) | (20.5) | (21.1) |
| Operating surplus | 5.2 | 6.0 | 6.6 | 7.1 | 7.6 |
| Surplus on fixed asset sales | 0.8 | 0.8 | 0.8 | 0.8 | 0.8 |
| Net interest costs | (3.2) | (3.1) | (3.3) | (3.5) | (3.7) |
| Other items | 0.1 | 0.2 | 0.2 | 0.2 | 0.2 |
| Surplus for the year | 2.9 | 3.9 | 4.3 | 4.6 | 4.9 |
5.7 Over the first five forecast years, the total operating surplus is forecast to be £32bn. This is an increase of £1.5bn (5%) in comparison to the first five years of the 2020 forecasts. As illustrated in Figure 11 below, the surplus is forecast to increase year on year during this period. Total surplus (after fixed asset sales and finance costs) shows a 7% increase over the first five forecast years.
Figure 11: Five-year operating surplus forecasts
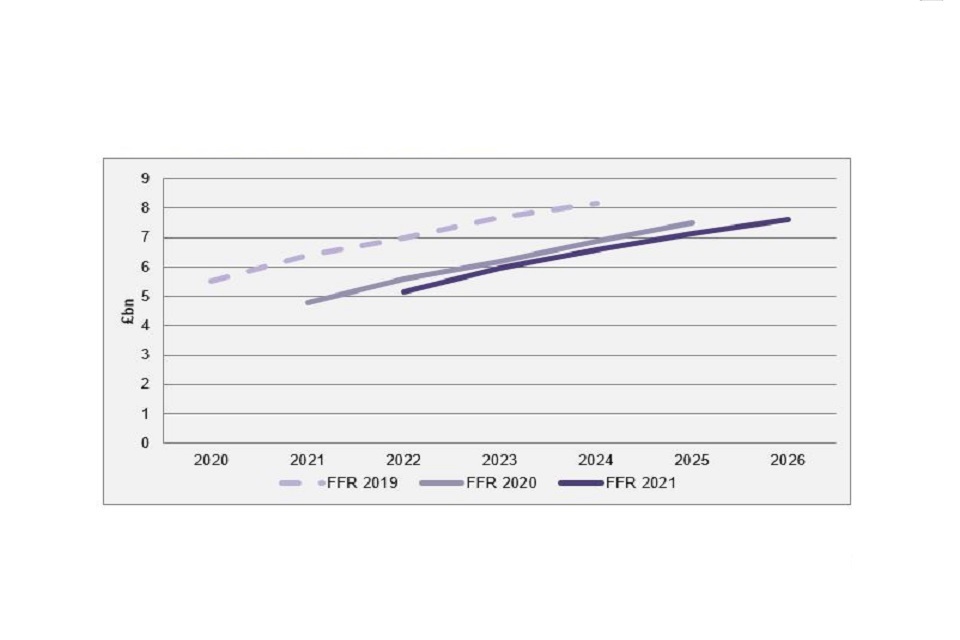
Graph showing five-year operating surplus forecasts
5.8 Table 31 shows the forecast growth in the sector’s balance sheet. Total sector assets are forecast to reach £251bn representing an increase of 28% on the 2021 outturn. This reflects the impact of both the sector’s development programme and increased capitalised spending on existing stock in adding to the total valuation of housing properties.
Table 31: Headline Statement of Financial Position (FFR 2021)
| £ billion | 2022 (FY1) | 2023 (FY2) | 2024 (FY3) | 2025 (FY4) | 2026 (FY5) |
|---|---|---|---|---|---|
| Social housing properties [footnote 7] | 176.1 | 188.4 | 199.8 | 211.2 | 222.1 |
| Investments | 9.3 | 9.3 | 9.4 | 9.4 | 9.5 |
| Cash | 5.4 | 4.3 | 4.2 | 3.7 | 3.8 |
| Other assets | 15.5 | 15.8 | 15.9 | 15.8 | 15.2 |
| Total assets | 206.3 | 217.9 | 229.4 | 240.1 | 250.7 |
| Debt | 91 | 98 | 104.5 | 109.5 | 114.2 |
| Grant | 40.5 | 41.5 | 42.5 | 43.6 | 44.7 |
| Other creditors | 13.2 | 12.8 | 12.5 | 12.3 | 12.1 |
| Reserves | 61.6 | 65.6 | 70 | 74.7 | 79.7 |
| Total creditors and reserves | 206.3 | 217.9 | 229.4 | 240.1 | 250.7 |
5.9 The sector is continuing to invest in its fixed asset base with housing properties forecast to reach a balance sheet value of £222bn by 2026. As illustrated in Figure 12 below, there is a slight (1.3%) reduction in the 2022 valuation compared to the previous forecasts. This reflects delays to development plans and is quickly recovered in the subsequent years, exceeding previous forecasts by 2024.
Figure 12: Five-year valuation of social housing properties forecasts
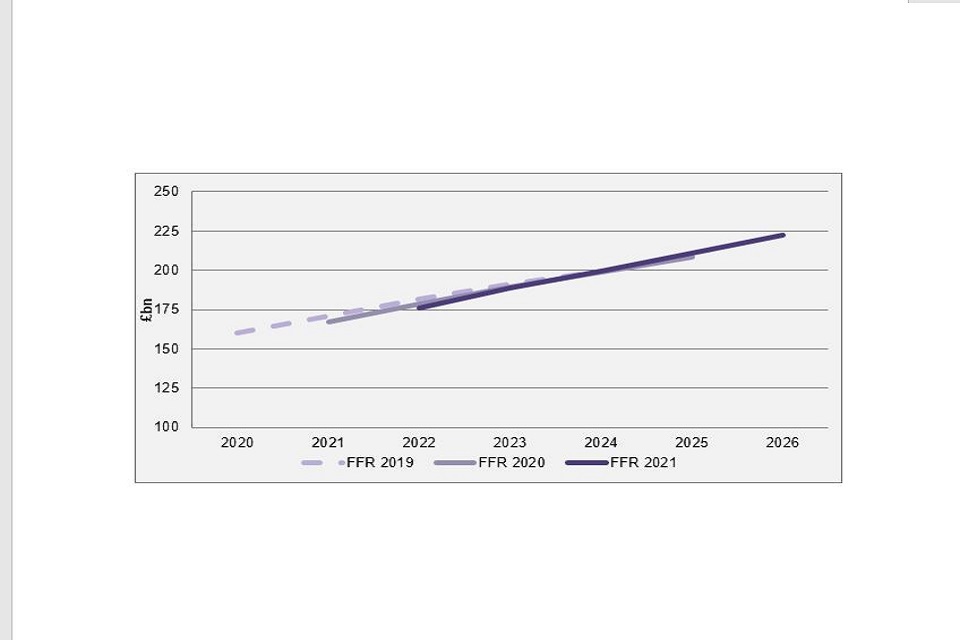
Graph showing Five-year valuation of social housing properties forecasts
5.10 By 2026, total debt is forecast to increase by £29bn (35%) to reach £114bn. This is an increase of £6bn (5%) from what was anticipated in the 2020 forecasts. Over the same period grant will increase by £5bn (14%) to reach £45bn, a 5% increase on the 2020 forecast. Interest cover
5.11 Changes to business plans in recent years have resulted in a weakening of forecast interest cover as illustrated in Figure 13 below. The 2021 forecasts show interest cover tracking around ten percentage points below the previous forecasts. This reflects tightening margins and increased debt which is partially mitigated by a lower EIR.
Figure 13: Five-year EBITDA MRI interest cover forecasts
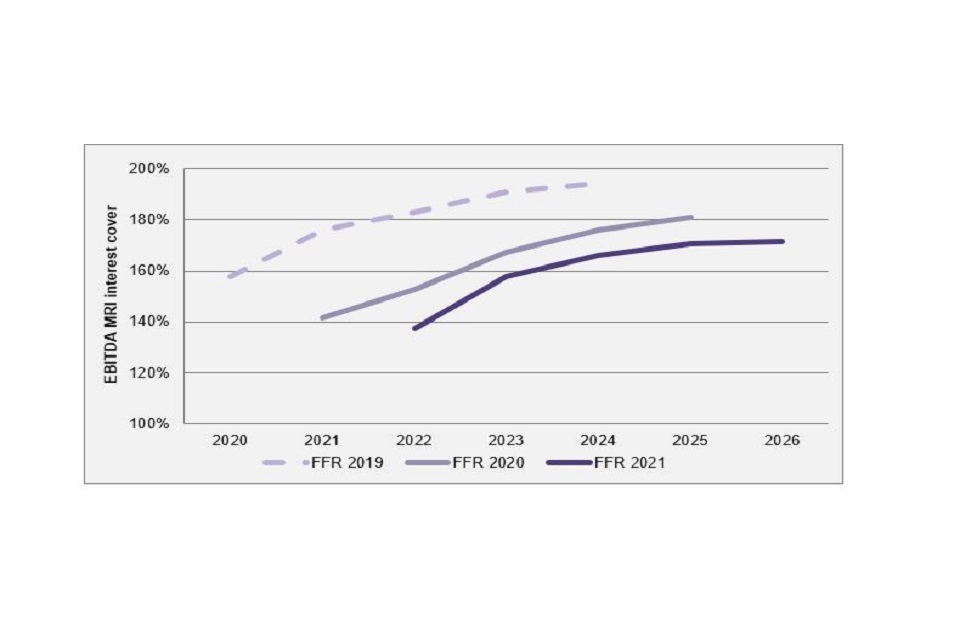
Graph showing Five-year EBITDA MRI interest cover forecasts
5.12 In general, the position represents a consolidation of the shift that was seen in the 2020 returns. Further forecast increases in expenditure on maintenance and major repairs lead to a tightening of operating margins and increased indebtedness.
5.13 Although projected levels of interest cover have decreased, in aggregate the sector continues to exhibit strong interest cover with EBITDA MRI [footnote 8] Interest Cover of 161% for forecast years 1 to 5 with the metric strengthening year on year within that period.
Development
5.14 The sector is forecasting completion of 378,000 additional housing units over the first five years of the business plans. Of these, 224,000 (59%) are for rent at sub-market rates and a further 110,000 (29%) are for LCHO.
5.15 Overall, this represents a 6% increase in development activity in comparison to the previous forecasts, returning to a similar total to that seen in the 2019 forecasts (Figure 14). The mix of development is broadly the same as last year reflecting a sustained shift away from outright sale and market rental, and towards sub-market rental in comparison to earlier forecasts.
Figure 14: Five-year development forecasts (units – thousands)
| Date | Sub-market rental | LCHO | Outright sale | Non-social rent | Total |
|---|---|---|---|---|---|
| FFR 2019 | 206 | 113 | 51 | 11 | 381 |
| FFR 2020 | 209 | 105 | 36 | 7 | 357 |
| FFR 2021 | 224 | 110 | 39 | 5 | 378 |
5.16 Forecast development spend over the first five years of plans has increased by £7.5bn (10%) to £81.7bn of which 29% was contractually committed at the time these forecasts were developed. The proportion of this development to be funded by sales income has further decreased to 41% whilst funding from debt has increased to 36% and grant to 10%. The launch of Homes England’s latest Affordable Homes Programme will have influenced the latest forecasts.
5.17 The development profile across the first five forecast years is flatter than seen in previous forecasts which have typically peaked in years 2 and 3. The changing economic picture in the period since these forecasts were developed, in particular supply-chain pressures and associated cost inflation, may result in further changes to development plans in the next round of forecasts.
Maintenance and major repairs
5.18 Forecast expenditure on maintenance and major repairs shows a further increase in the latest set of forecasts as illustrated in Figure 15. Total expenditure over the first five forecast years is £35.1bn which is a 12.5% increase in comparison to the previous set of forecasts. As noted above, this additional expenditure impacts on operating margins contributing to the reduction in interest cover.
5.19 An additional disclosure within the returns this year identified that £3.5bn (10%) of the total maintenance and major repairs spend in the first five forecast years will be specifically addressing building and fire safety costs. This spend is heavily concentrated amongst a small number of providers with ten accounting for 46% of the total spend.
Figure 15: Five-year maintenance and major repairs expenditure forecasts
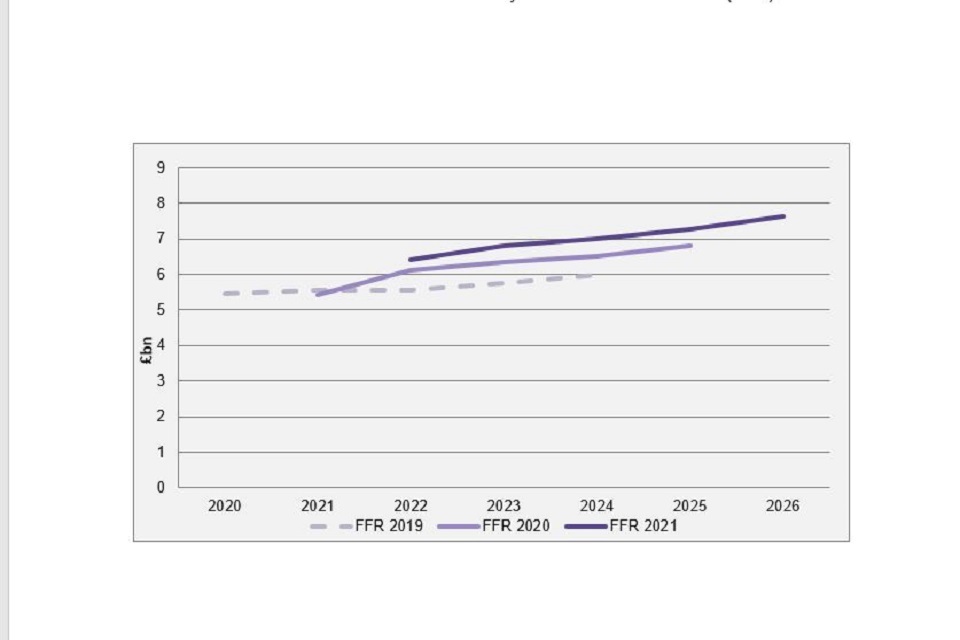
Graph showing Five-year maintenance and major repairs expenditure forecasts
5.20 Analysis has been undertaken of provider’s business plans to assess the extent to which energy efficiency improvements and decarbonisation works have been incorporated into financial forecasts. Broadly speaking, providers are working towards achieving a minimum Energy Performance Certificate rating of ‘C’ across their stock by 2030 and have included the associated estimated costs within their business plans. Costs and timescales for achieving net-zero are less fully developed and it is likely that a large proportion of providers will need to add these costs into future business plans.
Increase in debt
5.21 The amount of debt required to fund business plans has increased. As noted above, total debt is set to reach £114bn by 2026 representing a 5% increase in comparison to the previous set of forecasts. Including re-financing activity, the £29bn increase in debt will require providers to arrange a total of £45bn of new facilities over the first five years of plans (up from £39bn in the 2020 forecasts). The ratio of debt to turnover has increased from c.3.6 in the 2019 business plans to 4 as illustrated in Figure 16.
Figure 16: Five-year debt to turnover forecasts
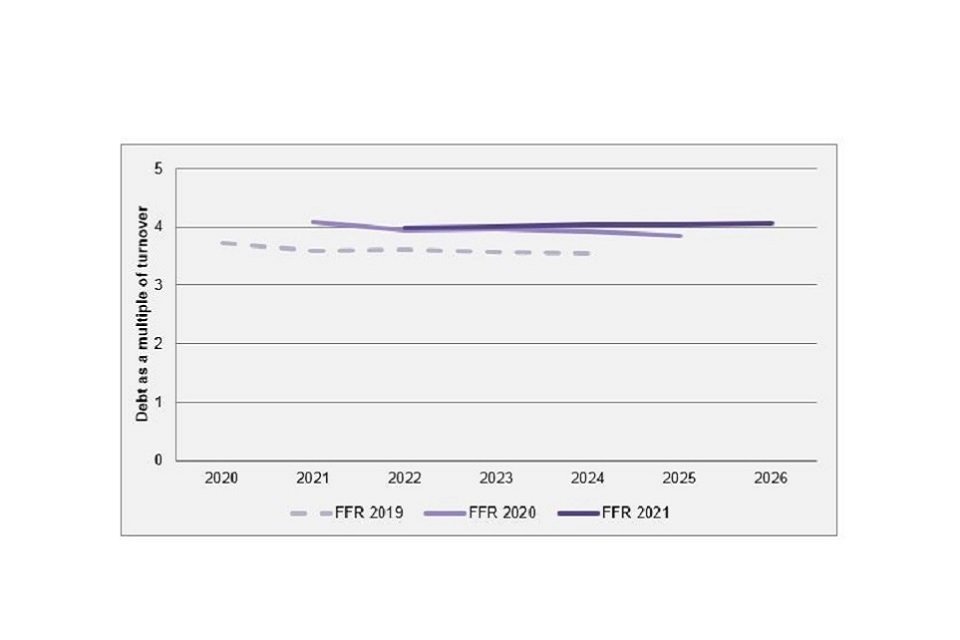
Graph showing Five-year debt to turnover forecasts
5.22 Peak debt (net of cash and short-term investments) is set to be £117bn, up from £106bn in the 2020 plans, and is forecast to be reached in 2029. The notional repayment date for debt in the current plans is 2047, three years later than in the previous set of forecasts.
5.23 The impact of the additional borrowing is mitigated by a reduction in the EIR which at 3.8% over the first five forecast years of plans is 0.2% lower than in the 2020 forecasts and 0.6% lower than in 2019. This reflects historically low interest rates with forecasts based on the assumption that new facilities can be raised at interest rates between 2% and 3%.
Conclusions
5.24 The latest forecasts show a marked contrast to this years Global Accounts, in which providers reported higher margins and interest cover as a result of the reduction in spending on both existing stock and development. The 2021 results were dominated by the disruptive impact of the coronavirus pandemic in that year.
5.25 The forecasts include increased investment in existing stock, which reflects both catch-up spending following the pandemic and the incorporation of additional costs associated with building safety and carbon reduction. This leads to tighter margins and an increased reliance on debt to fund both new development and investment in existing stock. The availability of new finance at historically low rates continues to support the sector’s business plans.
5.26 In many respects, the latest forecasts show a consolidation of the picture that was presented in 2020. Development plans have recovered to levels seen in the 2019 forecasts although a change in the mix shows an increased emphasis on sub-market rental properties.
5.27 The economic environment continues to be uncertain and developments since these plans were produced seem likely to lead to a period of higher cost inflation, particularly within the construction sector. In addition, it is likely that the full costs of decarbonisation have not yet been reflected in forecasts. This could lead to changes in development plans or a weakening to the sector’s financial profile in the next round of forecasts.
5.28 Within this context, our view is that the sector as a whole remains viable and exhibits a robust liquidity position. However, providers are expected to manage their resources and risks effectively to ensure that their viability is maintained. The regulator will continue to follow up cases where financial indicators are weak to ensure that providers are managing their risks effectively.
-
As public benefit entities, combinations between providers which cannot be classified as a merger are treated either as ‘combinations that are in substance a gift’ or as ‘acquisitions’. The acquiring provider is required to recognise the fair value of the transferring provider in the Statement of Comprehensive Income ↩
-
Includes mergers where the acquisition method is used and the units are transferred/acquired during the year. ↩
-
The net book value at the start of the period has been restated based on FVA returns submitted in 2021. The net book value on restatement excludes the value of housing properties transferred in the year where business combinations are accounted for using the acquisition method, and includes the value of housing properties reported by providers completing the FVA for the first time in 2021. The NBV of housing properties reported in the 2020 Global Accounts was £160.3bn based on consolidated returns (£155.3bn based on entity returns). ↩
-
Based on the restated net book value at the start of the period from FVA returns submitted in 2021. ↩
-
Four providers without substantial development plans submitted 5-year forecasts in 2021. ↩
-
Submission of the 2020 forecasts was delayed from June to September allowing initial adjustments to business plans. ↩
-
Social housing properties = the net book value of social housing fixed assets. Investment properties are included within ‘investments’ and properties held for sale are included within ‘other assets’. ↩
-
Earnings Before Interest Taxation Depreciation and Amortisation, Major Repairs Included. This is a key measure of a provider’s ability to cover finance costs from operating income. Low levels of interest cover using this measure may not be an issue in the short-term where significant repair and improvement activity is being undertaken. Loan covenants specifying interest cover vary significantly and will often exclude capitalised major repairs. ↩