Global accounts 2020
Updated 13 May 2021
Applies to England

© Crown copyright 2021
This publication is licensed under the terms of the Open Government Licence v3.0 except where otherwise stated. To view this licence, visit nationalarchives.gov.uk/doc/open-government-licence/version/3 or write to the Information Policy Team, The National Archives, Kew, London TW9 4DU, or email: psi@nationalarchives.gov.uk.
Where we have identified any third party copyright information you will need to obtain permission from the copyright holders concerned.
This publication is available at https://www.gov.uk/government/publications/2020-global-accounts-of-private-registered-providers/global-accounts-2020
Executive summary
The Global Accounts cover the year up to the end of March 2020. Coronavirus restrictions were introduced just before the end of the reporting period. This publication demonstrates private registered providers (referred to as providers in this document) continuing investment in new and existing social housing.
In the year to March 2020, investment in new supply was higher than the previous year. The sector invested £13.7bn in new supply, a 13% increase. This is driven by an increase in spend on new social housing properties for rent. The sector developed 49,000 social homes in 2020, 4,000 more than the previous year.
In addition to this, total spending on repairs and maintenance of social housing stock was £5.7bn, up from £5.4bn in 2019. Providers continued to deliver required fire safety remedial works in the year. The sector is also responding to reforms of the building safety regulatory system, proposals for which were first published in June 2019.
This investment was funded by operating surpluses, debt and grant funding. Debt increased by £6.2bn in the year to £83.1bn. Housing assets are worth £174.4bn on the balance sheet, an increase of £10.4bn on 2019. The sector remains committed to future growth, raising £10.4bn of new facilities from banks and capital markets. In total, the sector had access to £28.1bn of undrawn debt facilities and cash at March 2020. The sector had future capital commitments of £36.8bn (a 12% increase on 2019) of which £19.4bn had been contracted.
This investment was underpinned by robust financial performance. However, the ‘underlying surplus’ (excluding movements in fair value) decreased for the second year in a row, falling by £0.3bn to £2.7bn. The reason for this reduction in surplus was a decrease in profitability, primarily in core social housing rental activities, but also to a lesser extent in sales.
The period to March 2020 was the fourth and final year of 1% rent reductions on general needs social housing properties. Consequently, for the fourth year in a row there was no significant increase in income generated from social housing lettings. Costs have continued to rise over this period which has seen the operating margin from social housing lettings decrease from 34% in 2017 to 28% in 2020. A 5% increase in costs in 2020 was influenced by upward pressure from health and safety compliance costs. The operating surplus from this core activity fell by £0.3bn to £4.4bn.
The profitability of both first tranche shared ownership sales and outright market sales decreased. This meant that although the value of sales receipts increased marginally, the contribution from these activities fell by 12% to £0.5bn. The surplus on sale of rental properties (fixed assets) increased by £0.2bn to £1bn, partially attributable to an increase in sales to tenants through Right to Buy and Right to Acquire.
The reductions in operating margins across both rental and other activities caused a 15% reduction in EBITDA MRI interest cover to 138% . This is the second consecutive year in which levels of interest cover have fallen.
The impact of coronavirus on the 2020 Global Accounts is limited. The first national lockdown was introduced in the last week of the financial reporting period. However, subsequent events have been dominated by the response to the pandemic. There remains a degree of uncertainty over the long-term impacts to the operating environment.
The period following the 2020 Global Accounts has also seen the publication of the Social Housing White Paper. Providers are beginning to adapt to the changes set out in the White Paper, which amongst other things, is likely to mean increased investment in existing stock linked to the decarbonisation and building safety requirements.
Despite the challenges in the period following the 2020 Global Accounts, the sector remains viable and liquidity robust. Throughout this period RSH continued to monitor providers and engage where financial viability indicators were weaker. The latest financial forecasts (summarised in the Annex) show continued lower operating margins and a reliance on debt to fund new development and investment in existing stock. It is expected that providers continue to manage their resources and risks effectively to ensure that their financial viability is maintained.
1. Introduction
1.1 The 2020 Global Accounts of registered providers provides a financial overview of the social housing sector based on an analysis of the regulatory returns of private registered providers. This publication excludes social housing stock held by local authorities. Within this publication, private registered providers of social housing (primarily housing associations) are referred to as providers.
1.2 The social housing sector is diverse in both the size of providers that operate within it and the range of activities each undertakes. In total, there are around 1,400 active providers, of which the majority have fewer than 1,000 homes. This publication is concerned with the financial analysis of large providers which own or manage at least 1,000 social homes, together representing more than 95% of the sector’s stock.
1.3 The provision of homes for rent is the main activity. Many also provide homes for ownership, either on a shared ownership basis or for outright sale, thereby generating income from the sale of homes. This activity exposes providers to a different risk profile to that for traditional renting and has changed the financial profile of several providers.
1.4 Most large providers are part of a group structure; these can include multiple registered providers and non-registered entities. The development of properties for outright sale and other non-social housing activity is often delivered by non-registered entities or joint ventures within group structures. This leads to differences between the accounts prepared by registered entities (entity level) and those prepared on a consolidated group basis (consolidated level). This publication presents results both at consolidated and entity level.
1.5 Further differences exist between providers in the degree to which they provide specialist housing. Whilst most providers have some supported housing or housing for older people, there are a small but significant number of primarily specialist providers. These providers face additional challenges in securing care and support contracts from local authorities and other public bodies. A sub-set of supported housing providers operate a lease-based business model. These providers comprise a small part of the sector. The total value of social housing operating leases within these providers is around £0.5bn. The vast majority of providers are designated as not-for-profit. This is the first year that the Global Accounts dataset includes the results of one for-profit provider which now holds more than 1,000 units.
1.6 A financial review of 2019/20 Global Accounts is presented in Part 1. Part 2 comprises the aggregate financial statements. Part 3 contains notes to the primary statements showing further detail of key entries and balances. In this year’s publication an Annex has been added, analysing providers’ financial forecasts. This includes a comparison of this year’s projections against those submitted in previous years.
2. Financial Review
Operating environment
2.1 The economic operating environment in relation to the core lettings business was stable in the year.
2.2 Consumer Price Index inflation fell by 0.4% to 1.5% in the year to March 2020 ONS Statistical Bulletin: UK consumer price inflation - March 2020. Inflation peaked in April and July at 2.1% prior to the decline. Average weekly wages increased by 3.2% the 12-month period covered by the Global Accounts UK labour market Office for National Statistics - May 2020.
2.3 The year ending March 2020 was the final year of 1% rent reductions on general needs social housing, and most supported housing properties. From April 2020 social housing rent increases will be limited to the CPI plus 1% for five years.
2.4 Although rents have not risen, costs and expenditure have continued to increase resulting in lower social housing margins. Since the fire at Grenfell Tower in 2017, providers have been active in addressing building safety risks and undertaking remedial works on properties. In June 2019 the government published the ‘Building a Safer Future’ consultation. This set out draft proposals for a new building safety regime and the commitment to establishing a new Building Safety Regulator was announced in January 2020.
2.5 More than one third of sector surpluses were generated through sales. Average house prices in England during the period covered by the Global accounts increased by 2.2%UK House Price Index - March 2020, HM Land Registry. However, the number of residential transactions in the year decreased by 1% compared to 2019 Property transactions completed in the UK with value 40000 or above, Office for National Statistics. There are also notable regional variations in housing market performance. In London annual house price growth was 4.7% whereas in Yorkshire and the Humber, prices fell by 1.0% over the year to March 2020. Across the UK, average construction costs on new properties increased by 0.3% over the same period Construction output price indices - Office for National Statistics.
2.6 The development of properties for sale remains concentrated in a small number of providers. Just over 85% of turnover from properties developed for outright sale is reported by 20 provider groups. These tend to be larger organisations operating in higher value market areas. Exposure to the housing market is a key risk for these providers to manage.
2.7 Providers are primarily debt funded and fix interest rates (for more than one year) on more than 75% of all borrowing . The sector agreed £10.4bn of new facilities in the year, within this capital market funding accounted for £4.1bn. The sector continues to access record levels of debt with new facilities supporting future investment and refinancing.
2.8 The coronavirus outbreak was declared a global pandemic by the World Health Organisation on 11 March. Shortly before the end of the reporting year the UK was put into lockdown on 23 March. As the lockdown impacted in the last week of the 2019/20 financial accounts, there is limited impact on the financial results summarised in this publication.
2.9 However, coronavirus did have an immediate impact upon the housing market. As reported in the Quarterly Survey, current asset sales in the final quarter of 2019/20 were below forecast as restrictions began to impact on the housing market.
2.10 The Bank of England base rate had been at 0.75% since August 2018. In light of the expected economic impact of coronavirus the BOE cut interest rates on 11 March to 0.25%, and in a further emergency response the base rate was reduced for a second time on 19 March to 0.1%, where it has stayed since. The three-month London Interbank Offered Rate also decreased over the year, from 0.84% to 0.60%.
2.11 Interest rates are significantly below the long-term average, a 2% increase in LIBOR could theoretically increase interest costs of variable rate financing by approximately £500m per year. It is therefore essential that providers effectively manage interest rate risk and plan for any interest rate increases in the future.
2.12 The period following the financial results summarised in this document has been dominated by the ongoing response to coronavirus. This has included three separate periods of national lockdown. RSH has continued to engage with providers over this period through the Quarterly Survey and the Coronavirus Operational Response Survey. The financial performance of the sector has reflected some of the challenges arising from the pandemic and subsequent restrictions. However, this has not destabilised the sector’s overall strong financial position.
2.13 To help ease the regulatory burden on providers during this period the deadline for submission of annual accounts and the Annual Account Regulatory Returns (known as the FVA) regulatory return was extended by three months to 31 December 2020. In turn, this has resulted in the later than usual publication of the Global Accounts.
Financial highlights
Investment
2.14 Total investment in new or existing properties, including social housing properties, properties developed for sale and investment properties, was £15.6bn. This is an increase of 11% on spend of £14.0bn in 2019 and the highest level since we began collecting data in this format.
2.15 Total investment in new or existing social housing properties for rent was £12.2bn (2019: £9.6bn).
2.16 Investment attributable to the development of new social housing properties increased significantly from £7.7bn in 2019 to £10.2bn in 2020. More than half of the investment in new social housing properties is concentrated in 20 providers with significant development programmes.
2.17 Capital investment in major repairs to existing properties also increased marginally and totalled £1.9bn in the year. Including spend on repairs and maintenance recognised in the Statement of Comprehensive Income, total investment in existing social housing stock was £5.7bn, up from £5.4bn in 2019.
Figure 1: Investment in social housing properties (consolidated)
| Year | Capitalised Major Repairs (£bn) | Spend on new properties (£bn) | Total (£bn) |
|---|---|---|---|
| 2018 | 1.7 | 7.3 | 9.0 |
| 2019 | 1.9 | 7.7 | 9.6 |
| 2020 | 1.9 | 10.2 | 12.2 |
2.18 In aggregate, 49,000 social housing properties for rent were completed in the year – an increase on the 45,000 units developed in 2019. The value of properties not yet completed (under construction) increased by £2.6bn to £11.2bn in 2020. In the course of the year around 15,000 social housing homes were sold or demolished. The total number of homes owned by providers increased by 1% to 2,717,000.
2.19 The £12.2bn spend identified above relates only to investment on social housing properties held for rent. This figure does not include the investment on properties developed for sale and for market rent set out below.
- In 2020, investment in properties developed for outright sale and the expected first tranche element of shared ownership properties was £3.0bn (2019: £3.9bn). The decrease in investment in for-sale tenures is in contrast to the increase in investment in social rental tenures.
- Properties held for market rent and other properties held for a non-social housing purpose are categorised as investment properties. Investment in the development of such new properties was £0.5bn (2019: £0.5bn).
2.20 The total value of housing assets held by the sector increased by £10.4bn to £174.4bn. This includes £160.3bn of social housing properties held for rent, £6.7bn of investment properties (predominantly market rent) and £7.4bn of properties held for sale (mainly land and properties under construction).
Debt and funding
2.21 The investment in existing properties and new supply was primarily funded through operating surpluses, debt and capital grant. Total debt in the sector increased by £6.2bn (8%) to £83.1bn. This was greater than the increase reported in 2019 of £4.4bn.
Figure 2: Total debt (consolidated)
| Year | Total (£bn) |
|---|---|
| 2018 | 72.5 |
| 2019 | 76.9 |
| 2020 | 83.1 |
2.22 The majority of existing debt is in the form of bank loans (59% of all facilities as at 31st March 2020) -Quarterly Survey. Including refinancing, in the year to March 2020 the sector agreed new facilities of £10.4bn (2019: £13.5bn, 2018: £10.1bn).
2.23 New bank lending of £5.9bn was arranged in the year (2019: £6.5bn). Funds from capital markets raised a combined £4.1bn (2019: £6.7bn, 2018: £4.9bn) with 38 providers taking out bond issues or private placements in the year (2019: 42, 2018: 48).
2.24 New grant totalling £1.7bn was received during the year. At March 2020, total capital grant recognised on the balance sheet was £38.1bn a 3% increase on 2019.
Table 1: Indebtedness metrics
| Consolidated | Entity | |||
|---|---|---|---|---|
| 2020 | 2019 | 2020 | 2019 | |
| Gearing (debt as % of social housing assets) | 52% | 51% | 53% | 51% |
| Debt to turnover | 4.0 | 3.8 | 4.3 | 4.1 |
| Debt per unit £ per social housing unit | 29,987 | 28, 138 | 26,679 | 27,703 |
2.25 The increase in debt of 8% is mirrored by a 7% increase in the net book value of social housing assets following the significant level of investment in the year. As a result, gearing based on debt as a proportion of assets has only increased slightly.
2.26 The ratio of debt to turnover has increased by 6% as the final year of the rent reduction has held back growth in income. Debt per unit has increased by 7% as, net of demolitions and sales, the number of social housing properties owned has increased by only 1%.
Figure 3: Gearing (asset valuation) and debt to turnover (consolidated)
| Year | Gearing (asset valuation) | Debt to turnover |
|---|---|---|
| 2018 | 50% | 3.6 |
| 2019 | 51% | 3.8 |
| 2020 | 52% | 4.0 |
Financial performance
Table 2: Summary of income statement
| Consolidated | Entity | |||
|---|---|---|---|---|
| £billion | 2020 | 2019 | 2020 | 2019 |
| Turnover | 21.2 | 20.9 | 19.4 | 18.7 |
| Total operating costs | (16.5) | (15.6) | (14.6) | (13.8) |
| Operating surplus | 4.7 | 5.2 | 4.8 | 4.9 |
| Net interest payable | (3.1) | (3.1) | (2.9) | (3.0) |
| Surplus on sale of fixed assets | 1.0 | 0.9 | 1.1 | 0.9 |
| Other items | 0.8 | 0.5 | (0.1) | 3.5 |
| Surplus for the year | 3.5 | 3.5 | 2.8 | 3. 5 |
Table 3: Operating margins
| Consolidated | Entity | |||
|---|---|---|---|---|
| % | 2020 | 2019 | 2020 | 2019 |
| Operating margin | 22% | 25% | 25% | 26% |
| Operating margin on social housing lettings | 28% | 30% | 27% | 30% |
| Operating margin on 1st tranche sales | 20% | 25% | 20% | 25% |
| Operating margin on outright sale | 10% | 13% | 9% | 13% |
Surplus
2.27 The surplus reported in 2020 was £3.5bn, consistent with the 2019 figure. The net margin decreased from 16.6% in 2019 to 16.5% in 2020. The figure below highlights the key drivers behind the surplus.
Factor 4: Factors impacting the surplus (consolidated)
| Factor | Total | Surplus/decrease/increase |
|---|---|---|
| Surplus 2019 | £3.5bn | surplus |
| Decrease in operating surplus | £0.5bn | decrease |
| Revaluation movements | £0.3bn | decrease |
| Increase in gain on business combinations | £0.7bn | increase |
| Increase in gain on FA sales | £0.2bn | increase |
| Surplus 2020 | £3.5bn | surplus |
2.28 The surplus is impacted by non-operating valuation adjustments.
- Between 2019 and 2020 there was a £0.7bn increase in fair value gains from business combinations (mergers). In 2019 gains of £0.2bn were included in the surplus, in 2020 the comparable figure was £0.8bn (see note 4).
- Between 2019 and 2020 there was a £0.3bn adverse movement in the value of financial instruments and housing properties. In 2019 the sector reported a gain from valuation movements in the year of £0.2bn. In 2020 the net impact of valuation movements was a £0.1bn loss (see note 7).
2.29 Excluding these non-cash gains and losses the ‘underlying surplus’ has decreased from £3.0bn in 2019 to £2.7bn in 2020. There are two main factors driving the £0.3bn decrease in the underlying surplus:
- A reduction in operating surplus of £0.5bn.
- An increase in profit realised from the sale of fixed assets of £0.2bn.
2.30 The reported surplus of £3.5bn increases by £0.9bn to give total comprehensive income for the period of £4.4bn. This is mainly due to an actuarial gain in respect of pension schemes of £1.1bn (see note 19).
Social housing lettings
2.31 The decrease in operating surplus is mainly attributable to a £0.3bn reduction in the surplus on social housing lettings. The margin on SHL activity reduced from 30% in 2019 to 28% in 2020.
Figure 5: SHL turnover, expenditure and margins
| Year | % Growth in turnover | % Growth in expenditure | Margin |
|---|---|---|---|
| 2017 | 1.0% | -2.0% | 34.1% |
| 2018 | 1.6% | 3.7% | 32.8% |
| 2019 | 0.6% | 4.1% | 30.5% |
| 2020 | 1.4% | 5.2% | 27.8% |
2.32 The period ending March 2020 was the fourth and final year of the 1% rent reduction. Following an initial decrease in the first year of the rent cut period, costs have increased in each of the last three years. As a result, 2020 is the third consecutive year the surplus and margin on SHL has declined.
2.33 In aggregate, rental income increased slightly by 1% in 2020, due mainly to additional units developed by the sector. However, total SHL costs increased by 5%. RSH calculates a Headline Social Housing Cost per unit as one of its VfM metrics. HSHC has increased from £4.12k per unit in 2019 to £4.25k per unit in 2020, an increase of 3%.
2.34 As illustrated in Figure 6 below, the biggest increases were in repairs and maintenance costs (£0.2bn), management costs (£0.1bn) and service charge costs (£0.1bn).
Figure 6: increase in SHL costs of 5% by cost type
| Cost type | Cost | Percentage |
|---|---|---|
| Management | £0.1bn | 17% |
| Repairs and maintenance | £0.2bn | 40% |
| Depreciation and impairment | £0.1bn | 20% |
| Service and other costs | £0.1bn | 23% |
2.35 The increase in maintenance and repairs costs and service charge costs is partially attributable to building safety spend and health and safety compliance costs. Proposals for reforms to the building safety regulatory system were published in June 2019 as part of the Building a Safer Future consultation. In the year the sector continued to respond to the need to remove dangerous cladding. By March 2020, 89% of affected high rise blocks in the social sector had either completed or started remediation, compared with 23% in the private sector Building Safety Programme - Monthly Data Release.
2.36 Including capitalised major repairs, total repairs and maintenance costs increased by 6% (£306m) to £5.7bn in 2020 (2019: 8% increase, 2018: 3% increase). More than half of providers reported an increase in repairs and maintenance spend of greater than 5%.
2.37 Other social housing (non-lettings) income declined in the year by £0.1bn to £0.7bn (2019: £0.8bn) whereas costs remained at £1.0bn resulting in a net deficit of £0.3bn. Social non-lettings costs include low margin activities such as support services, community related spend and development services.
Impact of the housing market
2.38 Given the regional fluctuations in the housing market, decreasing margins and the degree of uncertainty in the economic environment the housing market remains a key risk for a small number of providers with significant sales exposure.
2.39 Total sales receipts increased to £5.4bn (2019: £5.1bn) and the corresponding surplus on sales also increased to £1.5bn (2019: £1.4bn).
Figure 7: Profit on sales
Sales surplus (£bn)
| Year | Surplus on outright sales | Surplus on 1st tranche sales | Surplus on fixed asset sales | Total |
|---|---|---|---|---|
| 2018 | 0.9 | 0.4 | 0.3 | 1.6 |
| 2019 | 0.9 | 0.4 | 0.2 | 1.4 |
| 2020 | 1.0 | 0.3 | 0.2 | 1.5 |
Surplus on fixed asset sales: £1.0bn
| Surplus on RTB/RTA | £0.3bn | 26% |
| Surplus on staircasing | £0.3bn | 27% |
| Surplus on other social housing sales | £0.5bn | 47% |
2.40 The increase in the total surplus from sales is attributable to an increase in the profit realised on the sale of fixed assets from £0.9bn to £1.0bn. The contribution from properties developed for sale (low cost home ownership 1st tranche and outright sales) decreased slightly as margins fell in the year.
2.41 The surplus on fixed asset sales includes the following:
- The profit from the sale of housing properties to existing tenants, either through Right to Buy/Acquire or sale of subsequent LCHO properties (staircasing). These categories accounted for a profit of £0.6bn, 53% of the total profit from fixed asset sales in the year (2019: £0.5bn). The increase was driven by a £0.1bn increase in RTB/RTA sales which have been influenced by a Voluntary RTB pilot in the Midlands.
- The profit on staircasing remained mostly unchanged.
- The remaining 47% of the surplus on fixed asset sales primarily relates to the sale of housing properties to other providers (this includes stock rationalisation and the sale of vacant properties).
2.42 Sales receipts from properties developed for sale (current asset sales) increased in 2020. LCHO sale receipts increased from £1.4bn in 2019 to £1.6bn in 2020. Outright sale receipts increased from £1.5bn in 2019 to £1.6bn in 2020.
2.43 However, margins decreased in the year. The margin of LCHO 1st tranche sales fell from 25% to 20% and the margin on outright sales fell from 13% to 10%. This meant that the combined contribution from 1st tranche sales and outright sales decreased for the first time in several years, falling by 12% to £484m.
2.44 The value of properties held for sale (mainly consisting of land and work in progress rather than completed properties) has increased by 4% to £7.4bn from £7.1bn in 2019. This is significantly less than the increase reported in previous years (2019 increase of £1.5bn to £7.1bn, 2018 increase of £0.8bn to £5.6bn).
Interest cover
2.45 The sector’s key measure of its ability to cover ongoing finance costs is EBITDA MRI interest cover. This metric has continued to deteriorate with the sector’s aggregate figure of 138% being 15 percentage points down on the 2019 result. Figure 8 below illustrates that this is a slightly smaller fall than was seen in the previous year.
Figure 8: EBITDA MRI interest cover (consolidated)
| 2017 | 170% |
| 2018 | 174% |
| 2019 | 153% |
| 2020 | 138% |
2.46 Interest cover in 2017 was held down by significant one-off breakage costs in one large provider. Underlying interest cover has deteriorated over the past three years reflecting tightening margins over the rent cut period. This is driven by increasing costs, most notably in core SHL activities. Tighter margins on other activity, including sales are a contributory factor as is increased expenditure on capitalised major repairs.
2.47 Whilst total debt has increased, the impact of this has been offset by a reduction in the effective interest rate resulting in only a marginal increase in finance costs.
Table 4: Interest cover metrics
| Consolidated | Entity | |||
|---|---|---|---|---|
| % | 2020 | 2019 | 2020 | 2019 |
| EBITDA MRI interest cover | 138% | 153% | 147% | 152% |
| EBITDA MRI interest cover SHL | 129% | 139% | 133% | 143% |
| EBITDA MRI Margin | 24.3% | 26.9% | 27.8% | 29.4% |
| Debt to turnover | 4.0 | 3.8 | 4.3 | 4.1 |
| Effective interest rate | 4.4% | 4.7% | 4.4% | 4.7% |
| Effective interest rate (excluding breakage costs) | 4.1% | 4.3% | 4.1% | 4.3% |
2.48 Despite the decrease in interest cover, the sector remains robust. The median value for EBITDA MRI interest cover was 170% with 87% of providers reporting a figure greater than 100%.
2.49 There are several reasons why individual providers may have relatively low levels of interest cover. For example, stock transfer organisations typically have high levels of repairs and maintenance costs linked to stock improvement programmes. Other providers will incur one-off breakage costs associated with refinancing activity. RSH monitors the financial viability of all providers on an ongoing basis through the Quarterly Survey return. The sector remains robust and liquidity positions strong. We will engage with providers to gain assurance where there are indicators to the contrary.
2.50 Each year a small number of providers incur breakage or other exceptional finance costs when refinancing. In 2020 these amounted to £0.2bn. Excluding these from the aggregate calculation increases the sector’s EBITDA MRI interest cover to 146% (2019: 166%).
Operating performance
2.51 Bad debts, void losses and current tenant arrears are key performance indicators in assessing the efficiency of letting and rent collection.
Table 5: Indicators of operating performance
| Consolidated | Entity | |||
|---|---|---|---|---|
| % of gross rent | 2020 | 2019 | 2020 | 2019 |
| Rent loss from void properties | 1.5% | 1.5% | 1.5% | 1.5% |
| Bad debts for the year | 1.0% | 0.8% | 1.0% | 0.8% |
| Current tenant arrears | 4.9% | 4.7% | 4.9% | 4.7% |
2.52 During the year the number of Universal Credit claimants increased from 445,000 to 745,000 reflecting the rapid acceleration of UC rollout in 2019-20. Changes to UC such as the Trusted Partner status and the associated landlord portal were implemented to make it easier for social housing sector landlords to implement managed payment to landlords. However, the roll out of UC has had an effect on the figures in the table above.
-
Current tenant arrears have increased for the second consecutive year and now stand at 4.9% of gross rents compared to 4.7% in 2019.
-
Bad debts have increased from 0.8% of gross rent in 2019 to 1% in 2020.
2.53 Following the period covered in the Global Accounts, Quarterly Survey submissions saw an initial increase in levels of arrears and voids following coronavirus restrictions. It is expected that all three indicators will deteriorate in 2021 and providers will need to closely monitor bad debts.
3. Financial statements
Table 6: Statement of comprehensive income
| Consolidated | Entity | ||||
|---|---|---|---|---|---|
| £ billion | Note | 2020 | 2019 | 2020 | 2019 |
| Turnover | 2 | 21.2 | 20.9 | 19.4 | 18.7 |
| Operating expenditure | 2 | (13.9) | (13.2) | (13.0) | (12.3) |
| Cost of sales | 2 | (2.7) | (2.5) | (1.6) | (1.5) |
| Operating surplus/(deficit) | 2 | 4.7 | 5.2 | 4.8 | 4.9 |
| Gain/(loss) on disposal of fixed assets | 3 | 1.0 | 0.9 | 1.1 | 0.9 |
| Operating surplus/(deficit) including fixed asset disposals | 5.8 | 6.1 | 5.8 | 5.8 | |
| Other items | 4 | 0.9 | 0.2 | 0.0 | 0.5 |
| Interest receivable | 5 | 0.2 | 0.1 | 0.4 | 0.3 |
| Interest payable and financing costs | 5 | (3.3) | (3.2) | (3.3) | (3.3) |
| Movements in fair value | 6 | (0.1) | 0.2 | (0.1) | 0.2 |
| Surplus/(deficit) before tax | 3.5 | 3.5 | 2.8 | 3.5 | |
| Taxation | 0.0 | (0.0) | 0.0 | (0.0) | |
| Surplus/(deficit) for the period | 3.5 | 3.5 | 2.8 | 3.5 | |
| Unrealised surplus/(deficit) on revaluation of housing properties | 0.1 | 0.1 | 0.1 | 0.1 | |
| Actuarial (loss)/gain in respect of pension schemes | 19 | 1.1 | (0.4) | 1.1 | (0.4) |
| Initial measurement of defined benefit pension liability | 19 | 0.0 | (0.4) | 0.0 | (0.4) |
| Change in fair value of hedged instruments | 6 | (0.3) | (0.1) | (0.2) | (0.0) |
| Total comprehensive income for the period | 4.4 | 2.7 | 3.7 | 2.7 |
Table 7: Statement of changes in reserves
| £ billion | Income and expenditure reserves | Revaluation reserves | Other reserves | Total |
|---|---|---|---|---|
| Consolidated | ||||
| Closing balance 2019 | 40.6 | 11.9 | (0.7) | 51.9 |
| Restatements | (0.5) | (0.1) | 0.0 | (0.5) |
| Balance at start of period | 40.2 | 11.8 | (0.6) | 51.3 |
| Surplus/(deficit) for the period | 3.5 | N/A | N/A | 3.5 |
| Other comprehensive income | 1.1 | 0.1 | (0.2) | 0.9 |
| Transfer from revaluation reserve | 0.1 | (0.1) | 0.0 | (0.0) |
| Other transfers | (0.3) | 0.3 | 0.0 | (0.0) |
| Closing balance 2020 | 44.5 | 12.1 | (0.9) | 55.7 |
| Entity | ||||
| Closing balance 2019 | 39.0 | 12.3 | (0.4) | 50.9 |
| Restatements | 0.1 | 0.1 | 0.0 | 0.2 |
| Balance at start of period | 39.1 | 12.4 | (0.4) | 51.0 |
| Surplus/(deficit) for the period | 2.8 | N/A | N/ A | 2.8 |
| Other comprehensive income | 1.1 | 0.1 | (0.2) | 0.9 |
| Transfer from revaluation reserve | 0.0 | (0.1) | 0.0 | (0.0) |
| Other transfers | 0.1 | (0.0) | 0.0 | 0.1 |
| Closing balance 2020 | 43.1 | 12.4 | (0.6) | 54.9 |
Table 8: Statement of financial position
| Consolidated | Entity | ||||||
|---|---|---|---|---|---|---|---|
| £bn | Note | 2020 | 2019 | 2020 | 2019 | ||
| Fixed assets | |||||||
| Tangible fixed assets: housing properties at cost & valuation | 7 | 160.3 | 150.8 | 155.3 | 146.6 | ||
| Other fixed assets | 8 | 3.0 | 3.2 | 2.7 | 6.7 | ||
| Investment properties | 8 | 6.7 | 6.2 | 3.9 | 3.7 | ||
| Other investments | 8 | 1.9 | 1.9 | 3.9 | 3.7 | ||
| Total fixed assets | 171.9 | 162.0 | 165.8 | 160.7 | |||
| Current assets | |||||||
| Properties held for sale | 9 | 7.4 | 7.1 | 3.3 | 2.8 | ||
| Trade and other debtors | 9 | 2.1 | 2.0 | 1.7 | 1.5 | ||
| Cash and short-term investments | 9 | 7.4 | 7.3 | 6.9 | 5.6 | ||
| Other current assets | 9 | 1.9 | 1.5 | 8.6 | 4.5 | ||
| Total current assets | 18.8 | 18.0 | 20.5 | 14.4 | |||
| Creditors: amounts falling due within one year | |||||||
| Long-term loans | 11 | 79. | 74.5 | 63.0 | 59.5 | ||
| Amounts owed to group undertakings | 11 | 0.4 | 0.0 | 15.7 | 13.5 | ||
| Finance lease obligations | 11 | 0.7 | 0.6 | 0.5 | 0.4 | ||
| Deferred capital grant: due after more than one year | 12 | 37.7 | 36.6 | 36.7 | 35.7 | ||
| Other long-term creditors | 13 | 4.6 | 4.4 | 3.7 | 3.5 | ||
| Total creditors: amounts falling due after more than one year | 122.8 | 116.0 | 119.6 | 112.6 | |||
| Provisions for liabilities | |||||||
| Pension provision | 19 | 2.1 | 3.1 | 1.9 | 2.9 | ||
| Other provisions | 14 | 0.8 | 0.8 | 0.8 | 0.8 | ||
| Total net assets | 55.7 | 51.9 | 54.9 | 50.9 | |||
| Reserves | |||||||
| Income and expenditure reserve | 15 | 44.5 | 40.6 | 43.1 | 39.0 | ||
| Revaluation reserves | 15 | 12.1 | 11.9 | 12.4 | 12.3 | ||
| Other reserves | 15 | (0.9) | (0.7) | (0.6) | (0.4) | ||
| Total reserves | 55.7 | 51.9 | 54.9 | 50.9 |
4. Notes to the accounts
1 - Global accounts methodology
4.1.1 This analysis is based on a database of information derived from housing providers’ audited financial statements. The database contains data from the annual account regulatory returns (known as FVAs) which must be submitted by providers that own or manage 1,000 or more homes. Where a provider is a parent of a group structure that produces consolidated financial statements, it submits both an entity and a consolidated FVA.
4.1.2 These regulatory returns are aggregated to produce the Statement of Financial Position, Statement of Changes in Reserves and SOCI. The statements and notes within this document are based on the entity and consolidated datasets for 2019/20. Comparative figures for 2018/19 are also provided.
4.1.3 Figures have been rounded to the nearest £billion to one decimal place. This can result in rounding differences in totals as the individual returns are denominated in £000s.
Aggregate SOCI
4.1.4 The aggregate SOCI reflects the sum of private registered provider activity for all accounting periods ending between 1 April 2019 and 31 March 2020.
Aggregate SOFP
4.1.5 The aggregate SOFP is the sum of individual statements where the financial year end falls within the period from 1 April 2019 to 31 March 2020.
Additional information
4.1.6 Additional information is provided on other activities, selected notes to the financial statements and the number of homes in management.
Changes to FVA return
4.1.7 Minor changes were made to the FVA template in 2020. These included additional analysis of other current assets, disclosures relating to gift aid receipts, and non-social rental units. Additional lines were added for payment of gift aid, and an additional table added to ‘properties held for sale’ for prior period balances. Part D has been renamed from ‘Social Housing Lettings Note’ to ‘Operating Surplus Note’.
2 - Particulars of turnover, operating expenditure and operation surplus
a. Social housing lettings
4.2.1 Based on the consolidated returns, turnover from SHL increased by 1.4% to £15.7bn. The corresponding figure for the entity return was £15.4bn (an increase of 1.2%). Factors contributing to the small difference between the consolidated and entity figures include turnover from small providers with fewer than 1,000 units where these form part of group structures, and social housing letting activity undertaken outside England.
Table 9: Income and expenditure from SHL
| Consolidated | Entity | |||
|---|---|---|---|---|
| £bn | 2020 | 2019 | 2020 | 2019 |
| Income | ||||
| Rents | 13.5 | 13.3 | 13.3 | 13.1 |
| Service charge income | 1.5 | 1.4 | 1.4 | 1.4 |
| Net rental income | 15.0 | 14.8 | 14.7 | 14.5 |
| Capital grant released to income | 0.5 | 0.5 | 0.5 | 0.5 |
| Other & revenue grant | 0.2 | 0.2 | 0.3 | 0.2 |
| Turnover from SHL | 15.7 | 15.5 | 15.4 | 15.2 |
| Expenditure | ||||
| Management | 3.0 | 2.9 | 2.9 | 2.8 |
| Service charge costs | 1.8 | 1.7 | 1.8 | 1.7 |
| Routine maintenance | 2.2 | 2.1 | 2.2 | 2.1 |
| Planned maintenance | 1.0 | 1. | 1.0 | 0.9 |
| Major repairs expenditure | 0.5 | 0.5 | 0.5 | 0.5 |
| Bad debts | 0.1 | 0.1 | 0.1 | 0.1 |
| Depreciation of housing properties | 2.3 | 2.2 | 2.3 | 2.2 |
| Impairment of housing properties | 0.0 | 0.0 | 0.0 | 0.0 |
| Other costs (including lease costs) | 0.3 | 0.3 | 0.3 | 0.3 |
| Expenditure on SHL | 11.3 | 10.7 | 11.2 | 10.6 |
| Operating surplus / (deficit) on SHL | 4.4 | 4.7 | 4.2 | 4.6 |
4.2.2 Rental income increased by £165m (1.2%) in the consolidated returns. This reflects the final year of annual 1% rent reductions. The impact of the rent reductions is offset in the financial statements due to several factors:
-
The increase in the number of housing units during the year
-
Changes in the population of providers submitting financial statements
-
Other factors relating to the rent reduction policy including exemptions from the rent decrease for specific types of unit and changes to rent that are permitted when a unit is re-let
-
The permitted increase for the rental element of LCHO units. Annual increases were limited to 3.8% (RPI 3.3% in September 2018 plus 0.5%) - Inflation and Price Indices – RPI all items time series, ONS.
4.2.3 Total expenditure on SHL has increased by 5% to £11.3bn. There have been increases for all expenditure items with the exception of ‘Other’, which includes lease costs. The largest increases were for maintenance and major repairs cost rising by £223m (6%), contributing to almost 40% of the total SHL expenditure increase. This is partially attributable to building safety spend including the removal of dangerous cladding and health and safety compliance costs.
4.2.4 Service charge income increased by £33m (2.3%) in the consolidated returns. The ratio of service charge income to associated costs have decreased slightly from 83% to 79%. Service charge costs increased by £122m (7%), partially due to additional fire/health and safety compliance costs incurred.
4.2.5 Depreciation and impairment increased by £110m (5%), and bad debts rose by £30m (28%). Management costs increased by £98m (3%).
4.2.6 The consolidated operating surplus has decreased by £343m (7%) to £4.4bn, with the operating margin decreasing from 30% to 28%. The margin on an entity basis is not materially different.
b. Other social housing activities
Table 10: Other social housing activities
| Consolidated | Entity | |||
|---|---|---|---|---|
| £ billion | 2020 | 2019 | 2020 | 2019 |
| First tranche LCHO sales | ||||
| Turnover | 1.6 | 1.4 | 1.5 | 1.4 |
| Expenditure/Cost of sale | 1.3 | 1.1 | 1.2 | 1.0 |
| Surplus | 0.3 | 0.4 | 0.3 | 0.3 |
| Other social housing activities | ||||
| Turnover | 0.7 | 0.8 | 1.0 | 0.9 |
| Expenditure/Cost of sales | 1.0 | 1.0 | 1.1 | 1.1 |
| Surplus | (0.3) | (0.2) | (0.1) | (0.2) |
| Total | ||||
| Turnover | 2.3 | 2.2 | 2.5 | 2.3 |
| Expenditure/Cost of sales | 2.3 | 2.1 | 2.3 | 2.1 |
| Surplus | 0.0 | 0.1 | 0.2 | 0.2 |
4.2.7 Turnover from first tranche LCHO sales in the consolidated statements increased by £185m (13%) to £1.6bn. The margin on LCHO sales has fallen for a third consecutive year, from 25% to 20% resulting in a surplus of £0.3bn; a 10% decrease from 2019. The fall in margin is widespread with almost 50% of providers experiencing a decrease in comparison to 2019. Whilst over 70% of providers report some turnover from this source, it is heavily concentrated amongst a small number of providers with 30 providers together accounting for two-thirds of the sector turnover from this source.
4.2.8 The income from other non-letting social housing activity fell by 9%, a decrease of £69m to £0.7bn, and costs remained at £1.0bn resulting in a deficit of £0.3bn. Over half of this activity consists of income relating to support services which saw a £13m (3%) reduction and a £1m increase (11%) in the overall loss reported on this activity. Support service income is heavily concentrated with 13 providers reporting income in excess of £10m each from this source and together accounting for 70% of the sector.
4.2.9 The remainder of other social housing activity includes development services, community and neighbourhood activities, gift aid, management services and a range of other activities. The sector reported a loss on these activities of £276m (2019: £212m), a 30% increase on last year, in the consolidated returns.
c. Non-social housing activities
Table 11: Non-social housing activities
| Consolidated | Entity | |||
|---|---|---|---|---|
| £ billion | 2020 | 2019 | 2020 | 2019 |
| Properties developed for sale | ||||
| Turnover | 1.6 | 1.5 | 0.3 | 0.3 |
| Expenditure/Cost of sales | 1.4 | 1.3 | 0.2 | 0.2 |
| Surplus | 0.2 | 0.2 | 0.0 | 0.0 |
| Other non-social housing activities | ||||
| Turnover | 1.7 | 1.7 | 1.2 | 0.9 |
| Expenditure/Cost of sales | 1.5 | 1.5 | 0.9 | 0.8 |
| Surplus | 0.1 | 0.2 | 0.3 | 0.1 |
| Total | ||||
| Turnover | 3.2 | 3.2 | 1.4 | 1.2 |
| Expenditure/Cost of sales | 2.9 | 2.8 | 1.1 | 1.0 |
| Surplus | 0.3 | 0.4 | 0.3 | 0.1 |
4.2.10 Turnover from properties developed for outright sale increased by £77m (5%) to £1.6bn in the consolidated returns. This activity is primarily undertaken by non-registered entities within group structures and so is materially greater in the consolidated returns. The margin on this activity fell from 13% to 10% resulting in an overall decrease of £30m (16%) in the surplus reported of £0.2bn.
4.2.11 Outright sales activity is concentrated in a comparatively small number of providers with 57 reporting turnover in excess of £1m and 12 reporting more than £50m. These 12 providers together account for 69% of the sector total.
4.2.12 Some providers deliver units for outright sale through joint ventures. Income and expenditure from outright sale activity undertaken in joint ventures is not reported separately. The net surplus from joint ventures is included in the income statement under “Other items” (see note 4).
4.2.13 In total the turnover from other non-social activity was £1.7bn, a 2% decrease on 2019. Of this, £0.7bn is reported by just three large providers. The nature of the non-social housing activity is different in each of the three providers. Specialisms include land sales, leisure facilities management, property management services and the provision of student accommodation and nursing homes.
4.2.14 The surplus from other non-social activity decreased by £39m (21%) to £144m in comparison to 2019. This includes market rent, student rent and nursing homes, activities for which there was a combined surplus of £193m (2019: £162m). A loss of £50m was reported for other items which include development costs not capitalised, and costs relating to pension provisions.
4.2.15 Gift aid receipts are now included within turnover, following a change in data collection, and disclosed as part of either ‘other social housing’ or ‘non-social housing’ activities. Receipts in entity returns totalled £383m in 2020, a 4% decrease on the £399m reported in 2019 and gift aid payments came to £104m.
4.2.16 The gift aid receipts in entity returns reflect non-social housing activity carried out by non-registered entities within group structures. There is a strong correlation between gift aid received in the entity returns and surplus on properties developed for sale in non-registered entities within consolidated returns.
3 - Disposal of fixed assets
4.3.1 Based on consolidated returns, total fixed asset sales during the year generated proceeds of £2.3bn and a surplus of £1.0bn. This is an increase in sales proceeds of 5% from 2019, with an increased surplus of 20%. The increase in surplus was mainly due to a significant rise in the RTB surplus.
4.3.2 Proceeds from RTB and RTA sales increased by 55% to £514m, resulting in the surplus increasing by 77% to £274m (2019: £155m). This increase was driven by the rise in RTB sales, which also resulted in an increased margin on sales of 58% (2019: 51%).
4.3.3 The VRTB Midlands pilot was launched across the East and West Midlands in August 2018 and was the main contributor to the large increase in RTB surplus within the year, with almost half of the overall surplus was reported by providers operating in this region.
4.3.4 Receipts from staircasing sales remained in line with the previous year and stood at £698m (2019: £696m), with a resultant reduction in surplus of 7%. The margin on staircasing sales reduced from 44% to 41%.
4.3.5 Other housing property sales generated proceeds of £627m, a 29% decrease from 2019, however costs have fallen by almost half, resulting in the net surplus increasing to £331m (2019: £308m). This category includes stock rationalisation, sale of void properties and to a lesser extent the sale of non-social housing assets.
4.3.6 Proceeds from sales to other RPs and sales of other assets increased by £189m to £435m, with the surplus increasing to £161m (2019: £104m). This was driven by three providers with proceeds of over £55m. During the period there were around 3,000 sales of properties outside the sector and 28,000 transfers of properties to other housing providers.
Table 12: Disposal of fixed assets
| Consolidated | Entity | |||
|---|---|---|---|---|
| £ billion | 2020 | 2019 | 2020 | 2019 |
| Staircasing | ||||
| Proceeds | 0.7 | 0.7 | 0.7 | 0.7 |
| Costs of Sale | 0.4 | 0.4 | 0.4 | 0.4 |
| Surplus | 0.3 | 0.3 | 0.3 | 0.3 |
| RTB/RTA | ||||
| Proceeds | 0.5 | 0.3 | 0.5 | 0.3 |
| Costs of Sale | 0.2 | 0.2 | 0.2 | 0.2 |
| Surplus | 0.3 | 0.2 | 0.3 | 0.2 |
| Other housing property sales | ||||
| Proceeds | 0.6 | 0.9 | 0.6 | 0.6 |
| Costs of Sale | 0.3 | 0.6 | 0.3 | 0.3 |
| Surplus | 0.3 | 0.3 | 0.3 | 0.3 |
| Sales to other RPs and Other | ||||
| Proceeds | 0.4 | 0.2 | 0.5 | 0.6 |
| Costs of Sale | 0.3 | 0.1 | 0.3 | 0.4 |
| Surplus | 0.2 | 0.1 | 0.2 | 0.2 |
| Total | ||||
| Proceeds | 2.3 | 2.2 | 2.3 | 2.2 |
| Costs of Sale | 1.2 | 1.3 | 1.3 | 1.3 |
| Surplus | 1.0 | 0.9 | 1.1 | 0.9 |
4 - Other items
Table 13: Other items
| Consolidated | Entity | |||
|---|---|---|---|---|
| £bn | 2020 | 2019 | 2020 | 2019 |
| Gift aid | 0.0 | 0.4 | ||
| Other items | 0.8 | 0.2 | 0.0 | 0.1 |
| Share of operating surplus JV | 0.1 | 0.1 | 0.0 | 0.0 |
| Total | 0.9 | 0.2 | 0.0 | 0.5 |
4.4.1 Following a change in data collection, gift aid is now included within the operating surplus and is disclosed as part of either ‘other social housing’ or ‘non-social housing’ activities.
4.4.2 ‘Other items’ includes gains resulting from business combinations where the acquisition method of accounting has been used [^17]. Based on the consolidated returns, there were eight providers who reported net gains on business combinations. This was double the number of providers compared to the previous year with three mergers reporting gains above £100m. This amounted to a total gain of £837m (2019: £175m) and the comparable figure in the entity returns was £14m (2019: £83m).
4.4.3 Providers account for activity undertaken in joint ventures using ‘equity’ accounting principles. In the SOCI, income and expenditure are not reported separately. The net surplus from joint ventures is included as a separate line item.
4.4.4 The net surplus from joint ventures has increased by £21m (29%) to £95m in 2020, following a decrease of £11m in 2019. Three providers each reported more than £10m income from this source, together accounting for 60% of the total.
4.4.5 The majority of the surplus from joint ventures is generated through the provision of homes for outright sale. The turnover associated with the net surplus figure is not included in financial statements. Outright sales income of £0.7bn underpins the net surplus on joint ventures reported in the year.
5 - Interest payable and finance costs
4.5.1 Total interest and finance costs increased by £25m (1%) in the consolidated statements. Within this total there was an increase of £256m (9%) in the interest payable on liabilities and a decrease of £184m (35%) in other amounts payable. Loan breakage costs are the main factor within ‘Other amounts payable’ in Table 14 and have decreased by £129m (49%) from 2019 to £136m. The 2019 data included significant loan breakage costs for one provider resulting from a merger. In 2020, four providers reported breakage costs more than £10m which comprised 78% of the total.
Table 14: Interest payable and finance costs
| Consolidated | Entity | |||
|---|---|---|---|---|
| £billion | 2020 | 2019 | 2020 | 2019 |
| Interest payable on liabilities | 3.2 | 3.0 | 3.1 | 3.0 |
| Defined benefit pension charges | 0.1 | 0.1 | 0.1 | 0.1 |
| Other amounts payable | 0.3 | 0.5 | 0.3 | 0.4 |
| Less: interest capitalised in housing properties | (0.4) | (0.3) | (0.3) | (0.2) |
| Total interest payable and financing costs | 3.3 | 3.2 | 3.3 | 3.3 |
6 - Movements in fair value and remeasurements
Movements in the fair value of investment properties
4.6.1 Properties held for market rent and other properties held for a non-social housing purpose are categorised as investment properties. They are re-measured annually at their fair value, with any change in fair value being reported in the surplus for the year.
4.6.2 Based on consolidated returns, the increase in the fair value of investment properties held by the sector decreased by £172m (87%) to £26m on re-measurement (2019: £198m). 77 providers reported negative fair value movements, with five reporting negative movements of more than £10m compared to 2019. A significant factor in the decline is due to uncertain market conditions and a change in the valuation basis. The figure based on entity returns was £16m, reflecting the extent to which market rent properties are held by non-registered entities within group structures.
4.6.3 Due to the unknown future impact of coronavirus, valuations made at the end of March 2020 have been produced on the basis of “material valuation uncertainty” as per the Royal Institution of Chartered Surveyors.
Movement in the fair value of financial instruments
4.6.4 Interest rate swaps and a minority of loans are classified as ‘non-basic’ or ‘other’ financial instruments under FRS102 and must be re-measured annually at fair value. Swap rates reduced over the year, for example, the 15-year swap rate reduced from 1.32% in March 2019 to 0.62% in March 2020.
4.6.5 Non-hedged financial instruments had an adverse movement of £112m, mainly driven by four providers with adverse movements of over £10m. In respect of hedged financial instruments, providers reported an adverse movement in the fair value of £280m, with one provider accounting for over 20% of this. Movements in the fair value of non-hedged financial instruments are included within the surplus, whereas hedged financial instruments are included within other comprehensive income.
7 - Fixed assets - housing properties
Table 15: Fixed asset housing properties
| £bn | Consolidated | Entity | |
|---|---|---|---|
| Housing properties at cost or valuation | |||
| Properties held at cost | 167.3 | 163.8 | |
| Properties held at valuation | 2.7 | 2.7 | |
| Total properties held at start of period | 170.0 | 166.5 | |
| Additions | |||
| Additions (new properties) | 10.2 | 9.3 | |
| Additions (existing properties) | 1.9 | 1.9 | |
| Disposals | (1.5) | (1.5) | |
| Transfers and reclassifications [^18] | 2.2 | 0.9 | |
| Revaluation and other | 0.1 | 0.5 | |
| Total properties held at end of period | 182.9 | 177.6 | |
| Depreciation and impairment | |||
| Total depreciation and impairment at start of period | 20.6 | 20.3 | |
| Depreciation and Impairment charged in period | 2.3 | 2.3 | |
| Released on disposal | (0.4) | (0.4) | |
| Revaluation and other | 0.1 | 0.1 | |
| Total depreciation and impairment at end of period | 22.6 | 22.3 | |
| Net book value at end of period: | |||
| Properties held at cost | 158.0 | 153.0 | |
| Properties held at valuation | 2.3 | 2.3 | |
| 160.3 | 155.3 | ||
| Net book value at start of period [^19] | 149.4 | 146.1 |
4.7.1 The consolidated results for the sector report an increase of £12.9bn over the year in the gross book value of housing properties, to reach a total of £182.9bn at the end of March 2020. Movements during the year included:
- £10.2bn of investment in new supply
- £1.9bn worth of works to existing properties
- stock disposals with a book value of £1.5bn
- transfers (including transfers of engagements) from other RPs of £2.2bn
- revaluation and other movements resulting in a net increase of £0.1bn.
4.7.2 A net total of £2.0bn was added to the sector’s cumulative depreciation and impairment balance, resulting in a net book value of £160.3bn at March 2020. This represents an increase of £10.9bn (7%) during the year. Movements included:
- £2.3bn worth of depreciation charges
- £0.1bn worth of impairment charges
- £0.4bn of charges released on disposal
- revaluation and other movements resulting in a net increase of £0.1bn.
8 - Other fixed assets and investments
Table 16: Other fixed assets
| Consolidated | Entity | |||
|---|---|---|---|---|
| £bn | 2020 | 2019 | 2020 | 2019 |
| Amounts owed by group | 0.0 | 3.9 | ||
| Tangible fixed assets: Other | 2.0 | 2.2 | 1.9 | 2.0 |
| HomeBuy loans receivable | 0.7 | 0.7 | 0.6 | 0.7 |
| Intangible fixed assets and goodwill | 0.3 | 0.2 | 0.2. | 0.1 |
| Total | 3.0 | 3.2 | 2.7 | 6.7 |
4.8.1 Following a change in the data collection, ‘amounts owed by group’ are now disclosed in ‘Other current assets’ (see Table 21). Other debtors due after one year are also now disclosed separately within other current assets, where in previous years these have been included within ‘Tangible fixed assets: Other’.
4.8.2 Based on consolidated returns, other fixed assets were valued at £3.0bn. This consists primarily of tangible fixed assets other than housing properties, which account for 67% of the total. This includes items such as office buildings and IT equipment.
4.8.3 At the entity level, other fixed assets total £2.7bn. As with consolidated returns, other tangible fixed assets account for the largest proportion of the overall total, with 70% of assets falling within this category. Intangible fixed assets and goodwill accounts for 6% of the total, compared to 11% of the total in consolidated returns. This includes goodwill arising on acquisition and IT software.
Table 17: Investments
| Consolidated | Entity | |||
|---|---|---|---|---|
| £bn | 2020 | 2019 | 2020 | 2019 |
| Investment properties | 6.7 | 6.2 | 3.9 | 3.7 |
| Investment in joint ventures | 1.2 | 1.2 | 0.1 | 0.1 |
| Investment in associates | 0.1 | 0.1 | 0.0 | 0.2 |
| Investment in subsidiaries | 0.0 | 0.0 | 3.1 | 2.7 |
| Other investments | 0.6 | 0.6 | 0.6 | 0.6 |
| Total | 8.6 | 8.1 | 7.9 | 7.4 |
4.8.4 The value of investment properties reported in consolidated accounts increased by £0.6bn (10%) to £6.7bn. The increase is comprised of additions of £0.5bn, and transfers and reclassifications of £0.1bn. The overall net movement in the fair value of investment properties was negligible, although 27 providers individually reported a revaluation increase or decrease in excess of £1m.
4.8.5 The total value of investment properties relates to both housing properties developed for market rent and commercial properties and includes £0.4bn relating to properties under construction. These activities are heavily concentrated within a small number of providers, with 11 groups reporting 75% of the sector total. At £3.9bn, the value disclosed in the entity accounts is substantially lower, reflecting the use of unregistered entities for this activity.
Table 18: Investment Properties
| £billion | Group | Entity |
|---|---|---|
| Opening valuation [^20] | 6.1 | 3.6 |
| of which under construction | 0.3 | 0.1 |
| Additions | 0.5 | 0.3 |
| Transfers & Reclassifications | 0.1 | 0.1 |
| Movement in fair value | 0.0 | 0.0 |
| Disposals | (0.0) | (0.1) |
| Closing valuation | 6.7 | 3.9 |
| of which under construction | 0.4 | 0.2 |
4.8.6 There was no net change in the value of investments in joint ventures during the year. The re-classification of an investment into a subsidiary following a merger reported by one large provider offset the combined net increases reported across the rest of the sector. A total of 46 of the 210 groups in the dataset reported investments in joint ventures, with three large providers accounting for over 50% of the sector total. The value of investments in joint ventures is markedly lower in the entity level accounts as much of this activity is managed through non-registered entities.
4.8.7 The total value of investments in subsidiaries reported in the entity level accounts increased by £0.4bn (14%) to reach £3.1bn. Of the £0.4bn increase, £0.2bn is attributable to the re-classification of investments between ‘investment in subsidiaries’ and ‘investment in associates’.
4.8.8 After this re-classification of investments, the value of investments in associates reported in the entity level accounts reduced by £176m to £41m. Over 85% of the remaining investment in associates was reported by two providers.
9 - Current assets
4.9.1 Total current assets held by consolidated groups increased by £0.9bn (5%) to reach £18.8bn. At entity level, total current assets increased by £6.1bn (42%) to £20.5bn. The large increase, particularly in the entity accounts, is due to the inclusion of amounts owed by group undertakings after one year and other debtors due after one year (see Table 21). These were previously disclosed as ‘other fixed assets’ (see Table 16) but are now included within ‘other current assets’ in Table 19 below.
Table 19: Total current assets
| Consolidated | Entity | |||
|---|---|---|---|---|
| £bn | 2020 | 2019 | 2020 | 2019 |
| Properties held for sale | 7.4 | 7.1 | 3.3 | 2.8 |
| Trade and other debtors | 2.1 | 2.0 | 1.7 | 1.5 |
| Cash and short-term investments | 7.4 | 7.3 | 6.9 | 5.6 |
| Other current assets | 1.9 | 1.5 | 8.6 | 4.5 |
| Total current assets | 18.8 | 18.0 | 20.5 | 14.4 |
4.9.2 The total value of properties held for sale is considerably higher at consolidated level (£7.4bn compared to £3.3bn in entity returns), reflecting market sale developments undertaken by unregistered entities. Nearly 80% of the £7.4bn total relates to land and properties under construction rather than unsold completed properties. Properties held for sale are concentrated in a small number of providers; a total of 20 provider groups reported values in excess of £100m between them accounting for 75% of the sector total.
Table 20: Cash and short-term investments
| Consolidated | Entity | |||
|---|---|---|---|---|
| £bn | 2020 | 2019 | 2020 | 2019 |
| Cash and cash equivalents | 6.7 | 6.5 | 5.4 | 5.1 |
| Short-term investments | 0.7 | 0.8 | 1.5 | 0.5 |
| Cash and short-term investments | 7.4 | 7.3 | 6.9 | 5.6 |
4.9.3 Based on consolidated returns, cash and short-term investments increased by £0.1bn to £7.4bn. Cash held by the sector increased by 3% to £6.7bn, and short-term investments decreased by 10% to £0.7bn.
4.9.4 At the entity level short-term investments increased by £1.0bn to £1.5bn. This is mainly due to one large provider reclassifying balances as short-term investments, where previously these had been disclosed as amounts owed by group undertakings. Without this adjustment, the entity level total would have remained at £0.5bn. Cash and cash equivalents increased by 5% to £5.4bn.
Table 21: Other current assets
| Consolidated | Entity | |||
|---|---|---|---|---|
| £bn | 2020 | 2019 | 2020 | 2019 |
| Amounts owed by group undertakings | 0.1 | 0.0 | 7.2 | 3.2 |
| Refurbishment obligations | 0.4 | 0.5 | 0.4 | 0.5 |
| Fair Value of Derivative Fin. Instruments | 0.1 | 0.0 | 0.1 | 0.0 |
| Other debtors due after 1 year | 0.5 | 0.3 | ||
| Any other current assets | 0.7 | 1.0 | 0.6 | 0.8 |
| Total | 1.9 | 1.5 | 8.6 | 4.5 |
4.9.5 Amounts owed by group undertakings make up 83% of other current assets in entity level accounts. The large increase in the year is due to the inclusion of amounts owed after one year, which were previously disclosed as other fixed assets (see Table 16). Of the £7.2bn total reported, 80% is attributable to 17 associations reporting balances of more than £100m.
4.9.6 Amounts owed by group undertakings are eliminated on consolidation in group accounts. The small balance reported at consolidated level relates to groups where there is an unregistered parent which is therefore excluded from the submitted data, or where there are balances due from jointly controlled entities.
4.9.7 At both consolidated and entity level, refurbishment obligations decreased by 7% to £0.4bn.
4.9.8 The fair value of derivative financial instruments increased to £0.1bn at both group and entity level. This is reported by providers making use of freestanding interest rate swaps or currency hedges, where the value of the cash flows due to the provider is greater than those due to the counterparty. In 2020 returns, there were five provider groups reporting a derivative financial instrument current asset.
4.9.9 Other debtors due after one year have been disclosed separately for the first time in 2020. These amount to £0.5bn in consolidated returns and £0.3bn in entity returns.
10 - Other current liabilities
4.10.1 The total amount of other current liabilities reported in the consolidated group accounts increased by £0.5bn (9%) to £6.2bn. At the entity level the total amount reached £6.1bn; an increase of 8% in the year. In both sets of accounts, the largest item is accruals and deferred income, representing 44% of the consolidated group total and 32% of the entity total.
Table 22: Other current liabilities
| Consolidated | Entity | |||
|---|---|---|---|---|
| £bn | 2020 | 2019 | 2020 | 2019 |
| Trade creditors | 0.8 | 0.7 | 0.6 | 0.5 |
| Rent and service charge received in advance | 0.5 | 0.5 | 0.6 | 0.5 |
| Amounts owed to group undertakings | 0.0 | 0.0 | 1.3 | 1.3 |
| RCGF and DPF | 0.4 | 0.3 | 0.4 | 0.3 |
| Accruals and deferred income | 2.7 | 2.6 | 1.9 | 1.9 |
| Pension deficit contribution liability | 0.0 | 0.0 | 0.0 | 0.0 |
| Other | 1.7 | 1.6 | 1.3 | 1.1 |
| Total | 6.2 | 5.8 | 6.1 | 5.6 |
4.10.2 Amounts owed to group undertakings account for 22% of the entity total and remained at £1.3bn in 2020. These liabilities are eliminated on consolidation in group accounts.
4.10.3 ‘Other’ current liabilities have increased by £0.1bn (7%) in consolidated group accounts, and by £0.2bn (18%) in entity accounts. This category includes various miscellaneous creditor balances, including development retention balances, grant received in advance and leaseholder sinking funds.
11 - Debt
4.11.1 At consolidated group level, total debt held by the sector increased by £6.2bn (8%) to reach £83.1bn. In entity returns debt increased by £6.6bn (9%) to £81.8bn.
Table 23: Debt
| Consolidated | Entity | |||
|---|---|---|---|---|
| £bn | 2020 | 2019 | 2020 | 2019 |
| Short-term loans | 2.6 | 1.9 | 2.6 | 1.9 |
| Long-term loans | 79.5 | 74.5 | 63.0 | 59.5 |
| Amounts owed to group undertakings | 0.4 | 0.0 | 15.7 | 13.5 |
| Finance | ||||
| lease obligations | 0.7 | 0.6 | 0.5 | 0.4 |
| Total | 83.1 | 76.9 | 81.8 | 75.3 |
4.11.2 Short-term loans have increased by 41% in consolidated group accounts and by 40% in entity accounts, with both reaching £2.6bn in 2020. The increase is due mainly to one large provider undertaking a voluntary refinancing exercise, which resulted in £0.5bn worth of loans, previously classified as long-term loans, becoming due within one year.
4.11.3 At group level, long-term loans have increased by £5.0bn (7%) to reach £79.5bn. A total of 18 providers reported an increase in long-term debt of £0.1bn or more, and the addition of two new providers to the dataset has added an additional £0.6bn to the sector total. At entity level, long-term debt has increased by £3.5bn (6%) to £63.0bn.
4.11.4 Amounts owed by group undertakings account for 19% of total entity debt and increased by 16% during the year to reach £15.7bn. These liabilities are eliminated on consolidation in group accounts. The unconsolidated balance of £0.4bn disclosed in group accounts relates mainly to two providers, both with an unregistered parent, where wider group balances are not included within the data return.
12 - Capital grant
4.12.1 At consolidated group level, the total capital grant reported within creditors (due within one year and after one year) has increased by £1.2bn [^21] (3%), to reach £38.1bn. The increase in the year includes the following:
-
New grant totalling £1.7bn was received during the year.
-
Grant of £450m was amortised and recognised in income. The majority of housing properties are held at cost with deferred capital grant being held as a creditor in the SOFP and released to income over the useful life of the asset (the accrual model).
-
A further £30m was released to income under the performance model, where providers hold properties at valuation and recognise grant as income on scheme completion.
13 - Other long-term creditors
4.13.1 At consolidated group level, other long-term creditors have increased by £0.2bn (6%) to reach £4.6bn. At entity level, an increase of £0.2bn (5%) has been reported.
Table 24: Other long-term creditors
| Consolidated | Entity | |||
|---|---|---|---|---|
| £bn | 2020 | 2019 | 2020 | 2019 |
| Fair value derivative financial instruments | 2.6 | 2.3 | 1.9 | 1.7 |
| HomeBuy grant | 0.3 | 0.4 | 0.3 | 0.4 |
| RCGF | 0.7 | 0.7 | 0.7 | 0.7 |
| Pension deficit contribution liability | 0.0 | 0.1 | 0.0 | 0.1 |
| Other | 1.0 | 0.9 | 0.7 | 0.7 |
| Total | 4.6 | 4.4 | 3.7 | 3.5 |
4.13.2 A total of 41 groups disclosed derivative financial instruments at fair value as a long-term creditor. These are providers that have utilised standalone interest rate swaps to fix the interest payable on variable rate debt and where the value of the cash flows due to the counterparty is greater than those due to the provider. Over half of the sector total is reported by nine providers that have recognised a liability in excess of £100m.
4.13.3 The total liability reported in consolidated group accounts has increased by £0.3bn (15%) since 2019. For most providers, the liability increases as interest rates decrease, and the increase from 2019 reflects the sharp fall in swap rates that resulted from the outbreak of the coronavirus pandemic in early 2020.
14 - Provisions
4.14.1 The provision reported in respect of pension liabilities is covered in Note 19 Pensions.
4.14.2 Based on consolidated returns, other provisions disclosed by the sector remained the same at £0.8bn. Of this, £0.5bn (2019: £0.5bn) relates to obligations to undertake refurbishment work where a stock transfer provider has entered into an agreement with a local authority. Providers must recognise both a payment in advance (creditor) and a prepayment (debtor), the latter is reported within current assets – see Table 21.
15 - Reserves
4.15.1 The total reserves within the consolidated group accounts (Table 7) increased by 7% during the year to £55.7bn (entity: 8%, £54.9bn). The majority of this relates to the annual surplus recognised in the year.
4.15.2 Reserves are not ‘cash backed’ as the surpluses transferred to the SOFP are reinvested in providers’ businesses, including major repairs of existing stock and the development of new homes.
4.15.3 Based on consolidated returns, the income and expenditure reserves increased by 9% to £44.5bn and the revaluation reserve also increased by 2% to £12.1bn. An unrealised surplus on the revaluation of housing properties of £83m was partially offset by the release of revaluation reserves following the disposal of fixed asset housing properties.
4.15.4 Other reserves, as reported in the SOFP (Table 8) are further broken down in Table 25 below
Table 25: Other reserves
| Consolidated | Entity | |||
|---|---|---|---|---|
| £bn | 2020 | 2019 | 2020 | 2019 |
| Restricted reserves | 0.2 | 0.2 | 0.2 | 0.2 |
| Cashflow hedge reserves | (1.5) | (1.3) | (1.2) | (1.0) |
| Other reserves | 0.5 | 0.4 | 0.5 | 0.4 |
| Total | (0.9) | (0.7) | (0.6) | (0.4) |
4.15.5 In most cases where providers have applied hedge accounting in respect of interest rate swaps, a negative hedge reserve is recognised. The aggregate hedge flow reserve reported by the sector decreased by £0.2bn.
16 - Operating leases
4.16.1 The total amount of future obligations under operating leases disclosed in the financial statements has reduced by £0.1bn (7%) to £1.9bn. The reduction was largely due to two providers previously with substantial operating leases adopting the IFRS 16 accounting standard which results in operating leases being taken onto the SOFP. There remain four providers with operating lease commitments in excess of £100m, together accounting for 59% of the total.
4.16.2 Two providers operating a lease-based business model together account for 27% (£0.5bn) of the total lease obligations [^22].
Table 26: Operating leases
| Consolidated | Entity | |||
|---|---|---|---|---|
| £bn | 2020 | 2019 | 2020 | 2019 |
| Amounts payable not later than one year | 0.2 | 0.2 | 0.2 | 0.2 |
| Amounts payable between one and five years | 0.5 | 0.5 | 0.5 | 0.4 |
| Amounts payable later than five years | 1.2 | 1.3 | 1.2 | 1.3 |
| Total | 1.9 | 2.0 | 1.8 | 1.9 |
17 - Capital commitments
4.17.1 As a note to published accounts, providers must disclose the value of contracts for capital expenditure that are not provided for in the primary financial statements. In addition, they must also disclose the value of capital expenditure that has been approved by the board but not contracted for.
Table 27: Capital commitments
| Consolidated | Entity | |||
|---|---|---|---|---|
| £bn | 2020 | 2019 | 2020 | 2019 |
| Expenditure contracted but not accounted for | 19.4 | 14.3 | 15.3 | 11.4 |
| Expenditure approved but not contracted for | 17.5 | 18.6 | 13.1 | 13.2 |
| Total | 36.8 | 33.0 | 28.4 | 24.6 |
4.17.2 Based on consolidated returns, future capital expenditure contracted for has increased by 35% to £19.4bn. £1.3bn of this £5bn increase is attributable to one provider who was not included in the 2019 Global Accounts. Future capital expenditure commitments are concentrated in several large provider groups. Fourteen providers disclosed capital commitments in excess of £750m each – together these accounted for 54% of the £36.8bn total.
18 - Units
Table 28: Social housing units owned
| Unit numbers (‘000s) | Consolidated | Entity |
|---|---|---|
| 2019 closing units owned | 2,683 | 2,650 |
| Restatements | (26) | (14) |
| Opening units owned | 2,657 | 2,636 |
| Units developed | 49 | 48 |
| Units sold/demolished | (15) | (15) |
| Transfers and other movements | 26 | 13 |
| Closing units owned | 2,717 | 2,682 |
| Units managed but not owned | 51 | 71 |
| Units managed and/or owned | 2,768 | 2,753 |
4.18.1 The number of social units developed increased from 45,000 in 2019 to 49,000 in 2020. The total number of units owned increased by 35,000 from the figure reported in 2019 to 2,717,000. In total, providers also reported a further 51,000 social units which they manage on behalf of another organisation but do not own.
4.18.2 Restatements between the 2019 and 2020 returns include results of merger activity where units included in the 2019 closing total are not shown in the 2020 opening total. Where this is the case the units will instead be included in the ‘transfers and other movements’ line.
Table 29: Non-social housing units owned
| Unit numbers (‘000s) | Consolidated | Entity |
|---|---|---|
| 2019 Closing units owned | 52 | 33 |
| Restatements | 2 | 1 |
| Opening units owned | 54 | 35 |
| New units developed or acquired | 2 | 1 |
| Units sold / demolished | (1) | (1) |
| Transfers and other | 1 | (1) |
| Closing units owned | 55 | 34 |
| Units managed but not owned | 39 | 12 |
| Units managed and/or owned | 94 | 46 |
4.18.3 The number of non-social homes owned in consolidated returns is greater than that included in entity returns. This reflects the extent to which non-social housing activity is delivered within non-registered entities within group structures.
4.18.4 Based on consolidated returns, 1,600 new non-social rent units were developed in the year. Excluding restatements, the total number of non-social homes owned by the sector increased by 1,000 to 55,000. In total, providers also reported a further 39,000 non-social units which they manage on behalf of another organisation but do not own, 77% of these units are managed by one provider.
4.18.5 In addition to the note on non-social housing units, the FVA template includes disclosures relating to the number of outright sale units developed and sold. Based on consolidated returns, 6,700 new outright sale units were completed in the year – an increase of 1,800 from 2019. In total 67 providers reported outright sale development activity with 17 completing more than 100 units and accounting for 79% of the total.
19 - Pensions
4.19.1 Actuarial gains and losses on pension schemes fluctuate year-on-year. In 2020, based on consolidated returns, an overall actuarial gain of £1.1bn was reported, following a loss of £0.4bn being recognised in 2019. The actuarial gain is reflected by the movement in total pension provision for liabilities, which has reduced by £1.1bn (34%) to £2.1bn (2019: £3.1bn).
4.19.2 The change in provision and associated gain or loss reported in other comprehensive income arises as a result of movements in underlying actuarial assumptions. These include projected changes in inflation, the rate of increase in the level of pensions paid, future salary increases, a discount rate linked to gilts, and mortality assumptions in relation to how long a pension is expected to be paid. In 2020, lower inflation assumptions, reduced expectations for future salary growth and reductions in future pension payment increases combined to decrease liabilities, resulting in an actuarial gain for the year.
4.19.3 In 2019, providers participating in the Social Housing Pension Scheme were able to account for obligations using defined benefit accounting for the first time. In previous years, sufficient information was not available to facilitate this, and defined contribution accounting had to be used instead. The effect of this was to remove the liability for deficit repayment contributions that was previously disclosed within creditors, and to instead disclose the overall pension obligation, net of plan assets, as a provision for future liabilities. A one-off adjustment of £0.4bn was made to recognise the liability, which was included within other comprehensive income in 2019.
4.19.4 In 2020, there have been no further adjustments, and the amount disclosed within creditor balances has now reduced to £32m (2019: £78m). Any remaining amounts disclosed within creditors relate to defined contribution schemes, and typically represent the month delay in paying over employer and employee contributions. With defined contribution schemes providers contribute a fixed amount but have no obligation to cover shortfalls in the pension scheme.
5. Annex – Financial forecasts
5.1 This section of the report provides an overview of data submitted to RSH in relation to providers’ current business plans.
Background
5.2 Financial forecast returns are collected from all providers owning and/or managing more than 1,000 units. The returns set out the financial elements of providers’ business plans in a standardised form and include 30 year [^23] projections of the key financial statements plus further details of development plans and the key financial assumptions used.
5.3 The forecasts are submitted on a consolidated group basis and therefore include non-social housing activity undertaken by unregistered subsidiaries within the group.
5.4 FFRs are normally submitted in June each year. The deadline for the 2020 returns was extended to the end of September in order that business plans could be revised to reflect the developing situation in relation to the Coronavirus pandemic and to manage the regulatory burden placed on providers.
Context
5.5 The data in this report is based on the 208 FFRs submitted in September 2020 and focusses on the first five years of the plans, that is the period from April 2020 to March 2025. It also draws on the submissions from previous years to identify some of the key changes in this round of forecasts. Business plans are considered commercially sensitive and therefore the dis-aggregated data source will not be made publicly available.
5.6 Providers’ business plans represent their view of a range of key factors at a given point in time. As such there can be substantial changes made to forecasts between years. There are currently several key factors impacting on providers which resulted in some marked changes to the 2020 forecasts in comparison to 2019 and are likely to bring further changes in future years. These include:
- Short-term impact of coronavirus lockdowns
- Changes to the housing market impacting on outright sale activity
- Changes to interest rate forecasts
- Increases to fire and building safety spend
- Future environmental and energy efficiency requirements
Financial Statements
5.7 At an aggregate level, the sector continues to forecast surpluses as set out in the table below. Forecasts for the year ending March 2021 reflect a reduction in operating income due to the impact of the coronavirus lockdowns. Subsequent forecasts project a recovery but remain weaker than previous forecasts.
Table 30: Headline Statement of Comprehensive Income (FFR 2020)
| £billion | 2021 (FY1) | 2022 (FY2) | 2023 (FY3) | 2024 (FY4) | 2025 (FY5) |
|---|---|---|---|---|---|
| Turnover | 21.7 | 24.2 | 25.6 | 26.9 | 28.2 |
| Operating Costs | (16.9) | (18.6) | (19.4) | (20.0) | (20.7) |
| Operating Surplus | 4.8 | 5.6 | 6.2 | 6.9 | 7.5 |
| Surplus on fixed asset sales | 0.7 | 0.8 | 0.8 | 0.8 | 0.8 |
| Net interest costs | (3.2) | (3.1) | (3.2) | (3.4) | (3.6) |
| Other items | 0.1 | 0.2 | 0.2 | 0.2 | 0.2 |
| Surplus for the year | 2.4 | 3.5 | 4.1 | 4.5 | 4.9 |
5.8 Over the first five forecast years, the total operating surplus is forecast to be £31bn. This is a reduction of £3.8bn (11%) in comparison to the 2019 forecasts and is illustrated in Figure 9 below. Total surplus (after fixed asset sales and finance costs) shows a 14% reduction over the same period.
Figure 9: Operating surplus forecasts
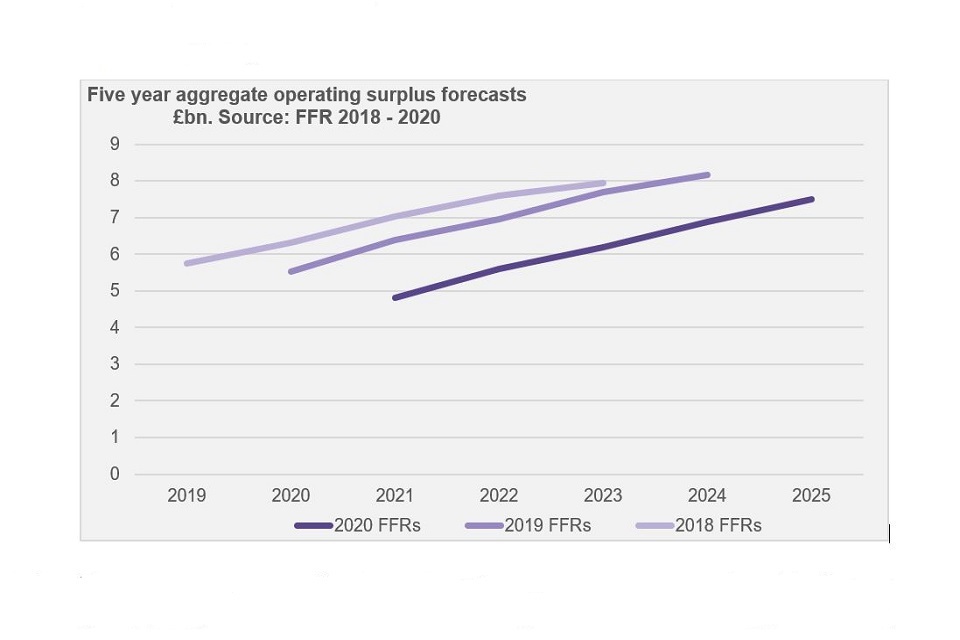
Five year aggregate operating surplus forecasts £bn. Source: FFR 2018 - 2020
5.9 The table below shows the forecast growth in the sector’s balance sheet. Total sector assets are forecast to reach £236bn (an increase of 32% on 2020) by the end of year 5. The increase is driven by investment in housing properties.
Table 31: Headline Statement of Financial Position (FFR 2020)
| £billion | 2021 (FY1) | 2022 (FY2) | 2023 (FY3) | 2024 (FY4) | 2025 (FY5) |
|---|---|---|---|---|---|
| Housing properties | 166.9 | 178.4 | 189.3 | 199.1 | 208.2 |
| Investments | 9.6 | 9.7 | 9.7 | 9.8 | 9.8 |
| Cash | 5.6 | 4.9 | 4.0 | 3.8 | 3.9 |
| Other assets | 15.8 | 15.9 | 15.8 | 15.4 | 14.5 |
| Total assets | 197.8 | 208.9 | 218.8 | 228.1 | 236.4 |
| Debt | 86.8 | 93.5 | 99.1 | 103.5 | 106.5 |
| Grant | 39.6 | 40.7 | 41.2 | 41.8 | 42.3 |
| Other creditors | 12.9 | 12.6 | 12.3 | 12.1 | 11.8 |
| Reserves | 58.6 | 62.1 | 66.3 | 70.8 | 75.8 |
| Total creditors and reserves | 197.8 | 208.9 | 218.8 | 228.1 | 236.4 |
5.10 The sector is continuing to invest in its fixed asset base with housing properties forecast to reach a balance sheet value of £208bn by 2025. As illustrated in Figure 10 below, there is a slight (2.5%) reduction in the 2021 valuation compared to the previous forecasts reflecting the known delays to construction in 2020. This is quickly recovered in the subsequent years and investment in new and existing social housing assets is comparable with previous forecasts.
Figure 10: Value of housing properties
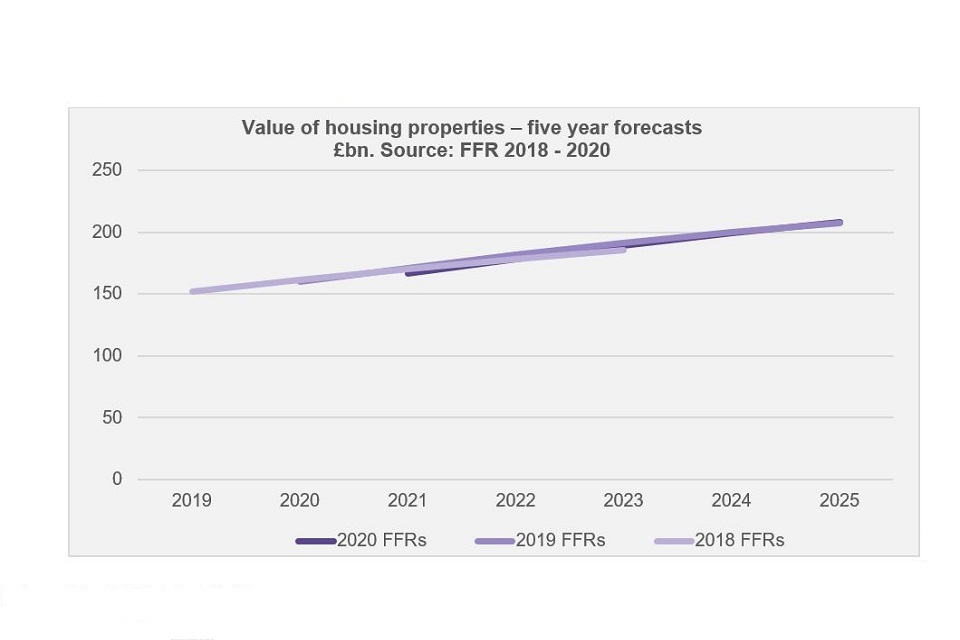
Value of housing properties – five year forecasts £bn. Source: FFR 2018 - 2020
5.11 By 2025, total debt is forecast to increase by £24bn (30%) to reach £107bn. This is an increase of £5bn (5%) from what was anticipated in the 2019 forecasts. Over the same period grant will increase by £4bn (10%) to reach £42bn, a 4% increase on the 2019 forecast.
Interest cover
5.12 Changes to business plans in recent years have resulted in a weakening of forecast interest cover as illustrated in Figure 11 below. Interest cover is forecast to increase year-on-year but is tracking around 20 percentage points below the previous forecasts. Forecast improvements reflect anticipated increases in turnover and margins resulting from a return to inflation-linked rent increases from 2021 in addition to anticipated reductions in borrowing costs.
Figure 11: EBITDA MRI interest cover forecasts
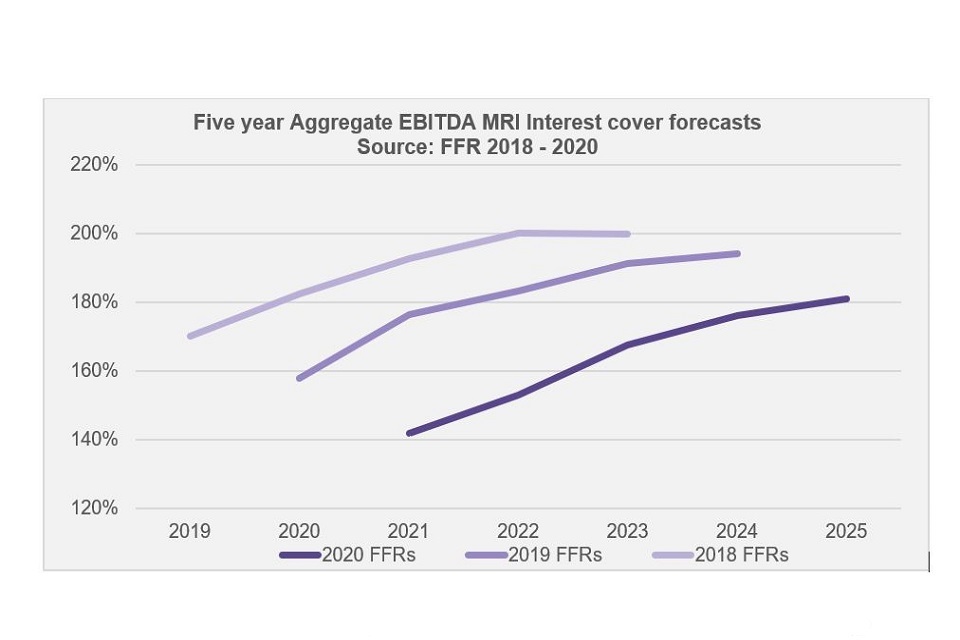
Five year Aggregate EBITDA MRI Interest cover forecasts Source: FFR 2018 - 2020
5.13 The shift in forecasts is driven by a number of factors. These include the following.
-
Outright sale receipts forecast in the first five years have decreased by 25% compared to the 2019 forecasts, a further shift away from this source of income. Margins on outright sale are also reduced to 13% from 18%.
-
Margins on SHL activity over the first five years of plans have dropped from 32% to 30%. Initially this reflects decreased income and increased costs associated with the response to coronavirus. From 2022 onwards this is partially attributable to additional expenditure on maintenance and major repairs.
-
Debt to turnover has increased in the latest forecasts resulting in marginally higher debt servicing costs. The impact on interest cover performance of this is largely mitigated by a reduction in forecast interest rates.
5.14 Although projected levels of interest cover decreases, in aggregate the sector continues to exhibit strong interest cover with EBITDA MRI interest cover of 165% for forecast years one to five with the metric strengthening year-on-year within that period.
Development
5.15 The sector is forecasting completion of 357,000 additional housing units over the first five years of the business plans. Of these, 209,000 (59%) are for rent at sub-market rates and a further 105,000 (29%) are for LCHO.
5.16 Overall, this represents a 6% reduction in development activity in comparison to the previous forecasts, as illustrated in Figure 12 below. There has been a small increase in sub-market rental development plans and a substantial reduction in planned development for outright sale and non-social rental at market rates.
Figure 12: Development forecasts
| FFR | Sub-market rental | LCHO | Outright sale | Non-social rent | Total |
|---|---|---|---|---|---|
| FFR 2018 | 188 | 104 | 58 | 16 | 365 |
| FFR 2019 | 206 | 113 | 51 | 11 | 381 |
| FFR 2020 | 209 | 105 | 36 | 7 | 357 |
Five-year Development forecasts units, thousands. Source: FFR 2018 - 2020
5.17 In general, providers have re-profiled their planned delivery of sub-market rental and LCHO units in response to the known delays in construction at the time these business plans were prepared. The result is that a similar number of units will be delivered within the first five years although delivery is forecast to be later in the programme. In contrast, the five-year forecasts for outright sale show a reduction of 15,000 units (30%) in comparison to the 2019 forecasts.
5.18 Forecast development spend over the first five years of plans has decreased by £5bn (6%) to £74.2bn. The decrease in forecast development for outright sale means that the proportion of this spend that will be funded by sales income will decrease from 54% in the 2018 forecasts to 44% in the latest forecasts. The proportion forecast to be funded by debt has increased from 26% to 33%.
Maintenance and major repairs
5.19 Forecast expenditure on maintenance and major repairs shows a marked increase in the latest set of forecasts as illustrated in Figure 13. Total expenditure over the first five forecast years is £31.2bn which is a 10% increase in comparison to the previous set of forecasts. This is despite a slight decrease in forecast expenditure for the financial year ending 2021 reflecting the impact of known delays to expenditure during the coronavirus lockdown. As noted above, this additional expenditure impacts on operating margins contributing to the reduction in interest cover.
Figure 13: Maintenance and major repairs expenditure
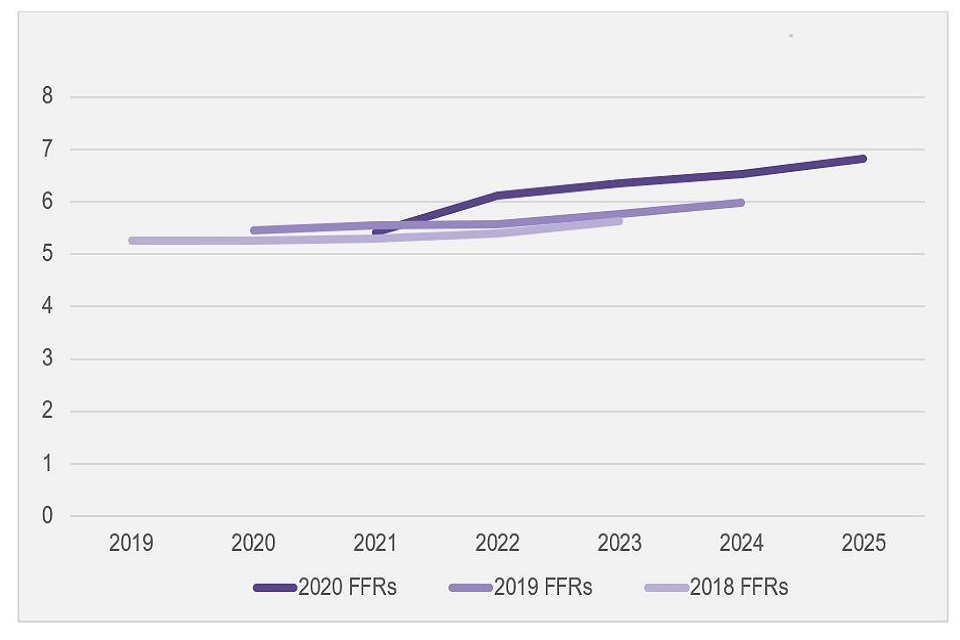
Forecast maintenance and major repairs expenditure £bn. Source: FFR 2018 - 2020
5.20 Increased expenditure initially includes a degree of catch-up spend following the pandemic. However, increased investment is sustained, reflecting a continued focus on building safety.
5.21 It is expected that repairs and maintenance expenditure will further increase in future business plans. Our engagement with the sector indicates that only some providers have started to include a provision for increased energy efficiency costs in their latest plans.
5.22 The Social Housing White Paper reaffirms the commitment to revised standards in this area and ultimately targets net-zero carbon by 2050. As the requirements are firmed up significant additional investment is anticipated in relation to future decent homes, energy efficiency and carbon reduction work.
Segmentation
5.23 Each registered provider is a unique business and there is a wide variation across the sector in terms of both the size of provider and the range of activities that they undertake.
5.24 The sector includes a small number of large providers which together account for a significant proportion of the sector in terms of both properties managed and turnover. In the 2020 FFR dataset there are 16 providers that owned or managed in excess of 40,000 social housing properties. Together these providers account for 41% of the sector’s total turnover over the first five forecast years.
5.25 The large providers tend to operate more diverse businesses and will account for 54% of the sector’s income from market sales.
5.26 The different nature of these businesses impacts on the key financial metrics for these groups of providers. Figure 14 below shows how forecast EBITDA MRI interest cover for these two subsets diverges. The large providers’ greater exposure to lower margins on market sale activity drives weaker interest cover over this period.
Figure 14: Variations in Interest cover
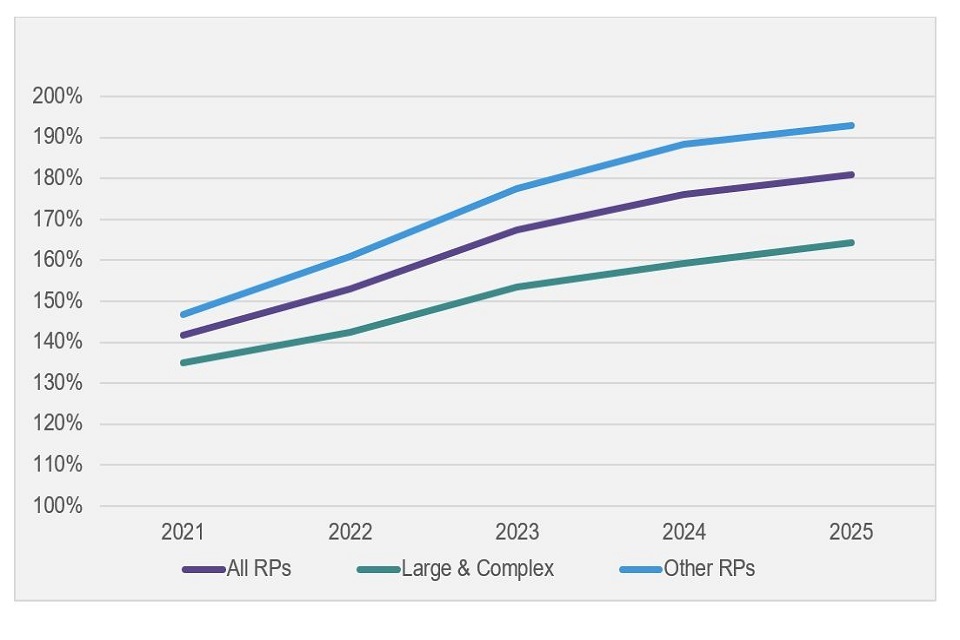
Differential EBITDA MRI Interest cover Source: FFR 2020
Conclusions
5.27 The latest forecasts show lower operating margins and reduced operating cashflows. This is reflected in an increased reliance on debt to fund new development and investment in existing stock.
5.28 Repairs and maintenance expenditure is likely to increase further in subsequent forecasts. Providers continue to adapt to the new building safety regime and the clean growth ambitions set out in the White Paper. In addition, there continues to be material uncertainty over the future course of the coronavirus pandemic and the economic conditions that will follow.
5.29 Within this context, our view is that the sector remains viable with robust liquidity. However, providers are expected to manage their resources and risks effectively to ensure that their viability is maintained. RSH will continue to follow up cases where financial indicators are weak, to ensure that providers are managing their risks effectively.
© RSH copyright 2021
This publication is licensed under the terms of the Open Government Licence v3.0 except where otherwise stated. Where we have identified any third party copyright information you will need to obtain permission from the copyright holders concerned.
Any enquiries regarding this publication should be sent via enquiries@rsh.gov.uk or call 0300 124 5225 or write to:
Regulator of Social Housing
1st floor – Lateral
8 City Walk
Leeds LS11 9AT