Global accounts 2018
Published 14 December 2018
Applies to England

© Crown copyright 2018
This publication is licensed under the terms of the Open Government Licence v3.0 except where otherwise stated. To view this licence, visit nationalarchives.gov.uk/doc/open-government-licence/version/3 or write to the Information Policy Team, The National Archives, Kew, London TW9 4DU, or email: psi@nationalarchives.gov.uk.
Where we have identified any third party copyright information you will need to obtain permission from the copyright holders concerned.
This publication is available at https://www.gov.uk/government/publications/2018-global-accounts-of-private-registered-providers/global-accounts-2018
Contents
Executive Summary
Introduction
Part A - Financial review
- Operating environment
- Financial highlights
- Growth in asset base
- Funding
- Financial performance
- Operating performance
Part B - Financial statements
Part C - Notes to accounts
- Global Accounts methodology
- Particulars of turnover, cost of sales, operating expenditure and operating surplus
- Disposal of fixed assets
- Gift Aid and other items
- Interest payable and finance costs
- Movements in fair value and re-measurement
- Fixed asset - housing properties
- Other fixed assets and investments
- Current assets
- Other long-term creditors
- Provisions
- Reserves
- Operating leases
- Capital commitments
- Units
- Pensions
Executive summary
The Global Accounts show that the social housing sector delivered a strong financial performance in the year to March 2018. There was a small increase in the underlying surplus generated. The surplus was used to support additional borrowings to fund capital investment. The year saw increased spending to acquire and develop new properties and to invest, repair and maintain existing properties.
In aggregate, financial performance was robust and consistent with the previous year. The underlying surplus (which excludes the one-off effects of merger activity) increased by 5% to £3.7bn. Interest cover, driven by a decrease in finance costs, increased from 170% to 174%.
Investment in new housing supply and existing stock increased in the year. The sector invested £10.8bn in new housing supply (predominantly social housing, but also properties for sale and for market rent). It also spent £1.7bn on capital improvements to existing stock. Total investment of £12.5bn represents an 8% increase on 2017. Expenditure on repairs and maintenance of existing social stock was £5.0bn, a 3% increase compared to 2017.
An increase in committed capital investment is demonstrative of the use of available funding capacity and representative of the sector’s future ambition. In total the sector has future capital commitments of £28.6bn (of which £12.4bn has been contracted). This is an increase of 17% compared to the figure reported in 2017.
Linked to this future investment, the year saw a significant increase in financing activity. The sector raised more than £10bn (2017: £7.6bn, 2016: £5.2bn) in new debt facilities from banks and capital markets. At March 2018, the sector had more than £17bn in undrawn loan facilities and £6bn in cash. The sector’s borrowings (drawn debt) increased by £3.0bn to £72.5bn. Levels of indebtedness and gearing were stable.
The period covers the second year of 1% rent reductions on general needs social housing properties. Providers were also required to reduce rents on most supported housing properties for the first time in 2018. The operating margin decreased slightly to 28% due to increases in costs. The operating surplus from social housing lettings, the core activity of the sector, decreased by 2% to £5.0bn.
This is the first time the operating surplus on SHL has decreased year on year since the regulator started collecting annual accounts data. Despite the slight decrease, in aggregate, the sector’s financial performance was strong. Of the 230 provider groups included in the Global Accounts, 211 have interest cover on a SHL basis of greater than 100%.
A minority of providers are particularly active in the development of properties for sale. Sales receipts were unchanged in this year’s Global Accounts with first tranche shared ownership and open market sales of £2.6bn. However, open market sale activity is increasingly taking place in joint ventures. Joint venture revenues are not recorded in a provider’s financial statements. Providers’ share of joint venture profits in 2018 was £84m, an increase of more than 50% compared to 2017.
The value of the properties held for sale, mainly consisting of land and work in progress rather than completed properties, was £5.6bn. This was an increase of 17% on 2017. The top 10 providers account for 60% of this stock. The regulator engages with these providers to assess their financial and managerial capacity to manage housing market risk exposures.
The regulator monitors the financial position of all providers on an ongoing basis. Overall, providers are well placed to continue to invest in existing stock and new supply despite an increasingly uncertain and complex operating environment.
Introduction
The 2018 Global Accounts of registered providers (Global Accounts) provides a financial overview of the social housing sector based on an analysis of the regulatory returns of private registered providers. Within this publication, private registered providers of social housing (primarily housing associations) are referred to as ‘providers’.
The social housing sector is diverse in both the size of providers that operate within it and the range of activities each undertakes. In total, there are around 1,500 active providers, of which the majority have fewer than 1,000 homes. This publication is concerned with the financial analysis of large providers which own or manage at least 1,000 social homes, together representing more than 95% of the sector’s stock.
The provision of homes for rent is the main activity for the majority of providers. Many also provide homes for ownership, thereby generating income from the sale of homes. This activity exposes providers to a different risk profile to that for traditional renting and has changed the financial profile of a number of providers.
The majority of large providers are part of a group structure; these can include multiple registered providers and non-registered entities. The development of properties for outright sale and other non-social housing activity is often delivered by non-registered entities or joint ventures within group structures. The materiality of non-social housing activity delivered in this way has increased in recent years. This leads to differences between the accounts prepared by registered entities (entity level) and those prepared on a consolidated group basis (consolidated level). This publication presents results both at consolidated and entity level.
Further differences exist between providers in the degree to which they provide specialist housing. Whilst the majority of providers have some supported housing or housing for older people, there are a small but significant number of primarily specialist providers. These providers face additional challenges in securing care and support contracts from local authorities and other public bodies.
At the beginning of the year there were changes to the regulatory environment. The constitutional consents regime was removed in April 2017 as part of a package of deregulatory measures set out in the Housing and Regeneration Act 2016. This change means that providers are no longer required to gain the regulator’s consent before disposing of social housing assets.
The year ending March 2018 was the second year of 1% rent reductions on general needs social housing properties. Providers were also required to reduce rents on most supported housing properties for the first time in 2018. Rent reductions will continue on this basis for the next two years. From the year ending March 2021 social housing rent increases will be limited to the Consumer Price Index plus 1% for 5 years.
The regulator published a new Value for Money Standard in April 2018. This required providers to publish seven metrics specified by the regulator. The results of these metrics (based on data submitted in regulatory returns) and accompanying narrative are published as an annex to the 2018 Global Accounts on value for money metrics.
Part A of the Global Accounts presents a financial review of 2017/18. Part B comprises the aggregate financial statements. Part C contains notes to the primary statements showing further detail of key entries and balances.
Part A – Financial review
Operating environment
In general, the economic operating environment for providers was stable in the year. However, given the degree of uncertainty over the terms of the UK’s departure from the EU, providers should be prepared for adverse economic conditions.
The CPI rose by 2.5% in the year to March 2018 [^2]. Inflation peaked earlier in the year at 3.1% in November. Forecasters currently predict that inflation will decrease to 2.1% by December 2019 [^3]. Average weekly wages increased by 2.9% [^4] (not adjusted for price inflation) in the 12 month period covered by the Global Accounts. The period covered the second of four years of 1% rent reductions on general needs units. Providers were also required to reduce rents on most supported housing properties for the first time in 2018. Over the remaining period of the rent reductions, it will be essential for providers to keep control over the impact of inflation on their costs for healthy margins to be maintained.
In 2018 more than one third of the net surplus reported was attributable to sales. This includes both the development of properties for sale and the sale of properties previously held for rent. Development of properties for sale is concentrated in a small number of providers. Almost 80% of turnover from properties developed for outright sale is reported by just 20 provider groups. Exposure to the housing market is a key risk for these providers to manage.
Over the period of the Global Accounts, average house prices in England increased by 4.0%5. The number of residential transactions in the year increased by 4.0% compared to 2017 [^6]. The national averages suggest the housing market remains strong. However, there is evidence that it is tightening, particularly in London and the South East. In London average house prices fell by 0.5% and in the South East the increase was just 2.9% over the year. Across the UK, average construction costs on new properties increased by 4.4% [^7] over the same period.
Providers are primarily debt funded and fix interest rates (for more than one year) on more than 70% of all borrowings [^8]. In the middle of the period covered by the Global Accounts, the Bank of England base rate increased from 0.25% to 0.5%. The three month London Interbank Offered Rate (LIBOR) also increased over the year, from 0.34% in April 2017 to 0.71% at the end of March 2018 [^9].
Relative to the long-term average, interest rates remain favourable. An increase in LIBOR of 2% could theoretically increase interest costs by £400m per year. It is essential that providers effectively manage interest rate risk as rates could increase in the future.
The sector was successful in accessing finance in the year, agreeing £10.1bn in new facilities. This included a significant increase in the number and value of deals through the capital markets. The new facilities support future investment and refinancing activity.
Financial highlights
The section below references consolidated returns unless otherwise stated.
Growth in asset base
Total investment in new or existing properties, including social housing properties, properties developed for sale and investment properties, was £12.5bn in 2018. This is an increase of 8% on spend of £11.6bn in 2017. Total investment in new or existing social housing properties for rent was £9bn (2017: £7.9bn). Of this, capital investment in major repairs to existing properties was £1.7bn, a slight increase on 2017 (£1.6bn). Investment attributable to the development of new homes increased from £6.3bn in 2017 to £7.3bn in 2018.
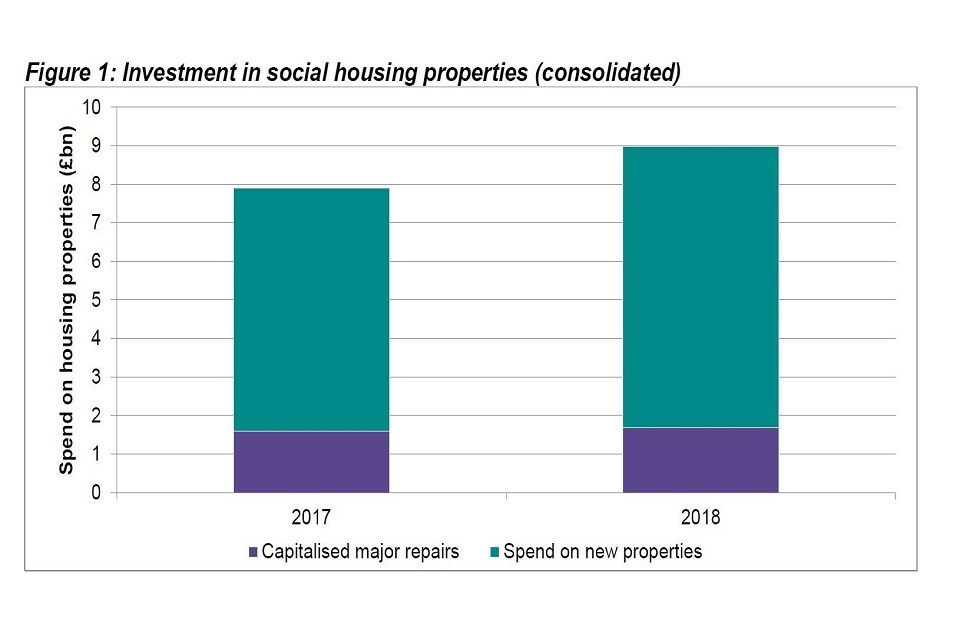
Graph showing investment in social housing properties (consolidated) for 2017 and 2018
In aggregate, 42,000 social housing properties for rent were completed in the year – an increase on the 41,000 units developed in 2017. The value of properties not yet completed (under construction) increased by £1.2bn in 2018 (2017: £0.7bn increase).
In the course of the year around 15,000 homes were sold and approximately 1,000 were demolished. The total number of homes either owned or managed by providers increased by 1% to 2,712,000.
The £9.0bn spend identified above relates only to investment on social housing properties held for rent. This figure does not include the investment on properties developed for sale and market rent set out below.
-
In 2018, investment in properties developed for outright sale and the expected first tranche element of shared ownership properties was £2.8bn (2017: £3.2bn).
-
Approximately £0.7bn is attributable to the development of new investment properties. Properties held for market rent and other properties held for a non-social housing purpose are categorised as investment properties. The total value of investment properties held by the sector increased from £4.7bn in 2017 to £5.6bn in 2018.
The total value of housing assets held by the sector increased by £7.2bn to £156.2bn. This includes £145.0bn of social housing properties held for rent, £5.6bn of investment properties (predominantly market rent) and £5.6bn of properties held for sale (mainly land and properties under construction).
Funding
The investment in new supply and existing properties was primarily funded through the use of retained surpluses and additional borrowing. This investment was also supported by grant received in the year. Debt held by the sector increased by £3.0bn (4%) to £72.5bn. This was in line with the £2.9bn increase reported in 2017.
Table 1: Funding key metrics
| Consolidated | Entity | |||
|---|---|---|---|---|
| 2018 | 2017 | 2018 | 2017 | |
| Gearing (debt as % on social housing assets) | 50% | 50% | 51% | 50% |
| Debt to turnover | 3.6 | 3.6 | 4.0 | 3.9 |
| Debt per unit (£ per social housing unit | 26,738 | 25,871 | 26,383 | 25,647 |
In aggregate, indebtedness indicators are consistent with 2017. The increase in debt in percentage terms is approximately commensurate with the increase in the net book value of housing properties resulting in a marginal increase in gearing in the year.
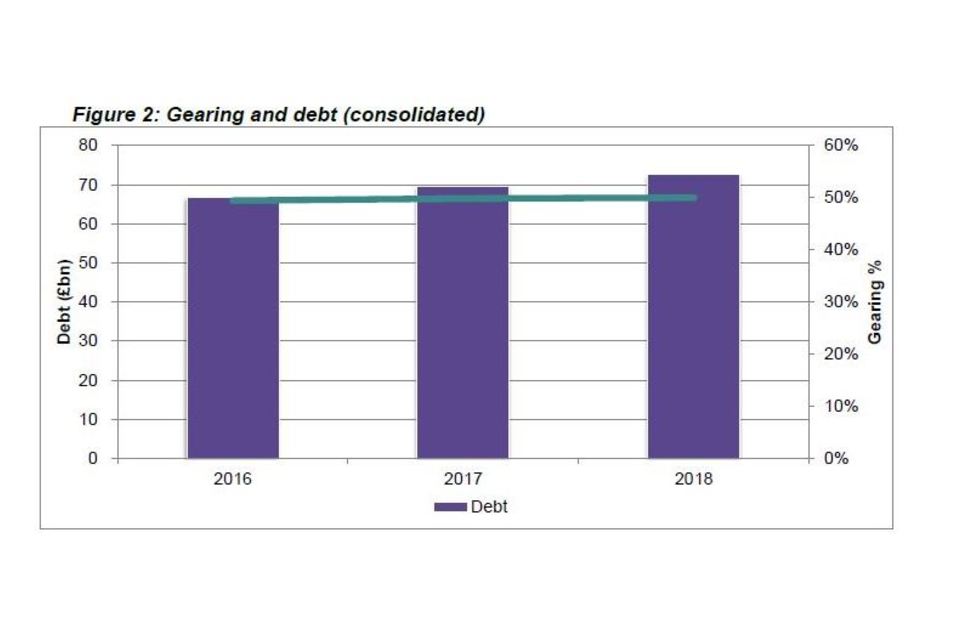
Graph showing gearing and debt (consolidated) for 2016 to 2018
The majority (over 98% by value) of social housing properties are valued at cost in the Statement of Financial Position. The accounting term ‘at cost’ means either the historic cost of the property or its deemed cost [^10]. The use of cost as the primary basis of valuation minimises the impact of revaluation on levels of reported gearing.
The majority of existing drawn debt is in the form of bank loans (59% of all debt drawn as at 31 March 2018) - Quarterly Survey. Including refinancing, 2018 was a record year for fundraising. In total, the sector agreed new facilities of £10.1bn (2017: £7.6bn, 2016 £5.2bn).
Funds raised from the capital markets increased significantly. In total 48 bond issues or private placements took place in the year (2017: 26, 2016: 23), raising a combined £4.9bn (2017: £2.6bn, 2016: £1.7bn).
Providers also agreed new bank lending of £5.2bn in the year. In aggregate, the sector has sufficient access to finance to support future growth and investment. In total, the sector had access to £17.2bn of undrawn facilities in place as at March 201810. In total, providers reported £12.4bn of future capital expenditure as contracted but not accounted for in financial statements.
Financial performance
Table 2: Summary of income statement
| Consolidated | Entity | |||
|---|---|---|---|---|
| £bn | 2018 | 2017 | 2018 | 2017 |
| Turnover | 20.5 | 20.0 | 18.4 | 18.0 |
| Total operating costs | (14.8) | (14.1) | (13.1) | (12.5) |
| Operating surplus (excluding fixed asset sales) | 5.6 | 5.9 | 5.3 | 5.5 |
| Net interest payable | (3.1) | (3.4) | (3.0) | (3.3) |
| Surplus on sale of fixed assets | 0.9 | 0.8 | 1.0 | 0.8 |
| Other | 0.2 | 0.8 | 0.4 | 0.5 |
| Surplus for the year | 3.7 | 4.1 | 3.8 | 3.5 |
Turnover has increased by 2%
Turnover increased by £0.5bn to £20.5bn. Of this growth in turnover, 17% is attributable to providers added to the dataset (managing or owning more than 1,000 units for the first time in 2018). Figure 3 (overleaf left) illustrates the main drivers for the growth between 2017 and 2018.
-
Excluding the additional providers added to the dataset, turnover from social housing lettings increased by just 1%. The year ending 2018 was the second year of the four year 1% rent cut period. The slight increase in turnover from SHL is attributable to rent from new units developed and increased service charge income.
-
58% of the increase in turnover in the year is attributable to one large provider, London and Quadrant Housing Trust. The significant increase in turnover in this provider for 2018 relates to land sales of £0.2bn. This is the main reason for the increase in other non-social housing turnover shown in the figure overleaf.
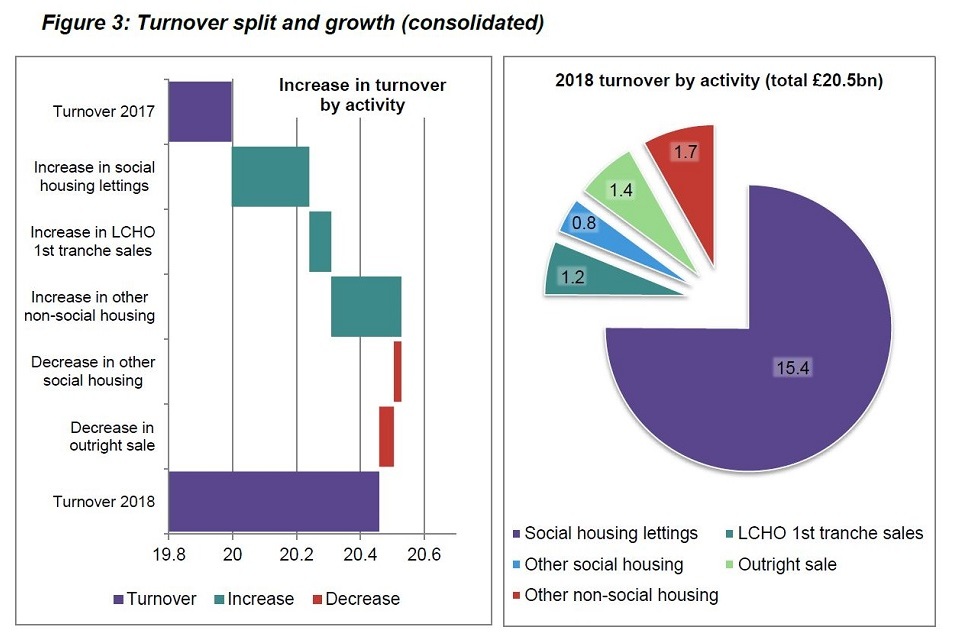
Figure 3: Turnover split and growth (consolidated)
In aggregate 75% of turnover is generated from social housing lettings (2017: 76%, 2016: 75%), the core activity of the sector. The vast majority of providers engage in non-social housing lettings activities to some extent. The degree of diversification and specialism varies across the sector by activity type.
-
13% of sector turnover relates to development for sale (including both outright sales and Low Cost Home Ownership (LCHO) 1st tranche sales). Outright sale activity is heavily concentrated with 20 providers reporting 78% of sales income. LCHO activity is slightly less concentrated with 59% of 1st tranche receipts within 20 providers.
-
8% of turnover is from other non-social activity. Of the total £1.7bn, £0.8bn is reported by three large providers; London and Quadrant, Places for People and Sanctuary. Other non-social activities include market rent, leisure facilities, property services, student accommodation, land sales and other commercial income. Each of these activities is concentrated in a relatively small selection of providers.
-
4% of turnover is from other (non-letting) social housing activities. Around half of this relates to charges for support services.
Operating margins were down across the main activities of the sector
Table 3: Operating margins by activity
| Consolidated | Entity | |||
|---|---|---|---|---|
| % | 2018 | 2017 | 2018 | 2017 |
| Operating margin | 28% | 30% | 29% | 31% |
| Social housing lettings | 33% | 34% | 32% | 34% |
| 1st tranche sales | 29% | 32% | 28% | 31% |
| Outright sale | 19% | 20% | 14% | 8% |
The overall operating margin has decreased from 30% to 28% as operating costs increased by 5% to £14.8bn.
In the 2017 Global Accounts, the first year of the general needs rent reductions, it was noted that providers had responded by scaling back on social housing letting operating costs. This has not continued in 2018 resulting in a downward movement in the operating margin from social housing lettings.
Where the acquisition method is used to account for mergers, the rent received and costs incurred prior to the acquisition date are not included in the acquirer’s financial statements. The impact of providers using the acquisition method was greater in 2017. The figures in the Table below are affected by such merger activity and by additional providers included in the dataset for the first time in 2018.
The Table below includes an estimate of the adjusted % annual change, taking merger activity and dataset population changes into account.
Table 4: SHL rent, management and maintenance costs (consolidated)
| % change adjusted | Consolidated | Entity | ||||
|---|---|---|---|---|---|---|
| % or £bn | 2018 | 2017 | 2018 | 2017 | 2018 | 2017 |
| Increase in rent receivable | 1% | 1% | 2% | 1% | 0.2 | 0.1 |
| Increase/(decrease) in management costs | 5% | (8%) | 6 % | (9%) | 0.2 | (0.2) |
| Increase/(decrease) in maintenance and expensed major repairs | 2% | (1%) | 2% | (2%) | 0.1 | (0.1) |
Including both outright sales and LCHO first tranche sales, turnover from ‘development for sale’ was stable at £2.6bn (2017: £2.6bn). The corresponding cost of sales increased by 3% to £2.0bn resulting in a fall in sales margins.
Exposure to the housing market remains a key risk
The decreased margin in ‘for sale’ activity broadly corresponds to movements in the market. Although average house prices in England increased by 4.0% between April 2017 and March 2018, there are significant regional variations which impact on the sector.
In London, average house prices fell by 0.5% and in the South East the increase was 2.9% over the year. Average construction costs on new properties increased by 4.4% over the same period. Given the regional variations and the degree of uncertainty, the housing market remains a key risk for a small number of providers with significant exposure to manage.
Despite the tightening of conditions, sales performance in the year was robust. Including proceeds from fixed asset disposals of £2.1bn, total sales income was £4.8bn (2017: £4.6bn). The sector reported a total surplus on sales of £1.6bn (2017: £1.4bn). The surplus from 1st tranche sales and properties developed for outright sale decreased by 5% and 7% respectively. This was offset by a 19% increase on the surplus from the sale of fixed assets.
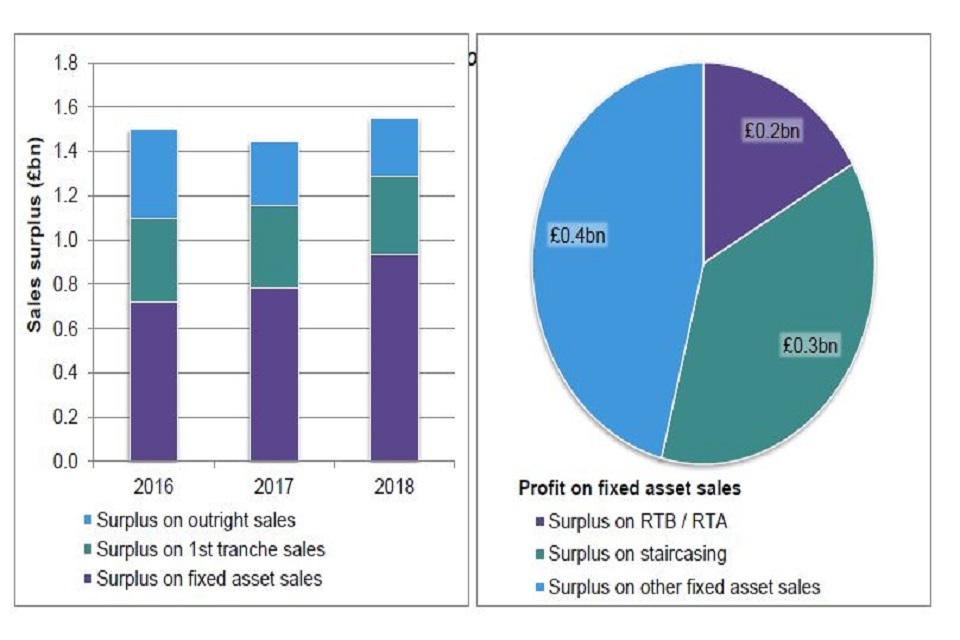
graph showing sales surplus/Profit on fixed asset sales
The profit from the sale of housing properties to existing tenants, either through Right to Buy/Right to Acquire or through the sale of subsequent tranches of LCHO properties (staircasing) increased in the year. In total, these categories of sales accounted for a profit of £0.5bn, 54% of the total profit from fixed asset sales in the year (2017: £0.4bn).The remaining 46% of the profit from fixed asset sales primarily relates to other sales of housing properties [^12] and to a lesser extent the sale of non-housing assets. The profit on other fixed asset sales increased by £0.1bn (20%) to £0.4bn in 2018.
Interest cover remains strong
Based on reported figures, interest cover increased in the year for both entity and consolidated returns. The main reason for the movement is a decrease in interest payable and finance costs. Total interest and financing costs [^13] reported have decreased by 6% from £3.7bn in 2017 to £3.5bn in 2018.
Table 5: Interest cover metrics
| Consolidated | Entity | |||
|---|---|---|---|---|
| % | 2018 | 2017 | 2018 | 2017 |
| EBITDA MRI [^14] margin | 30% | 32% | 32% | 34% |
| EBITDA MRI interest cover | 174% | 170% | 169% | 159% |
| EBITDA MRI interest cover SHL | 156% | 149% | 158% | 147% |
| Effective interest rate | 4.8% | 5.3% | 4.8% | 5.5% |
| Effective interest rate (excluding breakage costs) | 4.4% | 4.5% | 4.4% | 4.6% |
The decrease in interest cost is partially offset by the fall in margins and a slight increase in indebtedness. EBITDA MRI margin decreased from 32% in 2017 to 30% in 2018. Debt, as a multiple of turnover, increased by 2% in the year.
The decrease in interest cost is driven by breakage costs associated with refinancing activities. When breakage costs are excluded (£0.3bn in 2018 and £0.6bn in 2017), the interest cost was £3.2bn, a 2% increase on 2017. If breakage costs were adjusted out of the interest cost in both 2017 and 2018, interest cover would have actually decreased from 200% to 188% on a consolidated level.
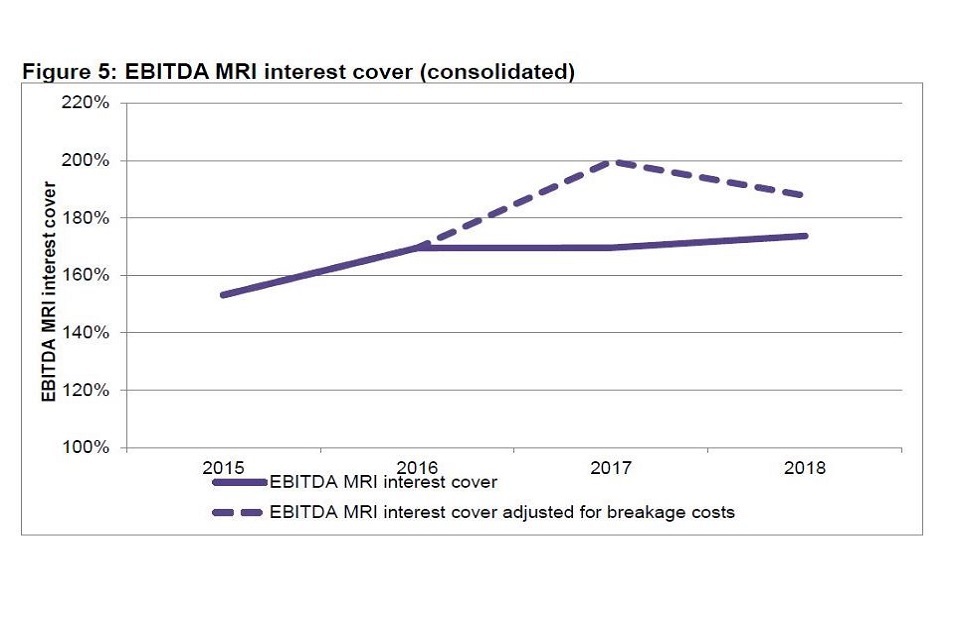
Graph showing Earnings Before Interest, Taxation, Depreciation and Amortisation with Major Repairs Included interest cover
The sector continues to report high levels of interest cover, well in excess of 150% on an EBITDA MRI basis. Strong interest cover is required to service existing debt and support continued investment. Of the 230 provider groups included in the Global Accounts, 211 have interest cover on a social housing lettings basis of greater than 100%.
Underlying surplus was consistent with the previous year
The surplus reported in 2018 was £3.7bn, a £0.4bn decrease on 2017. The net margin has decreased from 20% in 2017 to 18% in 2018.
The surplus of £4.1bn reported in 2017 included gains from business combinations of £0.6bn. Excluding these fair value (non-cash) gains from transferring entities, the ‘underlying surplus’ in 2017 was £3.5bn.

Graph showing factors driving the increase in underlying surplus (consolidated)
The underlying surplus has increased by £0.2bn to £3.7bn [^15] in 2018. There are two main factors driving the increase.
- The first is the £0.3bn reduction in finance costs. This is a result of exceptionally high breakage costs in one provider in 2017.
- The second is a £0.1bn increase in the profit realised on the sale of fixed assets.
This increase is primarily offset by a decrease in the surplus from operating activities of £0.3bn. Of this decrease, 45% is attributable to a fall in the operating surplus from social housing lettings. The period ending March 2018 represents the first time the surplus on social housing lettings has decreased, year on year, since the regulator started collecting annual accounts data in the current format in 2004.
Operating performance
Table 6: Indicators of operating performance (consolidated)
| Consolidated | Entity | |||
|---|---|---|---|---|
| % of gross rent | 2018 | 2017 | 2018 | 2017 |
| Rent loss from void properties | 1.5% | 1.5% | 1.5% | 1.5% |
| Bad debts for the year | 0.8% | 0.7% | 0.8% | 0.7% |
| Current tenant arrears | 4.4% | 4.4% | 4.3% | 4.5% |
Bad debts, void loss and current tenant arrears are key performance indicators in assessing the efficiency of lettings and rent collection. In 2018 void losses and current tenant arrears are consistent with 2017 at 1.5% and 4.4% of gross rent respectively. Bad debts have increased slightly from 0.7% of gross rent in 2017 to 0.8% in 2018.
Part B - Financial statements
Table 7: Statement of comprehensive income
| Consolidated | Entity | ||||
|---|---|---|---|---|---|
| £bn | note | 2018 | 2017 | 2018 | 2017 |
| Turnover | 2 | 20.5 | 20.0 | 18.4 | 18.0 |
| Operating expenditure | 2 | (12.6) | (12.1) | (11.8) | (11.4) |
| Cost of sales | 2 | (2.2) | (1.9) | (1.2) | (1.0) |
| Operating surplus/(deficit) | 2 | 5.6 | 5.9 | 5.3 | 5.5 |
| Gain/(loss) on disposal of fixed assets | 3 | 0.9 | 0.8 | 1.0 | 0.8 |
| Operating surplus/(deficit) including fixed asset sales | 6.6 | 6.7 | 6.3 | 6.3 | |
| Gift aid and other items | 4 | 0.1 | 0.5 | 0.3 | 0.4 |
| Interest receivable | 5 | 0.1 | 0.1 | 0.2 | 0.3 |
| Interest payable and financing costs | 5 | (3.2) | (3.5) | (3.2) | (3.6) |
| Movements in fair value | 6 | 0.1 | 0.3 | 0.1 | 0.1 |
| Surplus/(decifit) before tax | 3.7 | 4.1 | 3.8 | 3.5 | |
| Taxation | (0.0) | (0.1) | (0.0) | (0.0) | |
| Surplus/(deficit) for the period | 3.7 | 4.1 | 3.8 | 3.5 | |
| Unrealised surplus /(deficit) on revaluation of housing props | 0.0 | 0.0 | 0.0 | 0.0 | |
| Actuarial (loss) / gain in respect of pension schemes | 19 | 0.3 | (0.5) | 0.3 | (0.5) |
| Change in fair value of hedged instruments | 6 | 0.4 | 0.1 | 0.,3 | 0.2 |
| Total comprehensive income for the period | 4.4 | 3.7 | 4.4 | 3.2 |
Table 8: Statement of changes in reserves
| £bn | Income and expenditure reserves | Revaluation reserves | Other reserves | TOTAL |
|---|---|---|---|---|
| Consolidated | ||||
| Closing balance 2017 | 33.7 | 12.3 | (0.8) | 45.2 |
| Restatements | 0.3 | (0.1) | (0.2) | (0.0) |
| Balance at start of period | 34.0 | 12.2 | (1.0) | 45.2 |
| Surplus/(deficit) for the period | 3.7 | N/A | N/A | 3.7 |
| Other comprehensive income | 0.3 | 0.0 | 0.4 | 0.7 |
| Transfer from revaluation reserve | 0.1 | (0.1) | 0.0 | (0.0) |
| Other transfers | (0.1) | (0.0) | 0.0 | (0.0) |
| Closing balance 2018 | 38.0 | 12.2 | (0.6) | 49.5 |
| Entity | ||||
| Closing balance 2017 | 31.7 | 12.7 | (0.5) | 43.9 |
| Restatements | 0.1 | 0.1 | (0.2) | (0.0) |
| Balance at start of period | 31.8 | 12.8 | (0.7) | 43.9 |
| Surplus / (deficit) for the period | 3.8 | N/A | N/A | 3.8 |
| Other comprehensive income | 0.3 | 0.0 | 0.3 | 0.7 |
| Transfer from revaluation reserve | 0.1 | (0.1) | 0.0 | (0.0) |
| Other transfers | (0.0) | (0.0) | 0.0 | (0.0) |
| Closing balance 2018 | 35.9 | 12.7 | (0.4) | 48.3 |
Table 9: Statement of financial position
| Consolidated | Entity | ||||
|---|---|---|---|---|---|
| £bn | note | 2018 | 2017 | 2018 | 2017 |
| Fixed assets | |||||
| Housing properties at cost | 7 | 142.4 | 137.5 | 135.8 | 133.5 |
| Housing properties at valuation | 7 | 2.7 | 2.0 | 5.1 | 2.0 |
| Other fixed assets | 8 | 3.1 | 2.9 | 6.6 | 5.2 |
| Investment properties | 8 | 5.6 | 4.7 | 3.6 | 3.1 |
| Other investments | 8 | 1.7 | 1.7 | 2.4 | 2.9 |
| Total fixed assets | 155.4 | 148.8 | 153.5 | 146.7 | |
| Current assets | |||||
| Properties held for sale | 9 | 5.6 | 4.8 | 2.1 | 1.8 |
| Trade and other debtors | 9 | 2.1 | 2.0 | 2.2 | 2.2 |
| Cash and short-term investments | 9 | 7.1 | 6.9 | 5.7 | 5.5 |
| Other current assets | 9 | 1.6 | 2.0 | 3.6 | 3.8 |
| Total current assets | 16.3 | 15.6 | 13.6 | 13.2 | |
| Creditors: amounts falling due within one year | |||||
| Short-term loans | 11 | 1.7 | 1.5 | 1.8 | 1.6 |
| Deferred capital grant | 12 | 0.4 | 0.4 | 0.4 | 0.4 |
| Other current liabilities | 10 | 5.5 | 5.0 | 5.3 | 4.9 |
| Total creditors: due within one year | 7.6 | 6.9 | 7.5 | 6.9 | |
| Net current assets/ liabilities | 8.7 | 8.7 | 6.1 | 6.4 | |
| Total assets less current liabilities | 164.1 | 157.5 | 159.6 | 153.0 | |
| Creditors: amounts falling due after more than one year | |||||
| Long-term loans | 11 | 70.2 | 67.6 | 56.5 | 54.1 |
| Amounts owed to group undertakings | 11 | 0.0 | 0.0 | 12.4 | 12.0 |
| Finance lease obligations | 11 | 0.6 | 0.4 | 0.5 | 0.3 |
| Deferred capital grant | 12 | 35.7 | 34.9 | 34.8 | 34.2 |
| Other long-term creditors | 13 | 5.1 | 5.9 | 4.2 | 5.4 |
| Total creditors: due after more than one year | 111.5 | 108.9 | 108.5 | 106.0 | |
| Provisions for liabilities | |||||
| Pension provision | 19 | 1.9 | 2.2 | 1.7 | 2.0 |
| Other provisions | 14 | 1.2 | 1.2 | 1.1 | 1.1 |
| Total net assets | 49.5 | 45.2 | 48.3 | 43.9 | |
| Reserves | |||||
| Income and expenditure reserve | 15 | 38.0 | 33.7 | 35.9 | 31.7 |
| Revaluation reserves | 15 | 12.2 | 12.3 | 12.7 | 12.7 |
| Other reserves | 15 | (0.6) | (0.8) | (0.4) | (0.5) |
| Total reserves | 49.5 | 45.2 | 48.3 | 43.9 |
Part C – Notes to Accounts
1. Global Accounts methodology
This analysis is based on a database of information derived from housing providers’ audited financial statements. The database contains data from the annual account regulatory returns (known as FVAs) which must be submitted by providers that own or manage 1,000 or more homes. Where a provider is a parent of a group structure that produces consolidated financial statements it submits both an entity and a consolidated FVA.
These regulatory returns are aggregated to produce the Statement of Financial Position, Statement of Changes in Reserves and Statement of Comprehensive Income. Statements and notes are based on the entity dataset and consolidated dataset for 2017/18. Comparative figures for 2016/17 are also provided.
In the statements and tables included in the notes, the figures are rounded to the nearest £billion to one decimal place. This can result in rounding differences in totals as individual returns are denominated in £000s.
Aggregate SOCI
The aggregate SOCI reflects the sum of private registered provider activity for all accounting periods ending between 1 April 2017 and 31 March 2018 [^16].
Aggregate SOFP
The aggregate SOFP is the sum of individual statements where the financial year end falls within the period from 1 April 2017 to 31 March 2018 .
Additional information
Additional information is provided on other activities, selected notes to the financial statements and the number of homes in management.
Changes to FVA return
In 2018 changes were made to the FVA template in respect of social and non-social stock disclosures. Prior to 2018 providers disclosed the number of homes in management. In 2018 the template includes disclosures on units owned and / or managed, units owned but managed by another provider and units managed but owned by another provider.
Where the figures in the notes below are affected, the effect is described in the accompanying narrative.
2. Particulars of turmover, cost of sales, operating expenditure and operation surplus
2 (a) Social housing lettings
Table 10: Income and expenditure from SHL
| Consolidated | Entity | |||
|---|---|---|---|---|
| £bn | 2018 | 2017 | 2018 | 2017 |
| Income | ||||
| Rents | 13.3 | 13.1 | 13.1 | 12.9 |
| Service charge income | 1.4 | 1.3 | 1.4 | 1.3 |
| Net rental income | 14.7 | 14.4 | 14.5 | 14.1 |
| Capital grant released to income | 0.5 | 0.5 | 0.4 | 0.5 |
| Other and revenue grant | 0.2 | 0.3 | 0.2 | 0.3 |
| Turnover from SHL | 15.4 | 15.1 | 15.2 | 14.9 |
| Expenditure | ||||
| Management | 2.8 | 2.6 | 2.8 | 2.6 |
| Service charge costs | 1.6 | 1.5 | 1.6 | 1.5 |
| Routine maintenance | 1.9 | 1.9 | 1.9 | 1.9 |
| Planned maintenance | 0.8 | 0.8 | 0.8 | 0.8 |
| Major repairs expenditure | 0.5 | 0.5 | 0.5 | 0.5 |
| Bad debts | 0.1 | 0.1 | 0.1 | 0.1 |
| Depreciation of housing properties | 2.2 | 2.1 | 2.2 | 2.1 |
| Impairment of housing properties | 0.0 | 0.0 | 0.0 | 0.0 |
| Other costs | 0.3 | 0.4 | 0.4 | 0.4 |
| Expenditure on SHL | 10.3 | 10.0 | 10.3 | 9.8 |
| Operating surplus/(deficit) on SHL | 5.0 | 5.2 | 4.9 | 5.0 |
Based on consolidated returns, turnover from SHL increased by 2% to £15.4bn in 2018; the entity level total turnover figure is £15.2bn. Contributory factors to this small difference include turnover from small (fewer than 1,000 units) providers that form part of group structures and turnover from SHL activity outside England.
This was the second year of annual 1% reductions in rent charges for general needs properties and the first for supported housing units. However, this does not result in a 1% decrease in reported income from rent. Based on consolidated returns, rental income increased by £199m (1.5%).
Merger activity undertaken by providers can impact on the amount of rental income reported in their financial statements. Where the acquisition method is used, the rent received prior to the acquisition date is not included in the acquirer’s financial statements. This had a particular impact on the 2017 returns where two large providers used the acquisition method in respect of merger activity. There was a much smaller effect in 2018 which contributes to the increase in the year.
An increase in the number of providers owning more than 1,000 units (and therefore included in the Global Accounts dataset) also contributes towards the increase in the year. In both the consolidated and entity returns, £38m of the increase in rental income relates to the four new providers joining the data set.
Adjusting for the impact of merger activity and additional providers, the increase in rent is approximately £98m (less than 1%). There are a number of contributory factors, which in combination explain the difference between the 1% rent reduction and the slight increase in rent reported in the year.
- A net increase in the number of rental units held by the sector. In 2018 30,000 units were developed for rent (excluding LCHO) and 13,000 sold or demolished.
- Almost all of the rental units sold or demolished had been previously let at social rent.
- Of the new units developed, approximately 19,000 (65%) were let at the higher Affordable Rent rate.
- In 2018, approximately 10,000 units were converted from social rent to Affordable Rent.
- Aspects of the rules relating to the rent reduction are complex. They include an absolute exception for units designated as specialist supported housing and temporary social housing. In addition, for new tenancies rents may be reset at the social rent rate defined in the act.
- The permitted increase for the rental element of LCHO units was 2.5% (RPI 2.0% in September 2016 [^17] plus 0.5%).
The regulator collects and monitors actual rents charged by providers through the Statistical Data Return. The SDR 2017 to 2018 shows that providers have implemented the social rent reductions since the rent reduction policy came into effect and that general needs rents have fallen accordingly.
Based on consolidated returns, service charges increased by £94m (7%). The ratio of service charge income to service costs was 85.2%; this was an improvement on the equivalent figure for 2017 (84.7%).
Total expenditure on SHL increased by 4% (£0.4bn) to £10.3bn. Expenditure on all cost lines with the exception of ‘other’ increased in cash terms. The total amount of impairment reported increased by 38% to £49 million. Only 44 providers reported impairment with the largest ten accounting for 85% of the total.
Following cash and per-unit decreases in 2017, expenditure on both management costs and expensed major repairs increased in 2018. Management costs increased by £152m (6%) and major repairs increased by £20m (4%). On a per-unit basis these increases were 5% and 3% respectively.
The operating surplus from SHL has decreased by £122m to £5.0bn; the operating margin on this basis has decreased from 34% in 2017 to 33% in 2018. The results on an entity basis are not materially different.
2 (b) Other social housing activities
Table 11: Other social housing activities
| Consolidated | Entity | |||
|---|---|---|---|---|
| £bn | 2018 | 2017 | 2018 | 2017 |
| First tranche LCHO sales | ||||
| Turnover | 1.2 | 1.2 | 1.2 | 1.2 |
| Expenditure/Cost of sales | 1.0 | 0.9 | 1.0 | 0.9 |
| Surplus | 0.4 | 0.4 | 0.3 | 0.4 |
| Other social housing activities | ||||
| Turnover | 0.8 | 0.8 | 0.9 | 0.8 |
| Expenditure/Cost of sales | 1.0 | 0.9 | 1.0 | 0.9 |
| Surplus | (0.2) | (0.1) | (0.1) | (0.1) |
| Total | ||||
| Turnover | 2.0 | 2.0 | 2.1 | 1.9 |
| Expenditure/Cost of sales | 1.9 | 1.7 | 1.9 | 1.7 |
| Surplus | 0.2 | 0.3 | 0.2 | 0.3 |
There is very little difference between the consolidated group and entity returns in relation to the sale of first tranche shared ownership units. Turnover based on consolidated returns has increased by £68m to £1,239m in 2018. The operating margin has fallen from 32% to 29% and the surplus has decreased by £17m to £357m.
Over 70% of providers submitting returns reported shared ownership sales income in the year. However, sales are concentrated in a small number of providers, with almost 60% of turnover attributable to 20 providers.
Based on consolidated returns, the income from other non-letting social housing activity has decreased by 3% to £0.8bn. The loss reported on other social activities has increased from £115m in 2017 to £178m in 2018. Based on entity returns, a loss of £88m was reported in 2018. The entity returns included intra-group donations in one provider of £52m. Intra-group transactions are eliminated in consolidated returns.
Other social housing activity includes income and expenditure relating to support services. The sector reported a loss on social housing support activity of £13m in consolidated returns (2017, £38m loss). Support service income is concentrated in a small number of providers with almost 80% of total turnover reported by 20 providers. These providers face additional challenges in competing for care and support contracts from local authorities and other public bodies.
The remainder of other social housing activities includes community and neighbourhood activities, development and management services and a range of other activities. For these activities, the sector reported a loss of £165m (2017: £77m loss) in consolidated returns.
2 (c) Non-social housing activities
Table 12: Non-social housing activities
| Consolidated | Entity | |||
|---|---|---|---|---|
| £bn | 2018 | 2017 | 2018 | 2017 |
| Properties developed for sale | ||||
| Turnover | 1.4 | 1.4 | 0.2 | 0.2 |
| Expenditure/Cost of sales | 1.1 | 1.1 | 0.2 | 0.2 |
| Surplus | 0.3 | 0.3 | 0.0 | 0.0 |
| Other non-social housing activities | ||||
| Turnover | 1.7 | 1.4 | 0.9 | 0.9 |
| Expenditure/Cost of sales | 1.5 | 1.2 | 0.8 | 0.7 |
| Surplus | 0.2 | 0.2 | 0.1 | 0.2 |
| Total | ||||
| Turnover | 3.0 | 2.9 | 1.1 | 1.2 |
| Expenditure/Cost of sales | 2.6 | 2.4 | 0.9 | 1.0 |
| Surplus | 0.4 | 0.5 | 0.1 | 0.2 |
Outright sale activity is typically undertaken in non-registered entities and is therefore reported in consolidated but not entity returns. The turnover from outright sales decreased by £46m (3%) to just under £1.4bn. The surplus decreased by £20m to £266m and the margin fell from 20% to 19%. The development of properties for market sale is concentrated in a small number of providers, with 78% of the turnover attributable to 20 providers.
Some providers deliver units for outright sale through joint ventures. Income and expenditure from outright sale activity undertaken in joint ventures is not reported separately. The net surplus from joint ventures is included in the income statement under “Gift Aid and other items” (see note 4).
In total the turnover from other non-social activity was £1.7bn, a 15% increase on 2017. Of the total £1.7bn turnover attributable to other non-social income, £0.8bn is reported by just three large providers. The activities of these three providers vary. London and Quadrant’s other non-social turnover relates primarily to land sales; Places for People’s reported income is attributable to leisure facilities management and property management services; and Sanctuary specialise in the provision of student accommodation and nursing homes.
Despite the increase in turnover from other non-social activity, the attributable surplus decreased from £211m in 2017 to £160m in 2018. The surplus from market rent decreased slightly from £115m in 2017 to £101m in 2018 as did the surplus on student accommodation (2017: £30m and 2018: £28m).
The remaining balance of other non-social activities includes a wide range of activities; notably, the provision of care and nursing homes, energy related services, property management services, leaseholder income, and commercial property revenues. On these activities the surplus reduced from £66m in 2017 to £31m in 2018. The 2017 surplus included exceptional items of income in two providers relating to an insurance claim and a revaluation movement.
3. Disposal of fixed assets
Table 13: Disposal of fixed assets
| Consolidated | Entity | |||
|---|---|---|---|---|
| £bn | 2018 | 2017 | 2018 | 2017 |
| Staircasing | ||||
| Proceeds | 0.8 | 0.7 | 0.8 | 0.7 |
| Costs of sale | 0.4 | 0.4 | 0.4 | 0.4 |
| Surplus | 0.3 | 0.3 | 0.3 | 0.3 |
| RTB/RTA | ||||
| Proceeds | 0.4 | 0.4 | 0.4 | 0.4 |
| Costs of sale | 0.2 | 0.3 | 0.2 | 0.3 |
| Surplus | 0.2 | 0.1 | 0.2 | 0.1 |
| Other fixed asset sales | ||||
| Proceeds | 1.0 | 0.9 | 1.2 | 1.1 |
| Costs of sale | 0.6 | 0.5 | 0.7 | 0.7 |
| Surplus | 0.4 | 0.4 | 0.5 | 0.4 |
| Total | ||||
| Proceeds | 2.1 | 2.0 | 2.3 | 2.2 |
| Costs of sale | 1.2 | 1.2 | 1.3 | 1.3 |
| Surplus | 0.9 | 0.8 | 1.0 | 0.8 |
Based on consolidated returns, total fixed asset sales during the year generated a surplus of £0.9 billion from proceeds of £2.1 billion. The surplus increased by 19% compared to 2017 and sales proceeds by 6%.
Proceeds from ‘Right to Buy / Right to Acquire’ increased slightly to £372m. The surplus from the sale of RTB / RTA properties increased by £46m (41%) to £156m in 2018. This follows on from a similar increase in 2017, when the surplus from RTB / RTA sales increased by £46m to £111m.
Receipts from staircasing sales have increased by 5% to £0.8bn and now account for more than one third of all fixed asset disposal proceeds. The remainder of fixed asset disposals generated proceeds of £1.0bn, a 9% increase on 2017. This includes stock rationalisation, the sale of void properties and to lesser extent the sale of non-social housing assets.
Asset sales taking place within the same group are eliminated on consolidation. This means that the entity totals are greater than the consolidated totals in respect of sales to other registered providers.
4. Gift Aid and other items
Table 14: Gift Aid and other items
| Consolidated | Entity | |||
|---|---|---|---|---|
| £bn | 2018 | 2017 | 2018 | 2017 |
| Gift Aid | 0.0 | 0.0 | 0.3 | 0.3 |
| Other items | 0.0 | 0.5 | 0.0 | 0.1 |
| Share of operating surplus JV | 0.1 | 0.1 | 0.0 | 0.0 |
| Total | 0.1 | 0.5 | 0.3 | 0.4 |
Gift Aid receipts in entity returns totalled £322m in 2018, a small increase on the £312m reported in 2017. The Gift Aid receipts in entity returns reflect non-social housing activity carried out by the non-registered entities within group structures. There is a strong correlation between Gift Aid received in the entity returns and surplus on properties developed for sale in non-registered entities within consolidated returns.
‘Other items’ includes gains resulting from business combinations where the acquisition method of accounting has been used [^19]. In 2017 this included a £551m gain, largely attributable to the merger between London and Quadrant and East Thames Group. In 2018, merger activity has not occurred on the same scale. Based on consolidated returns, the net gain on business combinations is £23m and the comparable figure from entity returns is £34m.
Providers account for activity undertaken in joint ventures using ‘equity’ accounting principles. In the SOCI, income and expenditure are not reported separately. The net surplus from joint ventures is included as a separate line item.
The net surplus from joint ventures has increased by £30m to £84m in 2018. More than two thirds of this figure is attributable to just two providers, London and Quadrant and A2 Dominion.
The vast majority of the surplus from joint ventures is generated through the provision of homes for outright sale. The turnover associated with the net surplus figure is not included in financial statements. Based on information available from other regulatory returns, outright sales income of £0.4bn underpins the net surplus on joint ventures reported in the year.
5. Interest payable and finance costs
Total interest and finance costs have decreased by 8% from £3.5bn in 2017 to £3.2bn in 2018. The decrease is attributable to breakage costs associated with refinancing activities. In 2017, there were exceptionally high breakage costs associated with refinancing in one large provider group. In 2018, a number of providers have reported less significant breakage costs. Based on consolidated returns, total breakage costs included in interest payable and other finance costs are £259m (2017: £558m). In Table 15, below, the breakage costs are included in ‘other amounts payable’.
Table 15: Interest and finance costs
| Consolidated | Entity | |||
|---|---|---|---|---|
| £bn | 2018 | 2017 | 2018 | 2017 |
| Interest payable on liabilities | 3.1 | 3.0 | 3.0 | 2.9 |
| Defined benefit pension charges | 0.1 | 0.1 | 0.0 | 0.1 |
| Other amounts payable | 0.3 | 0.7 | 0.4 | 0.8 |
| Less: interest capitalised in housing properties | (0.3) | (0.2) | (0.2) | (0.2) |
| Total interest payable and financing costs | 3.2 | 3.5 | 3.2 | 3.6 |
Interest payable on liabilities has increased by £116m (4%). Capitalised interest has increased from £236m in 2017 to £290m in 2018. Other amounts payable also includes amortisation of loan premium and arrangement costs, accruals on Disposal Proceeds Fund, Recycled Capital Grant Fund and any other finance costs.
6. Movements in fair value and re-measurement
Movements in the fair value of investment properties
Properties held for market rent and other properties held for a non-social housing purpose are categorised as investment properties. They are re-measured annually at their fair value and any change in fair value is reported in the surplus for the year.
Based on consolidated returns, the fair value of investment properties held by the sector increased by £148m on re-measurement (2017: £241m). The figure based on the entity returns was £85m; the smaller increase reflecting the extent to which market rent properties are held by non-registered entities within group structures.
Movements in the fair value of financial instruments
Interest rate swaps and a minority of loans are classified as ‘non-basic’ or ‘other’ financial instruments under applicable accounting standards [^20] and as such are subject to annual fair value measurement. The movement in fair value of interest swaps held by providers is reported above or below the surplus in the SOCI depending on whether hedge accounting has been applied [^21]. Based on consolidated returns, the movement in the fair value of non-hedged financial instruments was not material.
In respect of hedged financial instruments, the fair value adjustment on interest rate swaps correlates with the movement in swap rates. Swap rates increased in the year, for example the 15 year swap rate increased from 1.37% in April 2017 to 1.57% in March 2018. Providers reported a positive movement on the fair value of hedged financial instruments of £374m in other comprehensive income. The aggregate mark-to-market exposure decreased from £2.7bn at the beginning of the year to £2.2bn at the end of March 2018 according to our Quarterly Survey results.
7. Fixed asset - housing properties
Table 16: Fixed asset housing properties
| £bn | Consolidated | Entity |
|---|---|---|
| Housing properties at cost or valuation | ||
| Properties held at cost | 154.0 | 150.0 |
| Properties held at valuation | 2.7 | 2.7 |
| Total properties held at start of period | 156.7 | 152.7 |
| #Additions | ||
| Additions (new properties) | 7.3 | 7.1 |
| Additions (existing properties) | 1.7 | 1.6 |
| Disposals | (1.4) | (1.4) |
| Transfers | (0.5) | (0.6) |
| Total properties held at end of period | 164.1 | 159.7 |
| Depreciaton and impairment | ||
| #Total depreciation and impairment at start of period | 17.4 | 17.1 |
| Depreciation and impairment changed in period | 19.1 | 18.9 |
| Released on disposal | (0.3) | (0.3) |
| Revaluation and other | (0.2) | (0.1) |
| Total depreciation and impairment at end of period | 19.1 | 18.9 |
| Net book value at end of period | 145.0 | 140.9 |
| Net book value at start of period | 139.3 | 135.6 |
At a consolidated level, the gross book value of properties increased by £7.5bn in the year to a total of £164.1bn at March 2018. Movements during the year included:
- £9.0bn of investment in the properties including £7.3bn in new supply
- £0.5bn from transfers, including inter group transfer and mergers
- Stock disposals with a book value of £1.4bn
- Revaluation and other movements resulting in a reduction of £0.5bn
A net total of £1.8bn was added to the sector’s total depreciation and impairment balance during the year, resulting in a net book value of £145.0bn. This represents an increase of £5.7bn (4%) during the year.
8. Other fixed assets and investments
Table 17: Other fixed assets
| Consolidated | Entity | |||
|---|---|---|---|---|
| £bn | 2018 | 2017 | 2018 | 2017 |
| Amounts owned by group | 0.0 | 0.0 | 3.8 | 2.6 |
| Tangible fixed assets: other | 2.1 | 1.8 | 1.9 | 1.6 |
| HomeBuy loans receivable | 0.8 | 0.9 | 0.8 | 0.8 |
| Intangible fixed assets and goodwill | 0.2 | 0.2 | 0.1 | 0.1 |
| Total | 3.1 | 2.9 | 6.6 | 5.2 |
Based on consolidated returns, other fixed assets were valued at £3.1bn and are made up primarily of tangible fixed assets other than housing properties (68%), which includes items such as office buildings and IT equipment.
At the entity level the total is £6.6bn and includes £3.8bn owed by group undertakings. This amount has increased by £1.2bn (46%) since 2017 and is largely (91%) attributable to ten providers reporting balances of more than £50m.
Table 18: Investments
| Consolidated | Entity | |||
|---|---|---|---|---|
| £bn | 2018 | 2017 | 2018 | 2017 |
| Investment properties | 5.6 | 4.7 | 3.6 | 3.1 |
| Investment in joint ventures | 1.0 | 0.7 | 0.1 | 0.1 |
| Investment in associates | 0.1 | 0.1 | 0.5 | 0.3 |
| Other investments | 0.7 | 1.0 | 1.8 | 2.6 |
| Total | 7.3 | 6.4 | 6.0 | 6.0 |
The value of investment properties reported in consolidated group accounts increased by £0.9bn (18%) to £5.6bn in 2018. This consists of both housing properties developed for market rent and commercial properties. It is heavily concentrated within a small number of providers. Just 20 groups reported more than 80% of the sector total.
Investment in joint ventures increased by £0.3bn (40%) to £1.0bn. There were a total of 42 groups which reported investments in joint ventures with one large provider accounting for 46% of the sector total. The value of investment properties and investment in joint ventures is markedly lower in the entity level accounts as much of this activity is managed through non-registered entities.
The combination of investment in associates and other investments in the entity level accounts decreased by £0.5bn (18%). The balances reported are greater in the entity accounts as they include investments related to other entities within group structures. The reduction in other investments is primarily due to one large provider re-stating £0.3bn to the ‘amounts owed by group undertakings’ disclosure (see Table 17).
In the entity level accounts, two large providers report more than £200m each in the other investments disclosure, together accounting for 43% (£0.8bn) of the sector total. These amounts consist primarily of investments in related undertakings.
9. Current assets
Total current assets held by consolidated groups increased by 4% to £16.3bn. At entity level total current assets increased by 3% to £13.6bn.
Table 19: Total current assets
| Consolidated | Entity | |||
|---|---|---|---|---|
| £bn | 2018 | 2017 | 2018 | 2017 |
| Properties held for sale | 5.6 | 4.8 | 2.1 | 1.8 |
| Trade and other debtors | 2.1 | 2.0 | 2.2 | 2.2 |
| Cash and short-term investments | 7.1 | 6.9 | 5.7 | 5.5 |
| Other current assets | 1.6 | 2.0 | 3.6 | 3.8 |
| Total current assets | 16.3 | 15.6 | 13.6 | 13.2 |
The total value of properties held for sale is greater at consolidated level (£5.6bn compared to £2.1bn in entity returns), reflecting market sale developments undertaken by unregistered entities. In comparison to 2017, properties held for sale increased by £0.8bn (16.5%).
Around 80% of the balance disclosed in 2018 is attributable to land and properties under construction rather than unsold completed properties. Properties held for sale are concentrated in a small group of providers. Together, the top 20 providers account for 76% of the sector total.
Table 20: Cash and short-term investments
| Consolidated | Entity | |||
|---|---|---|---|---|
| £bn | 2018 | 2017 | 2018 | 2017 |
| Cash and cash equivalents | 6.1 | 5.7 | 5.0 | 4.7 |
| Short-term investments | 1.0 | 1.2 | 0.7 | 0.9 |
| Total | 7.1 | 6.9 | 5.7 | 5.5 |
Based on consolidated returns, cash and short-term investments increased by £0.2bn to £7.1bn. Cash held by the sector increased by 6% to £6.1bn. Short-term investments reported by the sector decreased by 16% to £1.0bn.
Table 21: Other current assets
| Consolidated | Entity | |||
|---|---|---|---|---|
| £bn | 2018 | 2017 | 2018 | 2017 |
| Amounts owed by group undertakings | 0.0 | 0.0 | 2.1 | 2.1 |
| Refurbishment obligations | 0.8 | 0.9 | 0.8 | 0.9 |
| Other | 0.8 | 1.0 | 0.7 | 0.8 |
| Total | 1.6 | 2.0 | 3.6 | 3.8 |
Amounts owed by group undertakings make up 59% of other current assets in entity level accounts and showed a 3% increase during the year. These assets are eliminated on consolidation in group accounts. At consolidated level, refurbishment obligations decreased by 18% to £0.8bn.
Table 22: Other current liabilities
| Consolidated | Entity | |||
|---|---|---|---|---|
| £bn | 2018 | 2017 | 2018 | 2017 |
| Trade creditors | 0.6 | 0.6 | 0.4 | 0.4 |
| Rent and service charges received in advance | 0.4 | 0.4 | 0.5 | 0.4 |
| Amounts owed to group undertakings | 0.0 | 0.0 | 1.2 | 1.1 |
| RCGF and DPF | 0.4 | 0.3 | 0.4 | 0.3 |
| Accruals and deferred income | 2.5 | 2.3 | 1.7 | 1.6 |
| Pension deficit contribution liability | 0.1 | 0.1 | 0.1 | 0.1 |
| Other | 1.4 | 1.4 | 1.1 | 1.1 |
| Total | 5.5 | 5.0 | 5.3 | 4.9 |
The total amount of other current liabilities declared in the consolidated group accounts increased by £0.5bn (9%) to £5.5bn. At the entity level the total amount was £5.3bn, representing an increase of 8% in the year. In both sets of accounts the largest item is accruals and deferred income representing 46% of the consolidated group and 32% of the entity total.
Amounts owed to group undertakings make up 23% of the total in the entity level accounts and showed an 11% (£0.1bn) increase during the year. These liabilities are eliminated on consolidation in group accounts.
11. Debt
Total debt held by the sector at consolidated level increased by £3.0bn (4%) to £72.5bn. In entity returns, debt increased by £3.3bn (5%) to £71.2bn.
Table 23: Debt
| Consolidated | Entity | |||
|---|---|---|---|---|
| £bn | 2018 | 2017 | 2018 | 2017 |
| Short-term loans | 1.7 | 1.5 | 1.8 | 1.6 |
| Long-term loans | 70.2 | 67.6 | 56.5 | 54.1 |
| Amounts owed to group undertakings | 0.0 | 0.0 | 12.4 | 12.0 |
| Financial lease obligations | 0.6 | 0.4 | 0.5 | 0.3 |
| Total | 72.5 | 69.6 | 71.2 | 67.9 |
The greater increase in entity returns is attributable to a £0.4bn increase in lending between entities within group structures. In total, entity returns include £12.4bn of debt owed to group undertakings. A number of large groups arrange finance using treasury vehicles that borrow funds on behalf of the group to on-lend to group members.
Short-term loans have increased by £0.2bn to £1.7bn. Refinancing risk can be expressed in terms of the percentage of loans that are due to be repaid within one year. Loans repayable within one year represented 2% of outstanding debt (2017: 2%).
12. Capital grant
At consolidated group level, the total capital grant reported in the SOFP has increased by £0.8bn from £35.3bn in 2017 to £36.0bn in 2018. The increase in the year includes the following:
- In 2018 government grant of £436m was amortised and recognised in income. The majority of housing properties are held at cost with deferred capital grant being held as a creditor in the SOFP and released to income over the useful life of the asset (the accrual model).
- A further £20m was released to income under the performance model, where providers hold properties at valuation and recognise grant as income on scheme completion.
- In 2018 a small number of providers restated figures and changes to the dataset also affected aggregate levels of grant disclosed as a creditor. New grant (grant received net of repayments) in the year was approximately £1bn.
13. Other long-term creditors
Table 24: Other long-term creditors
| Consolidated | Entity | |||
|---|---|---|---|---|
| £bn | 2018 | 2017 | 2018 | 2017 |
| Fair value derivative financial instruments | 2.4 | 2.8 | 1.8 | 2.5 |
| HomeBuy Grant | 0.6 | 0.7 | 0.5 | 0.6 |
| RCGF | 0.8 | 0.8 | 0.7 | 0.8 |
| DPF | 0.1 | 0.1 | 0.1 | 0.1 |
| Pension deficit contribution liability | 0.4 | 0.5 | 0.4 | 0.4 |
| Other | 0.9 | 1.0 | 0.7 | 1.0 |
| Total | 5.1 | 5.9 | 4.2 | 5.4 |
A total of 45 consolidated groups disclosed derivative financial instruments at fair value as a long-term creditor. These are providers that have utilised standalone interest rate swaps to fix the interest payable on variable rate debt, where the value of the cash flows due to the counterparty are greater than those due to the provider. Of these providers, ten disclosed a value in excess of £70m, together accounting for 58% of the sector total.
14. Provisions
The provision reported in respect of pension liabilities is covered in Note 19 Pensions.
Based on consolidated returns, other provisions disclosed by the sector decreased by 7% to £1.2bn. Of this, £0.8bn relates to obligations to undertake refurbishment work where a stock transfer provider has entered into an agreement with a local authority. Providers must recognise both a payment in advance (creditor) and a prepayment (debtor). The latter is reported within current assets – see Table 21 ‘other current assets’.
15. Reserves
The total reserves within the consolidated group accounts increased by 10% during the year to £49.5bn (entity: 10%, £48.3bn). The majority of this relates to the annual surplus recognised in the year.
Based on consolidated returns, the income and expenditure reserves increased by 13% to £38.0bn. The revaluation reserve decreased by 1% to £12.2bn. A small unrealised surplus on the revaluation of housing properties of £33m was more than offset by the release of revaluation reserve following the disposal of fixed asset housing properties.
Other reserves, as reported in the SOFP (Table 9), are further broken down in Table 25 below.
Table 25: Other reserves
| Consolidated | Entity | |||
|---|---|---|---|---|
| £bn | 2018 | 2017 | 2018 | 2017 |
| Restricted reserves | 0.1 | 0.6 | 0.1 | 0.6 |
| Cash flow hedge reserves | (1.2) | (1.5) | (0.9 ) | (1.2) |
| Other reserves | 0.4 | 0.1 | 0.5 | 0.1 |
| Total | (0.6) | (0.8) | (0.4) | (0.5) |
In the majority of cases where providers have applied hedge accounting in respect of interest rate swaps, a negative hedge reserve is recognised. The aggregate cash flow hedge reserve reported by the sector decreased by £0.3bn. This is commensurate with the increase in the fair value of hedged financial instruments reported in other comprehensive income (see note 6).
Reserves are not ‘cash backed’ as the surpluses transferred to the SOFP are reinvested in providers’ businesses, including major repairs of existing stock and the development of new homes.
Table 26: Operating leases
| £bn | Consolidated | Entity |
|---|---|---|
| Amounts payable not later than one year | 0.2 | 0.2 |
| Amounts payable not later than one year | 0.4 | 0.4 |
| Amounts payable later than five years | 1.2 | 1.2 |
| Total | 1.8 | 1.7 |
Additional disclosures have been added to the data collection template to capture amounts payable under operating leases. Where providers enter into an operating lease, the future obligation is not disclosed in the Statement of Financial Position. They are however, required to disclose, as a note to the financial statements, the minimum payments that the entity is committed to make in the relevant time bands according to when the lease commitment expires.
Of the total £1.8bn disclosed, 72% is reported by 10 providers with operating lease commitments in excess of £35m each.
17. Capital commitments
As a note to published accounts, providers must disclose the value of contracts for capital expenditure that are not provided for in the primary financial statements. In addition they must also disclose the value of capital expenditure that has been approved by the board but not contracted for.
Table 27: Capital commitments
| Consolidated | Entity | |||
|---|---|---|---|---|
| £bn | 2018 | 2017 | 2018 | 2017 |
| Expenditure contracted but not accounted for | 12.4 | 12.2 | 10.0 | 9.6 |
| Expenditure approved but not contracted for | 16.2 | 12.3 | 12.5 | 9.5 |
| Total | 28.6 | 24.5 | 22.4 | 19.1 |
Based on consolidated returns future capital expenditure contracted for has increased by 2% to £12.4bn. The value of capital expenditure approved but not yet contracted for has increased by 32% to £16.2bn. Future capital expenditure commitments are concentrated in several large provider groups. More than 45% of the £28.6bn commitment is reported by 10 providers.
Providers are also required to indicate how the proposed expenditure will be financed - Accounting Direction 2015 paragraph 32. In the majority of cases, providers have identified undrawn debt facilities and future surpluses as the main sources of funding.
18. Units
Table 28: Social housing units owned and/or managed
| Unit numbers (000s) | Consolidated | Entity |
|---|---|---|
| Closing units managed | 2,761 | 2,717 |
| Adjustments to FVA return | (80) | (51) |
| Opening units managed and/or owned | 2,681 | 2,666 |
| Units developed | 42 | 42 |
| Units sold/demolished | (16) | (16) |
| Transfers and other | 5 | 7 |
| Closing units managed and/or owned | 2,712 | 2,699 |
In 2017, providers disclosed social homes in management. This included social leasehold units, where the provider has sold a leasehold interest (e.g. under the Right to Buy or 100% staircased LCHO) to a residential occupier but retains an interest (freehold or leasehold) of its own.
In 2018 changes were made to the FVA template in respect of social housing stock. Providers reported social homes that are either managed and / or owned. The template was also amended to exclude social leasehold units. The net impact of these changes was to reduce the opening social units managed by 80,000 based on consolidated returns and by 51,000 based on entity returns.
The number of social units developed increased from 41,000 in 2017 to 42,000 in 2018. Net of sales, demolitions and transfers the number of social homes owned and or managed increased by 31,000 to 2,712,000 [^24].
Table 29: Non-social homes in management
| Non-social units (000s) | Consolidated | Entity |
|---|---|---|
| Opening units | 94 | 42 |
| New units developed or acquired | 3 | 2 |
| Units sold/demolished | (0) | (0) |
| Transfers and other | 6 | (0) |
| Closing units | 103 | 43 |
The number of non-social homes in management in consolidated returns is greater than based on aggregate entity returns. This reflects the extent to which non-social activity is delivered within non-registered entities within group structures.
Based on consolidated returns, 3,000 new non-social rent units were developed in the year. The total number of non-social homes owned and or managed by the sector increased by 9,000 to 103,000.
In addition to the note on non-social housing units, the FVA template includes disclosures relating to the number of outright sale units developed and sold. Based on consolidated returns, 4,400 new outright sale units were completed in the year. Just 15 providers developed more than 100 outright sales units. This group were responsible for 78% of the total outright sale units supplied by the sector.
19. Pensions
The actuarial gain or loss on pension assumptions has changed year on year. In 2017, based on consolidated returns, the sector reported an actuarial loss of £0.5bn. In 2018, the sector reported an actuarial gain of £0.3bn. In aggregate, at consolidated level, pension provision for liabilities decreased by £0.3bn to £1.9bn (2017: £2.2bn).
The change results from movements in underlying actuarial assumptions. These include projected changes in inflation, the rate of increase in the level of pensions paid, of salaries and a discount rate linked to gilts, plus mortality assumptions in relation to how long a pension is expected to be paid. In 2018, changes to assumptions, particularly lower inflation, served to decrease pension liabilities and resulted in the actuarial gain for the year.
A number of providers participating in the Social Housing Pension Scheme (SHPS) disclose a pension deficit contribution liability as a creditor (see tables 21 and 23). In total, a balance of £0.5bn was reported in creditors in respect of deficit contribution liabilities (2017: £0.6bn).
© RSH copyright 2018
This publication is licensed under the terms of the Open Government Licence v3.0 except where otherwise stated. Where we have identified any third party copyright information you will need to obtain permission from the copyright holders concerned.
Any enquiries regarding this publication should be sent via enquiries@rsh.gov.uk or call 0300 124 5225 or write to:
Regulator of Social Housing
Level 2
7-8 Wellington Place
Leeds LS1 4AP