November 2015 Market Trend Data
Land Registry's monthly Market Trend Data for residential property prices in England and Wales.
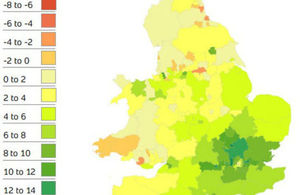
Land Registry Heatmap
The November data shows an annual price increase of 5.6 per cent which takes the average property value in England and Wales to £186,325. Monthly house prices up 0.4 per cent since October 2015.
The regional data indicates that:
- London experienced the greatest increase in its average property value over the last 12 months with a movement of 11.2 per cent
- London also experienced the greatest monthly growth with an increase of 1.6 per cent
- Both Yorkshire and The Humber and the North East saw the lowest annual price growth with increases of 1.3 per cent
- Yorkshire and The Humber also saw the most significant monthly price fall with a decrease of 0.9 per cent.
Sales and repossessions during September 2015, the most up-to-date figures available, show that:
- the number of completed house sales in England & Wales decreased by 8 per cent to 72,397 compared with 78,877 in in September 2014
- the number of properties sold in England and Wales for over £1 million increased by 1 per cent to 1,273 from 1,265 a year earlier
- repossessions in England and Wales decreased by 45 per cent to 406 compared with 733 in September 2014
- the region with the greatest fall in the number of repossession sales was the East with a decrease of 64 per cent from September 2014.
Access the full November HPI report
Price change by region
| Region | Monthly change since October 2015 | Annual change since November 2014 | Average price November 2015 |
|---|---|---|---|
| London | 1.6% | 11.2% | £506,724 |
| North East | 1.3% | 1.3% | £100,046 |
| Wales | 1.2% | 3.7% | £122,433 |
| East | 1.0% | 9.8% | £214,491 |
| South East | 0.4% | 8.0% | £258,137 |
| England and Wales | 0.4% | 5.6% | £186,325 |
| South West | 0.1% | 5.6% | £194,809 |
| North West | 0.0% | 3.1% | £115,491 |
| West Midlands | -0.3% | 2.9% | £140,772 |
| East Midlands | -0.7% | 4.1% | £136,893 |
| Yorks and Humber | -0.9% | 1.3% | £122,183 |
Average price by property type 2015 to 2014
| Average price by property type (England and Wales) | November 2015 | November 2014 | Difference |
|---|---|---|---|
| Detached | £292,778 | £276,600 | 5.8% |
| Semi-detached | £177,022 | £167,764 | 5.5% |
| Terraced | £140,253 | £133,293 | 5.2% |
| Flat/maisonette | £177,601 | £168,055 | 5.7% |
| All | £186,325 | £176,464 | 5.6% |
Sales volumes 2014 to 2013
| Month | Sales 2014 England and Wales | Sales 2013 England and Wales | Difference |
|---|---|---|---|
| January | 65,226 | 43,414 | 50% |
| February | 65,042 | 45,295 | 44% |
| March | 67,367 | 54,759 | 23% |
| April | 70,302 | 51,073 | 38% |
| May | 77,537 | 66,385 | 17% |
| June | 80,873 | 66,194 | 22% |
| July | 84,724 | 73,766 | 15% |
| August | 87,904 | 79,525 | 11% |
| September | 78,877 | 69,754 | 13% |
| October | 86,414 | 76,705 | 13% |
| November | 73,217 | 82,893 | -12% |
| December | 78,053 | 79,647 | -2.0% |
| Total | 915,536 | 789,410 | 16% |
Sales volumes 2015 to 2014
| Month | Sales 2015 England and Wales | Sales 2014 England and Wales | Difference |
|---|---|---|---|
| January | 56,790 | 65,226 | -13% |
| February | 57,870 | 65,042 | -11% |
| March | 65,224 | 67,367 | -3.0% |
| April | 62,281 | 70,302 | -11% |
| May | 71,696 | 77,537 | -8.0% |
| June | 79,936 | 80,873 | -1.0% |
| July | 87,302 | 84,724 | 3.0% |
| August | 77,623 | 87,904 | -12% |
| September | 72,397 | 78,877 | -8.0% |
Repossessions by region 2015 to 2014
| Repossessions by region | September 2015 | September 2014 | Difference |
|---|---|---|---|
| East | 20 | 56 | -64% |
| East Midlands | 32 | 68 | -53% |
| London | 26 | 50 | -48% |
| North East | 18 | 24 | -25% |
| North West | 128 | 174 | -26% |
| South East | 30 | 77 | -61% |
| South West | 21 | 42 | -50% |
| Wales | 41 | 73 | -44% |
| West Midlands | 30 | 54 | -44% |
| Yorkshire and The Humber | 60 | 115 | -48% |
| All | 406 | 733 | -45% |
The Price Paid Data includes details of over 93,750 residential property sales in England and Wales lodged for registration in November 2015. The most expensive sale in November 2015 was in London W14 (£16,250,000). The cheapest sale in November 2015 was in Middlesbrough, Redcar and Cleveland (£6,000).
Notes to editors
- Market Trend Data is published on the twentieth working day of each month. The December House Price Index (HPI) will be published at 9.30am on Friday 29 January 2016. Price Paid Data is published at 11am on the same day.
- A calendar with release dates of the headline figure and the full HPI is available.
- The HPI uses a sample size that is larger than all other statistical measures available. It is calculated using Land Registry’s dataset of all single residential property sales completed in England and Wales since January 1995 subject to exclusions.
- Land Registry’s dataset contains details on over 20 million residential transactions. Of these, over 7 million are identifiable matched pairs, providing the basis for the repeat sales regression analysis used to complete the index. This technique of quality adjustment ensures an “apples to apples” comparison between properties.
- The adjusted headline statistics for England and Wales on page 14 of the monthly HPI report include additional repossession data.
- The repossession data is based on the number of transactions lodged with Land Registry by lenders exercising their power of sale. Once we have identified these transactions, we extract the price paid information from the related register entry.
- Although the HPI goes back to January 1995, we have only been recording repossessions comprehensively since 2006. This means that historic repossession data is not available prior to January 2006. See repossessions data for more information.
- HPI background tables are available as Open Data in Excel and CSV formats and in machine readable format as linked data. They are available for free use and re-use under the Open Government Licence (OGL).
- Price Paid Data is residential property price data for all the residential property sales in England and Wales that are lodged with us for registration in that month.
The following information is available for each property:- the full address
- the price paid
- the date of transfer
- the property type
- whether it is new build or not
- whether it is freehold or leasehold
- Price Paid Data can be downloaded in txt, csv format and in a machine readable format as linked data. It is available for anyone to examine or re-use free of charge under the OGL.
- Price Paid Data includes Standard Price Paid Data (SPPD) for single residential property sales at full market value and Additional Price Paid Data (APPD) for transactions previously excluded from SPPD such as: * transfers to a non-private individual, for example a company, corporate body or business * transfers under a power of sale (repossessions) * buy-to-lets (where they can be identified by a mortgage).
- The information available for each property indicates whether it is APPD or SPPD and the record’s status - addition/change/deletion (A/C/D).
- As a government department established in 1862, executive agency and trading fund responsible to the Secretary of State for Business, Innovation and Skills, Land Registry keeps and maintains the Land Register for England and Wales. The Land Register has been open to public inspection since 1990.
- With the largest transactional database of its kind detailing over 24 million titles, Land Registry underpins the economy by safeguarding ownership of many billions of pounds worth of property.
- For further information about Land Registry visit www.gov.uk/land-registry.
- Follow us on Twitter @LandRegGov our blog and LinkedIn and Facebook
Contact
Press Office
Trafalgar House
1 Bedford Park
Croydon
CR0 2AQ
Email HMLRPressOffice@landregistry.gov.uk
Phone (Monday to Friday 8:30am to 5:30pm) 0300 006 3365
Mobile (5:30pm to 8:30am weekdays, all weekend and public holidays) 07864 689 344