Options for lowering the age of entitlement to the NLW to 18
Updated 4 March 2026

© Crown copyright 2026
This publication is licensed under the terms of the Open Government Licence v3.0 except where otherwise stated. To view this licence, visit nationalarchives.gov.uk/doc/open-government-licence/version/3 or write to the Information Policy Team, The National Archives, Kew, London TW9 4DU, or email: psi@nationalarchives.gov.uk.
Where we have identified any third party copyright information you will need to obtain permission from the copyright holders concerned.
This publication is available at https://www.gov.uk/government/consultations/low-pay-commission-consultation-2025/options-for-lowering-the-age-of-entitlement-to-the-nlw-to-18
Summary
- Last year, the Government stated its commitment to reducing the age of entitlement for the NLW to 18. It asked us to recommend “steps year by year in order to achieve a single adult rate”. In our 2024 Report, we committed to consulting on the best way of doing this. This annex supports our 2025 consultation, by outlining options for completing the transition to an adult minimum wage that starts at age 18.
- We could lower the age of entitlement to the National Living Wage (NLW) in one of two ways:
- a. Reduce the age of entitlement by one age group at a time. That is, first extend the NLW to 20 year olds, then 19 year olds, then 18 year olds. Rates for the remaining age groups (e.g. 18-19 year olds) could be moved closer to the NLW as they prepare to move over.
- b. Align the 18-20 Year Old Rate with the NLW over a number of years. This would require the 18-20 Year Old Rate to increase faster than the NLW until the two were equal and the 18-20 Year Old Rate was abolished.
- The choice of approach affects the size and timing of the minimum wage increases 18-20 year olds will need to bring them on to the NLW. In general, approach (a) would lead to one-off large increases in the wage floor for each age cohort as they move onto the NLW, while approach (b) would require smaller (but still significant) increases spread over a number of years.
- Whichever approach we recommend, the size of minimum wage increases needed to achieve an 18+ NLW will also be affected by:
- a. The speed of the transition. The faster we move to an 18+ NLW, the larger the increases in the wage floor needed.
- b. Changes to the NLW (whether driven by economic factors or Government policy). Larger increases in the NLW would also mean larger increases for 18-20 year olds.
- Including younger workers in the NLW reduces median hourly pay for the NLW population. If the NLW remains connected to median hourly pay, this may lead to lower increases in the NLW.
- Changes in the minimum wage for 18-20 year olds also affect the jump in the wage floor experienced at age 18 (when moving off the 16-17 Year Old Rate).
- The scenarios in this annex are illustrative only. They depend on the factors discussed above and are based on our current forecasts.
Introduction
In our 2024 remit, the Government told us that it was “committed to ensuring that every adult worker benefits from [a] genuine living wage” and that we should recommend “steps year by year in order to achieve a single adult rate”. We subsequently committed to consulting on the best way of doing this. This annex outlines some options for completing the transition to an adult minimum wage that starts at age 18.
We invite you to provide evidence and views on the following questions:
-
How will reducing the age threshold for the NLW affect you, your members or others?
-
Are there particular benefits or risks associated with the options presented here (or other options we have not considered)? Do you have views on the best approach to changing the age threshold?
- Do you have views on the pace of the transition to an NLW starting at age 18?
- What approach should the LPC take to the gap between the 16-17 Year Old Rate and the minimum wage for 18 year olds?
- How should we evaluate the impact of the steps that we take to move towards an NLW starting at age 18?
There are different ways to reduce the age threshold for the NLW. The age of entitlement could be lowered one age cohort at a time (from 21, to 20, to 19) until it reaches 18 years, or we could recommend larger increases in the 18-20 Year Old Rate until it aligns with the NLW.
Both approaches would require significant increases in the wage floor for workers aged 18-20. The scale of these increases depends not only on the approach taken, but also on how quickly we complete the transition and how the NLW changes over this period.
To make the options more concrete, we have provided scenarios (including indicative increases in minimum wages for 18-20 year olds) alongside them. Please treat these as illustrative only. They are based on a range of different assumptions and forecasts, which are subject to change.
For example, these scenarios present an NLW that remains at two-thirds of the projected median hourly wage. This is not a forecast of what we think will happen with the NLW. We have yet to receive our remit from the Government and so we do not know what the Government’s intentions are for 2026, and the actual NLW rate (and therefore associated youth rates) could vary significantly from the figures presented here. These projections also account for each younger age group included in the NLW lowering the median pay reference level.
Whichever approach is taken to changing the age threshold for the NLW, recommended rates for each year will be determined through negotiation among Low Pay Commissioners with reference to the full range of evidence available at that time.
Lowering the threshold one age at a time
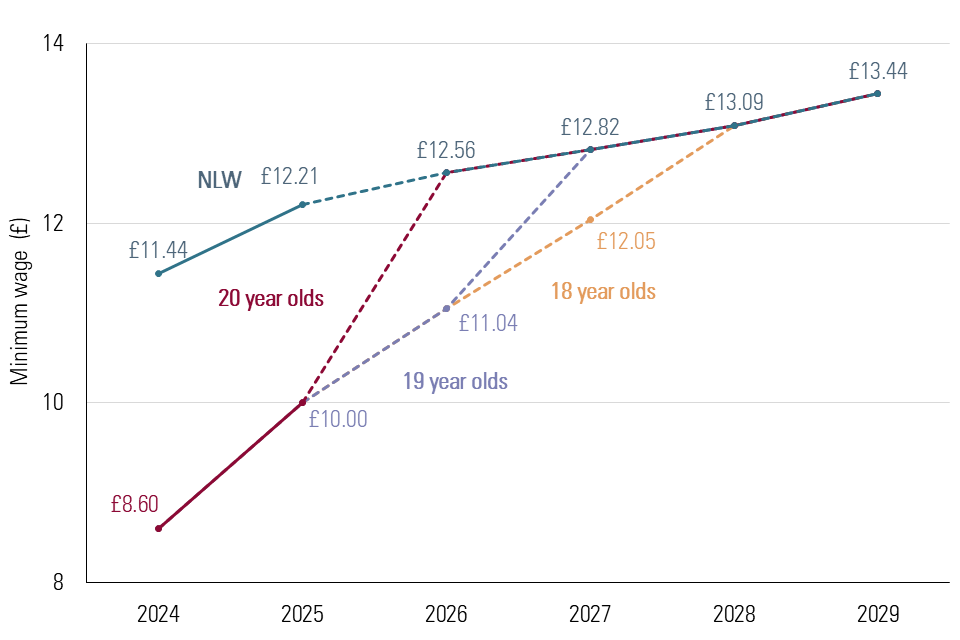
Figure 1 shows a scenario in which 20 year olds become eligible for the NLW in April 2026, 19 year olds in April 2027, and finally 18 year olds in April 2028. The NLW remains at two thirds of median earnings and we assume that the residual rate (e.g. that for 18-19 year olds after 20 year olds have moved to the NLW) is also moved closer to the NLW year by year.
Figure 1: Individual age rates required to catch up with an illustrative NLW by April 2028[footnote 1]
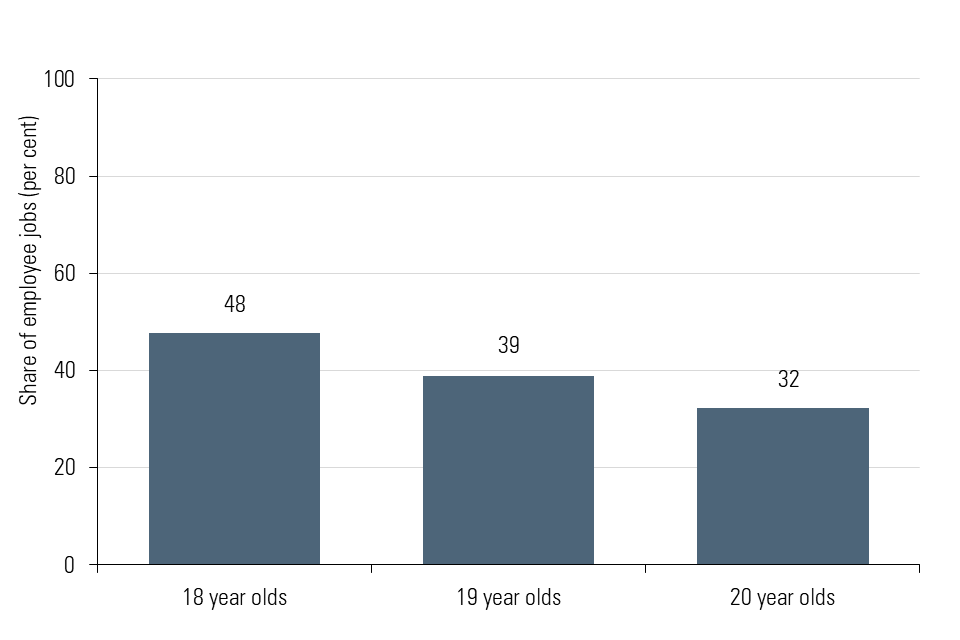
This approach would allow us to evaluate the initial impacts on each age cohort after they become eligible for the NLW and adjust our future recommendations accordingly. Starting by moving older workers onto the NLW would also reflect the differences within the 18-20 age group. Evidence suggests that the risks to employment for 20 year olds are likely to be lower than for 18 year olds, while Figure 2 shows that 18 year olds are more likely to be paid below the NLW than 20 year olds.
Figure 2: Share of employee jobs paid below the NLW by age, 2024[footnote 2]
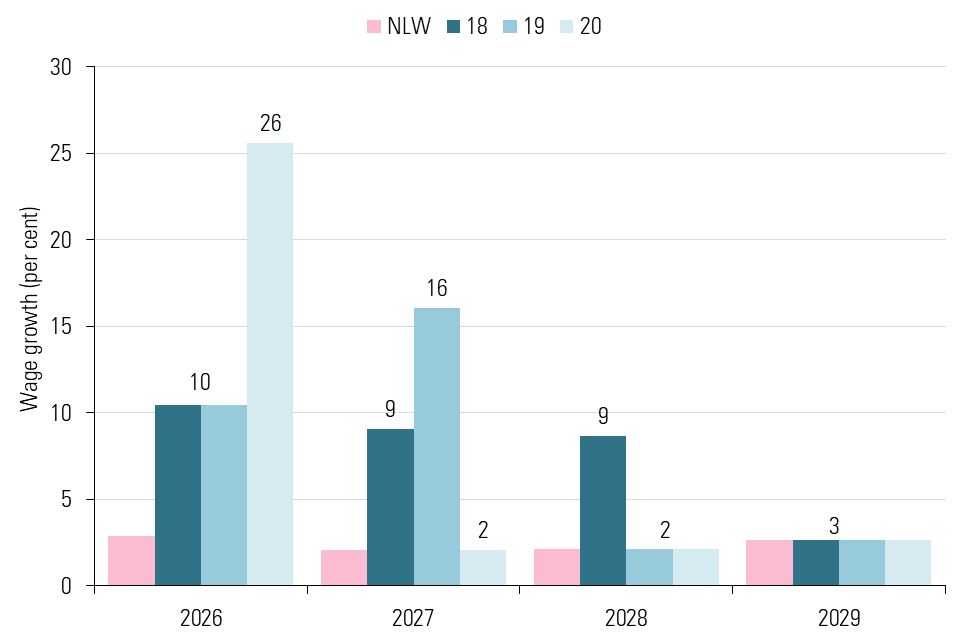
However, each year reduction in the age of eligibility will require a significant increase to the minimum wage for that age cohort. Figure 3 shows that if 20 year olds became eligible for the NLW in April 2026, it would likely increase their minimum wage by around 26 per cent (depending on the agreed NLW uprating). The increases required for 18 and 19 year olds would be smaller because there are additional years to reduce the gap between their youth rate and the NLW in the interim. After the large one-off increase required to move an age cohort onto the NLW, the growth in their minimum wage is likely to slow as it will simply grow in line with the NLW.
If we were to complete the transition later than 2028, this would reduce the scale of increases needed. It would also allow more time to evaluate between the changes.
Figure 3: Projected growth rate of minimum wage rates, 18-20 year olds are moved onto the NLW one age at a time, 2026-2029[footnote 3]
Aligning the 18-20 Year Old Rate
An alternative approach is to increase the 18-20 Year Old Rate until it aligns with the NLW. Figure 4 shows the increases to the 18-20 Year Old Rate required to align it with the NLW at two possible speeds. Again, we assume that the NLW remains at two thirds of median earnings. Alignment of the 18-20 Year Old Rate with the NLW by April 2027 would require increases in the region of £1.40 (11-15 per cent) each year for two years, whereas aligning the rate by April 2029 would require increases of around 90 pence (5-9 per cent) each year for four years. After the transition (either two or four years), rates for 18-20 year olds would follow the growth path of the NLW – here assumed to continue at roughly 3 per cent per year, but subject to change.
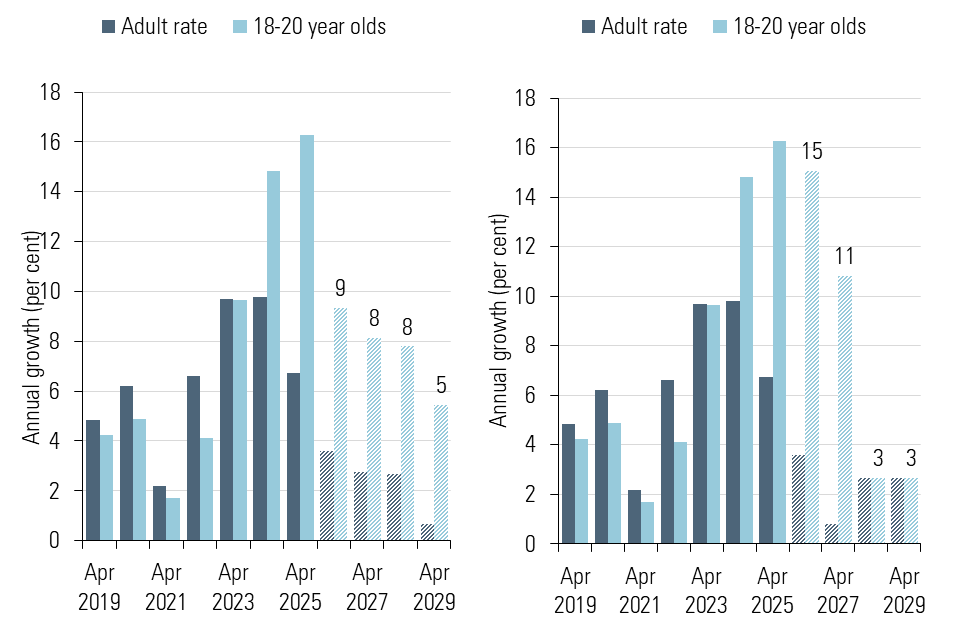
Figure 5 shows the projected increases required to align the 18-20 Year Old Rate by April 2029. The increases required would be larger than most of the historic increases to the 18-20 Year Old Rate, except for the increases seen in the last three years.
Figure 4: 18-20 Year Old Rate required to align with the NLW by April 2027 and April 2029[footnote 4]
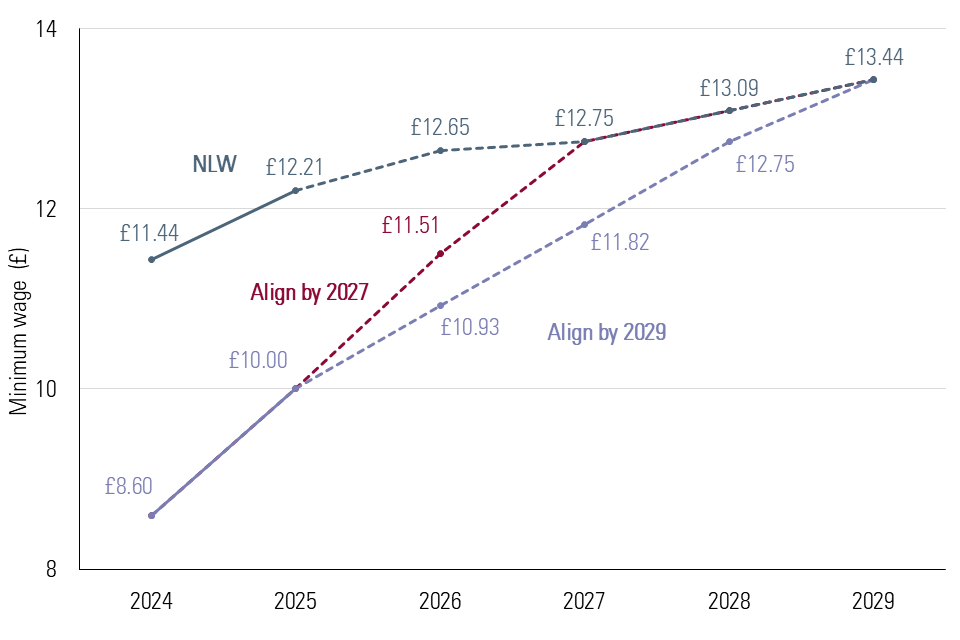
Figure 5: Past and projected growth rate of minimum wage rates, aligning 18-20 Year Old Rate by April 2029 (left hand side) and aligning by 2027 (right hand side)[footnote 5]
Other considerations
Under either approach, the scale of minimum wage increases needed for 18-20 year olds will depend on how quickly the NLW increases. Larger NLW increases could be a result of strong wage growth, increases in the cost of living, changes in policy or other economic factors considered by the Commission. These would all indirectly affect the increases needed for 18-20 year olds.
As the wage floor for 18-20 year olds is increased, the LPC must also consider the implications for the 16-17 Year Old Rate. If the 16-17 Year Old Rate increases more slowly than that for 18 year olds, the ‘jump’ in the wage floor when workers turn 18 will increase.
Note: This work contains statistical data from ONS which is Crown Copyright. The use of the ONS statistical data in this work does not imply the endorsement of the ONS in relation to the interpretation or analysis of the statistical data. This work uses research datasets which may not exactly reproduce National Statistics aggregates.
-
Source: LPC data on minimum wage rates and LPC projections using ONS data (ASHE and AWE) and forecasts from the HM Treasury (2024e) panel of independent forecasters and the Bank of England (2024c). Dashed lines are illustrative projected values. The minimum wage for 18 year olds is calculated by smoothing the change in the share of the adult rate between April 2025 (61.8 percent) and April 2028 (100 per cent). The minimum wage for 19 year olds is assumed to follow the 18 year old rate until eligibility in April 2027. The projections also account for each younger age group included in the NLW lowering the median pay reference level, and therefore the level of the NLW required to maintain two-thirds bite. ↩
-
Source: LPC analysis of ASHE, low pay weights, UK, 2024. 18-20 population, excluding those eligible for the Apprentice Rate. ↩
-
Source: LPC data on minimum wage rates and LPC projections using ONS data (ASHE and AWE) and forecasts from the HM Treasury (2025) panel of independent forecasters and the Bank of England (2025). ↩
-
Source: LPC data on minimum wage rates and LPC projections using ONS data (ASHE and AWE) and forecasts from the HM Treasury (2025) panel of independent forecasters and the Bank of England (2025). Dashed lines are illustrative projected values. The 18-20 Year Old Rate is calculated by smoothing the change in the share of the adult rate between April 2025 (61.8 per cent) and the year of alignment (100 per cent). The NLW projection of two-thirds bite shown above assumes that the NLW population changes from 21+ to 18+ in April 2027. If aligning in 2029, NLW estimates for 2027 and 2028 would be around 25 pence higher than shown here. For simplicity, we have not shown this on the chart. ↩
-
LPC data on historical minimum wage rates and LPC projections using ONS data (ASHE and AWE) and forecasts from the HM Treasury (2024e) panel of independent forecasters and the Bank of England (2024c). The NLW calculation of two-thirds bite assumes that the NLW population changes from 21+ to 18+ in April 2029. ↩