Annex 5: Numerical analysis of individual question responses
Updated 9 July 2026

© Crown copyright 2026
This publication is licensed under the terms of the Open Government Licence v3.0 except where otherwise stated. To view this licence, visit nationalarchives.gov.uk/doc/open-government-licence/version/3 or write to the Information Policy Team, The National Archives, Kew, London TW9 4DU, or email: psi@nationalarchives.gov.uk.
Where we have identified any third party copyright information you will need to obtain permission from the copyright holders concerned.
This publication is available at https://www.gov.uk/government/consultations/consultation-on-changes-to-the-tia-standard/outcome/annex-5-numerical-analysis-of-individual-question-responses
Introduction
1 - This annexe provides a numerical summary of the responses received to the questions in the December 2025 consultation on proposed changes to the regulator’s consumer standards and related code of practice. It does not include responses relating to the proposed introduction of the electrical safety checks TSM[footnote 1].
2 - We received a total of 872 responses to the consultation.
3 - 152 responses were received online (via our consultation survey) and 21 were in writing, predominately via email. Six stakeholders responded twice, via both the survey and email; in each case both responses were considered but counted as one stakeholder response.
4 - Most of the feedback (699 responses) were received via a social media campaign. These responses only related to question 2 in the consultation.
Table A: Breakdown of non-campaign responses to the consultation by respondent type
| Respondent type | Number | Percentage of total responses |
|---|---|---|
| Social housing tenant in rental accommodation | 21 | 12% |
| Shared owner with a registered provider | 4 | 2% |
| Other individual | 7 | 4% |
| Private registered provider | 67 | 39% |
| Local authority registered provider | 49 | 28% |
| Stakeholder organisation | 12 | 7% |
| Other organisation | 13 | 8% |
| Total responses | 173 | 100% |
Chart A: Breakdown of non-campaign responses to the consultation by respondent type
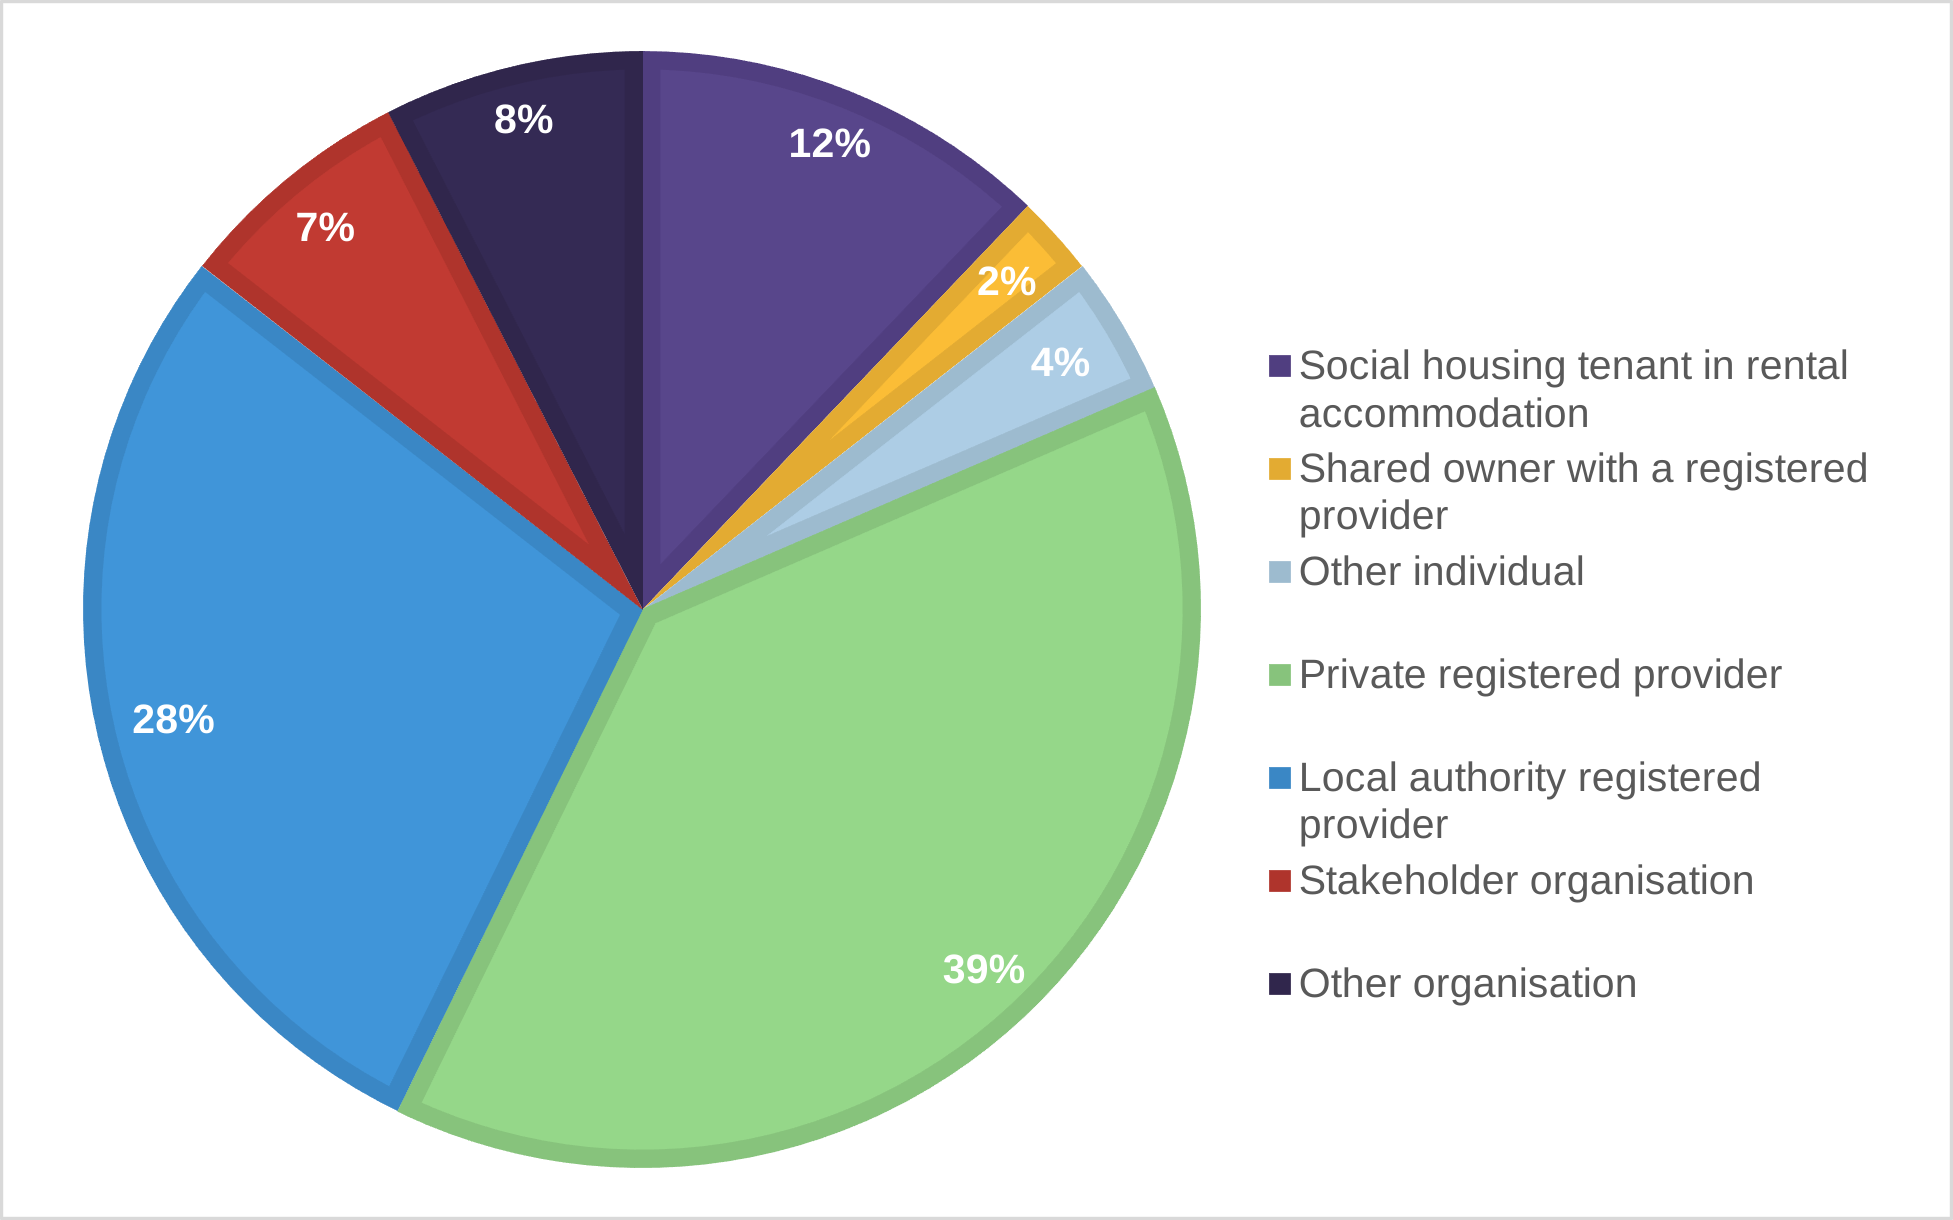
Table B: Breakdown of campaign responses to the consultation by respondent type
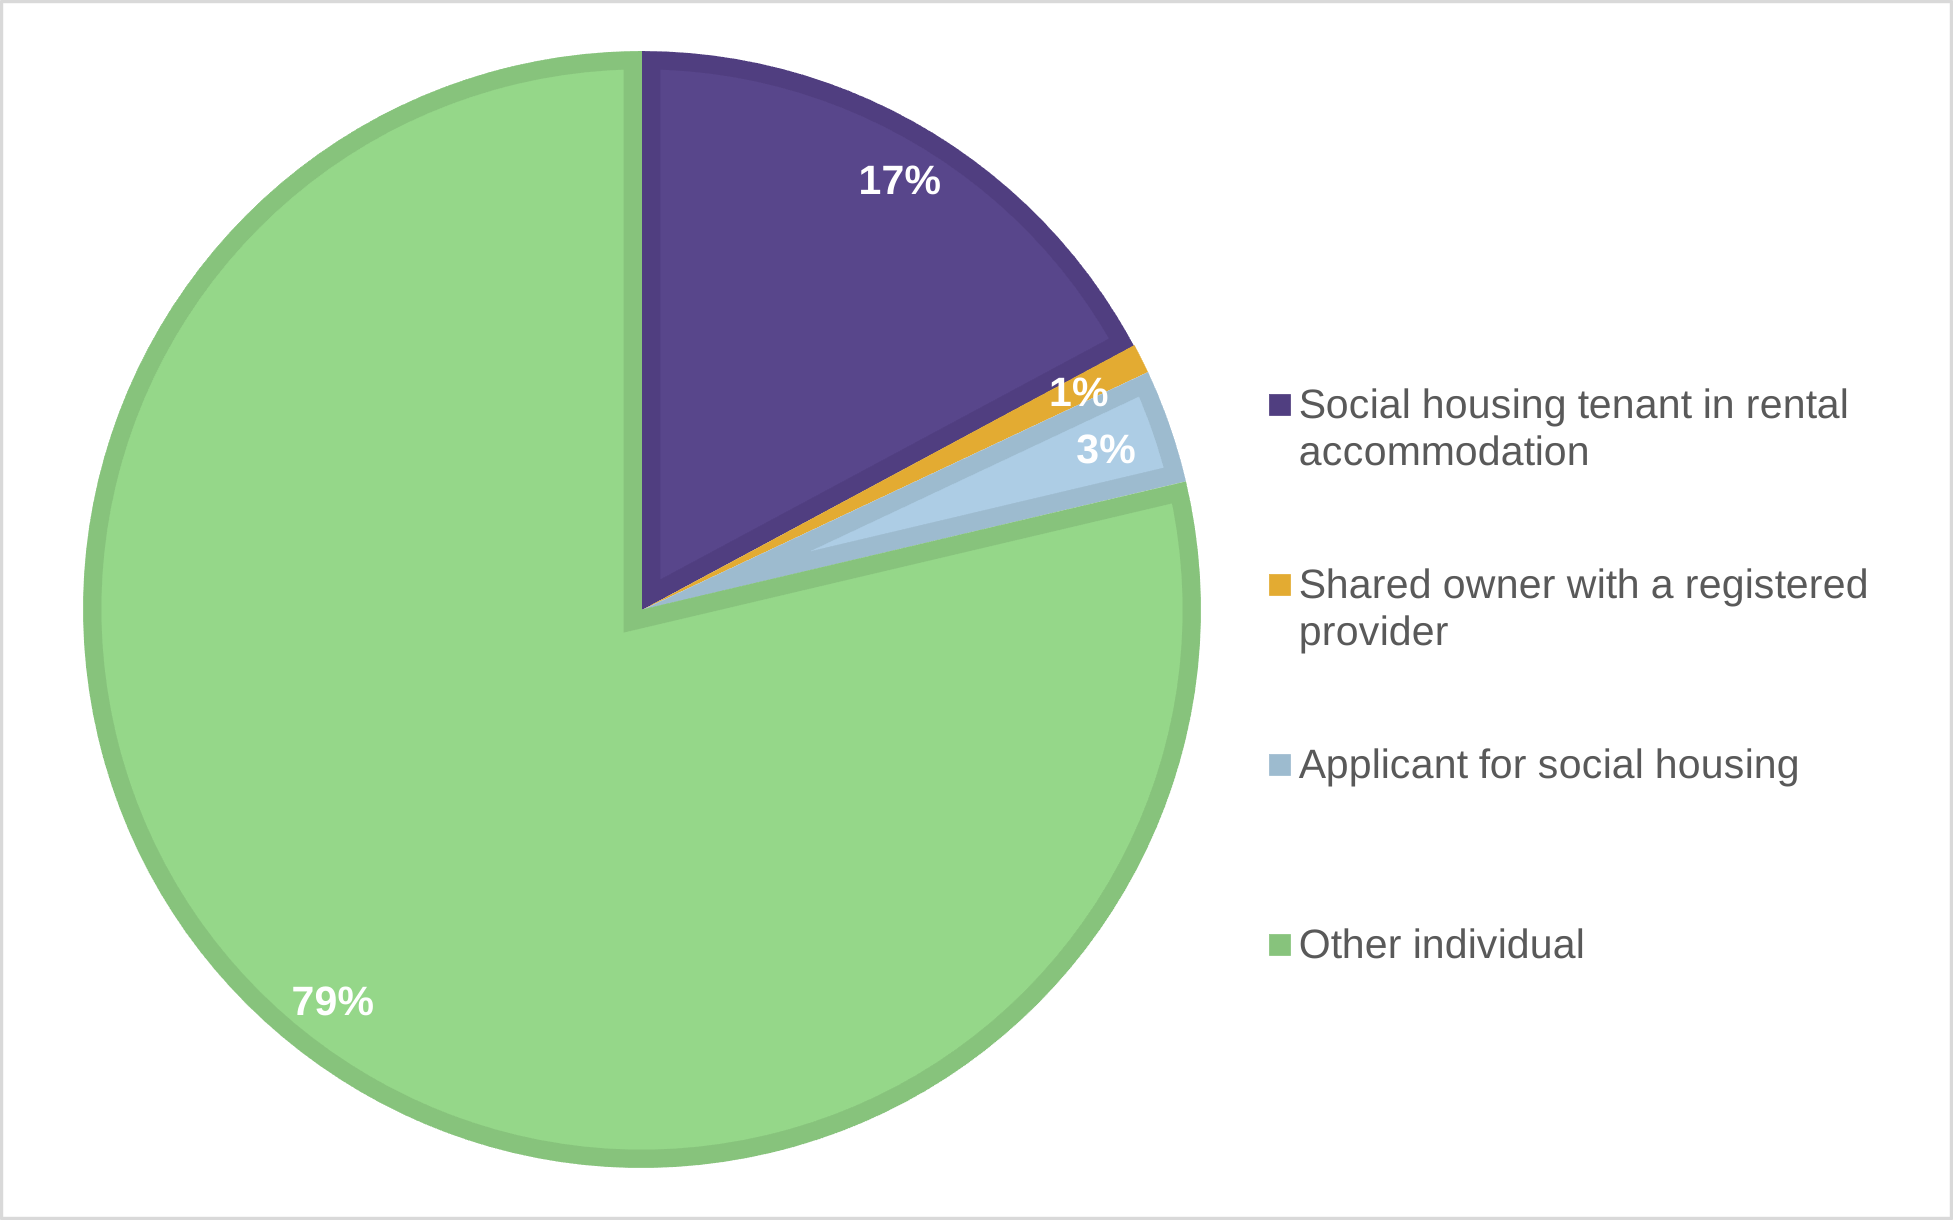
| Respondent type | Number | Percentage of total responses |
|---|---|---|
| Social housing tenant in rental accommodation | 120 | 17% |
| Shared owner with a registered provider | 6 | 1% |
| Applicant for social housing | 23 | 3% |
| Other individual | 550 | 79% |
| Total responses | 699 | 100% |
Chart B: Breakdown of campaign responses to the consultation by respondent type
5 - The following tables and charts provide a numerical summary of the responses received to each consultation question. Some respondents partially completed the survey which accounts for the differences in numbers responding to each question. Percentages have been rounded to the nearest whole number[footnote 2] and refer to the percentage of those who answered each question (rather than the total number of respondents to the consultation).
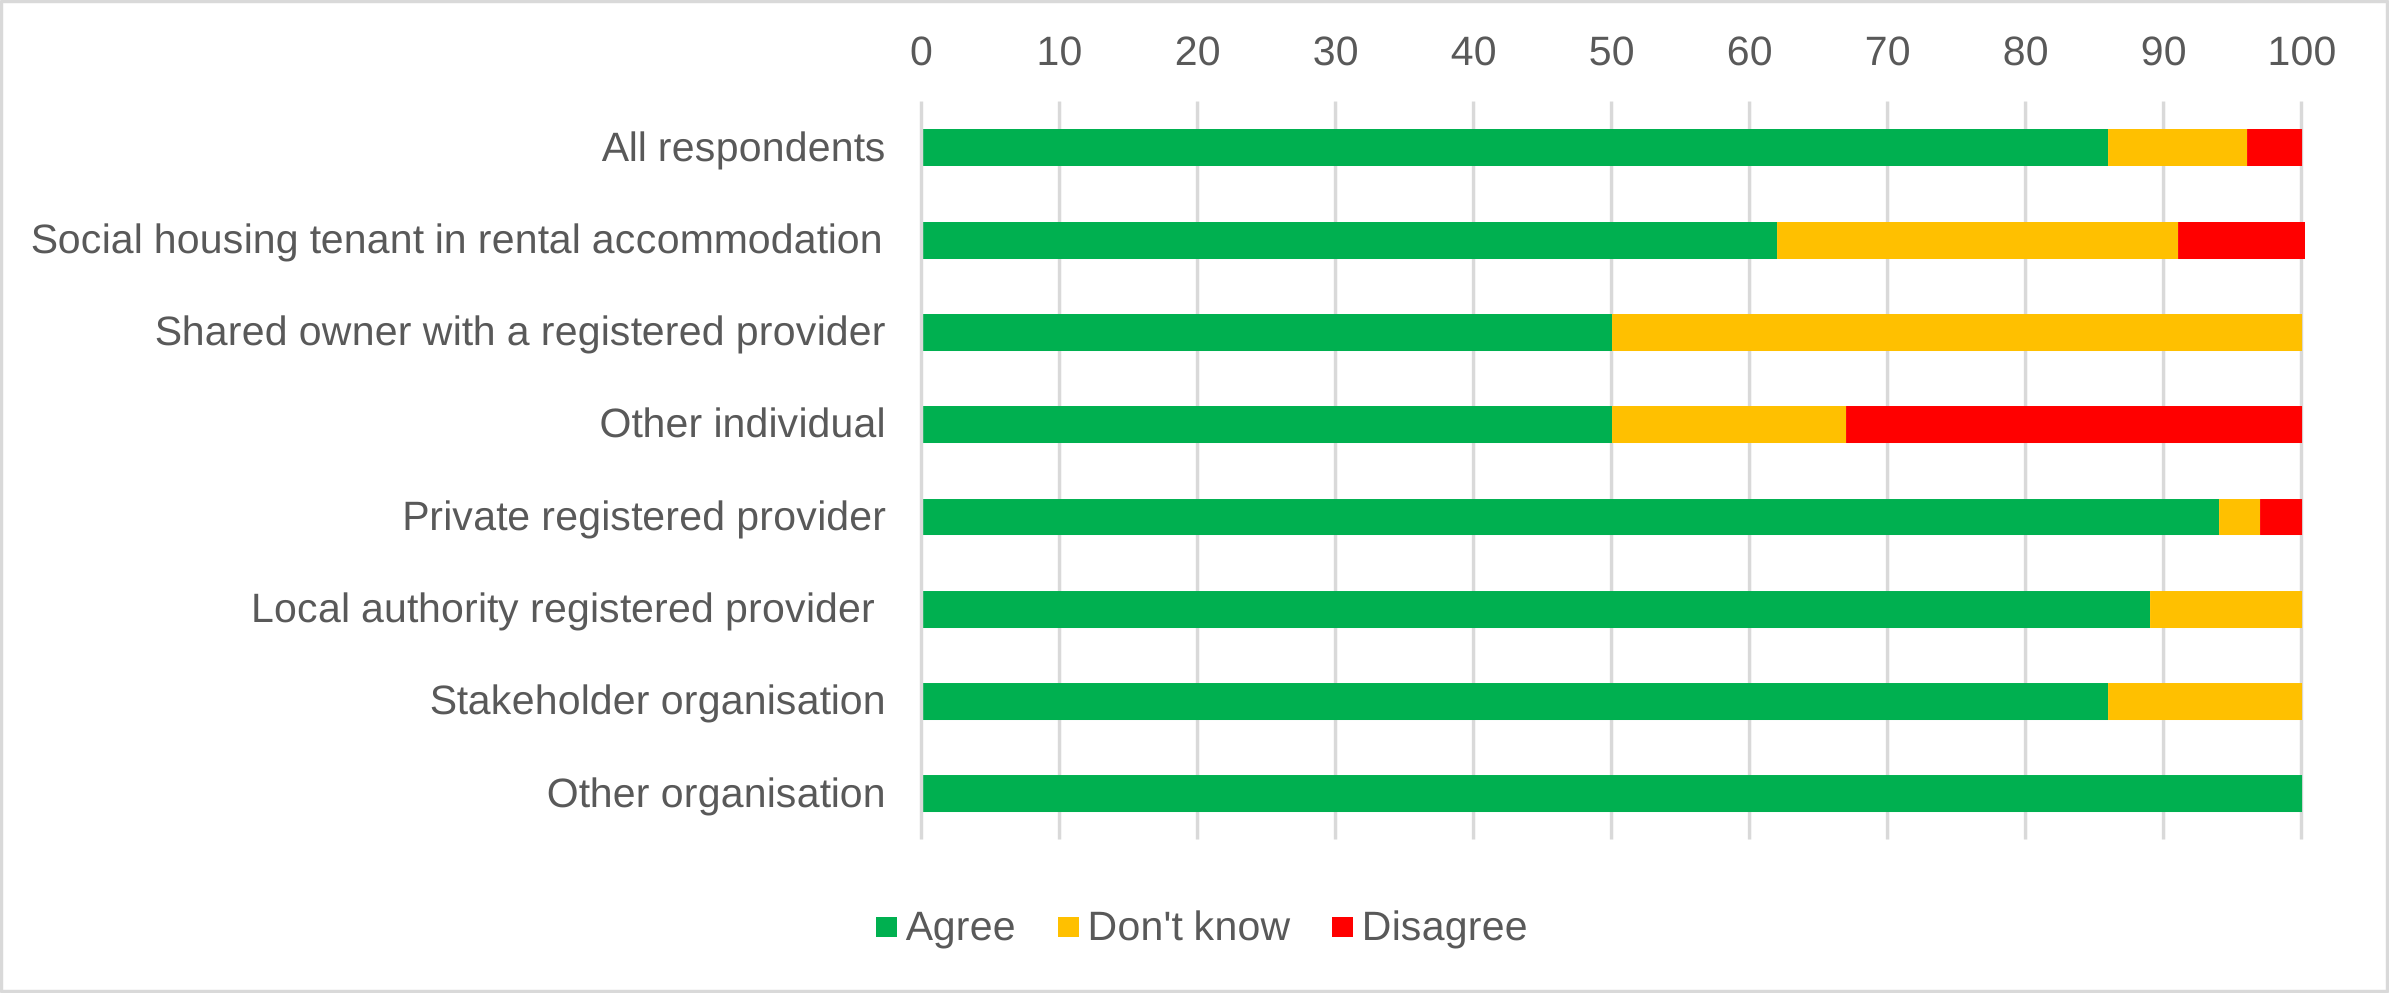
Question 1. Do you agree or disagree that the proposed change to the TI&A Standard accurately reflects the government’s STAIRs Direction to the regulator?
Table 1. Overview of responses to Question 1
| Total number of responses | Agree | Disagree | Don’t know | ||||
|---|---|---|---|---|---|---|---|
| % | Number | % | Number | % | Number | ||
| Total | 162 | 86 | 139 | 4 | 6 | 10 | 17 |
| Social housing tenant in rental accommodation | 21 | 62 | 13 | 10 | 2 | 29 | 6 |
| Shared owner with a registered provider | 4 | 50 | 2 | 0 | 0 | 50 | 2 |
| Other individual | 6 | 50 | 3 | 33 | 2 | 17 | 1 |
| Private registered provider | 67 | 94 | 63 | 3 | 2 | 3 | 2 |
| Local authority registered provider | 45 | 89 | 40 | 0 | 0 | 11 | 5 |
| Stakeholder organisation | 7 | 86 | 6 | 0 | 0 | 14 | 1 |
| Other organisation | 12 | 100 | 12 | 0 | 0 | 0 | 0 |
Chart 1. Overview of responses to Question 1
Question 2. Do you agree or disagree that the proposed changes to the TI&A Standard accurately reflect the government’s Competence and Conduct Direction to the regulator?
Table 2A. Overview of all responses (campaign and non-campaign) to Question 2
| Total number of responses | Agree | Disagree | Don’t know | ||||
|---|---|---|---|---|---|---|---|
| % | Number | % | Number | % | Number | ||
| Total | 865 | 16 | 140 | 82 | 710 | 1 | 11 |
| Social housing tenant in rental accommodation | 141 | 9 | 12 | 87 | 123 | 4 | 6 |
| Shared owner with a registered provider | 9 | 22 | 2 | 67 | 6 | 11 | 1 |
| Other individual[footnote 3] | 580 | 1 | 3 | 99 | 574 | 0 | 2 |
| Private registered provider | 66 | 92 | 61 | 3 | 2 | 5 | 3 |
| Local authority registered provider | 48 | 96 | 46 | 2 | 1 | 2 | 1 |
| Stakeholder organisation | 9 | 44 | 4 | 44 | 4 | 11 | 1 |
| Other organisation | 13 | 92 | 12 | 0 | 0 | 8 | 1 |
Chart 2A. Overview of all responses (campaign and non-campaign) to Question 2
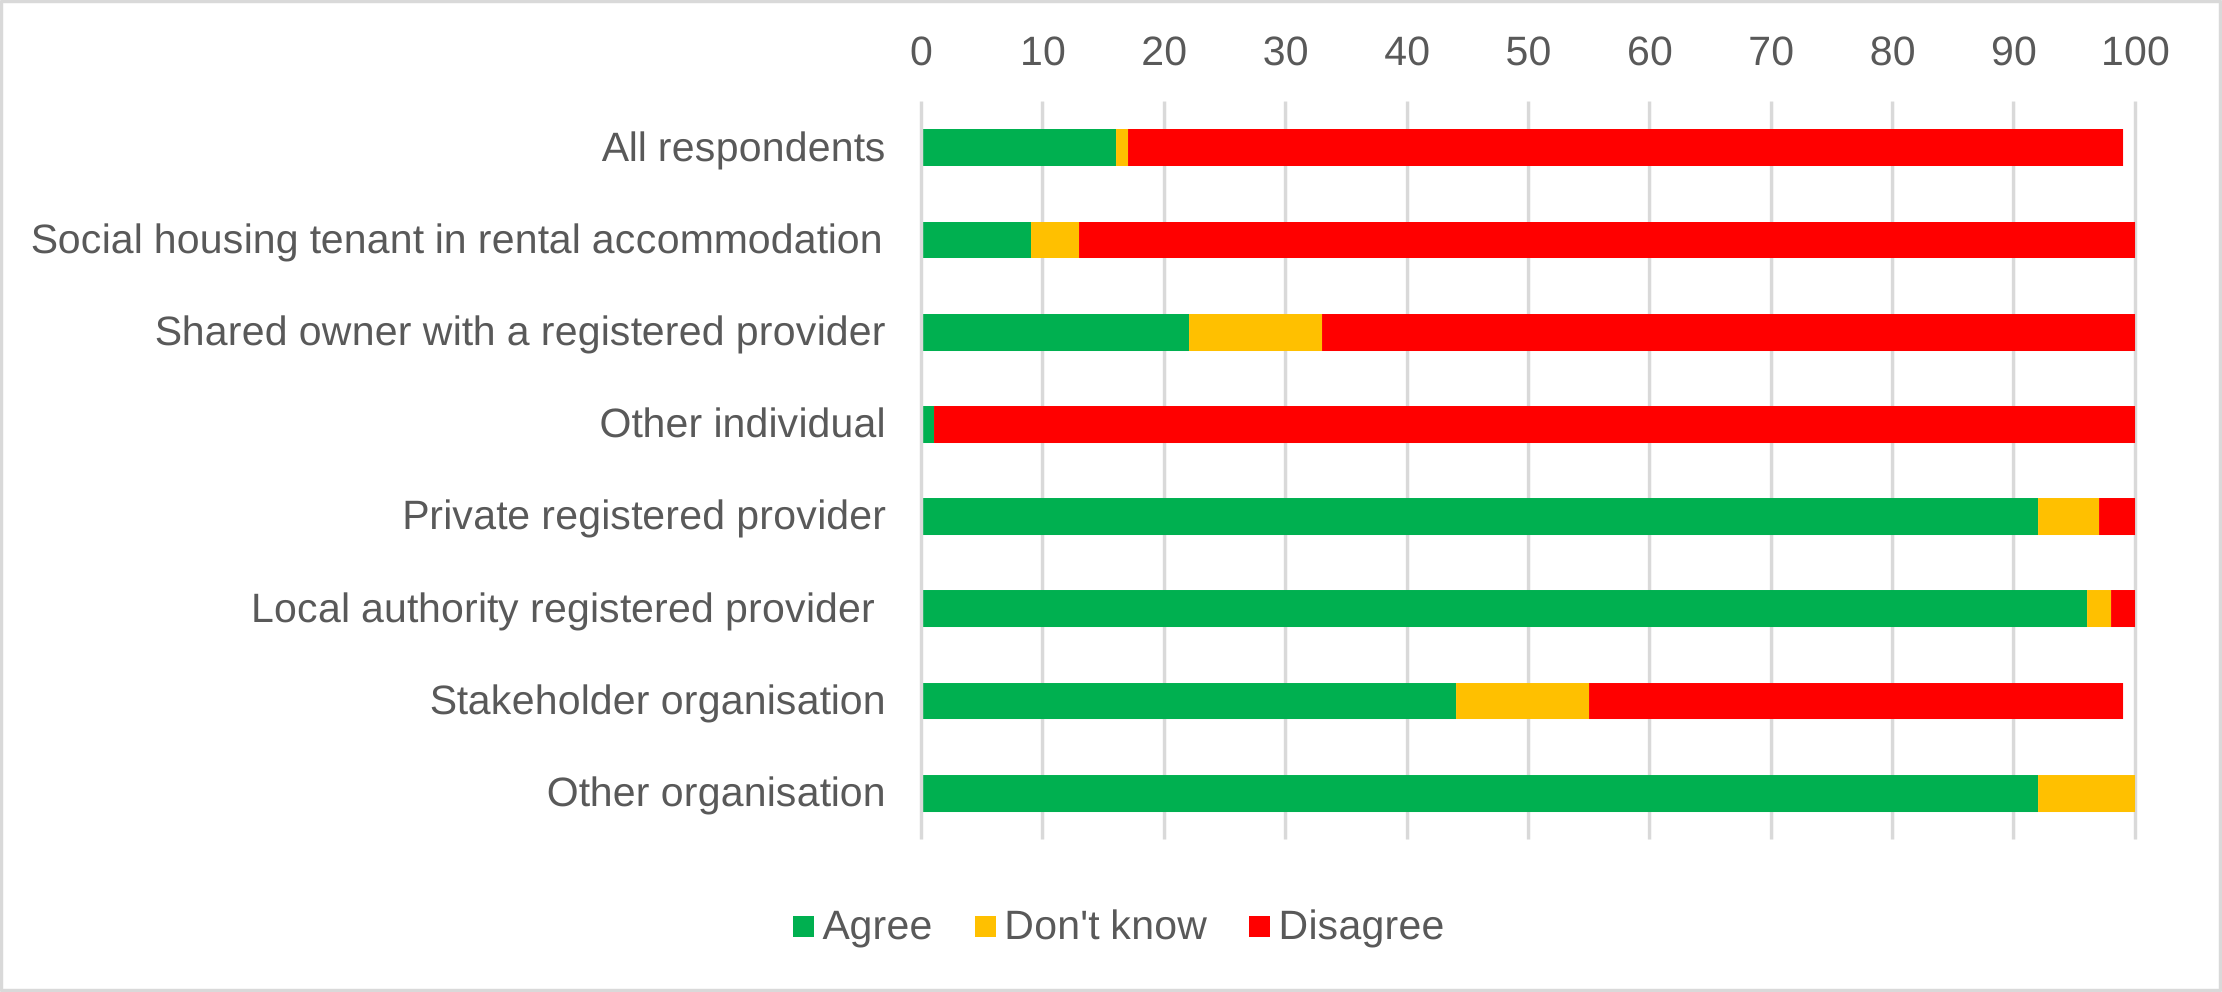
Table 2B. Overview of non-campaign responses to Question 2
| Total number of responses | Agree | Disagree | Don’t know | ||||
|---|---|---|---|---|---|---|---|
| % | Number | % | Number | % | Number | ||
| Total | 166 | 84 | 140 | 7 | 11 | 9 | 15 |
| Social housing tenant in rental accommodation | 21 | 57 | 12 | 14 | 3 | 29 | 6 |
| Shared owner with a registered provider | 3 | 67 | 2 | 0 | 0 | 33 | 1 |
| Other individual | 6 | 50 | 3 | 17 | 1 | 33 | 2 |
| Private registered provider | 66 | 92 | 61 | 3 | 2 | 5 | 3 |
| Local authority registered provider | 48 | 96 | 46 | 2 | 1 | 2 | 1 |
| Stakeholder organisation | 9 | 44 | 4 | 44 | 4 | 11 | 1 |
| Other organisation | 13 | 92 | 12 | 0 | 0 | 8 | 1 |
Chart 2B. Overview of non-campaign responses to Question 2
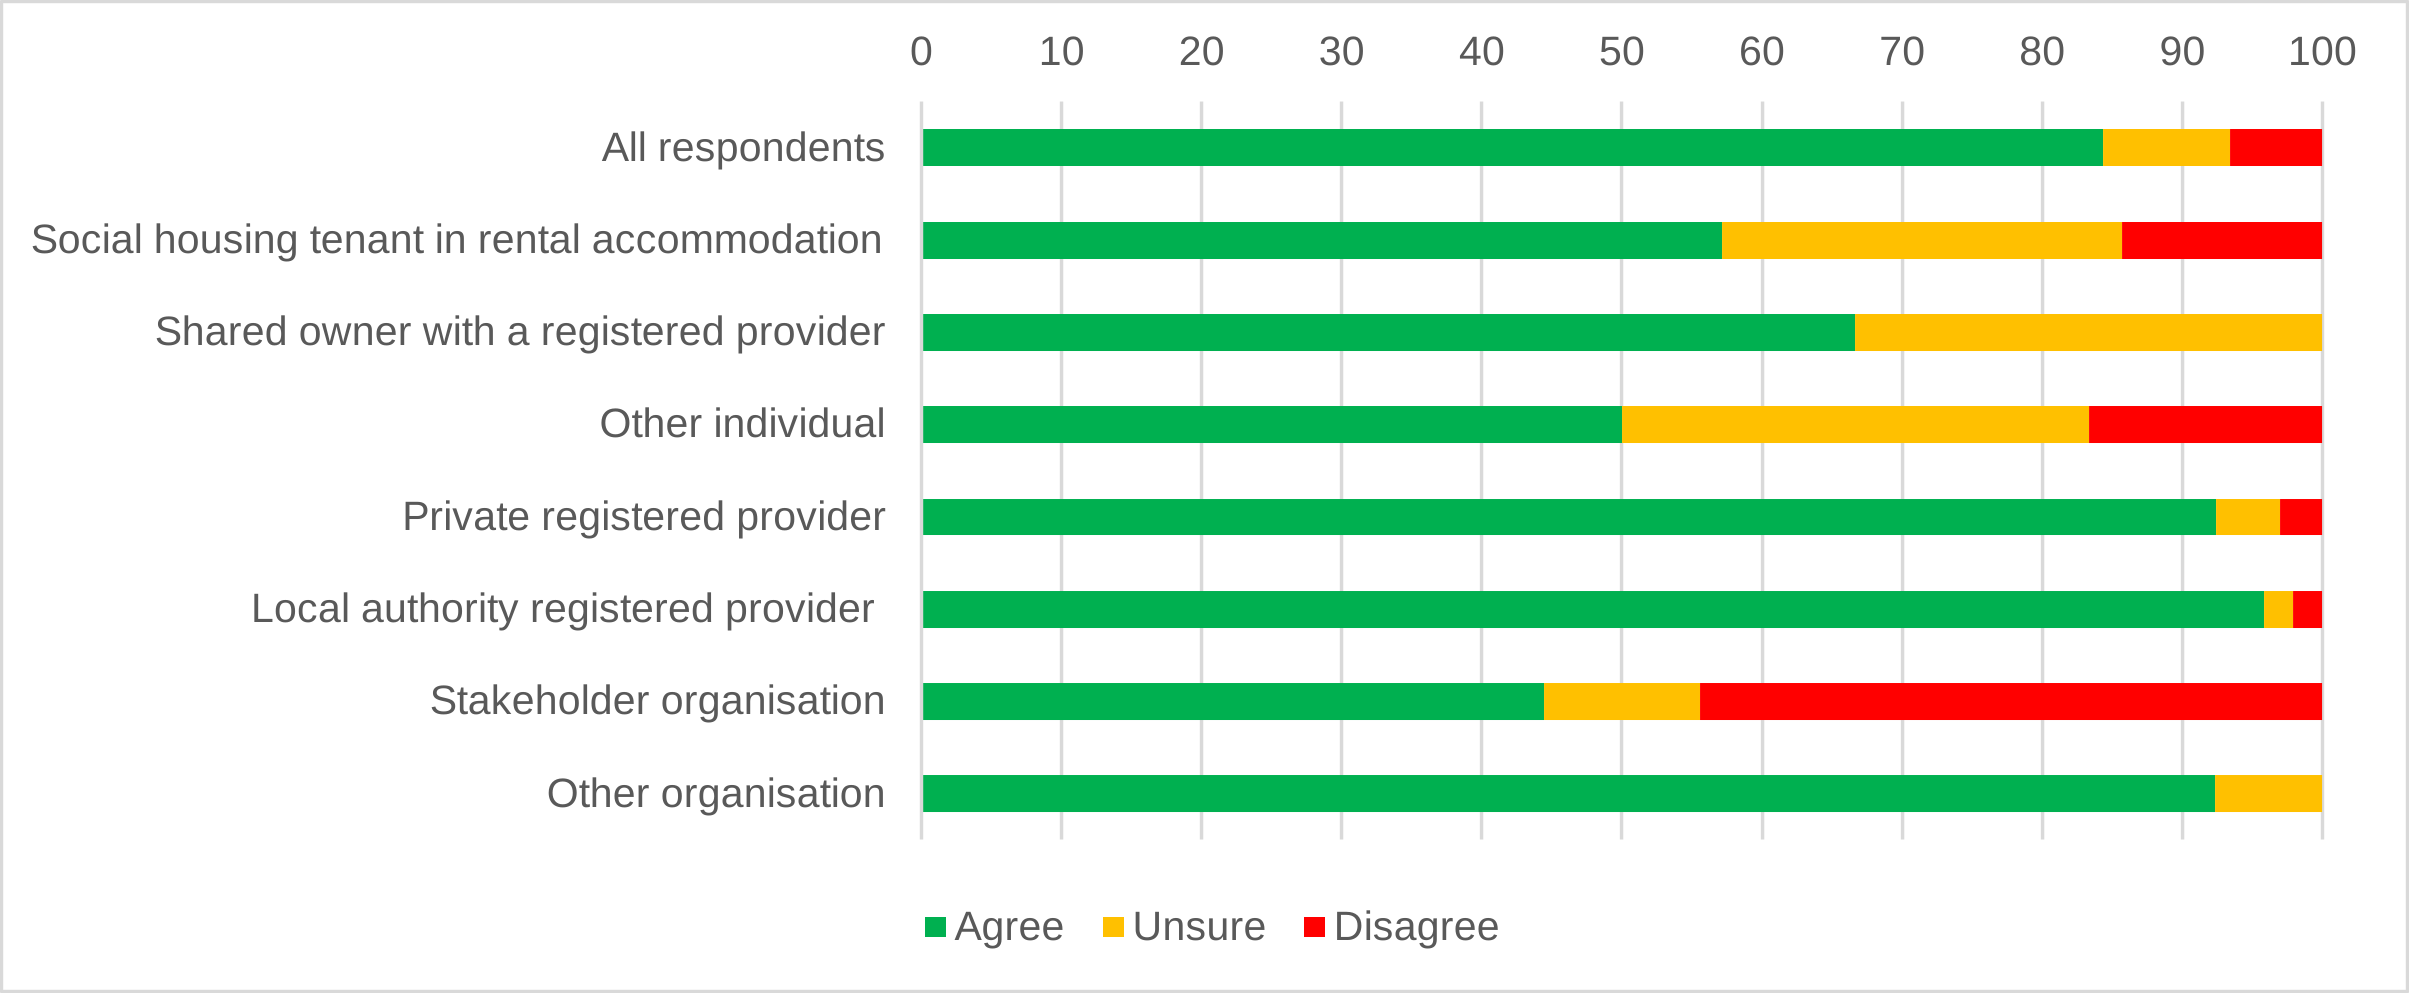
Table 2C. Overview of campaign responses to Question 2
| Total number of responses | Agree | Disagree | Don’t know | ||||
|---|---|---|---|---|---|---|---|
| % | Number | % | Number | % | Number | ||
| Total | 699 | 0 | 0 | 100 | 699 | 0 | 0 |
| Social housing tenant in rental accommodation | 120 | 0 | 0 | 100 | 120 | 0 | 0 |
| Shared owner with a registered provider | 6 | 0 | 0 | 100 | 6 | 0 | 0 |
| Applicant for social housing | 23 | 0 | 0 | 100 | 23 | 0 | 0 |
| Other individual | 550 | 0 | 0 | 100 | 550 | 0 | 0 |
Question 3. Do you agree or disagree with the proposed changes to the specific expectations in the TI&A Standard for the TSMs?
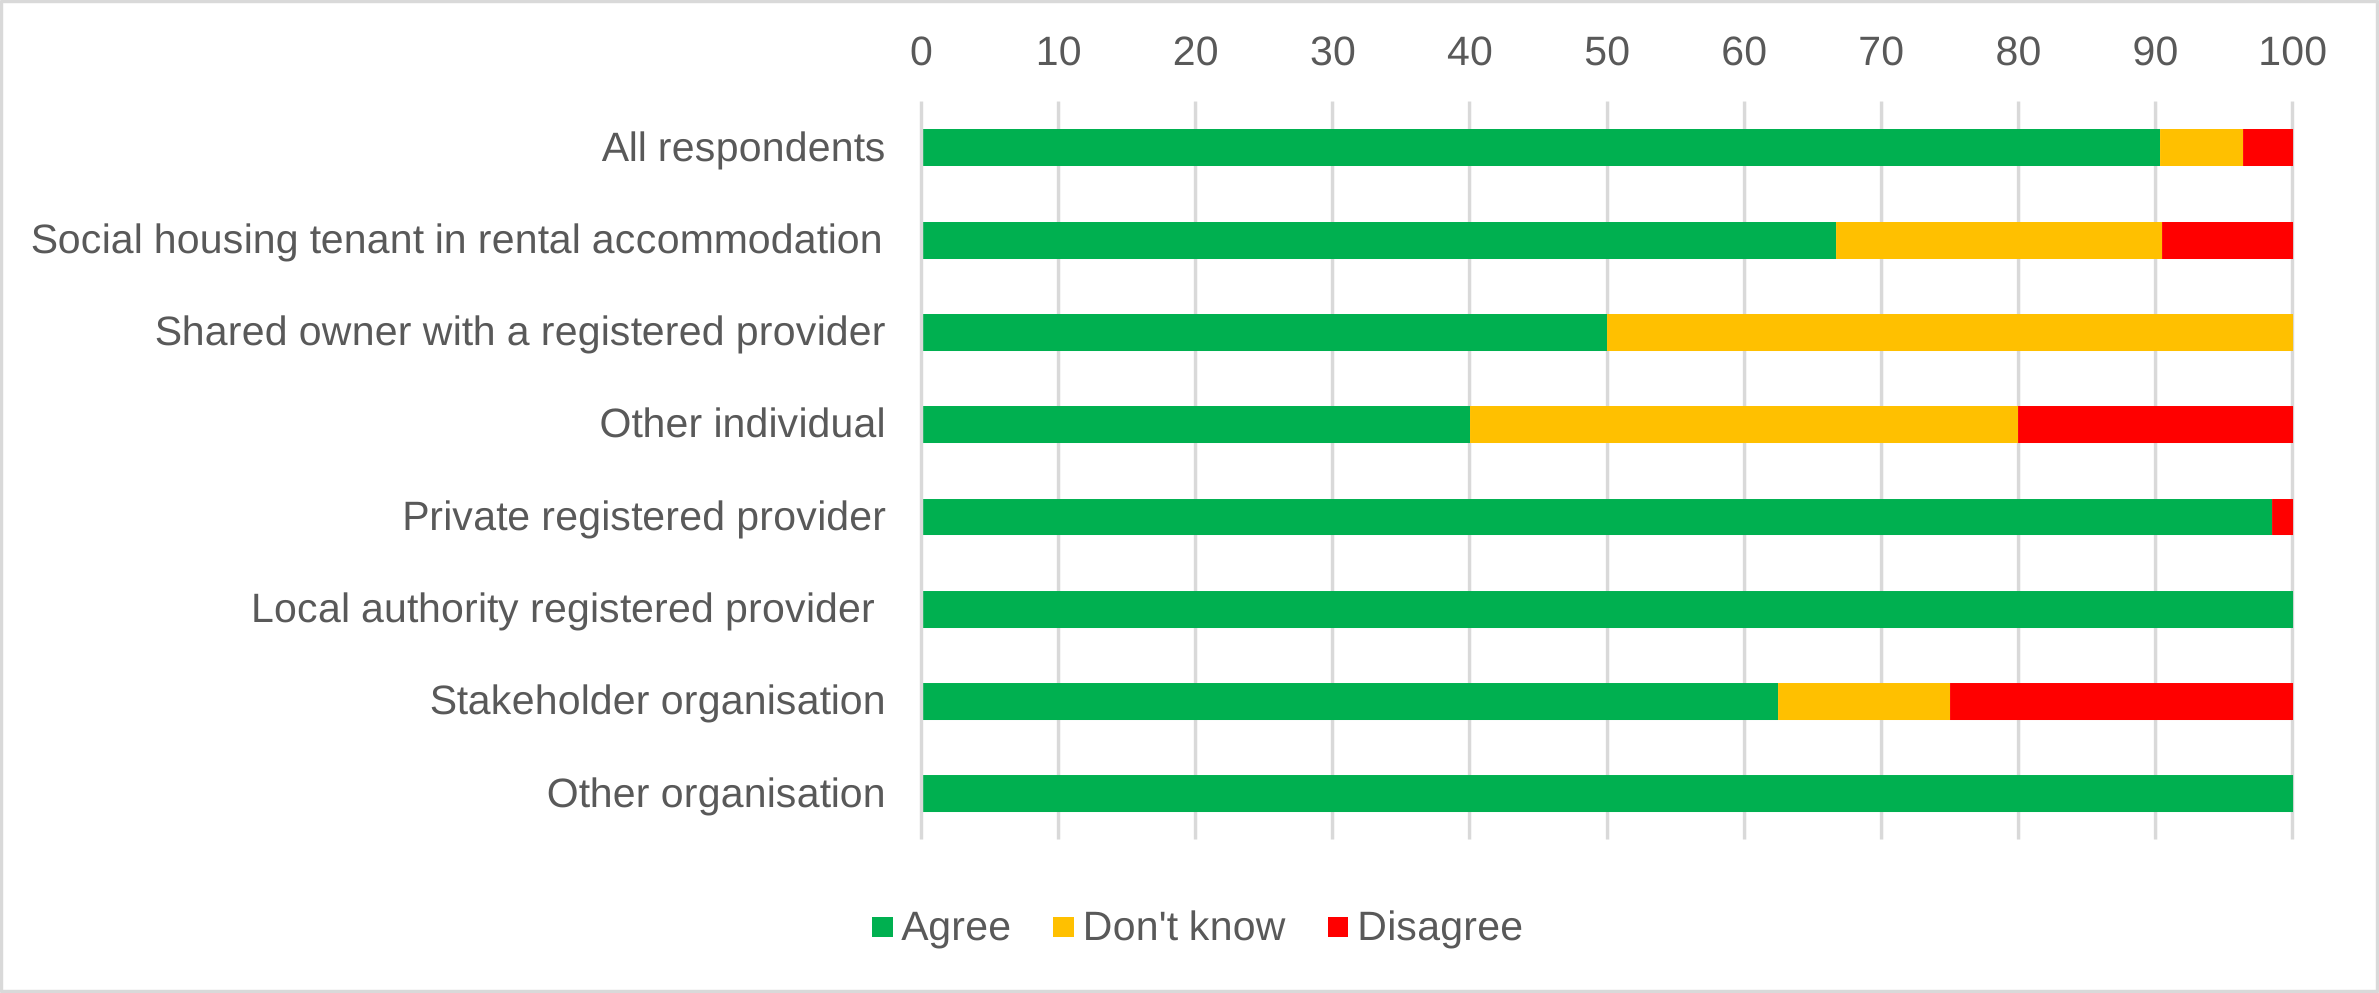
Table 3. Overview of responses to Question 3
| Responses | Agree | Disagree | Don’t know | ||||
|---|---|---|---|---|---|---|---|
| % | Number | % | Number | % | Number | ||
| Total | 165 | 90 | 149 | 4 | 6 | 6 | 10 |
| Social housing tenant in rental accommodation | 21 | 67 | 14 | 10 | 2 | 24 | 5 |
| Shared owner with a registered provider | 4 | 50 | 2 | 0 | 0 | 50 | 2 |
| Other individual | 5 | 40 | 2 | 20 | 1 | 40 | 2 |
| Private registered provider | 66 | 98 | 65 | 2 | 1 | 0 | 0 |
| Local authority registered provider | 48 | 100 | 48 | 0 | 0 | 0 | 0 |
| Stakeholder organisation | 8 | 63 | 5 | 25 | 2 | 13 | 1 |
| Other organisation | 13 | 100 | 13 | 0 | 0 | 0 | 0 |
Chart 3. Overview of responses to Question 3
Question 4. Do you agree or disagree with the proposed changes to the Consumer Standards Code of Practice?
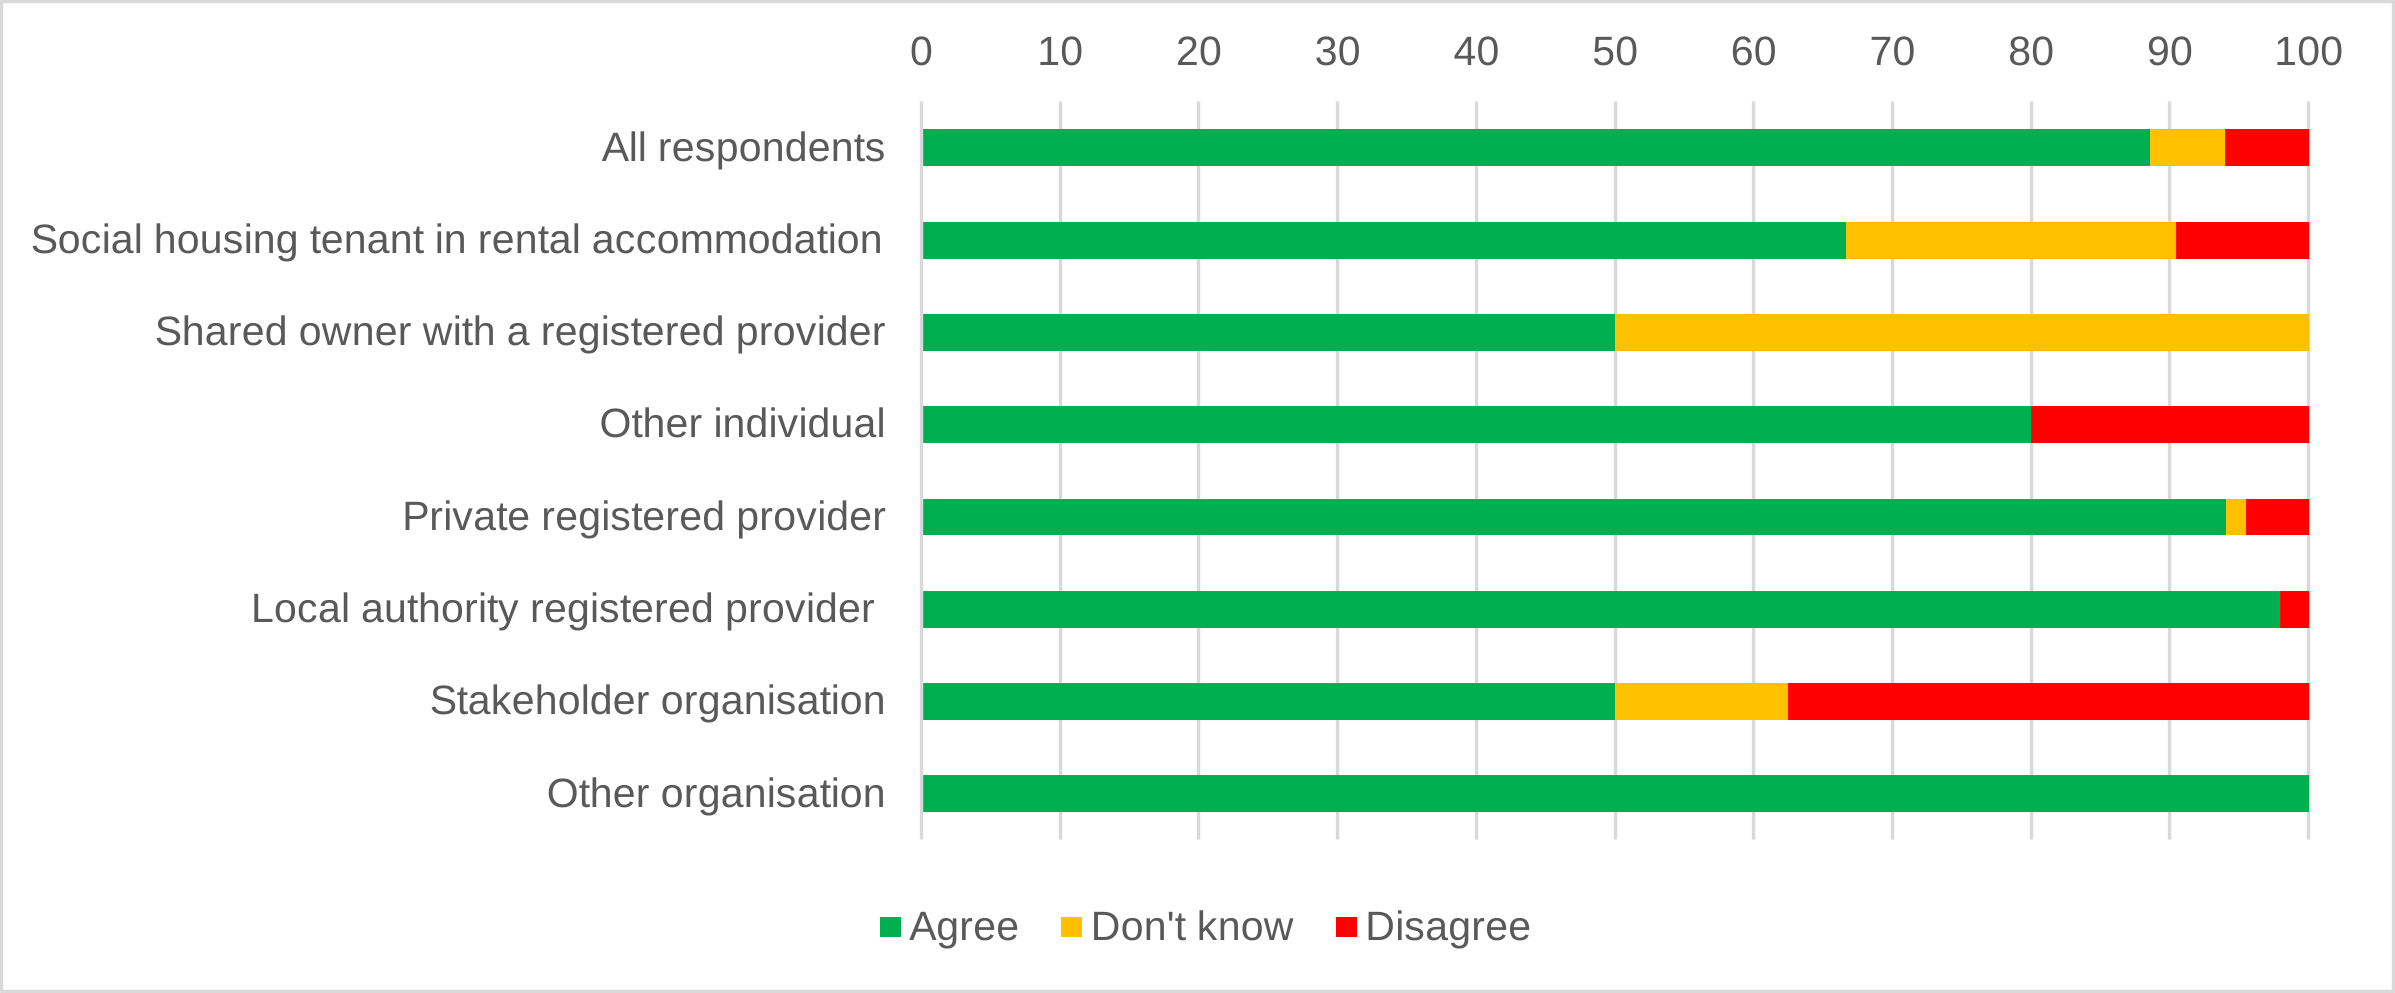
Table 4. Overview of responses to Question 4
| Responses | Agree | Disagree | Don’t know | ||||
|---|---|---|---|---|---|---|---|
| % | Number | % | Number | % | Number | ||
| Total | 166 | 89 | 147 | 6 | 10 | 5 | 9 |
| Social housing tenant in rental accommodation | 21 | 67 | 14 | 10 | 2 | 24 | 5 |
| Shared owner with a registered provider | 4 | 50 | 2 | 0 | 0 | 50 | 2 |
| Other individual | 5 | 80 | 4 | 20 | 1 | 0 | 0 |
| Private registered provider | 67 | 94 | 63 | 4 | 3 | 1 | 1 |
| Local authority registered provider | 48 | 98 | 47 | 2 | 1 | 0 | 0 |
| Stakeholder organisation | 8 | 50 | 4 | 38 | 3 | 13 | 1 |
| Other organisation | 13 | 100 | 13 | 0 | 0 | 0 | 0 |
Chart 4. Overview of responses to Question 4
Question 6. Do you agree or disagree with our regulatory and equality impact considerations (as set out in Annexe 5)?
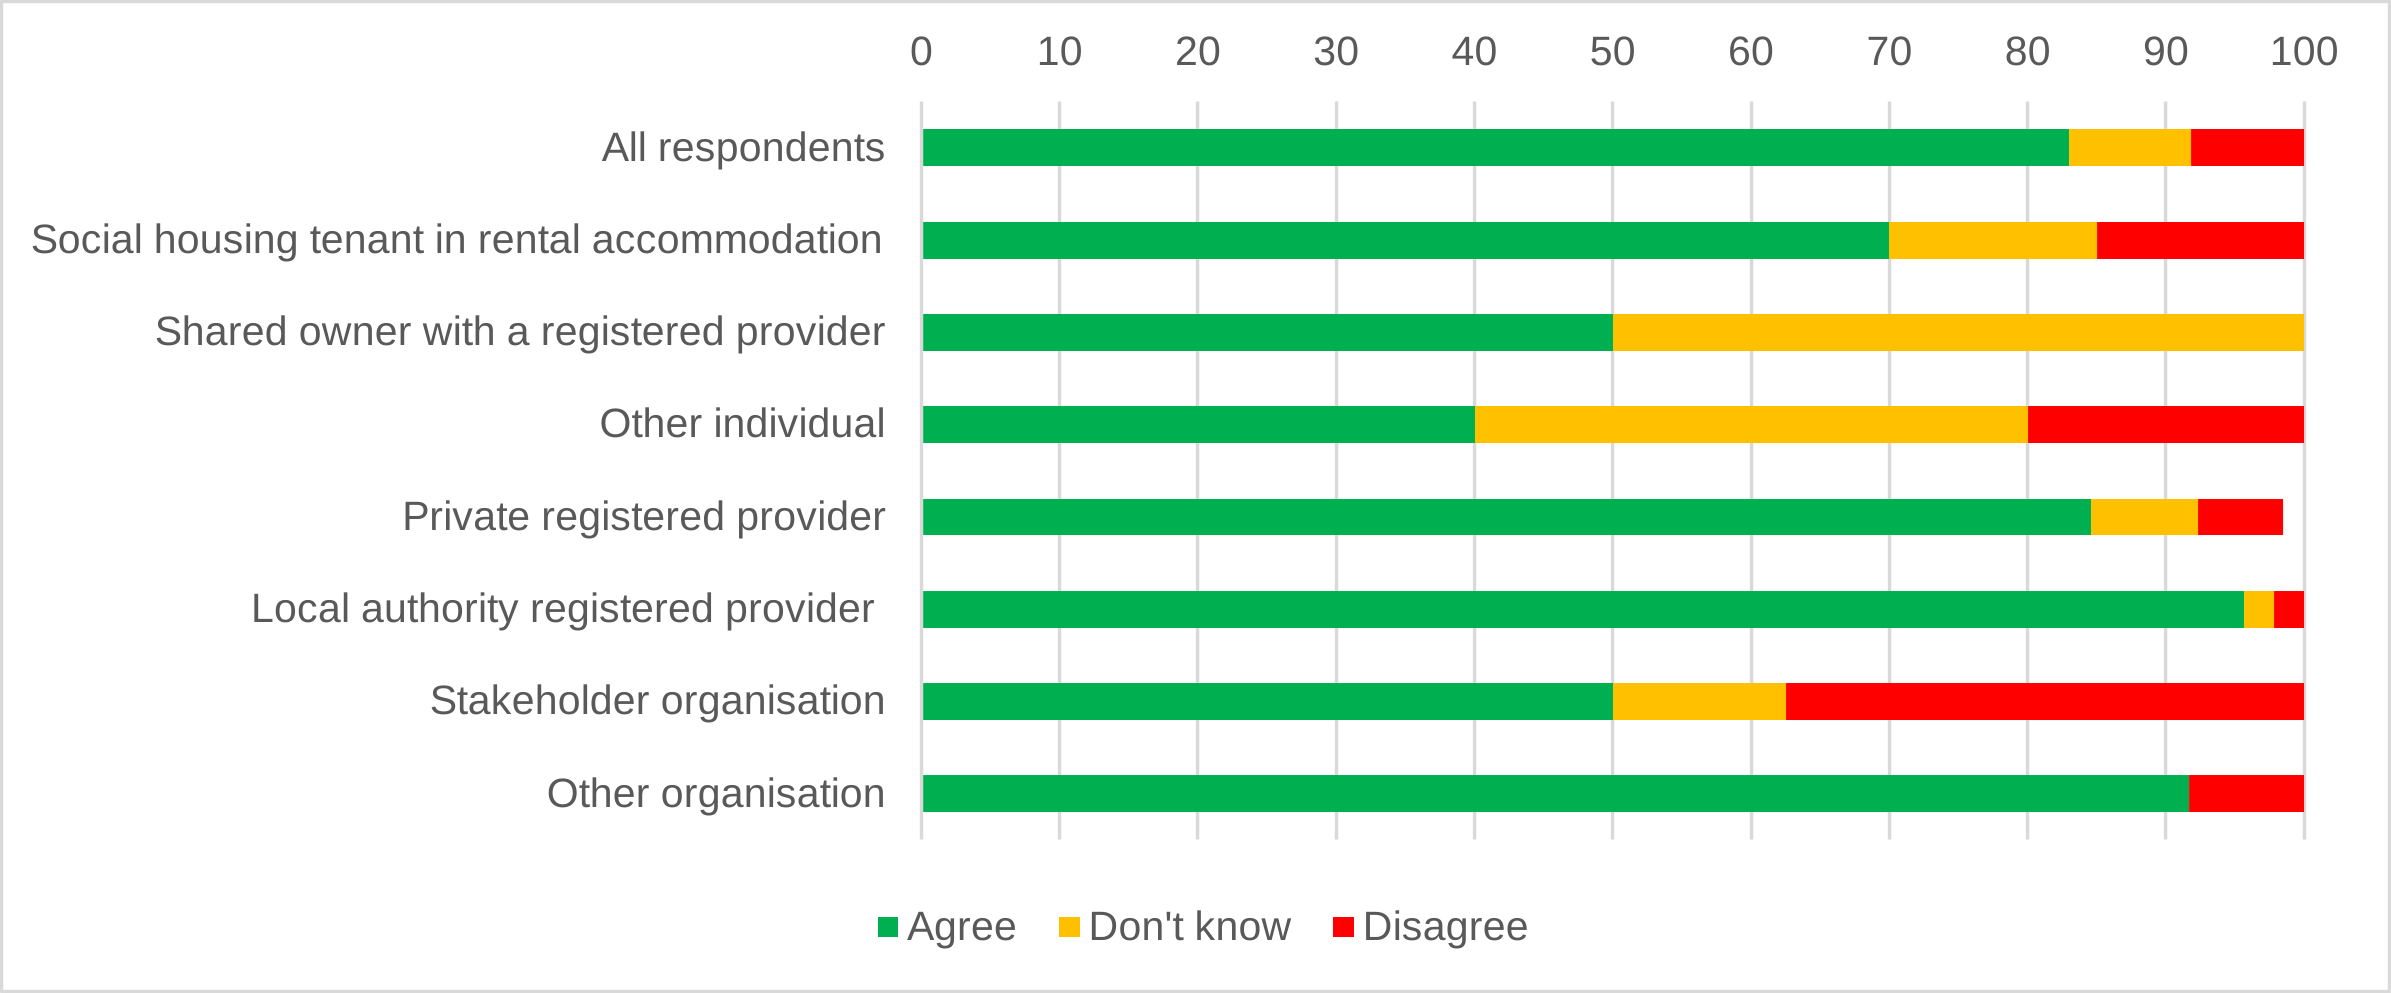
Table 6. Overview of responses to Question 6
| Responses | Agree | Disagree | Don’t know | ||||
|---|---|---|---|---|---|---|---|
| % | Number | % | Number | % | Number | ||
| Total | 160 | 83 | 133 | 8 | 13 | 9 | 14 |
| Social housing tenant in rental accommodation | 20 | 70 | 14 | 15 | 3 | 15 | 3 |
| Shared owner with a registered provider | 4 | 50 | 2 | 0 | 0 | 50 | 2 |
| Other individual | 5 | 40 | 2 | 20 | 1 | 40 | 2 |
| Private registered provider | 65 | 86 | 56 | 6 | 4 | 8 | 5 |
| Local authority registered provider | 46 | 96 | 44 | 2 | 1 | 2 | 1 |
| Stakeholder organisation | 8 | 50 | 4 | 38 | 3 | 13 | 1 |
| Other organisation | 12 | 92 | 11 | 8 | 1 | 0 | 0 |
Chart 6. Overview of responses to Question 6
-
Further details on decisions relating to the Electrical safety checks TSM, including numerical analysis of responses, can be found at Consultation on changes to the TI&A Standard - GOV.UK ↩
-
As a result of rounding to the nearest whole number, in a small number of cases the total of the percentages will be slightly above or below 100%. ↩
-
Including applicants for social housing ↩