Monitoring discharges to water: analytical quality control charts
Formerly part of M18, how to prepare and interpret analytical quality control (AQC) charts to verify the performance of your monitoring method.
Applies to England
When you monitor discharges to water and sewer you must verify or validate the performance of your sample analysis method. You must also monitor its ongoing performance for the following reasons:
- to demonstrate that the method’s performance is maintained in a statistically controlled way
- to identify at an early stage any changes (especially deterioration) in the performance of your method
- so you can verify performance historically – through keeping records
- so you can estimate aspects of measurement uncertainty
You can meet these objectives by monitoring ongoing precision and trueness (bias) using control charts.
Control charts are usually used to interpret the results from analysing internal laboratory control samples. They compare the current results against limits set after estimating the variability of an analytical system, while under statistical control.
A method is in statistical control when the variability within the analytical system comes from a stable set of sources of random analytical variability.
Various forms of control chart may be appropriate, such as:
- Shewhart charts – probably the most common
- Cusum charts – more sensitive to bias detection than Shewhart charts
- zone control charts (J-Charts) – which combine the capabilities of Shewhart and Cusum charts
As a minimum, you should use a Shewhart chart. We have provided an example.
You should verify the performance of each analytical method for each batch of samples analysed. You should run AQC samples within the analytical batch they have been prepared with.
AQC samples should be traceable, and can be:
- certified reference materials
- in-house reference materials
- spiked effluents
- aqueous standards
You should also take at least one blank sample per batch through the entire analytical method. A result above the normal method reporting limit would show evidence of contamination. This should be investigated and you may need to repeat the analysis of the entire batch of samples.
Laboratories should have written procedures that prescribe and justify the way they use blank samples.
Setting up and updating control charts
You should set up control charts using estimates of mean (M) and standard deviation (SD). You should get these estimates from the results of at least 20 AQC samples, obtained when the analytical system is under statistical control.
You can obtain this data during method validation procedures. As you obtain more data, you should incorporate it into the estimates of M and SD, until you have 60 to 100 data points, depending on frequency of analysis.
The precision and bias should not be greater than the targets set for determinands in the MCERTS performance standard.
As a general rule, you should never exceed these performance standards:
- metals: 5% relative standard deviation (RSD)
- inorganics: 10% RSD
- organics: 15% RSD
If required, you should apply statistical significance tests. These are described in the MCERTS performance standard for organisations undertaking sampling and chemical testing of water.
The charts should be reviewed by a senior member of staff at least once a month, unless the analysis is performed infrequently.
You should re-evaluate the estimates of M and SD at least annually, using data obtained since the last evaluation.
If any of the data points have breached the control rules, and you can assign a definite cause, then you should not use these data points. Some results (which are part of the normal distribution) will breach even the ‘action’ limits. Use these if there is no specific reason for the breach.
You should test the new values to see if any significant change in precision (expressed as SD) has occurred, using an F test at the 95% confidence level. You should use a student’s t test, again at the 95% confidence level, to see if the mean has changed significantly.
If a statistically significant change has occurred, then use the new values in the control rules, and draw new control lines on control charts. If you do not detect any significant changes then do not make any changes.
You should investigate all significant changes, even if precision and bias are still within the targets set.
Control rules and investigating failure
You should set rules to indicate whether the analytical method is in control. A laboratory should have documented procedures that:
- define loss of statistical control
- specify actions to be taken when control limits are breached
The results of a repeat analysis of a single sample should be normally distributed around M. The properties of the normal distribution allow you to predict the following results for ongoing analysis (given no deterioration in method performance):
- 95% of results will fall within ± 2 times SD of M
- 99.7% of results will fall within ± 3 times SD of M
On a Shewhart chart these are called the warning and action limits.
As AQC results become available, you should plot them individually and consecutively against time. You must not average them before plotting.
You can include the following control rules to indicate a system failure:
- 1 AQC result outside a control chart action limit
- 2 consecutive AQC results outside a control chart warning limit
- 9 successive AQC results on the same side of the chart M could indicate a change in the trueness (bias) of the analytical system - you should investigate this
However, the observed bias may be due to a small insignificant change. Laboratories should use other methods of identifying significant changes in bias.
You should investigate all breaches and record the findings and actions. You must re-analyse samples in an analytical batch where AQC samples breach the control rules.
Your investigation should include the following checks as a minimum. Check:
- for any changes in the concentration of stock standard solutions and reagents and that they are all in date
- on the calibration of all instruments used in the analytical process
- that methods were followed as written
- that the system suitability check data meets requirements
- that no significant drift has occurred for automated runs
- the service and faults log
Records should include:
- the identification of the control sample and all associated sample results
- the control limits in force at the time of the breach and the breach result
- details of the investigation, conclusions and actions taken
- whether the sample results were reported
Reporting
You should not report results associated with failed AQC samples. Though in some circumstances (for example where it may be impossible to repeat the sampling or analysis) there may be no alternative. Whenever you report results associated with failed AQC, they should only be issued under the direct authority of an appropriate manager and with agreement from the Environment Agency.
If you issue a report that contains results associated with failed AQC you must include a note to identify the result.
Example of a Shewhart control chart
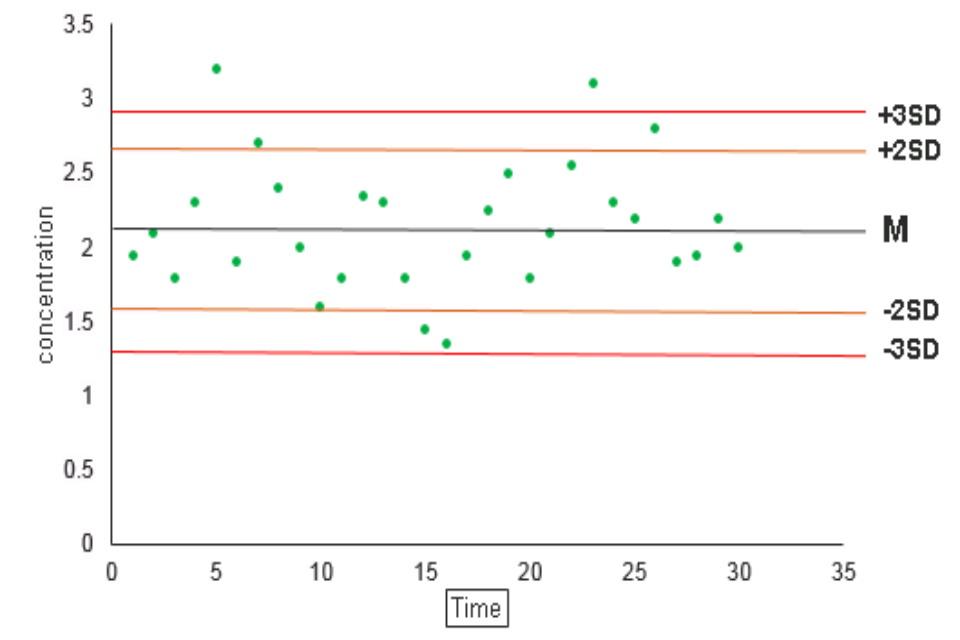
The image shows an example of a Shewhart control chart, with 'time' on the horizontal axis and 'concentration' on the vertical axis.