Youth Justice Statistics: 2021 to 2022 (accessible version)
Published 26 January 2023
Applies to England and Wales

© Crown copyright 2023
This publication is licensed under the terms of the Open Government Licence v3.0 except where otherwise stated. To view this licence, visit nationalarchives.gov.uk/doc/open-government-licence/version/3 or write to the Information Policy Team, The National Archives, Kew, London TW9 4DU, or email: psi@nationalarchives.gov.uk.
Where we have identified any third party copyright information you will need to obtain permission from the copyright holders concerned.
This publication is available at https://www.gov.uk/government/statistics/youth-justice-statistics-2021-to-2022/youth-justice-statistics-2021-to-2022-accessible-version
The youth justice system in England and Wales works to prevent offending and reoffending by children. The youth justice system is different to the adult system and is structured to address the needs of children.
This publication looks at the youth justice system in England and Wales for the year ending March 2022. It considers the number of children (those aged 10 to 17) in the system, the offences they committed, the outcomes they received, their demographics and the trends over time.
Main points
| 13,800 children were cautioned or sentenced | ↓ | The number of children who received a caution or sentence has fallen by 13% in the last year with a 79% fall over the last ten years. |
| 8,000 first time entrants to the youth justice system | ↓ | The number of first time entrants has fallen by 10% since the previous year, with a 78% fall from the year ending March 2012. |
| 3,500 knife and offensive weapon offences were committed by children | ↓ | There was a 2% decrease in these offences compared with the previous year. Levels are 3% lower than those seen in the year ending March 2012. |
| Almost three quarters of children remanded to custody received a non-custodial outcome | = | Of those remanded in custody who received a non-custodial sentence, just under half were acquitted or had their case dismissed while just over half received a non-custodial sentence. |
| The average time from offence to completion at court remained high | ↓ | The average time from offence to completion was 217 days, down slightly from 221 days in the previous year but well above pre-pandemic levels. It was 121% higher (or 119 days longer) than the year ending March 2012. |
| The average custodial sentence length increased by six months | ↑ | The average custodial sentence length increased by six months compared with the previous year to 22.8 months. This increase may have been due to a small number of cases which impacted on the overall average. |
| The number of children held in custody has fallen | ↓ | There was an average of around 450 children in custody at any one time during the year. This is a fall of 19% fall against the previous year and a 77% fall against the year ending March 2012. |
| All custodial Behaviour Management measures saw increases in rates | ↑ | Compared with the previous year, rates of separation increased by 56%, assaults by 25%, self harm by 29% and Restrictive Physical Interventions by 17%. The rises are likely due to a return to normal regimes compared with the previous year during periods of COVID-19 restrictions. |
| 31.2% of children and young people reoffended | ↓ | The reoffending rate decreased by three percentage points in the last year and is the lowest on record but is likely to have been impacted by periods of restrictions during the first year of the COVID-19 pandemic. |
For technical details see the accompanying Guide to Youth Justice Statistics
We would welcome any feedback to statistics@yjb.gov.uk
Things you need to know
This publication draws together a range of statistics about children and young people in the YJS from 1 April 2021 to 31 March 2022 (hereafter the year ending March 2022), where available. Following on from the recommendations in the Overcoming Barriers to Trust in Crime Statistics report, this publication guides the user through the flow of children aged 10 to 17 years in the justice system in England and Wales.
The contents of the report will be of interest to government policy makers and those monitoring policy, the agencies engaged with the youth justice system at both national and local levels, academics, the voluntary and community sector and others who want to understand more about the system.
The data described in this publication come from various sources including the Home Office, the Ministry of Justice (MoJ), Youth Custody Service (YCS), Youth Justice Services (YJSs) and youth secure estate providers. The Statistics and Analysis Team at the Youth Justice Board for England and Wales (YJB) produce this report.
Details of all the administrative databases and bespoke collections used for this report can be found in the Guide to Youth Justice Statistics which provides users with further information on the data sources, data quality and terminology, in particular the types of outcomes given to children. Where data are taken from other publications, links can be found within the chapters.
This is an annual report, with the focus on the year ending March 2022, however much of the data used in this report are drawn from quarterly publications and there may be more up to date data available. The purpose of this report is to provide an overall summary of the youth justice system, allowing users to find everything in one place. All data referenced are available in the Supplementary Tables that accompany this report. Separate tables covering YJS level information are also available in an open and accessible format.
Within this publication the words ‘child’ or ‘children’ are used to describe those aged 10 to 17. When the terms ‘child or young person’ or ‘children and young people’ are used, it means that 18 year olds may be included in the data. For example, in the reoffending dataset, someone who entered the cohort aged 17 and subsequently reoffended aged 18 will be included.
Rounding conventions have been adopted in this publication to aid interpretation and comparisons. Figures greater than 1,000 have been rounded to the nearest 100 and those smaller than 1,000 to the nearest 10. Rates have been reported to one decimal place. Percentages have been calculated from unrounded figures and then rounded to the nearest whole percentage. Unrounded figures have been presented in the Supplementary Tables.
The data in this report are compared with the previous year (the year ending March 2021 in most cases), with the year ending March 2012 as a long-term comparator (ten years). Where a ten year comparator is not available, the year ending March 2017 has been used (five year comparator). Any other reference period is referred to explicitly.
Statistician’s comment
This publication draws together a range of statistics about children in the youth justice system. The latest figures highlight the continuing impact of the COVID-19 pandemic on the youth justice system in some areas as well as a continuation of downward trends in others.
The average custodial sentence length increased by six months which may have been affected by a small number of cases which can cause fluctuations in the average custodial sentence length. The average number of days from offence to completion at court remained very high at 217 days, falling by just four days compared with the previous year and well above pre-pandemic levels. The proportion of children in custody on remand increased compared with the previous year to 45% which is likely to have been impacted by the timeliness of offence to completion at court.
In the youth secure estate, behaviour management rates returned to pre-pandemic levels or increased, such as rates of restrictive physical intervention, self harm and assaults in custody following a return to normal regimes in the youth secure estate.
While continuing to be overrepresented across most stages of the youth justice system, there were reductions in the proportions of Black children across several areas including stop and search, arrests, youth cautions, first time entrants, sentencing and children in custody.
Proven reoffending rates have reduced to the lowest on record. While there has been a downward trend in recent years, the latest figure is likely to have been impacted by the impacts of court closures and pauses to jury trials during the periods of restrictions in the first year of the COVID-19 pandemic.
1. Gateway to the youth justice system
In the year ending March 2022:
-
There were around 94,900 stop and searches of children, an 18% reduction on the previous year.
-
Black children were involved in 16% of stop and searches (where ethnicity was known). This was a decrease of two percentage points from the previous year, but 12 percentage points higher than the proportion of Black 10 to 17 year olds in the 2011 population.
-
The majority (78%) of stop and searches of 10 to 17 year olds resulted in No Further Action, while 9% resulted in arrest.
-
Arrests of children increased by 7% compared to the previous year to around 53,000[footnote 1], though there were decreases in the number of arrests of Asian or Other and Black children of 16% and 12% respectively.
This chapter covers data on stop and searches, arrests and youth cautions given to children.
1.1 Stop and searches of children aged 10 to 17
There were around 94,900 stop and searches of children, an 18% reduction on the previous year. The Police Powers and Procedures: Stop and Search publication, from which these data are sourced, states that the higher number for the year ending March 2021 can be partly attributed to proactive policing during the COVID-19 lockdown periods.
Figure 1.1:Number of stop and searches of children by ethnicity as a proportion of total where ethnicity is known[footnote 2], England and Wales, years ending March 2021 to 2022
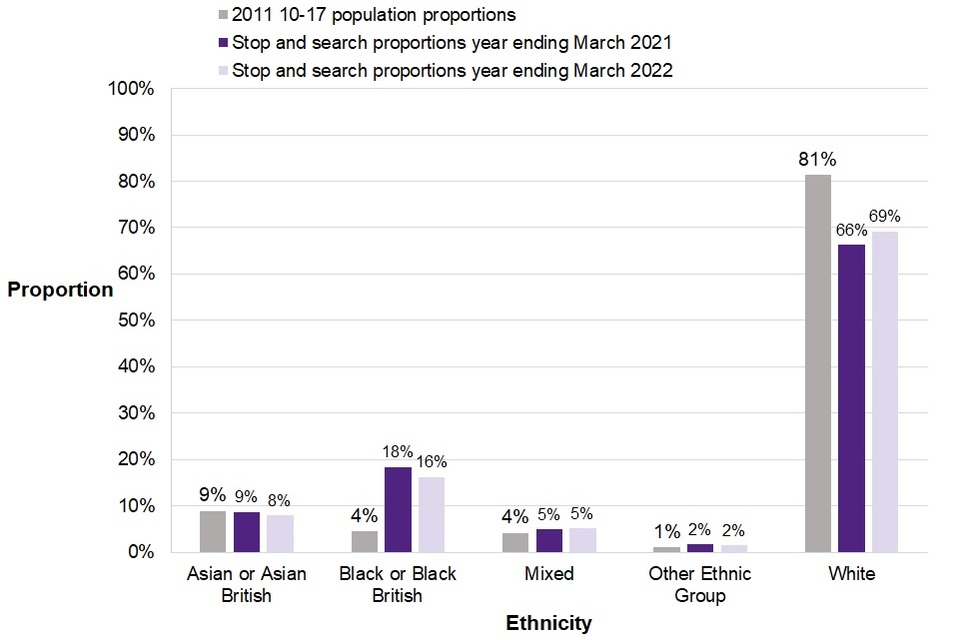
Figure 1.1 shows the ethnicity with the highest stop and search proportion in the latest year is White children at 69%, whilst Black children represented 16% of searches.
Figure 1.1 shows that Black children were involved in 16% of stop and searches (where ethnicity was known). This was a decrease of two percentage points from the year ending March 2021, but 12 percentage points higher than the proportion of Black 10 to 17 year olds in the 2011 population. There was an increase of three percentage points in the proportion of White children involved in a stop and search compared with the previous year (66% in the year ending March 2021 compared with 69% in the latest year), the only ethnic group to see an increase.
Around 93,600 (99%) stop and searches were carried out under Section 1 of the Police and Criminal Evidence Act (PACE) 1984 which provides police with the power to stop and search a person or vehicle where they have reasonable grounds that they will find prohibited items including offensive weapons or drugs.
The remaining 1,300 (1%) of stop and searches were carried out under section 60 of the Criminal Justice and Public Order Act of 1994, which gives police the right to search people in a defined area during a specific time period after serious violence has taken place or when police believe that serious violence will take place.
Figure 1.2: Number and proportion[footnote 3] of stop and searches by outcome type, England and Wales, year ending March 2022
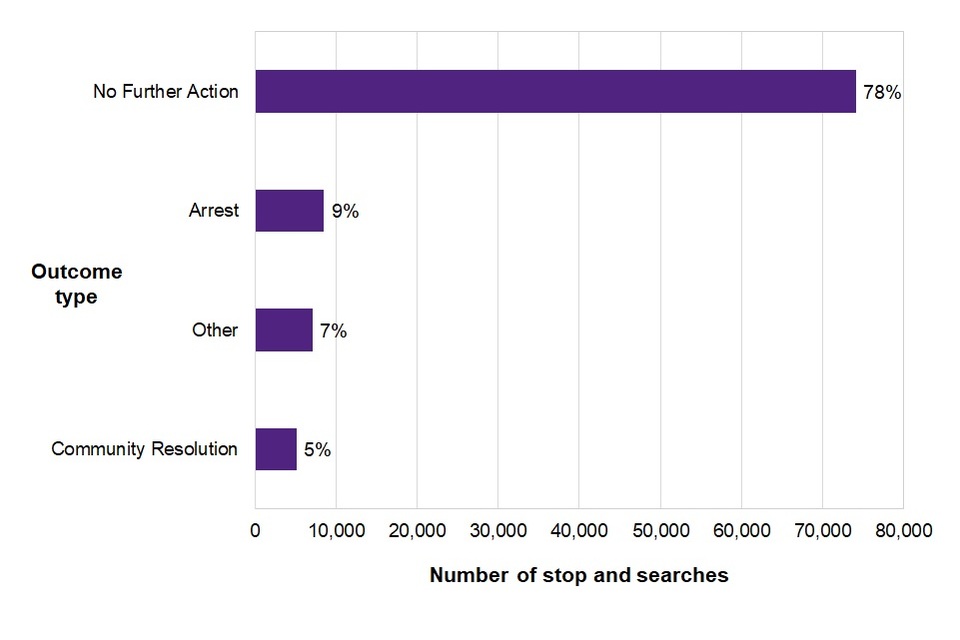
Figure 1.2 shows that in the latest year the most common stop and search outcome is no further action (78% of outcomes) and community resolution is the least common (5%).
As figure 1.2 shows, the majority (around 74,200 or 78%) of stop and searches of 10 to 17 year olds resulted in No Further Action, while around 8,500 (9%) resulted in arrest, 5,100 (5%) resulted in Community Resolutions and the remaining 7,100 (7%) resulting in other outcomes including Cannabis Warnings, Seizure of Property or Verbal Warnings.
1.2 Arrests of children for notifiable offences
Figure 1.3: Trends in arrests of children for notifiable offences[footnote 4], England and Wales, years ending March 2012 to 2022
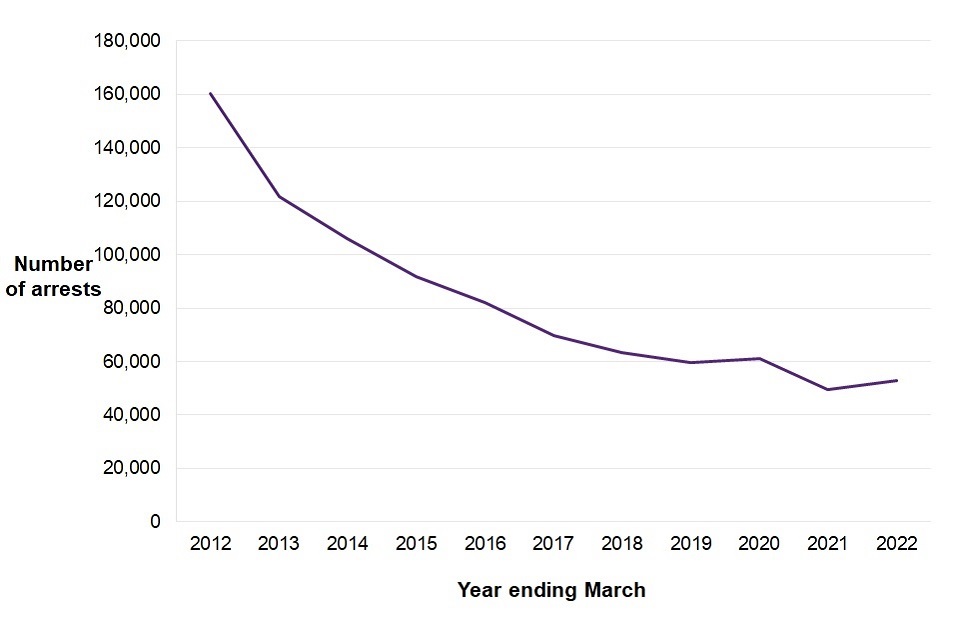
Figure 1.3 shows a largely downward trend in number of arrests for notifiable offences over the last ten years, with arrests reducing from 121,900 in 2012 to just under 53,000 in 2022, with a small increase in the most recent year.
In the latest year, there were just under 53,000 arrests of children (aged 10 to 17) for notifiable offences. This was an increase of 7% compared to the year ending March 2021, which saw the lowest number of arrests of children since the time series began and was likely to be driven in part by the periods of restrictions during the COVID-19 pandemic.
1.3 Arrests of children by offence group
Figure 1.4: Percentage change in arrests by offence group, England and Wales, years ending March 2021 to 2022
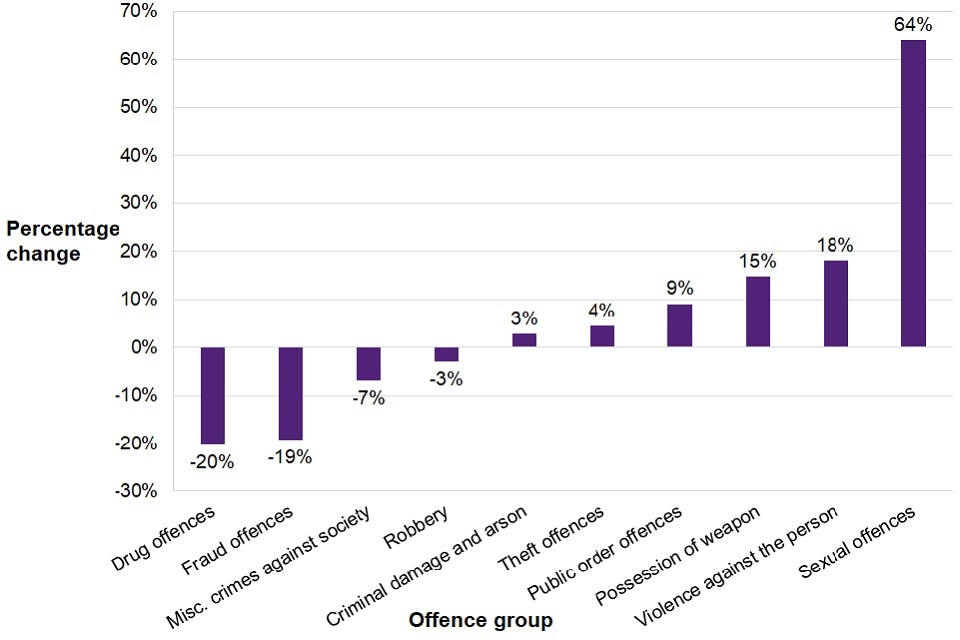
Figure 1.4 shows the percentage changes in the latest year across ten different offence groups, with drug offences having the highest decrease (-20%) and sexual offences having the highest increase (64%).
Figure 1.4 shows the year on year percentage change in the number of arrests by offence group. Sexual offences saw the biggest rise with a 64% increase on the previous year (from around 1,700 to around 2,900). This was followed by smaller rises for arrests for violence against the person offences and possession of weapons offences which increased by 18% and 15% respectively. Arrests for drugs offences and fraud offences saw the biggest decreases falling by 20% and 19% year on year respectively.
1.4 Arrests of children by ethnicity
Figure 1.5: Arrests of children for notifiable offences by ethnicity as a proportion of total arrests of children, England and Wales, years ending March 2012 to 2022
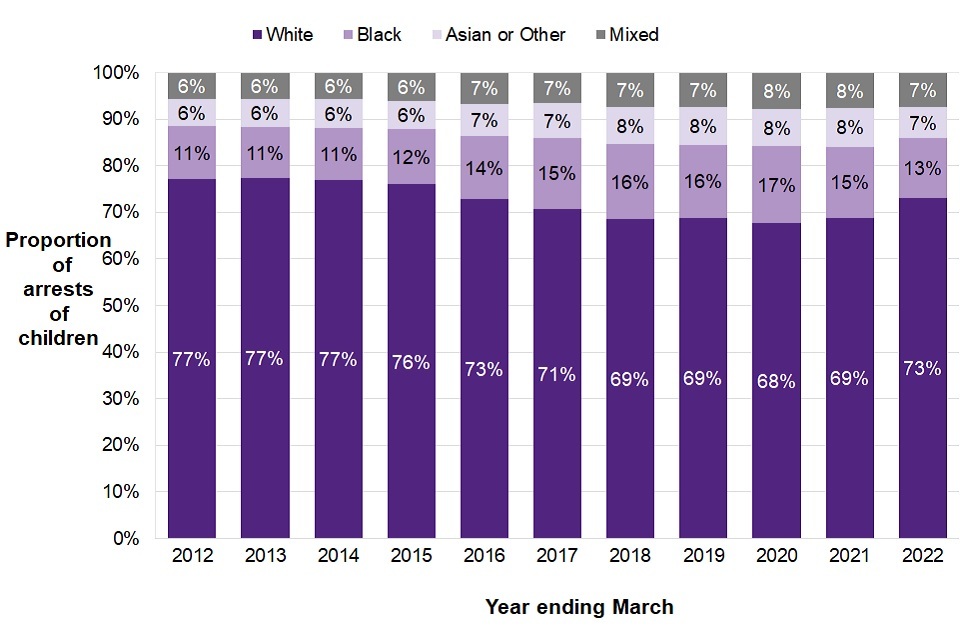
Figure 1.5 shows white children form the highest proportion of arrests for notifiable offences across the last ten years, with an increase in the latest year from 69% to 73%.
In the latest year, 73% (around 33,300) of arrests were of White children. This proportion is a decrease from 77% in the year ending March 2012, though an increase from 69% in the previous year. Arrests of Black children accounted for 13% (around 5,800) of arrests in the latest year, two percentage points higher than the proportion ten years ago but two percentage points lower than the previous year and four percentage points lower than the year ending March 2020. Arrests of Mixed (around 3,300) and Asian and Other (around 3,100) children both made up 7% of the total in the latest year and have also seen changes in proportions over the last ten years, albeit on a smaller scale.
Compared with the year ending March 2012, the numbers of arrests of children of each ethnicity have all decreased by a large degree, but at different rates. For example, arrests of White children have fallen by 73%, compared to 67% for Black children. This has led to a change in the proportions of arrests by ethnicity.
Compared with the previous year, there was an 11% increase in the number of arrests of White children, while there was a decrease of 16% of arrests of Asian or Other children, and a decrease of 12% in the number of arrests of Black children.
1.5 Youth cautions[footnote 5]
Figure 1.6: Trends in youth cautions given to children, England and Wales, years ending March 2012 to 2022
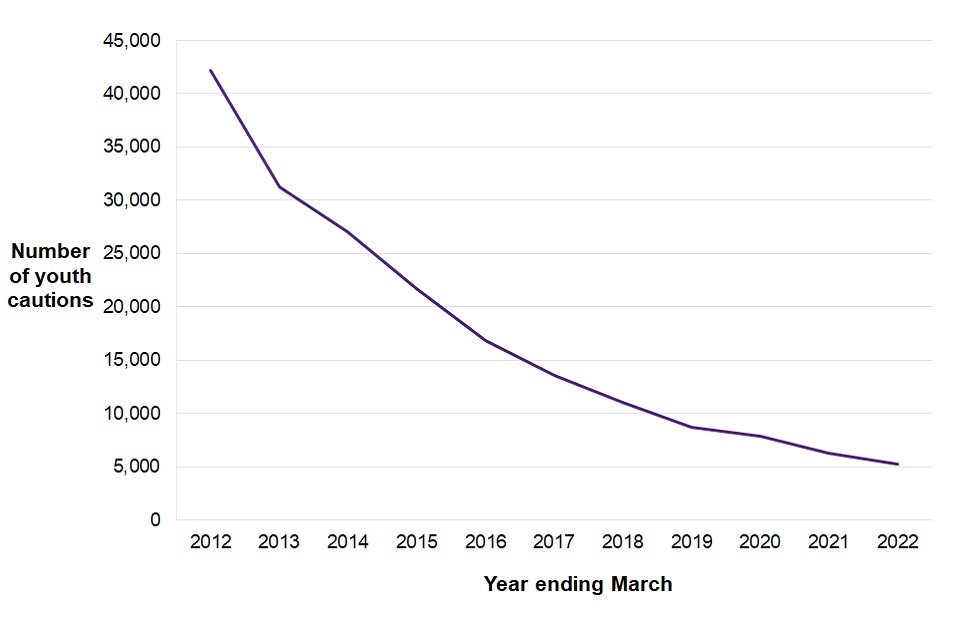
Figure 1.6 shows a downward trend in the number of youth cautions given to children, from around 42,200 ten years ago to around 5,300 in the latest year.
In the year ending March 2022, around 5,300 youth cautions were given to children. This is a decrease of 88% since the year ending March 2012, with a decrease of 16% compared with the previous year.
Youth cautions increased by 2% for both violence against the person and public order offences compared with the previous year, while there were either decreases or no change in youth cautions given for all other offence types (Supplementary Table 1.16).
Figure 1.7: Number of youth cautions by ethnicity[footnote 6] as a proportion of total given, England and Wales, years ending March 2012 to 2022
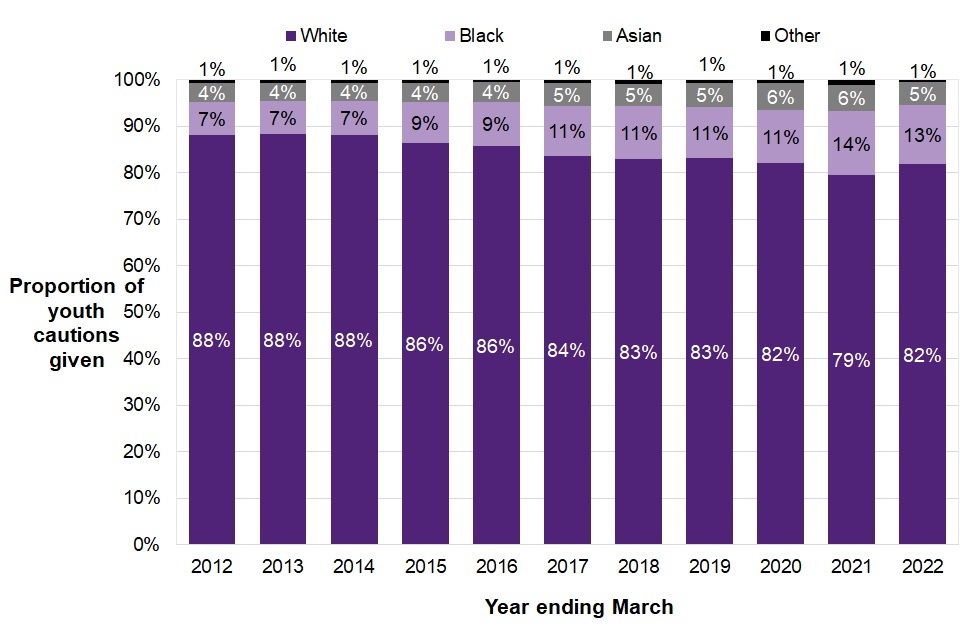
Figure 1.7 shows white children form the highest proportion of youth cautions across the last ten years, with the proportion decreasing from 88% in 2012 to 82% in 2022.
In the latest year, the proportions of youth cautions issued have decreased for Black children and increased for White children, while remaining broadly stable for Asian and Other children. All ethnic groups have seen decreases in the volume of youth cautions issued over the course of the decade. However, there was a smaller decrease for Black children when compared to other ethnic groups, leading to an increase in the proportion of youth cautions Black children made of the total, from 7% to 13% over the last decade.
Figure 1.8: Trends in numbers and proportions of youth cautions given by type, England and Wales, years ending March 2020 to 2022
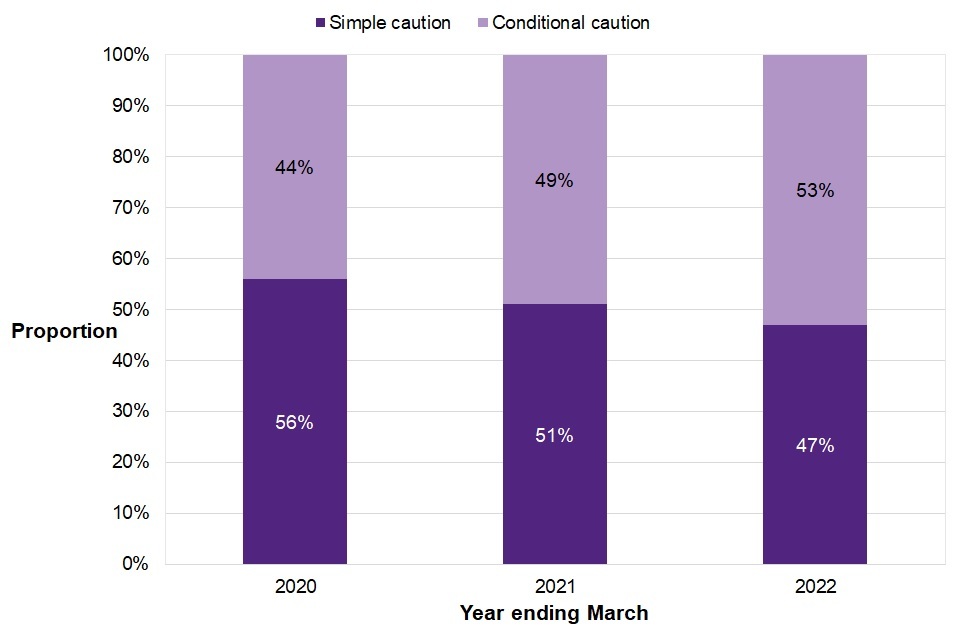
Figure 1.8 shows that conditional cautions have a higher proportion than simple cautions in the latest year at 53%, which is an increase of four percentage points compared with the previous year.
For the first time, the Ministry of Justice has made available youth caution data by type, covering the last three years. Figure 1.8 shows that conditional cautions are higher than simple cautions in the latest year with an increase of four percentage points compared with the previous year.
2. First time entrants to the youth justice system
In the year ending March 2022:
-
There were around 8,000 child first time entrants (FTEs) to the youth Justice system. The number of child FTEs has continued to fall, as it has done in each of the last ten years, with a 10% decrease since the previous year and a 78% decrease since the year ending March 2012.
-
There were increases for child FTEs committing summary motoring offences (up 13%), violence against the person and public order offences (both up 2%) compared with the previous year. All other offence types committed by child FTEs decreased, with drug offences and robbery seeing the biggest decreases (falling by 31% and 29% respectively).
-
While all ethnicities saw a decrease in the number of child FTEs compared with the previous year, those from a Black background saw the biggest fall (24%), whilst child FTEs from a White background saw the smallest year on year decrease (10%).
This chapter covers data and trends on trends, demographics, offence and outcome types of child first time entrants. A first time entrant to the youth justice system is a child aged between 10 and 17 who received their first caution or court sentence.
2.1 Trends in the number and proportion of child first time entrants to the youth justice system
Figure 2.1: Child first time entrants, England and Wales, years ending March 2012 to 2022
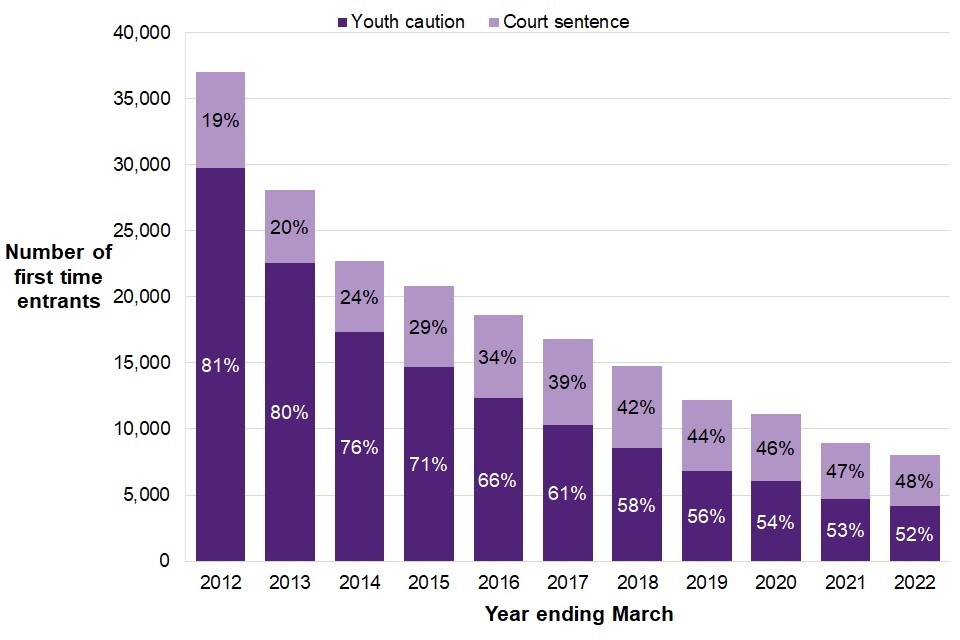
Figure 2.1 shows a downward trend in the number of first time entrants (FTE) in the last ten years. In the latest year 52% of FTE were youth cautions, down from 81% ten years ago, and 48% were court sentences.
The number of child FTEs to the youth justice system (aged 10 to 17) has continued to fall. Compared with the previous year, the number fell by 10% (from around 8,900) to just over 8,000. Compared with the year ending March 2012, the number has fallen by 78% (from around 37,000).
Children accounted for 9% of all FTEs to the criminal justice system in the year ending March 2022, compared to 18% in the year ending March 2012 (see Chapter 11 – Comparisons with the Adult System) and down from 11% in the previous year.
As shown in Figure 2.1, the difference between the number of child FTEs receiving a caution as opposed to a court sentence is much smaller in recent years compared with ten years ago. While the majority of child FTEs received a caution in each of the last ten years, this proportion has fallen from 81% in the year ending March 2012 (when around 29,800 child FTEs received a caution), to 52% in the year ending March 2022 (when just under 4,200 child FTEs received a caution). Though youth cautions and court sentences have both been decreasing in this period, youth cautions fell at a faster rate.
The number of child FTEs receiving a court sentence (predominantly community sentences) had been falling year-on-year from the year ending March 2012 to March 2015 and rising thereafter before falling again in year ending March 2018. Since the year ending March 2012, the proportion of child FTEs receiving a sentence has increased from 19% to 48%.
2.2 Characteristics of child first time entrants
Figure 2.2: Demographic characteristics[footnote 7] of child first time entrants compared to the general 10 to 17 population[footnote 8], England and Wales, year ending March 2022
| Aged 10 to 14 | Aged 15 to 17 | Boys | Girls | |
| FTEs | 27% | 73% | 85% | 15% |
| 10 to 17 population | 64% | 36% | 51% | 49% |
Age
The average age of FTEs has increased compared with ten years ago [footnote 9]. It increased from 15.1 years old in the year ending March 2012 to 15.4 in the latest year. Over the last ten years, the average age of child FTEs receiving a sentence has always been higher than the average age of those receiving a youth caution (Supplementary Table 2.8).
Sex
There have always been more boys than girls who are child FTEs. In the year ending March 2022, boys comprised 85% of the total child FTEs, whilst making up 51% of the general 10 to 17-year-old population.
The number of child FTEs has fallen for both boys and girls over the last decade, with the larger percentage decrease seen in girls. The number of child FTEs who are girls has fallen by 87% (from around 9,400 to around 1,200) over the last ten years. This compares to a decrease of 76% for child FTEs who are boys over the same period (from around 27,400 to around 6,700). In the latest year, for the first time in the time series, there was a greater year on year percentage decrease in the number of child FTEs who were boys than child FTEs who were girls, an 11% fall in child FTEs who are boys compared to a 6% decrease in girls (Supplementary Table 2.6).
Figure 2.3: Number of child first time entrants by ethnicity, England and Wales, years ending March 2012 to 2022
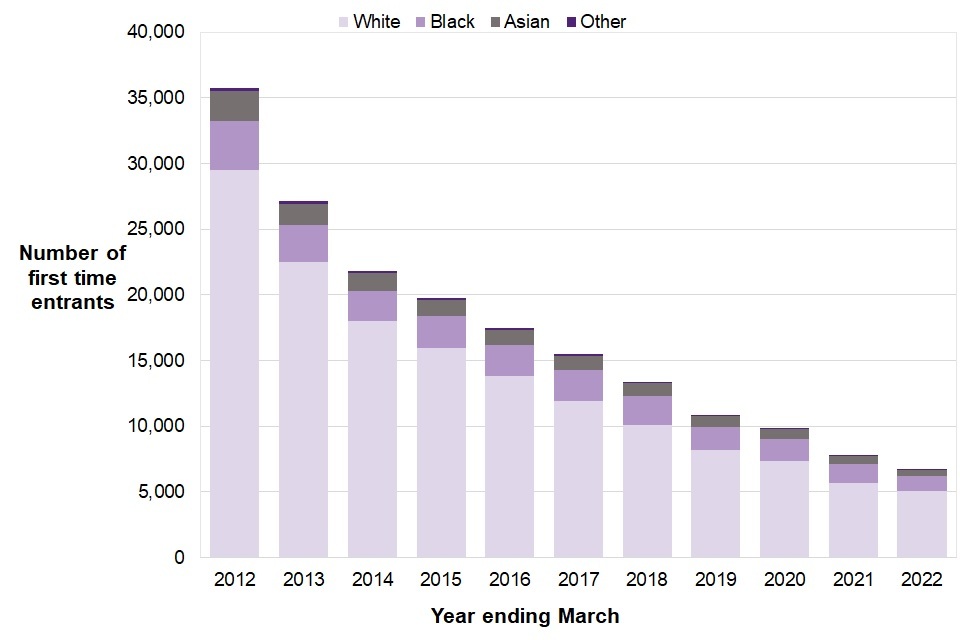
Figure 2.3 shows a general downward trend in the number of first time entrants (FTE) in the last ten years across all ethnic groups.
Ethnicity
As shown in Figure 2.3, the number of child FTEs has been falling for each ethnicity over the last ten years (except for FTEs from a Black ethnic background in which there was a small increase between the years ending March 2014 to 2015 and March 2016 to 2017). Child FTEs from a White ethnic background have fallen at the fastest rate, by 83% over the last ten years, resulting in the proportion[footnote 10]they comprise of all child FTEs reducing from 82% to 75%.
While all ethnicities saw a decrease in the number of child FTEs compared with the previous year, those from a Black background saw the biggest fall (24%), whilst child FTEs from a White background saw the smallest year on year decrease (10%).
The proportion of child FTEs from a Black background has decreased from 18% to 16% in the most recent year but remains higher than the 10% seen ten years ago. The proportion of child FTEs from an ethnic minority background has decreased to 25% in the year ending March 2022, compared to 27% last year.
2.3 Types of offences committed by child first time entrants
In the year ending March 2022, the two most common offences committed by child FTEs were summary offences excluding motoring and possession of weapon offences. These offence types both accounted for 21% of all offences committed by child FTEs. Compared with the year ending March 2012, the proportion of theft offences fell from 27% to 9%.
The proportion of child FTEs committing possession of weapon offences increased by 17 percentage points over the last ten years and is the only offence group to see a real term increase in that period.
Figure 2.4: Number and proportion of offences committed by child first time entrants by offence group, England and Wales, years ending March 2012, 2021 and 2022
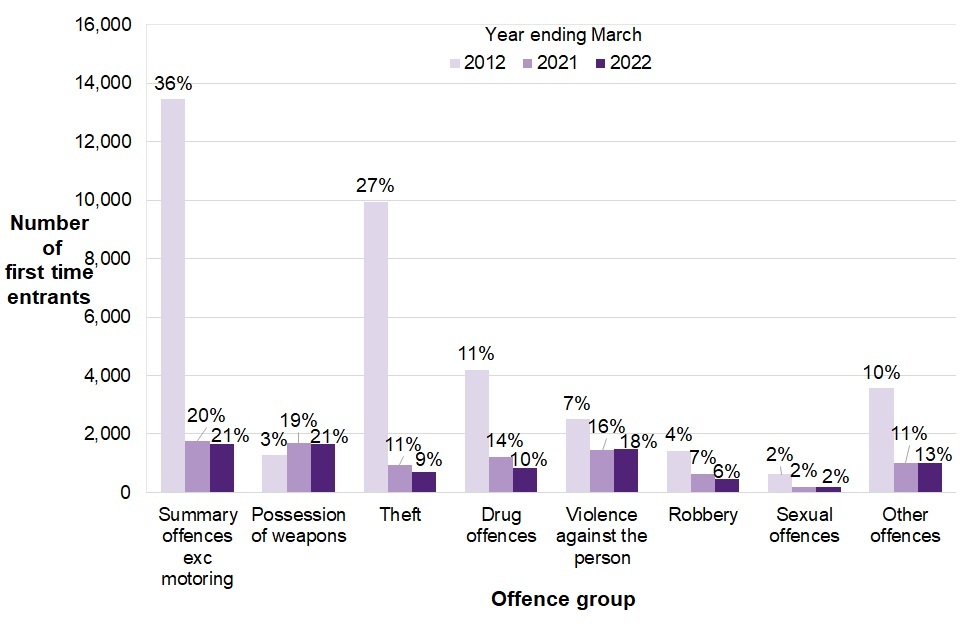
Figure 2.4 shows that summary offences and possession of weapons offences made up the highest proportions of offences (both 21%) committed by child first time entrants in the year ending March 2022.
Supplementary Table 2.2 shows that in the year ending March 2022 there was an increase in the number of offences for summary motoring offences (up 13%), violence against the person and public order offences (both up 2%) for child FTEs compared to last year. All other offence groups saw a decrease.
Compared with ten years ago, all offences for child FTEs saw a real term decrease with the exception of possession of weapons offences which increased by 30%, however the proportion these offences make up have changed over time.
The offence groups for child FTEs that have seen the largest percentage point increases compared with ten years ago are:
-
Possession of weapons offences, increasing by 17 percentage points, to 21% of total;
-
Violence against the person, increasing by 12 percentage points to 18% of total;
The offence groups for child FTEs that have seen the largest percentage point decreases compared with ten years ago are:
-
Theft offences, decreasing by 18 percentage points to 9% of total; and
-
- Summary offences excluding motoring, decreasing 16 percentage points to 21% of total.
3. Demographic characteristics of children cautioned or sentenced
In the year ending March 2022:
-
Around 13,800 children received a caution or sentence, a fall of 13% compared with the previous year and a fall of 79% compared to ten years ago.
-
The proportion of Black children cautioned or sentenced has remained stable at 12% for the third successive year but is four percentage points higher than it was in the year ending March 2012 (12% compared to 8%).
-
All ethnic groups saw decreases in the number of children cautioned or sentenced compared to the previous year, with Asian children seeing the biggest fall of 22%, followed by Black children, decreasing by 16%. Mixed children cautioned or sentenced saw the smallest decrease (9%).
-
The number of children cautioned or sentenced in both the 10 to 14 year old and 15 to 17 year old ages groups decreased by 1% and 15% respectively.
This chapter looks at the trends and demographic characteristics of children who received at least one youth caution or court sentence.
3.1 Number of children who received a caution or sentence
Figure 3.1: Number of children given a caution or sentence, England and Wales, years ending March 2012 to 2022
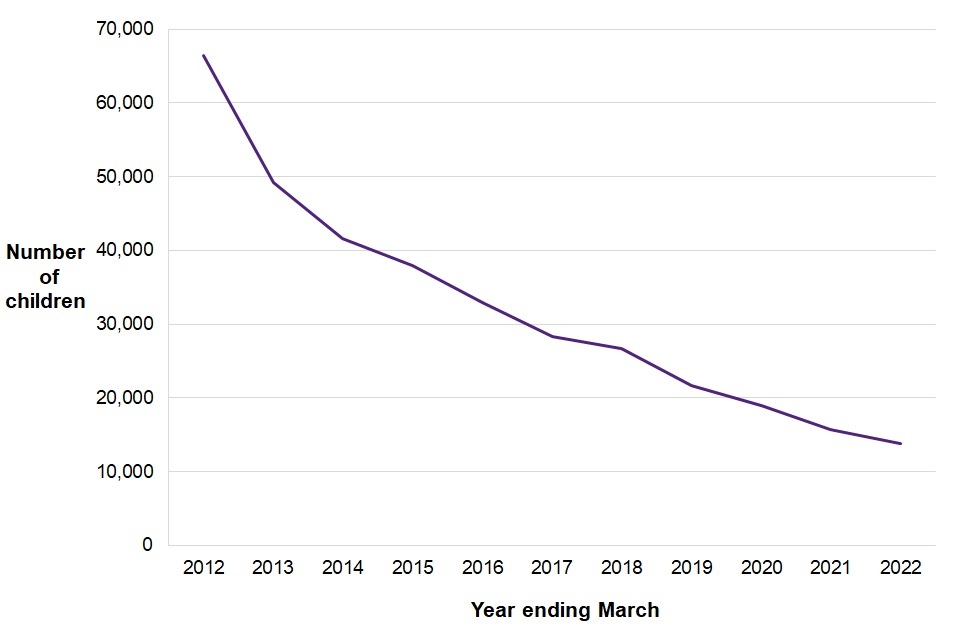
Figure 3.1 shows a downward trend in the number of children receiving a caution or sentence between 2012 (around 66,400) and 2022 (around 13,800).
Around 13,800 children received a caution or sentence in the year ending March 2022. There have been year-on-year falls in each of the last ten years, and in the latest year, 13% fewer children received a caution or sentence than the previous year.
There was a 79% decrease in the number of children who received a caution or sentence compared with ten years ago.
3.2 Demographic characteristics of children who received a caution or sentence
Figure 3.2: Age group and sex of children receiving a caution or sentence compared to the general 10 to 17 population, England and Wales, year ending March 2022
| Age 10 to 14 | Age 15 to 17 | Boys | Girls | |
| Children receiving a caution or sentence | 20% | 80% | 86% | 14% |
| 10 to 17 population | 64% | 36% | 51% | 49% |
Children aged 15 to 17 made up 80% of the offending population, while making up 36% of the 10 to 17 population in England and Wales.
Boys made up 86% of the offending population compared with 51% of the 10 to 17 population in England and Wales.
Figure 3.3: Number of children receiving a caution or sentence by sex[footnote 11], England and Wales, years ending March 2012 to 2022
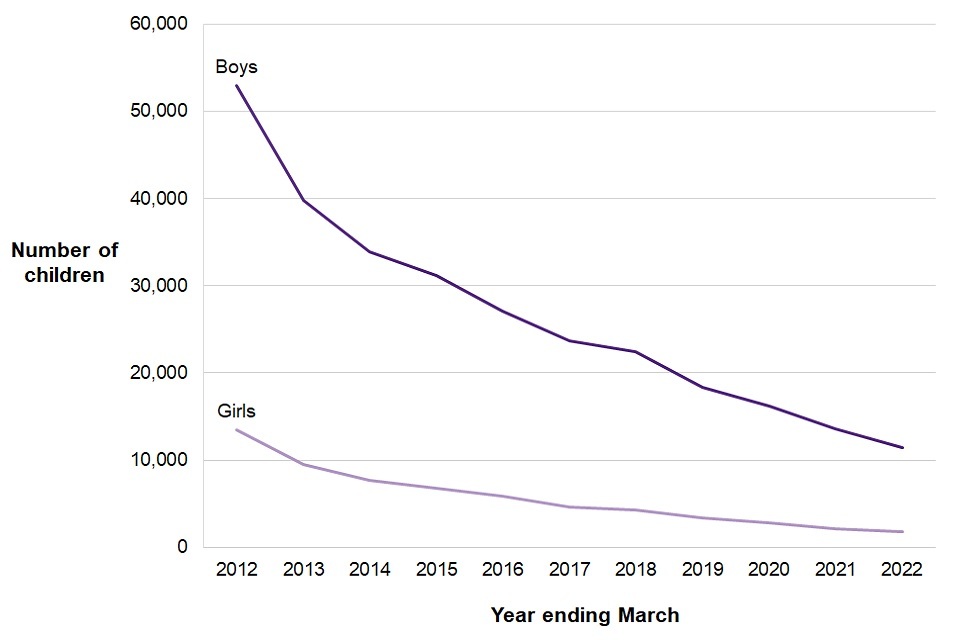
Figure 3.3 shows a downward trend in the number of both boys and girls receiving a caution or sentence between 2012 and 2022.
In the year ending March 2022, around 1,800 girls and around 11,500 boys received a caution or sentence, a decrease of 14% and 16% respectively. The number of girls as a proportion of the total number of children who received a caution or sentence is 14%, and the number of boys is 86%. This compares to 13% and 87% respectively in the previous year.
Compared with the year ending March 2012, the numbers of girls and boys receiving a caution or sentence have fallen by 87% and 78% respectively.
Figure 3.4: Number of children receiving a caution or sentence by age, England and Wales, years ending March 2012 to 2022
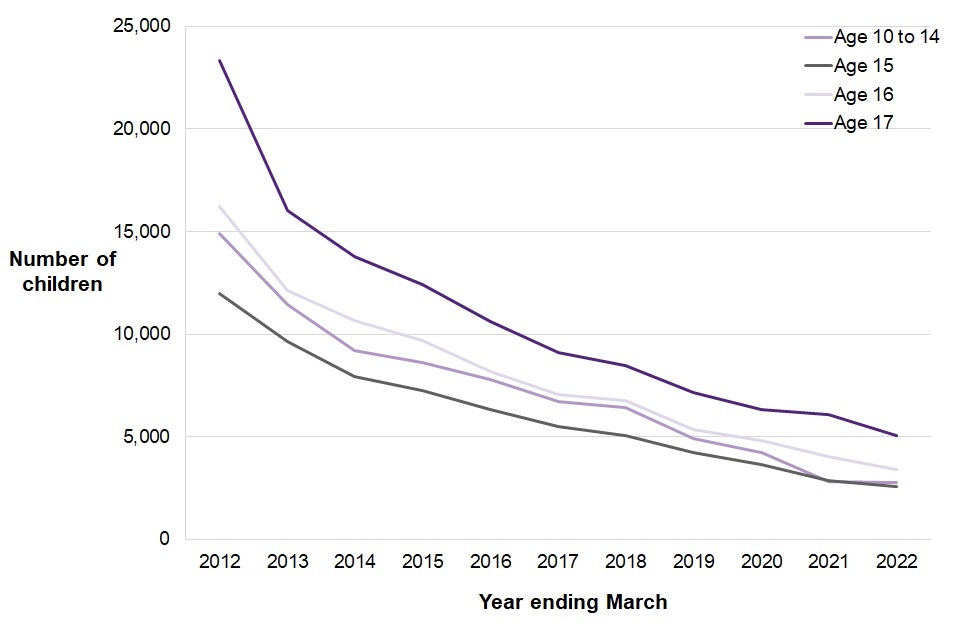
Figure 3.4 shows decreases in the number of children receiving a caution or sentence across all ages over the last ten years.
In the year ending March 2022, the number of 10 to 14 year olds cautioned or sentenced decreased by 1% compared with the previous year, while there was a 15% decrease for 15 to 17 year olds.
The proportions which each age comprises of the overall number of children receiving cautions and sentences have remained broadly stable over this period.
Figure 3.5: Proportion of children receiving a caution or sentence by ethnicity[footnote 12], England and Wales, years ending March 2012 to 2022
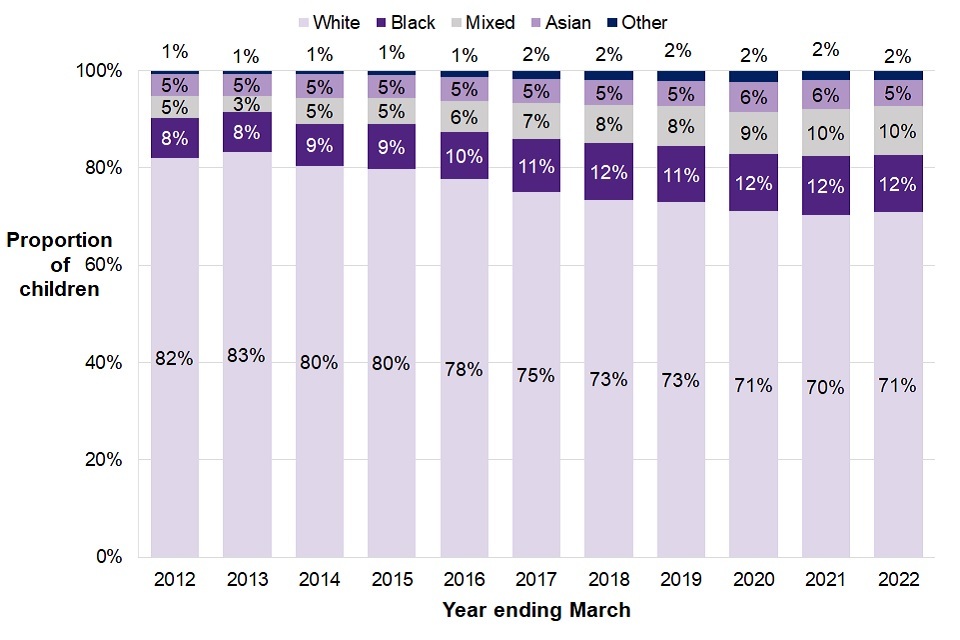
Figure 3.5 shows that across the last ten years white children received the highest proportion of cautions or sentences, albeit decreasing from 82% in 2012 to 71% in 2022.
Supplementary Table 3.1 shows that the number of children cautioned or sentenced has varied by ethnicity over the last ten years. This has led to changes in the proportions each ethnic group make up of all cautions and sentences.
Figure 3.5 and supplementary table 3.1 show that:
-
At 12%, the proportion of Black children cautioned or sentenced is four percentage points higher than it was in the year ending March 2012 , a figure that has been stable at for the last three years.; and
-
Children from a Mixed ethnic background accounted for 10% of those receiving a caution or sentence in the latest year, the proportion doubling since the year ending March 2012 when it was 5%.
4. Proven offences by children
In the year ending March 2022:
-
The number of proven offences committed by children fell by 14% from the previous year to around 33,000, the lowest number of proven offences in the time series.
-
Acquisitive offences[footnote 13]saw the biggest year on year decreases of all offence types with burglary, theft and robbery falling by 32%, 24% and 22% respectively.
-
While the number of violence against the person offences has followed an overall downward trend, this offence group has been steadily increasing as a proportion of all offences over the last ten years, and now accounts for 35% of all proven offences.
-
There were just under 3,500 knife or offensive weapon offences resulting in a caution or sentence committed by children. This is a fall of 2% compared with the previous year.
This chapter looks at the trends of proven offences committed by children and proven knife and offensive weapon offences. A proven offence is one which results in a caution or court sentence.
4.1 Trends in proven offences by children
Figure 4.1: Number of proven offences by children, England and Wales, years ending March 2012 to 2022
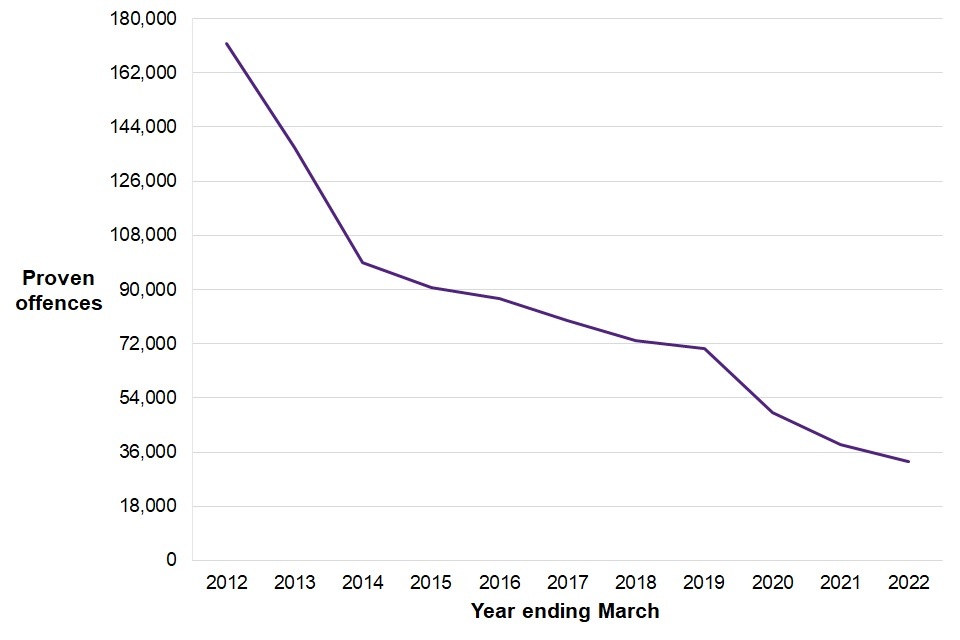
Figure 4.1 shows a consistent reduction in the number of proven offences committed by children in the last ten years, from around 171,800 in 2012 to around 33,000 in 2022.
The number of proven offences committed by children has continued to fall. In the year ending March 2022, there were around 33,000 proven offences committed by children which resulted in a caution or sentence in court. This was the lowest number in the time series and a fall of 14% from the previous year and a fall of 81% since the year ending March 2012.
As Figure 4.1 shows, there were larger falls in the number of proven offences committed by children between the years ending March 2012 and 2014, with more modest decreases since then.
Offence volumes
Supplementary Table 4.1 shows that in the last ten years, the number of proven offences has fallen across all offence groups. Theft, burglary and breach of statutory order are the three offence groups to see the largest fall over this time (with theft decreasing by 92% and burglary and breach of statutory order both falling by 89%).
Compared with the previous year, while all offence types saw a decrease, acquisitive offences saw the biggest year on year falls with burglary, theft and robbery falling by 32%, 24% and 22% respectively. Sexual offences had the smallest decrease, falling by 2% compared with the previous year.
Supplementary Table 4.3 shows that in the year ending March 2022, most proven offences were committed by children who were[footnote 14] :
-
boys (86% of proven offences),
-
aged 15 to 17 (83% of proven offences); and
-
White (72% of proven offences).
Offence volumes as a proportion of total
Figure 4.2: Percentage point change in the proportion of proven offences committed by children, England and Wales, between the years ending March 2012 and 2022
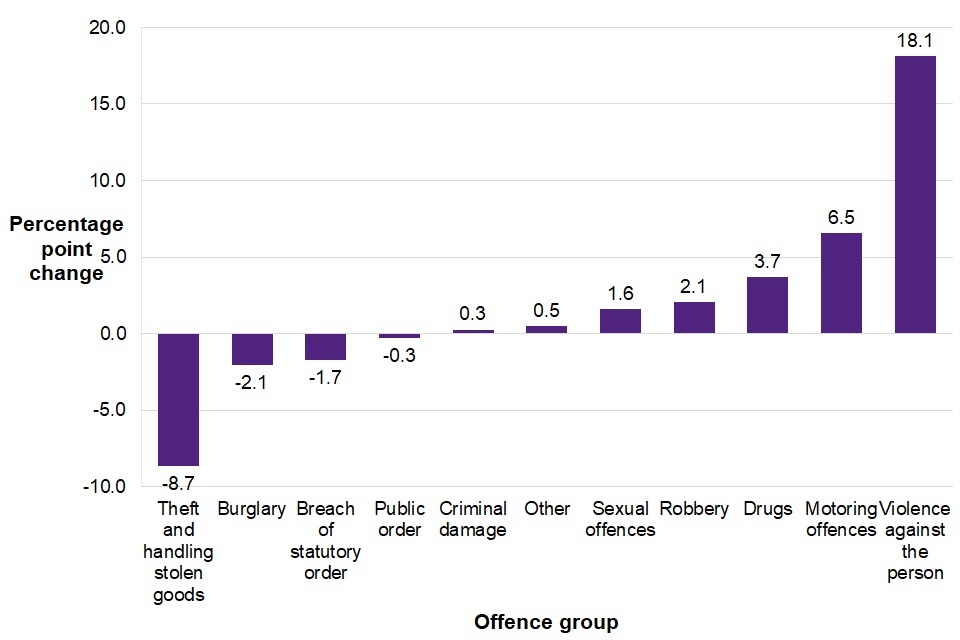
Figure 4.2 shows percentage point (pp) changes across different proven offence groups. Theft and handling stolen goods having the highest decrease (-8.7 pp) and violence against the person having the highest increase (+18.1 pp).
Whilst the number of proven offences committed by children has fallen for all crime types when compared with ten years ago, the proportions of these offence groups has been changing (Figure 4.2). Violence against the person offences have seen the greatest increase in proportion, gradually increasing from 17% in the year ending March 2012 to 35% of proven offences in the latest year.
Theft and handling stolen goods offences have seen the largest proportional decrease in the last ten years, falling by over half from 15% in the year ending March 2012 to 7% in the latest year.
4.2 Offence group by gravity score
Figure 4.3: Proven offences by children, by offence group and gravity score band, England and Wales, year ending March 2022
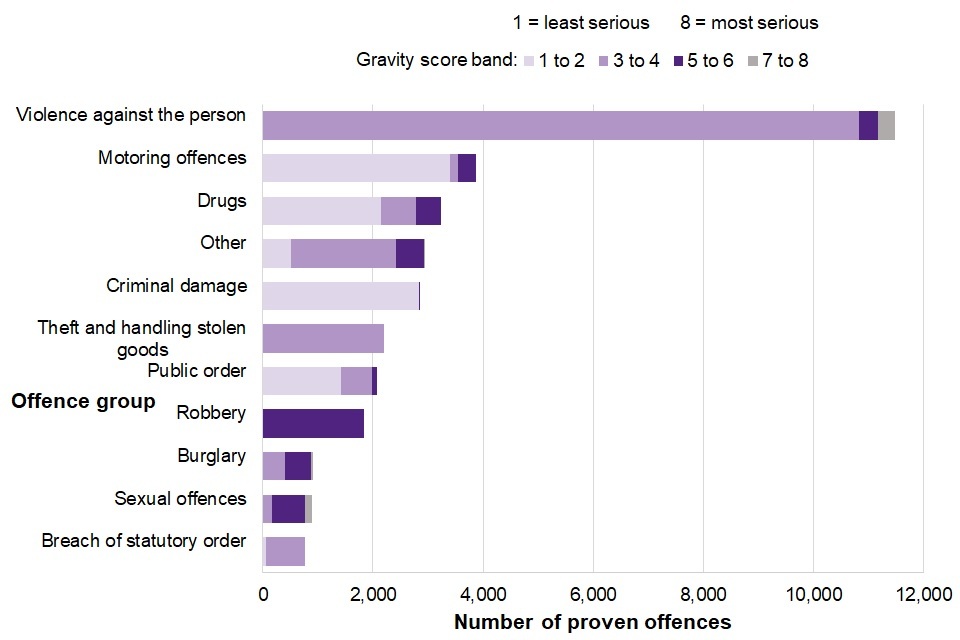
Figure 4.3 shows that violence against the person offences made up the majority of offences, and that a small proportion of these offences had a gravity score over five, whereas the majority of robbery, burglary, and sexual offences were over five.
An offence’s gravity score is scored out of eight, ranging from one (less serious) up to eight (most serious). For example, non-payment of travel fare has a gravity score of 1 while murder has a gravity score of 8.
Figure 4.3 shows that the violence against the person offence group made up the largest share of offences in the year ending March 2022. Only a small proportion of offences (6%) within this group had a higher gravity score of five to eight. For robbery, burglary and sexual offences, the majority of offences had a higher gravity score of five to eight (100%, 57% and 82% respectively).
In the latest year, around 190 proven offences committed by children had the highest gravity score of eight, which accounted for 1% of all proven offences. The majority of these offences were sexual offences (59%) (Supplementary Table 4.4).
Figure 4.4: Proportion of proven offences by gravity score band and demographic characteristics, England and Wales, year ending March 2022
| Gravity Score 1 to 4 (Less Serious) | Gravity Score 5 to 8 (Most Serious) | ||
| Age | 10 to 14 | 88% | 12% |
| Age | 15 to 17 | 84% | 16% |
| Ethnicity | Asian | 82% | 18% |
| Ethnicity | Black | 74% | 26% |
| Ethnicity | Mixed | 81% | 19% |
| Ethnicity | Other | 74% | 26% |
| Ethnicity | White | 87% | 13% |
| Sex | Girls | 94% | 6% |
| Sex | Boys | 83% | 17% |
Figure 4.4 shows that the proportion of proven offences with a gravity score in the higher band of five to eight, was greater for:
-
those aged 15 to 17 (16% compared to 12% of offences committed by 10 to 14 year olds),
-
Black children and Other children (both 26%, with the other ethnic groups ranging from 13% to 19%), and
-
boys (17%, compared to 6% for girls).
4.3 Knife or offensive weapon offences committed by children
Figure 4.5: Knife or offensive weapon offences committed by children, resulting in a caution or sentence, England and Wales, years ending March 2012 to 2022
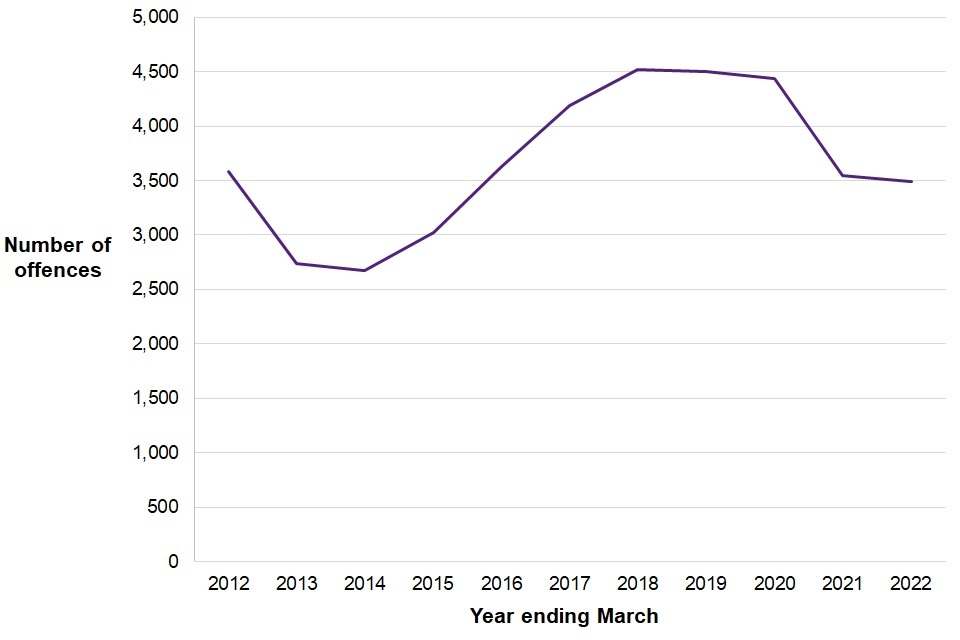
Figure 4.5 shows fluctuations in the number of knife or offensive weapon offences committed by children, with numbers decreasing in the last five years and now broadly similar to numbers seen ten years ago.
This section covers offences for which children received cautions or sentences for possession of an article with a blade or point, possession of an offensive weapon, or threatening with either type of weapon. In the year ending March 2022, there were just under 3,500 knife or offensive weapon offences committed by children resulting in a caution or sentence, which is 2% lower than the previous year and 3% lower than ten years ago. This is the fourth consecutive year on year decrease.
In the latest year, the majority (97%) of knife or offensive weapon offences committed by children were possession offences and the remaining 3% were threatening with a knife or offensive weapon offences. These proportions have remained broadly stable over the last nine years[footnote 15] (Supplementary Table 4.7a and 4.7b).
Supplementary Table 4.7 shows that in the year ending March 2022, just over half (51%) of disposals given to children for a knife or offensive weapon offence were a community sentence. This proportion is broadly stable over the last ten years.
The proportion of children sentenced to immediate custody for knife and offensive weapon offences decreased from 8% to 6% in the last year, which is the lowest proportion seen across the last ten years.
5. Sentencing of children
In the year ending March 2022:
-
There were just under 11,400 occasions where children were sentenced at court, which is 7% lower than the previous year. This continues the decreases seen in each of the last ten years.
-
The average time from offence to completion was 217 days, the second highest in the time series and just four days lower than the previous year and well above pre-pandemic levels. This is also reflected across the adult system.
-
Of all sentencing occasions for indictable offences, the proportion[footnote 16] of sentencing occasions involving Black children for indictable offences decreased from 21% in the year ending March 2017 to 20% in the latest year.
-
The average custodial sentence length for all offences has increased by six months compared with the previous year to 22.8 months. This increase may have been due to a small number of cases which impacted on the overall average.
This chapter focuses on trends of children proceeded against at court, time taken from offence to completion at court and sentences received at court by children by type of sentence and court.
5.1 Children proceeded against
Figure 5.1: Children proceeded against at court, England and Wales, years ending March 2012 to 2022
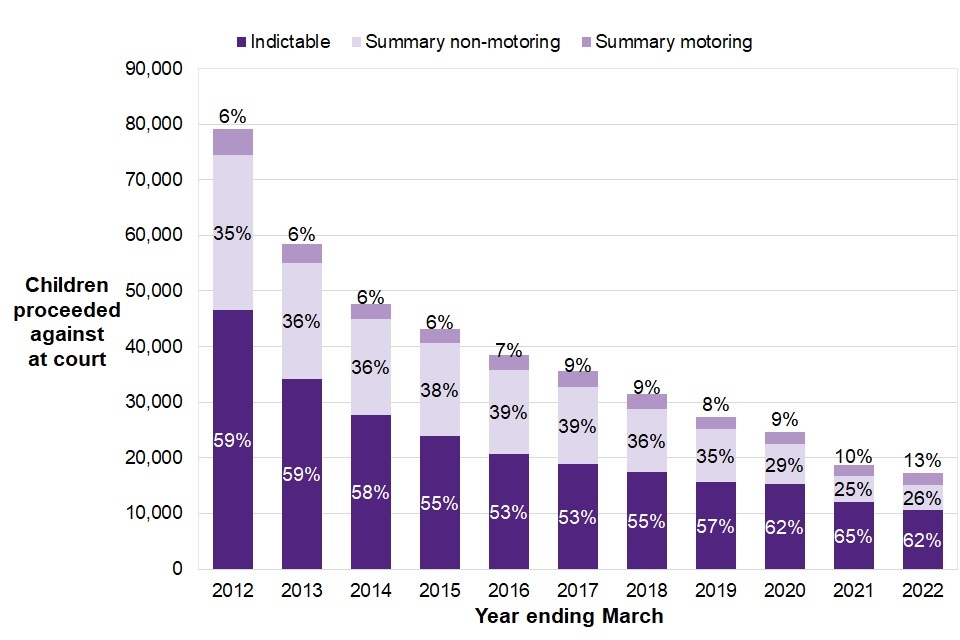
Figure 5.1 shows a downward trend in the number of children appearing in court over the last ten years, and the proportions of indictable, summary non-motoring, and summary motoring offences in each year.
There were around 17,200 children proceeded against at court in the year ending March 2022, a fall of 8% in the latest year and a fall of 78% compared to ten years ago. Almost two thirds (62%) of these proceedings were for indictable offences , 26% were for summary non-motoring offences and the remaining 13% were for summary motoring offences (Supplementary Table 5.1).
5.2 Average time from offence to completion at court
Figure 5.2: Average time from offence to completion at court, England and Wales, years ending March 2012 to 2022
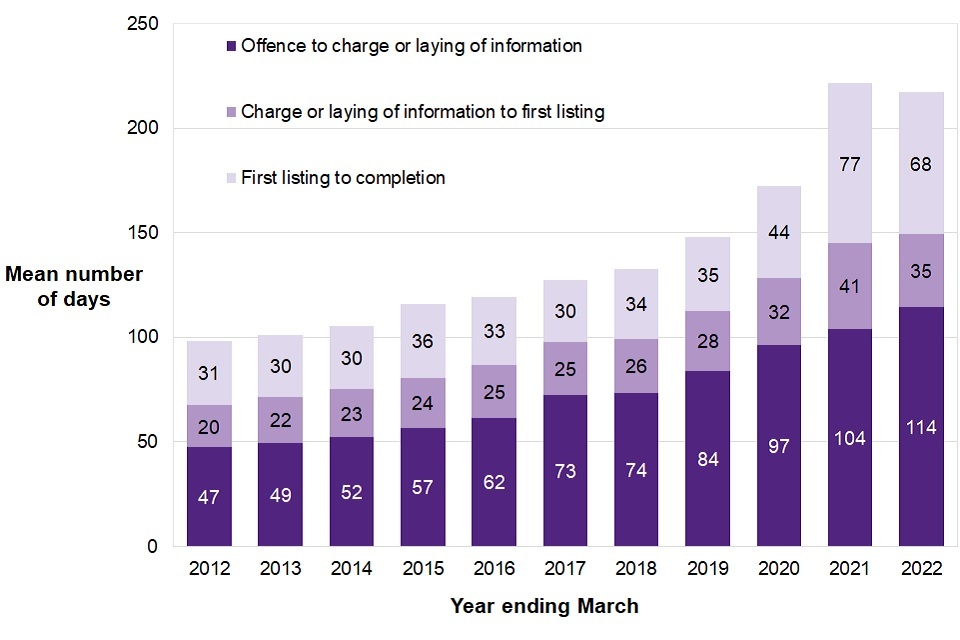
Figure 5.2 shows the mean number of days from offence to completion has increased over the last ten years, from 98 days in 2012 to 217 in 2022, though the latest year sees a decrease of 4 days from the previous year.
Figure 5.2 shows the average (mean) number of days taken from the day of the offence or alleged offence to the day the case was concluded at court with the child being found guilty or acquitted.
In the year ending March 2022, the average time from offence to completion was 217 days, compared with 221 days in the previous year and 98 days in the year ending March 2012.
While the average time for offence to completion saw a decrease for the first time in the last ten years, it was 121% higher than in the year ending March 2012, the second highest figure in the time series, and well above pre-pandemic levels. This is also reflected across the adult system, as evidenced in the Criminal Court Statistics.
Figure 5.2 shows that the average days for:
-
offence to charge or laying of information increased by ten days (10%) to 114 days;
-
charge or laying of information to first listing decreased by six days (15%) to 35 days; and
-
first listing to completion decreased by nine days (11%) to 68 days.
The average time from first listing to completion was between 31 days and 44 days in the years ending March 2011 to 2020 and rose to 77 days in the year ending March 2021 before falling to 68 days in the latest year, which is well above pre-pandemic levels.
5.3 Sentencing of children in all courts
Figure 5.3: Number of sentencing occasions of children in all courts by sentence type, England and Wales, years ending March 2012 to 2022
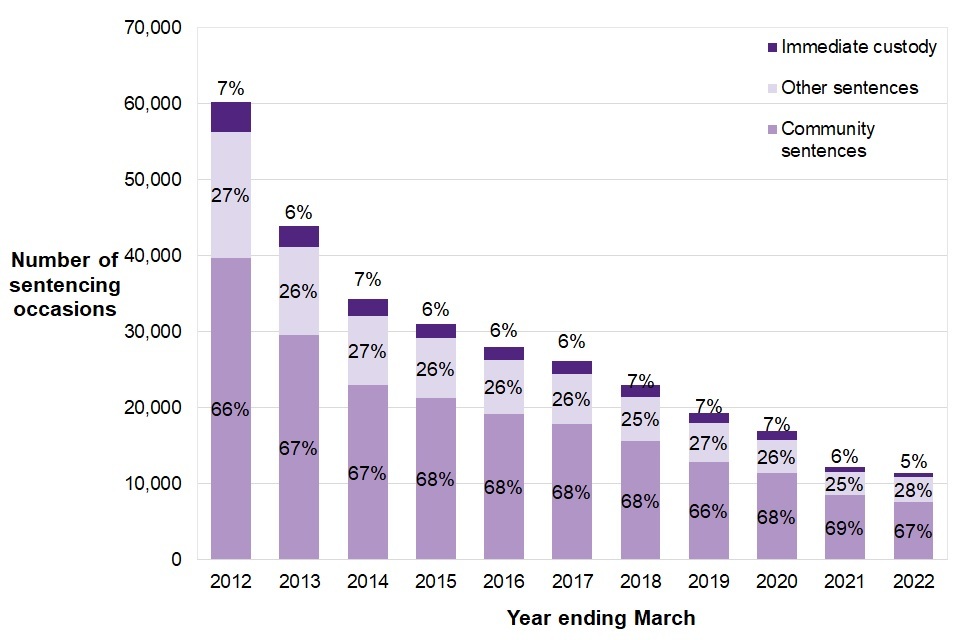
Figure 5.3 shows the number of sentencing occasions of children in the last ten years, and proportion of custodial, community, and other sentences. The number of sentences has decreased while the proportions have remained stable.
There were just under 11,400 occasions where children were sentenced in all courts in the latest year, which is 7% lower than the previous year and 81% lower than the year ending March 2012. There have been year-on-year falls in the number of sentencing occasions of children over the last ten years.
The number of custodial sentences has decreased in each of the last ten years. There were around 550 custodial sentences given in the year ending March 2022, compared with around 670 in the previous year (a decrease of 18%) and compared with around 4,000 ten years ago (a decrease of 86%).
As Figure 5.3 shows, the proportion of custodial sentences has remained broadly stable, varying between 6% and 7% of total sentences over this period between the years ending March 2012 to March 2021 and falling to 5% of total sentences in the latest year.
Supplementary Table 5.4 shows that in the year ending March 2022, of the 11,400 sentencing occasions of children for all types of offences in all courts there were:
-
around 550 sentences to immediate custody (5% of all sentences);
-
around 7,700 community sentences (67% of all sentences); and
-
just under 3,200 other types of sentences (28% of all sentences). These include absolute and conditional discharges, fines and other less common disposals.
5.4 Sentencing of children by court type
Figure 5.4: Number and proportion of sentencing occasions of children by court type[footnote 17], England and Wales, years ending March 2012 to 2022
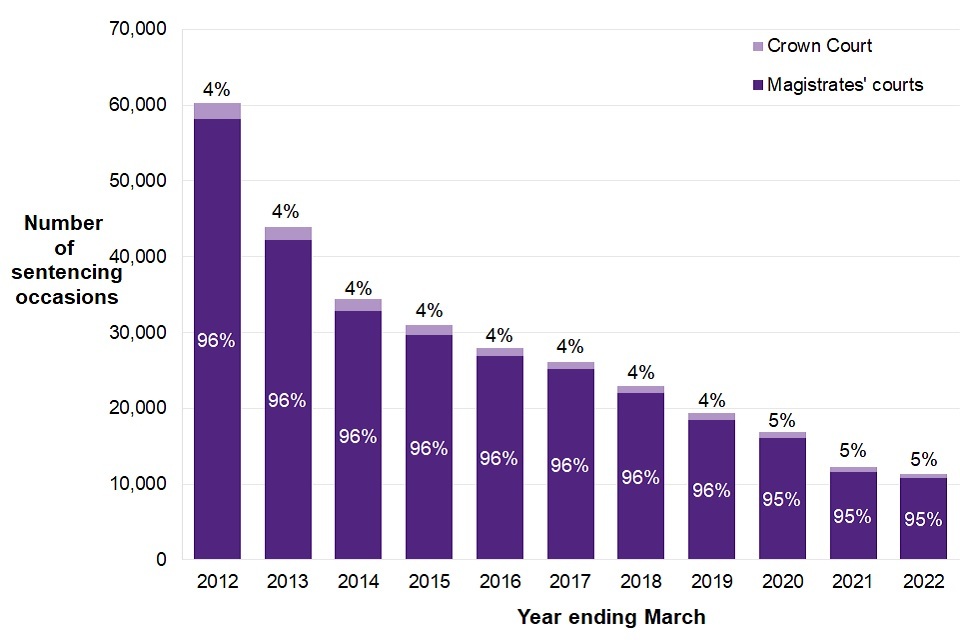
Figure 5.4 shows the number of sentencing occasions of children decreasing over the last ten years, and that the majority (95% in the latest year) are sentenced at Magistrates as opposed to Crown court.
Depending on the seriousness of the offence, cases will either be heard in a magistrates’ court from start to finish or will be referred from a magistrates’ court to the Crown Court. The Crown Court only hears cases involving more serious offences, so a much smaller number of children are sentenced in this type of court compared with magistrates’ courts.
In the latest year, just 5% (around 520) of all sentencing occasions of children were at the Crown Court. This proportion has remained stable over the last ten years, varying between 4% and 5% (Figure 5.4).
The fact that the Crown Court tries the most serious cases is reflected in the types of sentences given. In the year ending March 2022, custodial sentences were given in 46% (around 240) of the 520 sentencing occasions of children at the Crown Court. This compares to just 3% (around 310) of the 10,900 sentencing occasions at magistrates’ courts.
5.5 Sentencing of children at all courts by type of offence
Figure 5.5: Number of sentencing occasions of children sentenced in all courts by type of offence, England and Wales, years ending March 2012 to 2022
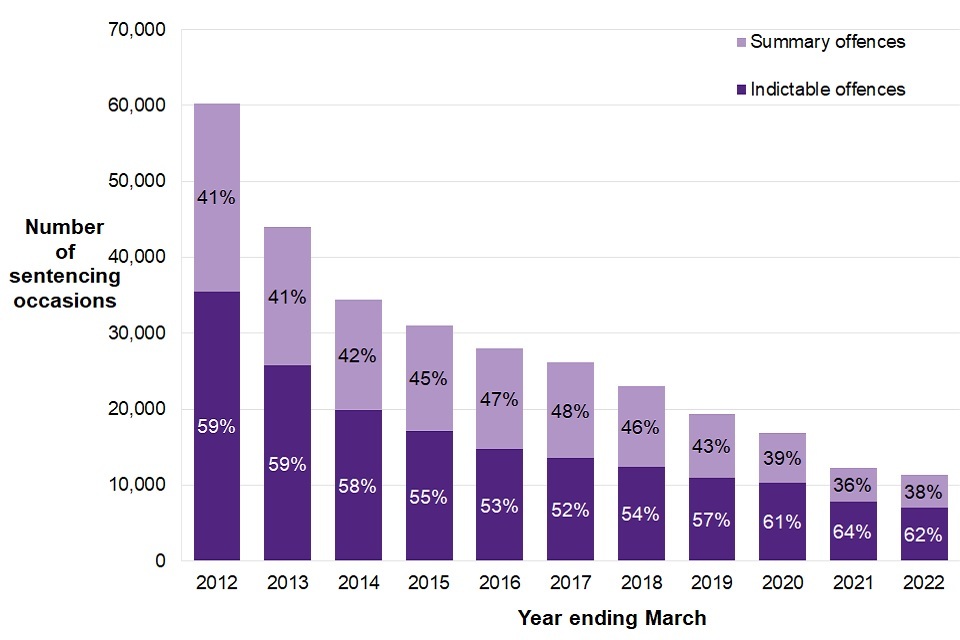
Figure 5.5 shows the number of sentencing occasions of children decreasing over the last ten years, with 62% of children being sentenced for indictable offences and 38% for summary offences in the year ending March 2022.
Of the 11,400 occasions in which children were sentenced in the year ending March 2022, 62% were for indictable[footnote 18] offences and 38% were for summary offences. The proportion of sentencing occasions of children for indictable offences fell compared to the previous year, following four consecutive years of proportional increases.
Of the almost 7,100 occasions on which children were sentenced for indictable offences in the latest year, 78% involved a community sentence, whereas of the 4,300 occasions in which children were sentenced for summary offences, 49% involved a community sentence.
In the year ending March 2022, 7% of the occasions in which children were sentenced for indictable offences involved a sentence to immediate custody, compared with 1% for summary offences (Supplementary Tables 5.4a and 5.4b).
5.6 Sentencing of children for indictable offences by ethnicity[footnote 19][footnote 20]
Figure 5.6: Number of sentencing occasions of children sentenced for indictable offences by ethnicity, England and Wales, years ending March 2017 to 2022
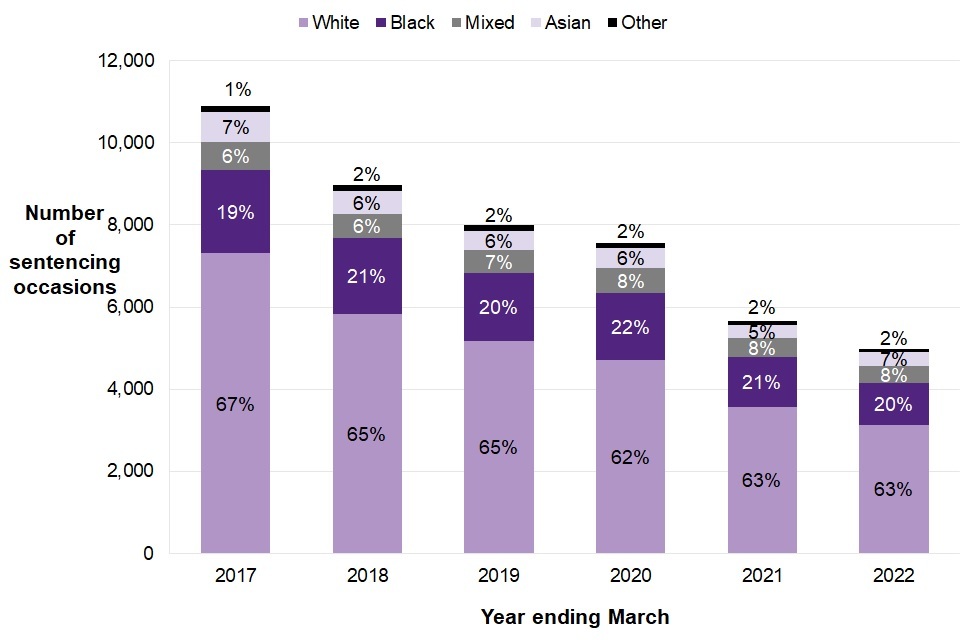
Figure 5.6 shows the overall number of sentencing occasions of children for indictable offences decreasing over the last ten years, with decreases in the last five years for all ethnic groups.
In the year ending March 2022, the number of occasions on which children were sentenced at court for indictable offences varied by ethnicity[footnote 21]. In the latest year there were:
-
around 3,100 sentencing occasions for White children;
-
just over 1,000 sentencing occasions for Black children;
-
410 sentencing occasions for Mixed children;
-
just under 330 sentencing occasions for Asian children; and
-
around 90 sentencing occasion for Other children.
Over the last five years, there have been decreases in the number of occasions in which children of each ethnicity group have been sentenced at court for indictable offences. The decrease in sentencing occasions for White children has been at a higher rate than for those in other ethnic groups.
There were decreases compared with the previous year in the number of occasions on which children were sentenced at court for indictable offences across four of the five ethnicity groups. The biggest decrease of 16% was for Black children, while Mixed, Other and White children each decreased by 12%. There was an increase of 9% for Asian children.
5.7 Average custodial sentence length[footnote 22]
Figure 5.7: Average custodial sentence length in months by type of offence, England and Wales, years ending March 2012 to 2022
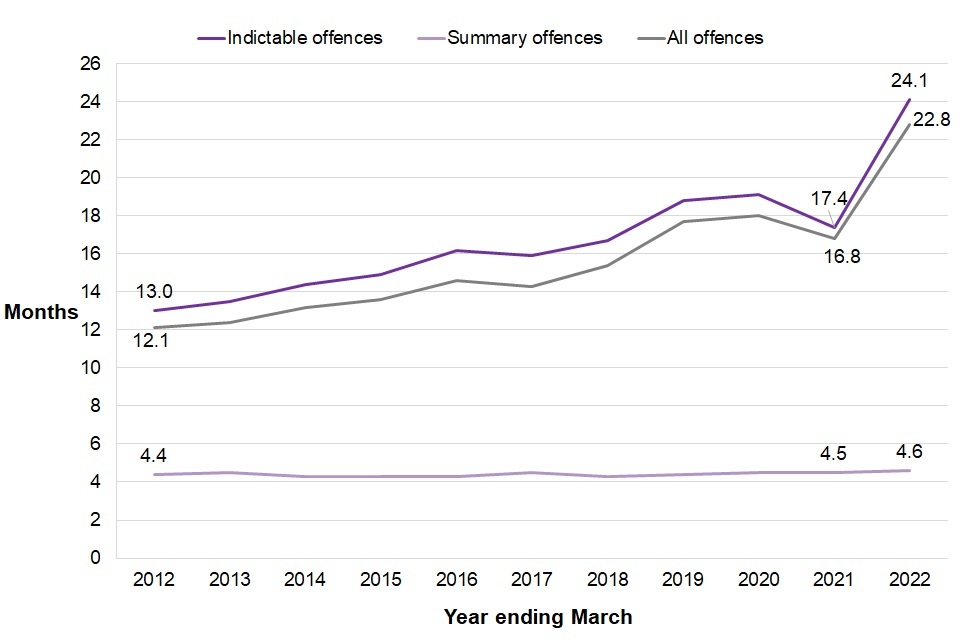
Figure 5.7 shows that in the year ending March 2022, the average custodial sentence length was 22.8 months for all offences (compared to 12.1 in 2012), 24.1 months for indictable offences (13.0 in 2012) and 4.6 months for summary offences (4.4 in 2012).
For children sentenced to custody, the average custodial sentence length varied based on the type of offence the child was sentenced for. In the latest year, the average custodial sentence length was:
-
22.8 months for all offences;
-
24.1 months for indictable offences; and
-
4.6 months for summary offences.
The average custodial sentence length for all offences has increased by six months compared with the previous year to 22.8 months. This increase may have been due to a small number of cases which impacted on the overall average.
The average custodial sentence length for indictable offences increased by almost seven months compared to the previous year, the biggest year on year change in the time series. Between the years ending March 2012 and March 2021, the average custodial sentence length for indictable offences increased by over four months.
For summary offences, the average custodial sentence length has remained broadly stable over the last ten years ranging from 4.3 months to 4.6 months.
6. Use of remand for children
In the year ending March 2022:
-
Almost three quarters (73%) of children remanded to youth detention accommodation did not subsequently receive a custodial sentence, which is the joint highest in the time series along with the previous year.
-
The average number of children held on remand accounted for 45% of all children in youth custody, the largest proportion in the last ten years and five percentage points higher than the previous year.
-
There were around 10,500 remand episodes of which the majority (79%) were bail remands, with youth detention accommodation remands accounting for 11%, and the remaining 9% being community remands with intervention.
This chapter presents data on trends of use of remand for children aged 10 to 17, characteristics of the custodial remand population and the outcomes for children following custodial remand. There has been a change to the counting rules for the types of remand given to children. Please see the Guide to Youth Justice Statistics for further details.
6.1 Types of remand given to children
Figure 6.1: Type of remand given to children, England and Wales, years ending March 2018 to 2022
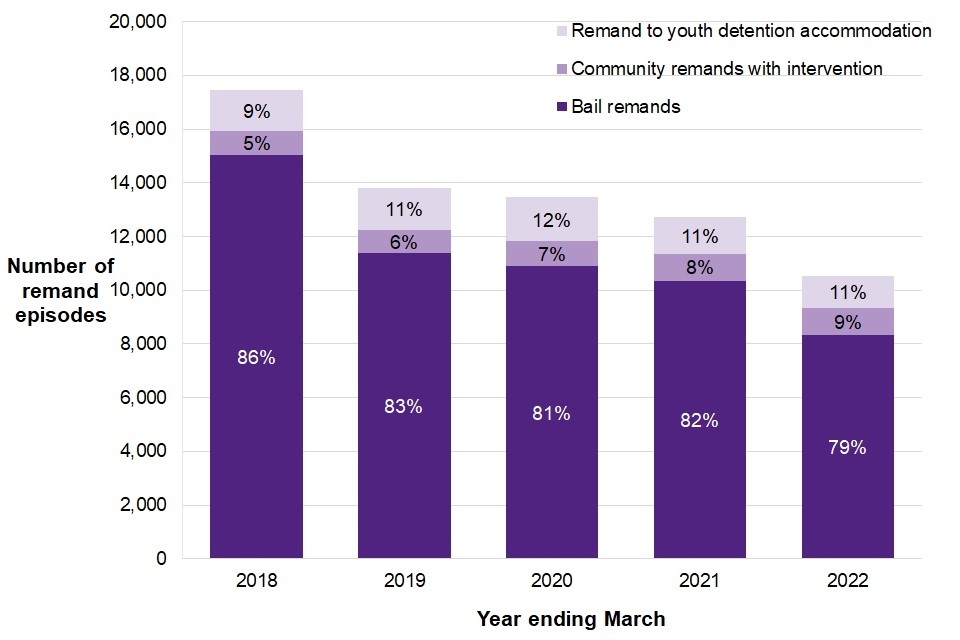
Figure 6.1 shows that in the year ending March 2022 79% of children were given bail remands, 11% remands to youth detention accommodation, and 9% community remands.
This data shows the number of remand decisions made for outcomes occurring in each year. There has been a change of counting rules this year, whereby only the most restrictive remand decision applied to the most serious unique outcome on a given day during the court proceeding is counted.
There were around 10,500 remands given to children in the year ending March 2022, of which:
-
the majority (79%) were bail remands;
-
11% were remands to youth detention accommodation; and
-
the remaining 9% were community remands with intervention.
There was a 17% fall in the number of remand episodes compared to the previous year. This was driven by decreases in Bail Remands which decreased by 20% and Remands to Youth Detention Accommodation which decreased by 11%. Community Remands with Intervention saw no change compared with the previous year.
For remands given in the year ending March 2022, the breakdown of demographics (Supplementary Table 6.1) shows:
-
most episodes (90%) involved boys;
-
the majority (87%) involved children aged 15 to 17; and
-
most episodes were given to White children (61%), while Black children and Mixed children were the next highest (18% and 12% respectively)[footnote 23].
6.2 Average monthly population of children on remand in youth custody
Figure 6.2: Average monthly population of children on remand in youth custody, youth secure estate in England and Wales, years ending March 2012 to 2022
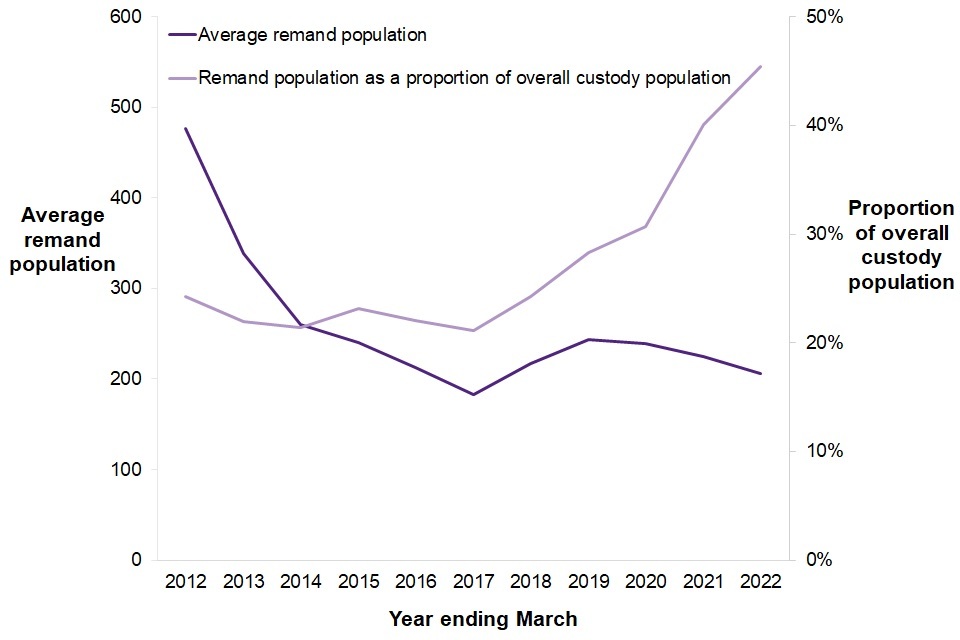
Figure 6.2 shows that the average child remand population has fallen over the last ten years, but in that time the proportion these children form of the overall custody proportion has increased, from 24% to 45%.
There was an average monthly population of around 210 children remanded in youth custody at any one time in the year ending March 2022, which was 8% lower than the previous year and 57% lower than ten years ago.
Children remanded in youth custody accounted for 45% of the average youth custody population in the latest year, an increase from 40% in the previous year. This is the highest proportion seen in the last ten years and likely due in part to an increase in the amount of time children are spending in custody on remand with a median number of 68 days compared with 59 days in the previous year and 43 days in the year ending March 2020 (see table 7.27 in the ‘Ch7 – Children in youth custody’ supplementary tables).
While there was a year on year decrease in the remand population, the sentenced population decreased at a greater rate. Prior to the year ending March 2021, the proportion of the total custody population that children remanded to youth custody comprised had fluctuated between 21% and 31%.
Supplementary Tables 6.3 and 6.4 show that for children remanded in youth custody, the majority were:
-
in a Young Offender Institution (70%);
-
boys (97%), a proportion which has remained broadly stable over the last ten years);
-
from an ethnic minority group (58%); and
-
aged 17 (50%), a decrease from 60% in the previous year.
See Chapter 7 for information on the length of time children spent in youth custody on remand.
Figure 6.3: Proportion of children in youth custody on remand by ethnicity[footnote 24], youth secure estate in England and Wales, years ending March 2012 to 2022
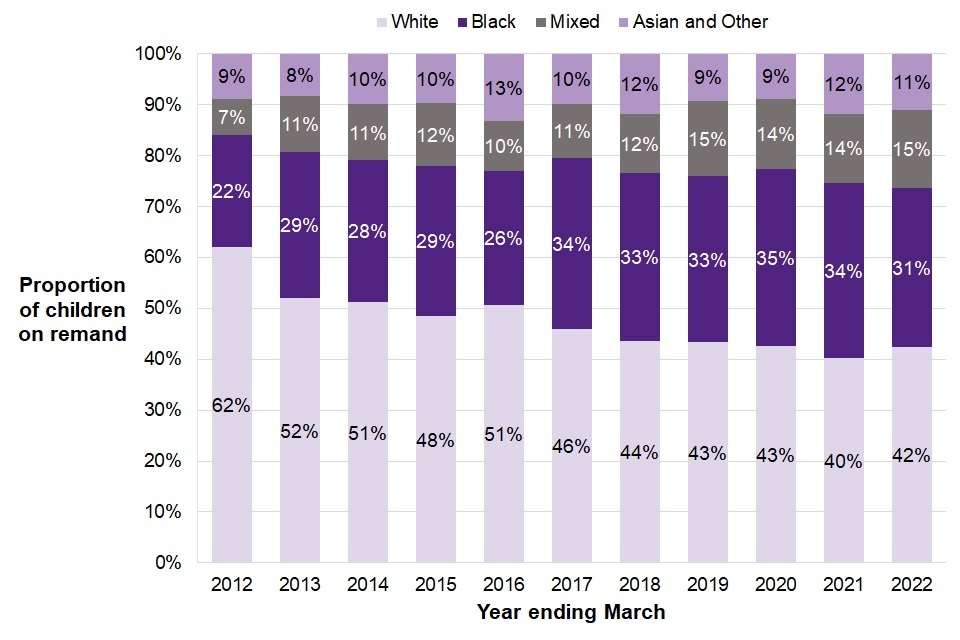
Figure 6.3 shows that the proportion of children from ethnic minority groups comprised of the overall remand population decreased slightly from 60% to 58% in the last year, but is 20 percentage points higher than ten years ago.
Supplementary Table 6.3 shows that in the latest year, the average number of children in custody on remand has decreased for each ethnic group, with the largest decrease being for Black children, falling by 18%.
Figure 6.3, shows that the proportion that ethnic minority groups comprised decreased slightly from 60% to 58% in the last year, though this was 20 percentage points higher than ten years ago.
Figure 6.3 also shows that:
-
over the last ten years the proportion of children from a White background remanded in youth custody has seen a general downward trend, falling from 62% to 42%;
-
children from a Mixed ethnic background accounted for 15% of those remanded in youth custody in the latest year, which is a slight increase on the previous year and more than double compared to ten years ago (7%); and
-
the proportion of children from an Asian or Other background fell to 11%, from 12% in the previous year. This proportion has fluctuated between 8% and 13% over the last ten years.
6.3 Outcomes for children following custodial remand
Figure 6.4: Outcomes following remand to youth detention accommodation, England and Wales, years ending March 2016 to 2022
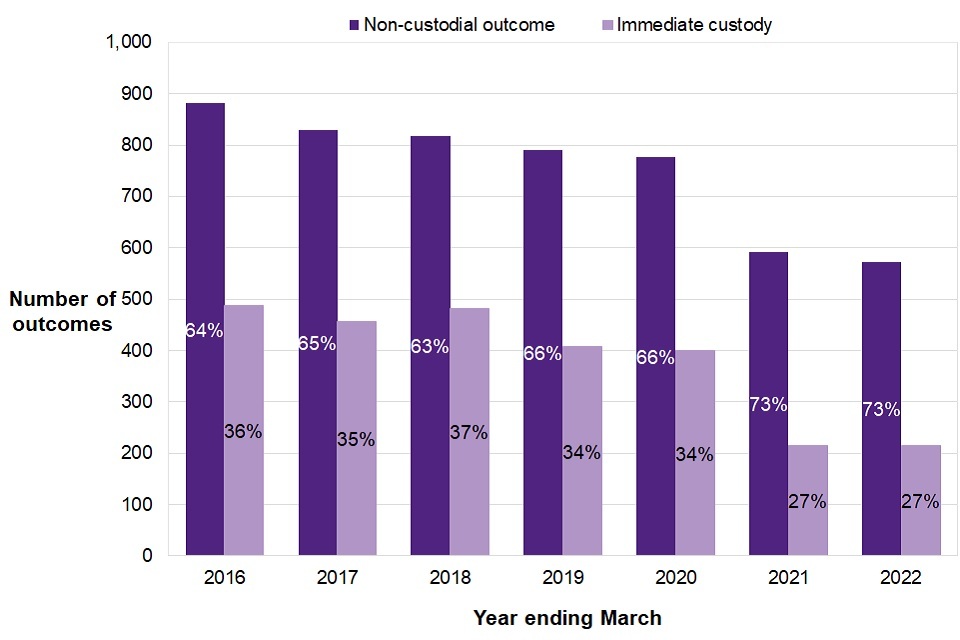
Figure 6.4 shows that in the year ending March 2022, 73% of children faced non-custodial outcomes following remand, compared to 64% six years earlier.
In the year ending March 2022, the number of outcomes following custodial remand was 2% lower than the previous year and almost three quarters (73%) of outcomes for children remanded to custody at some point during court proceedings did not subsequently result in a custodial sentence. This was the same proportion as last year, which had up until then remained broadly stable, fluctuating between 63% and 66% and was an increase of seven percentage points from the year ending March 2020.
In the latest year, there were just under 800 outcomes following a custodial remand and 35% of these outcomes resulted in acquittal, dismissal or not proceeded against.
Of the 73% (almost 600) outcomes which did not result in a custodial sentence following a custodial remand, 52% (around 300 outcomes) resulted in a non-custodial sentence and 48% (around 280) resulted in acquittal, case dismissed, not proceeded against or not tried[footnote 25]. The proportion receiving a non-custodial sentence was one percentage point higher than the previous year, while the proportion who were acquitted, had their case dismissed, were not proceeded against or were not tried was two percentage points lower than the previous year.
The proportion of outcomes for those who were remanded to custody at any point during court proceedings which did not result in a custodial sentence varies by court type. In the latest year, 90% of those sentenced at magistrates’ courts and 52% of those sentenced at the Crown Court did not go on to receive a custodial sentence (Supplementary Table 6.6).
This proportion also varies by ethnicity (Supplementary Table 6.7). The proportion of outcomes for those remanded to custody who did not go on to get a custodial sentence varies from 50% for Other children, 66% for White children, 79% for Mixed children and 72% for both Asian and Black children.
7. Children in youth custody
In the year ending March 2022:
-
There was an average of around 450 children in custody at any one time during the year, a fall of 19% against the previous year and the lowest number on record.
-
The proportion of children held in custody on remand increased from 40% to 45% compared to the previous year, the largest proportion since the time series began.
-
The number of Black children in custody decreased by 23% compared to the previous year, the first instance in the time series where this group had a larger year on year decrease than White children. Black children accounted for 28% of the total youth custody population while White children accounted for 48%.
-
The number of custodial episodes ending fell by 10% compared with the previous year, which reflects the fall in the custodial population.
-
Children spent an average of nine nights longer on remand than the previous year. The proportion of remands that lasted three months or more increased from 38% to 43% compared to the previous year.
This chapter presents data on trends of children (aged 10 to 17) in youth custody in England and Wales by demographic characteristics, offence types, legal basis for detention, distance from home and length of time in custody.
7.1 Average monthly youth custody population
Figure 7.1: Average monthly youth custody population, youth secure estate in England and Wales, years ending March 2001 to 2022
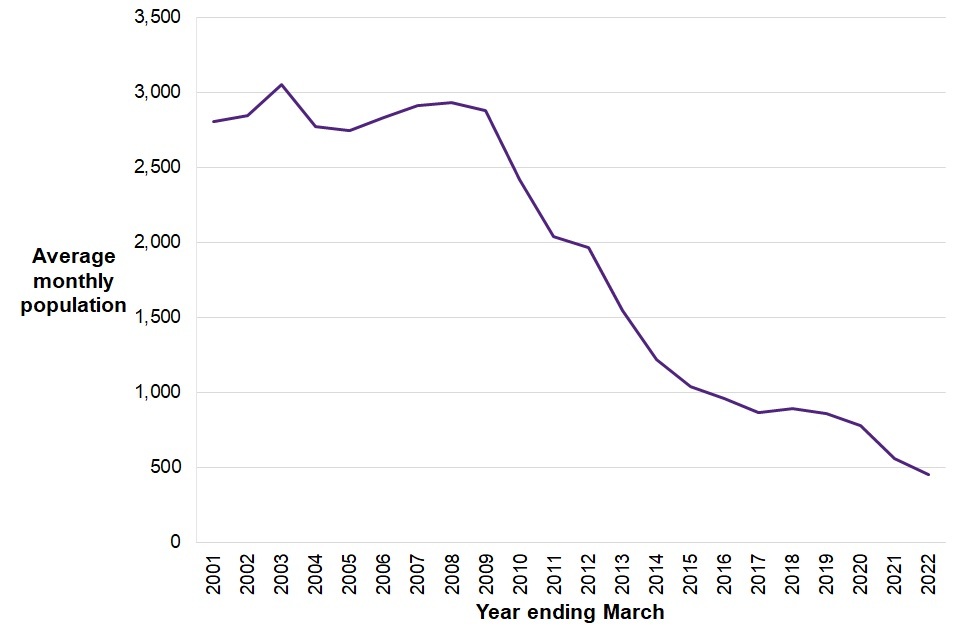
Figure 7.1 shows a predominantly downward trend in the average monthly youth custody population in the youth secure estate, which has decreased year on year since 2008.
In the year ending March 2022, there was an average of around 450 children in custody at any one time which was the lowest number on record. The average youth custody population has fallen in each of the last four years and in the year ending March 2022, it decreased by 19% (106 children) compared to the previous year and by 77% (1,509 children) compared to the year ending March 2012.
7.2 Average monthly youth custody population by sector
Figure 7.2: Average monthly youth custody population by sector, youth secure estate in England and Wales, years ending March 2012 to 2022
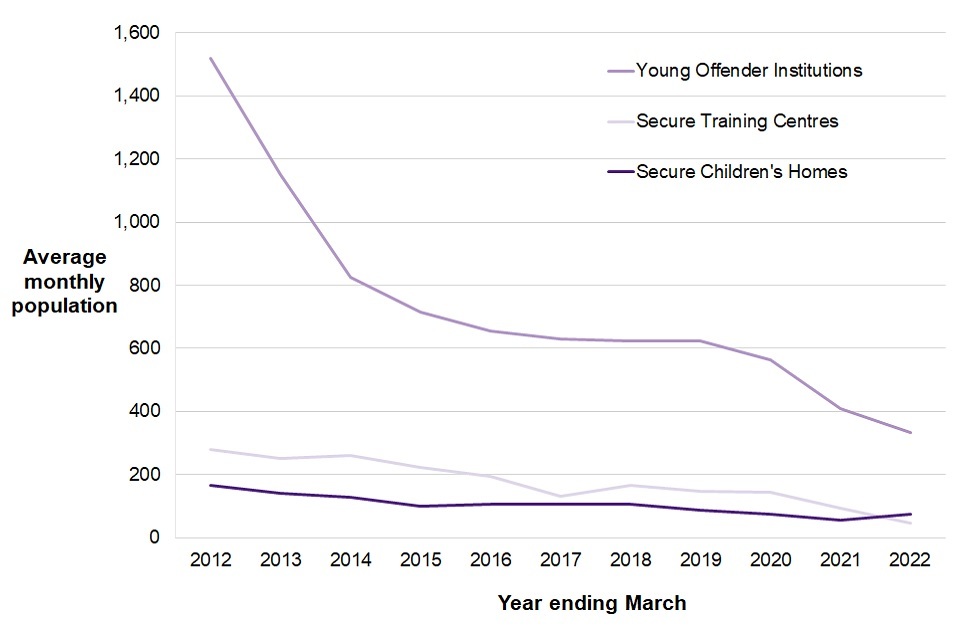
Figure 7.2 shows a downward trend over the last ten years in the average monthly youth custody population for all sectors of the youth secure estate, except secure children’s homes which increased in the last year.
As in previous years, in the year ending March 2022 the majority of children in custody were in a Young Offender Institutions (YOIs) (74%). The largest long-term fall in the average monthly youth custody population has been seen in the number of children in YOIs, falling 78% over the last ten years, with an 18% fall in the last year.
In the latest year, children held in Secure Children’s Homes (SCHs) accounted for 16% of the average youth secure estate population, up from 10% in the previous year and the highest proportion in the time series. The average monthly population of SCHs decreased by 56% over the last ten years, with a 28% increase compared with the previous year.
Of all children in custody, 10% were held in Secure Training Centres (STCs) in the latest year, a decrease from 17% in the previous year and the lowest in the time series. The average monthly population of STCs decreased by 83% over the last ten years, with a 51% decrease compared with the previous year. This decrease is due to the closure of Rainsbrook STC in July 2021.
7.3 Legal basis for detention of children in custody
Information on the legal basis for detention relates to the most serious legal basis for which a child is placed in custody.
Figure 7.3: Average monthly youth custody population by legal basis for detention as a proportion of the total, youth secure estate in England and Wales, years ending March 2012 to 2022
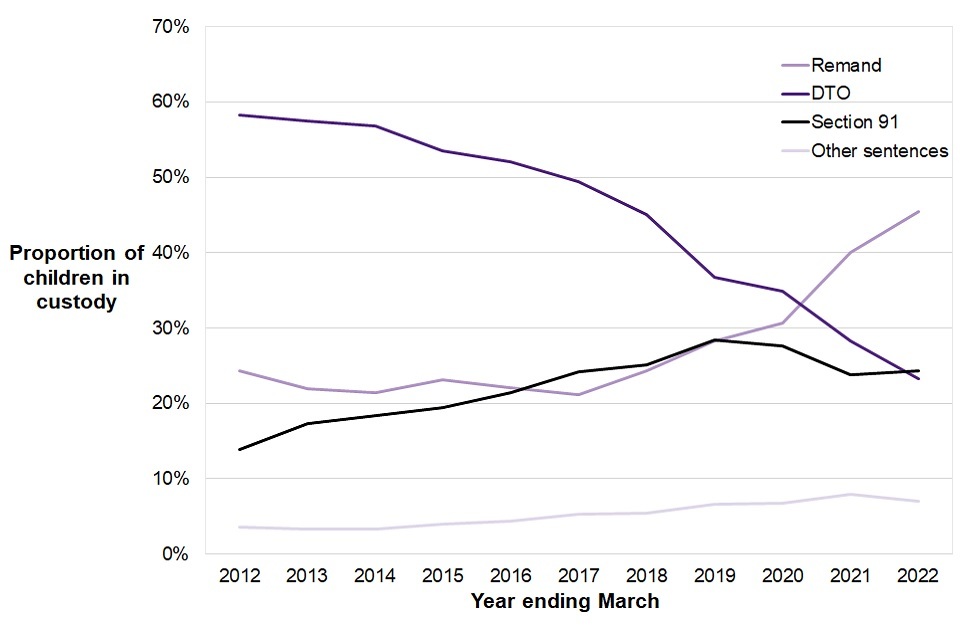
Figure 7.3 shows that the proportions of legal basis types for detention for children have been changing over time, with those on remand now forming the highest proportion (45%) compared to ten years ago when it was Detention and Training Orders (58%).
Figure 7.3 and supplementary Table 7.5 show that while the number of children in custody has decreased for all legal basis types over the last ten years, the proportions of these legal basis types have been changing:
-
The proportion of children on remand was 45% in the latest year, five percentage points higher than the previous year, and higher than Detention and Training Orders for the second consecutive year. Children on remand represent the largest proportion, by legal basis, of children in custody.
-
Children serving a Detention and Training Order (DTO) have historically made up the largest proportion but have seen decreases in each of the last two years. In the latest year, the proportion decreased from 28% in the year ending March 2021 to 23%.
-
The proportion of those serving a Section 250 (formerly Section 91) sentence steadily increased from 14% in the year ending March 2012 to 28% in the year ending March 2019 before falling to 24% in the year ending March 2021, which stayed the same in the year ending March 2022.
-
The proportion of children on Other sentences continues to make up the smallest share, at 7% in the latest year. This proportion has varied between 3% and 8% over the last ten years.
7.4 Offences resulting in children going into custody
There was a decrease in the number of children in custody across all offence groups[footnote 26] compared to the previous year, with the biggest decreases seen in robbery and domestic burglary. Robbery saw a decrease of 43%, and domestic burglary saw a decrease of 40%.
Figure 7.4: Proportion of children in custody by offence group, youth secure estate in England and Wales, years ending March 2012 to 2022
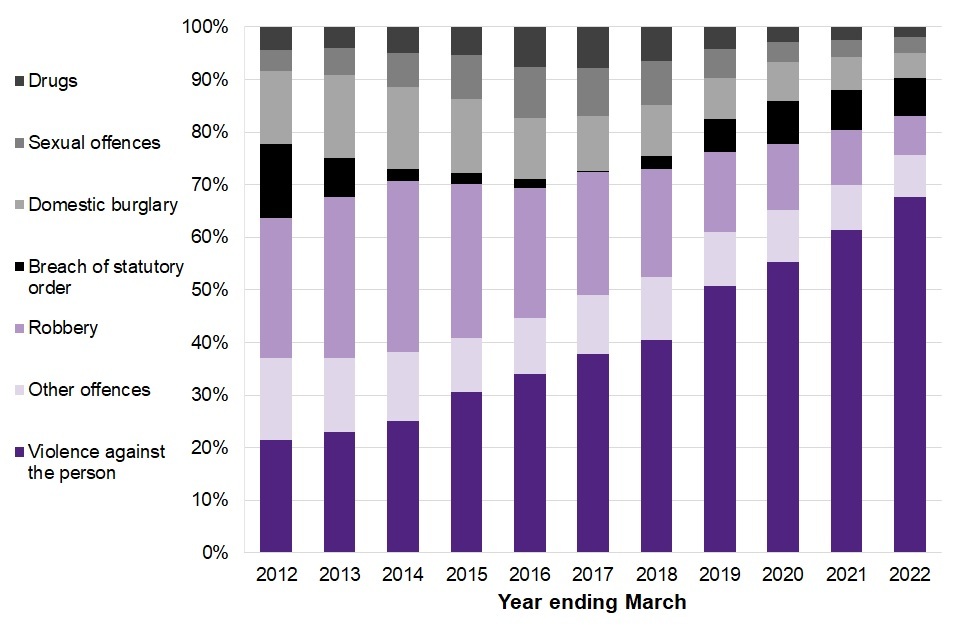
Figure 7.4 shows that the proportion of children in youth custody for violence against the person offences has increased in each of the last ten years and accounts for 68% of the youth custody population in the latest year.
Figure 7.4 shows that the proportion of children in youth custody for violence against the person offences has increased in each of the last ten years and accounted for over two thirds (68%) of the youth custody population in the latest year. In the same time period, the proportion of children in custody for robbery has fallen by 20 percentage points, from 27% to 7%.
7.5 Demographics of children in custody
Figure 7.5: Demographics of the average youth custody population compared to the general 10 to 17 population, England and Wales, year ending March 2022
| Aged 10 to 14 | Aged 15 to 17 | Boys | Girls | |
| Youth custody population | 4% | 96% | 97% | 3% |
| 10-17 population | 64% | 36% | 51% | 49% |
In the latest year, the majority of children in the youth secure estate were boys (97%), which is the same as the previous year although a slight increase compared with the year ending March 2012 (94%).
Those aged 17 have made up over half of the youth custody population in each of the last ten years and accounted for 56% in the latest year (Supplementary Table 7.10).
Figure 7.6: Proportion of children in custody by ethnicity, youth secure estate in England and Wales, years ending March 2012 to 2022 [footnote 27]
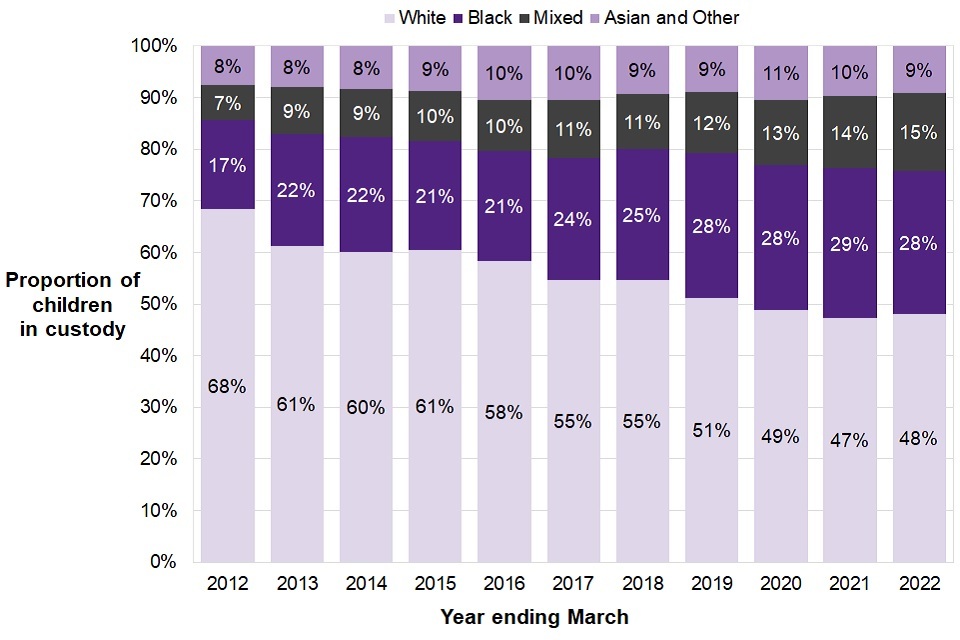
Figure 7.6 shows that in the last 10 years the proportion white children form of the overall youth custody population has decreased by 20% percentage points, whilst the proportion of black children has increased by 11% percentage points.
While all ethnic groups have seen a decrease in the average custody population over the last ten years as the whole population has decreased, they have been falling at different rates which has led to a change in the proportion each ethnic group comprises.
Figure 7.6 shows that over the last ten years:
-
the proportion of children in youth custody who are White has been falling, from 68% to 48%, though this group sees an increase of one percentage point in the latest year;
-
the proportion of children from a Black ethnic background has increased the most, and now accounts for 28% of the youth custody population, compared with 17% ten years ago, though there was a decrease of one percentage point compared with the previous year;
-
the proportion of children from a Mixed ethnic background has increased from 6% to 14% over the last ten years; and
-
the proportion of children from a Mixed ethnic background has more than doubled, increasing from 7% to 15% over the last ten years; and
-
the proportion of children from an Asian or Other ethnic background has increased from 8% to 9% over the last ten years.
Supplementary Table 7.11 shows that in the year ending March 2020, White children made up less than half of the youth custody population (49%) for the first time since the data series began, as they continued to do in the last two years (47% in the year ending March 2021 and 48% in the latest year).
In the year ending March 2022, the number of Black children decreased by 23% compared to the previous year, the first instance in the time series with a larger year on year decrease than White children.
Figure 7.7: Proportion of children in custody by ethnicity and legal basis for detention, youth secure estate in England and Wales, average for the year ending March 2022
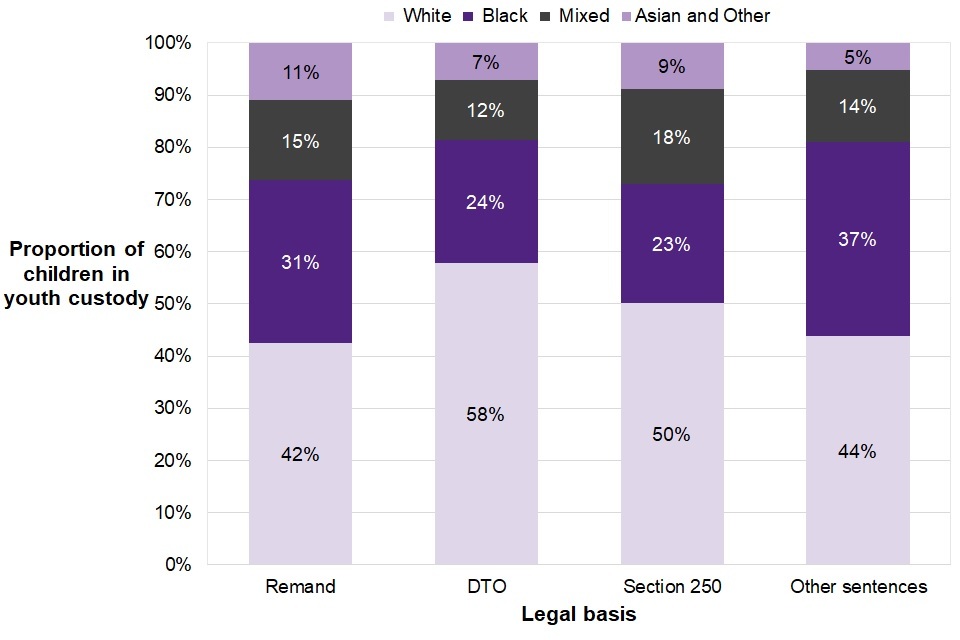
Figure 7.7 shows the variations in ethnicity by legal basis for detention, with white children making up the highest proportion for each legal basis category (Remand, DTO, Section 250, Other).
Supplementary Table 7.14 shows that the proportions each ethnicity make up by legal basis has been changing over the last ten years:
-
the proportion of Black children on Other sentences has seen the greatest increase in the last ten years, from 26% to 37%;
-
the proportion of Black children on DTOs has increased from 13% to 24%;
-
the proportion of Black children on remand has increased from 22% to 31%;
-
the proportion of Mixed children on remand has more than doubled from 7% to 15%;
-
the proportion of Mixed children on DTOs has doubled in the last ten years, from 6% to 12%; and
-
the proportion of Mixed children serving Other sentences has increased from 5% to 14% in the last ten years.
7.6 Distance from home for children and region of home Youth Justice Service (YJS) in custody
Figure 7.8: Number and proportion of children in custody by distance from home, youth secure estate in England and Wales, year ending March 2022 [footnote 28]
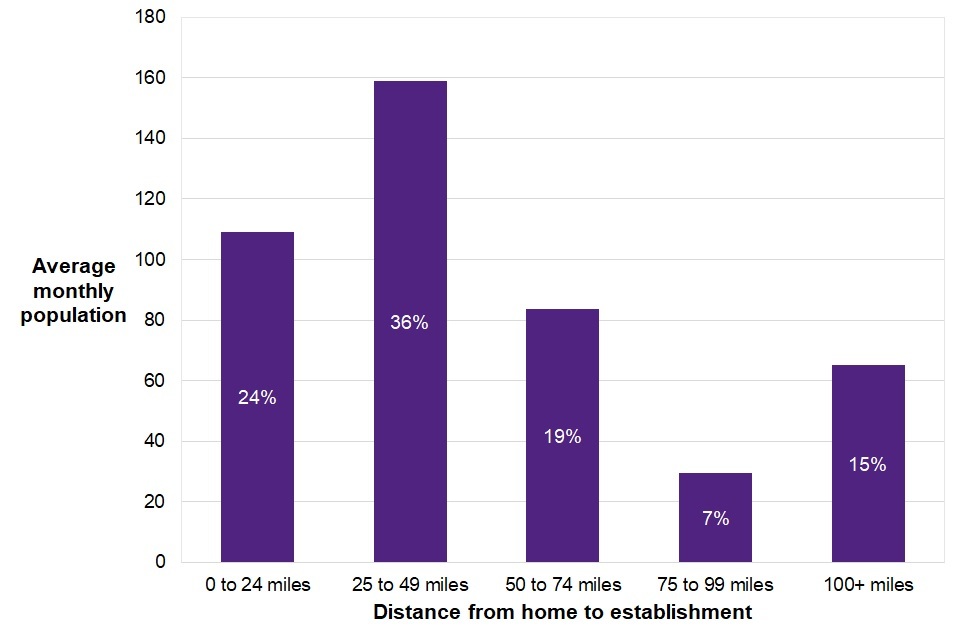
Figure 7.8 shows the proportion of children in custody by distance from home, with 25 to 49 miles being the highest (36%) and 75 to 99 miles being the lowest (7%).
For children in the youth secure estate, the distance between their home address and the secure establishment they are placed in can vary (see Figure 7.8). It is not always possible to place children in an establishment close to their home as placement decisions are determined by a number of factors, including the risks and needs of the individual child and available capacity at establishments.
As Figure 7.8 shows, while 60% of children in custody were in an establishment less than 50 miles from their home address, 15% were placed in an establishment 100 miles or more from their home. These proportions are broadly unchanged compared with the previous year.
Supplementary Table 7.17 shows that in the year ending March 2022, children who were under the supervision of a London YJS made up the largest share of children in youth custody (27%). This has remained broadly stable in the last ten years. Children who were under the supervision of a Welsh YJS or a YJS in the North East region made up the smallest share, both accounting for 2% of the overall youth custody population.
Length of time spent in youth custody
7.7 Legal basis episodes ending by nights spent in the youth secure estate
Figure 7.9: Number and proportion[footnote 29] of legal basis episodes ending by nights spent in the youth secure estate in England and Wales, years ending March 2019 to 2022
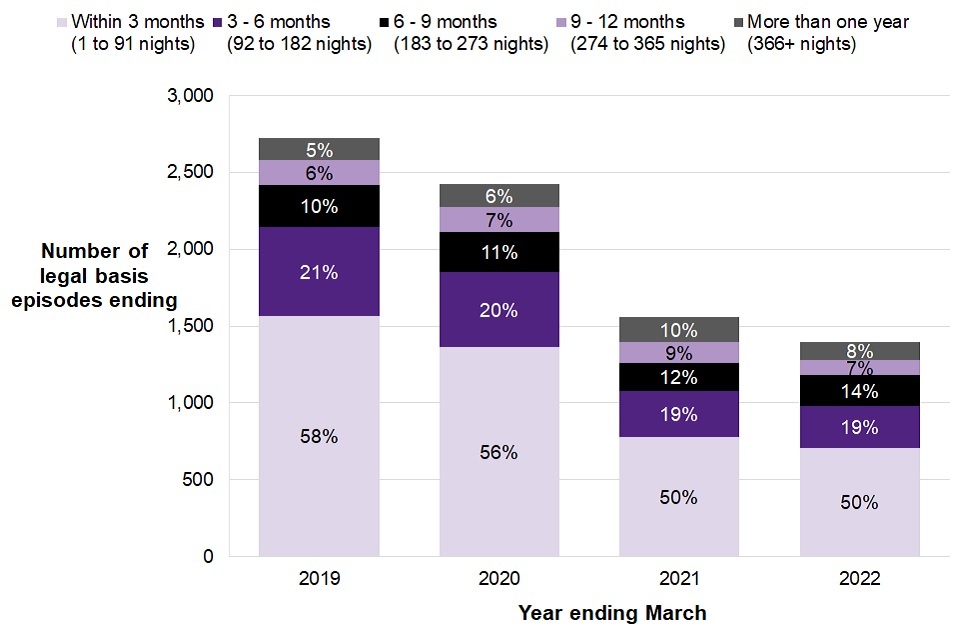
Figure 7.9 shows a downward trend in the number of legal basis episodes in the youth secure estate over the last four years, with 50% of these episodes ending within 3 months in the year ending March 2022, compared to 58% in year ending March 2019.
| 2019 | 2020 | 2021 | 2022 | |||||||||||||||||||||||||
| Median number of nights | 88 | 90 | 91 | 91 |
In the year ending March 2022, just over 1,400 legal basis episodes in the youth secure estate ended. This was a decrease of 10% compared to the previous year. Of the 710 legal basis episodes that ended within three months in the latest year, around 130 (18%) ended within seven nights.
In the latest year, around 8% (around 120) of legal basis episodes lasted more than one year which is a decrease compared to the previous year (10%).
The median number of nights spent in youth custody per legal basis episode was 91 nights in the year ending March 2022. This remains the same as the previous year, but an increase of three nights compared with the year ending March 2019.
7.8 Legal basis episodes ending by nights spent in the youth secure estate and legal basis for detention
Figure 7.10: Number of legal basis episodes ending by nights spent in youth custody and legal basis for detention, youth secure estate in England and Wales, years ending March 2019 to 2022
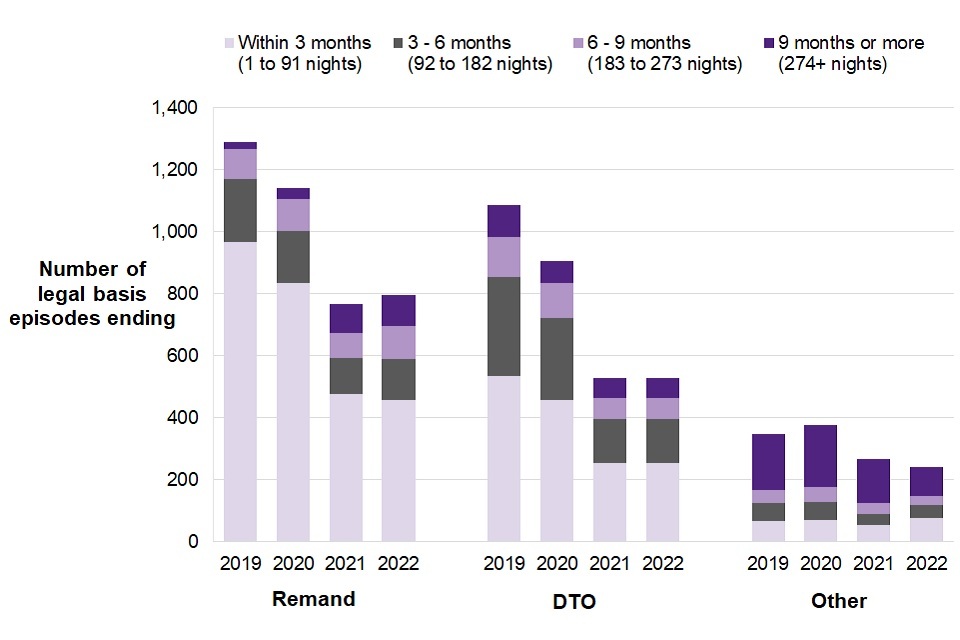
Figure 7.10 shows that in the year ending March 2022 children are spending longer on remand than previous years; around 100 remands lasted longer than 9 months in 2022, compared to around 20 in year ending March 2019.
Remand episodes
The number of remand episodes increased by 4% from the previous year to around 800, whilst children are also spending longer on remand than in previous years. The median number of nights spent on remand in the latest year was nine nights longer than the previous year and 29 nights longer (74%) than the year ending March 2019.
The increases have been, in part, driven by the proportion of episodes ending after 274 nights. In the year ending March 2022, these made up 13% of all remand episodes ending. This remains the same compared with 13% in the year ending March 2021, but an increase compared with 2% in the year ending March 2019.
Detention and Training Order (DTO)
For those held on a DTO only, just under half of episodes (47%) ended within three months, which is a slight decrease on the previous two years (51% and 48% respectively). In the latest year, 27% of DTO episodes ended after six months, compared with 25% in the previous year and 21% in the year ending March 2019.
Other
In the latest year, around 240 legal basis episodes that ended were recorded as Other, which includes long term sentences including Section 250. Around a half of these episodes (51%) lasted six months or longer, which is a decrease when compared to the three previous years (64% in the year ending March 2019 and 66% in both the years ending March 2020 and 2021).
The median number of nights spent on this type of legal basis was 193 in the latest year, a decrease from 301 nights in the previous year and 291 nights in the year ending March 2019.
7.9 Legal basis episodes ending by nights spent in the youth secure estate and ethnicity
In the latest year, the number of legal basis episodes ending for White children was around 690, a decrease of 10% from the previous year, compared with around 710 episodes ending for children from ethnic minorities, which had a similar decrease of 9% from the previous year.
Figure 7.11: Proportion[footnote 30] of legal basis episodes ending by nights spent and ethnic group, youth secure estate in England and Wales, year ending March 2022
| Number of nights | 1-91 | 92-182 | 183-273 | 274-365 | 366+ |
| Ethnic minorities | 50% | 19% | 14% | 8% | 8% |
| White | 51% | 20% | 15% | 6% | 6% |
As shown in Figure 7.11, over two thirds of custodial episodes ended within six months for both White children (71%) and children from ethnic minorities (69%).
7.10 Deaths in youth custody
In the year ending March 2022, no children died in custody in the youth secure estate.
Between the years ending March 2012 and 2022, there were three deaths in youth custody (see the formal Prisons and Probation Ombudsmen Reports).
8. Behaviour management in the youth secure estate
In the year ending March 2022:
-
The rate of incidents per 100 children and young adults in the youth secure estate across all behaviour management measures increased from the previous year. These increases are much closer to pre-pandemic levels and likely due to a return to normal regimes following the periods of restrictions during the first year of the COVID-19 pandemic where children spent much longer in their rooms.
-
The rate of incidents of separation in Secure Children’s Homes and Secure Training Centres has seen the largest increase of the four behaviour management measures, increasing by 56% in the last year to around 1,700 incidents per 100 children and young adults in the year.
-
The rate of incidents of assault in the youth secure estate increased by 25% in the last year to around 400 incidents per 100 children and young adults in the year.
-
The rate of incidents of self-harm in the youth secure estate increased by 29% in the last year to around 290 incidents per 100 children in the year.
-
The rate of Restrictive Physical Interventions (RPIs) in the youth secure estate increased by 17% to around 770 incidents per 100 children and young adults in the year.
-
There was a monthly average rate of 80 use of force incidents per 100 children and young adults across the two Secure Training Centres and five Young Offender Institutions; this is an increase of 27% on the previous year and is the second highest rate since the first implementation of Managing and Minimising Physical Restraint (MMPR) in 2013.
This chapter presents data on trends of behaviour management incidents by type and use of force in the youth secure estate by demographic characteristics. It includes 18 year olds still in the youth estate, so the term ‘children and young adults’ is used throughout, but only includes those held in the youth secure estate.
Rates are now presented as incidents per 100 children per year rather than per month as in previous publications.
8.1 Trends in the number of behaviour management incidents
Figure 8.1: Average yearly rate of behaviour management incidents per 100 children and young adults in custody, youth secure estate in England and Wales, years ending March 2017 to 2022
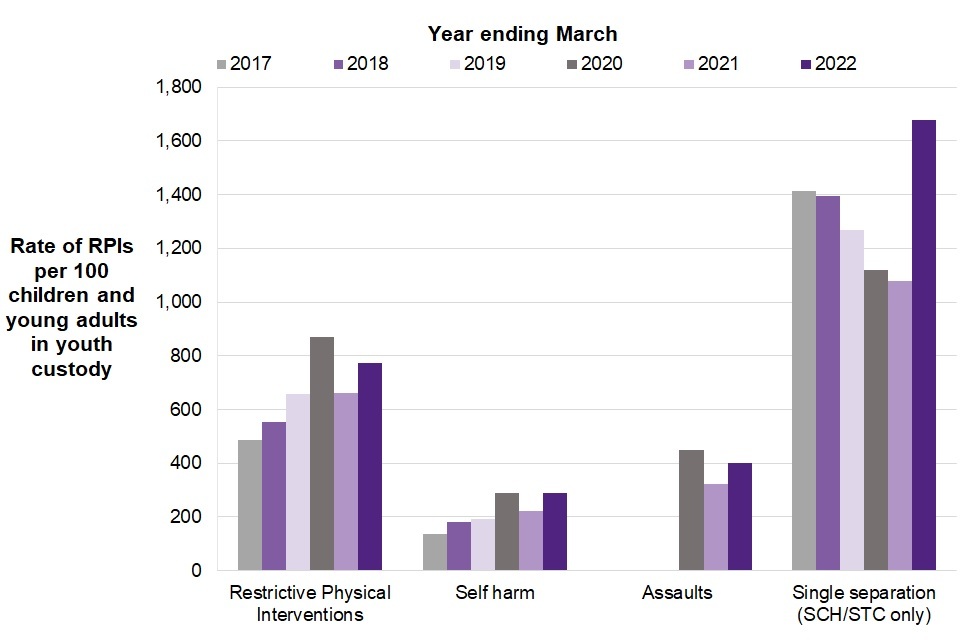
Figure 8.1 shows that in the year ending March 2022, single separation had the highest average yearly rate per 100 children and young adults compared to restrictive physical interventions, self-harm and assaults.
8.2 Use of Restrictive Physical Interventions (RPIs) in the youth secure estate
In the year ending March 2022 there were just over 4,000 RPIs, down 6% compared with the previous year. This is the second consecutive annual fall after four consecutive increases and is the lowest number of RPIs seen since the year ending March 2016.
However, with the fall in the custodial population, the average yearly rate of RPIs per 100 children and young adults in the youth secure estate has increased. In the latest year, the rate of RPIs per 100 children and young adults in the youth secure estate was around 770, an increase from the previous year (660). As shown in Figure 8.2, increases in the rate of RPIs were seen in all demographic groups except for 10 to 14 year olds and girls.
Figure 8.2: Average yearly rate of RPIs per 100 children and young adults in custody by demographic characteristics, youth secure estate in England and Wales, years ending March 2017 to 2022
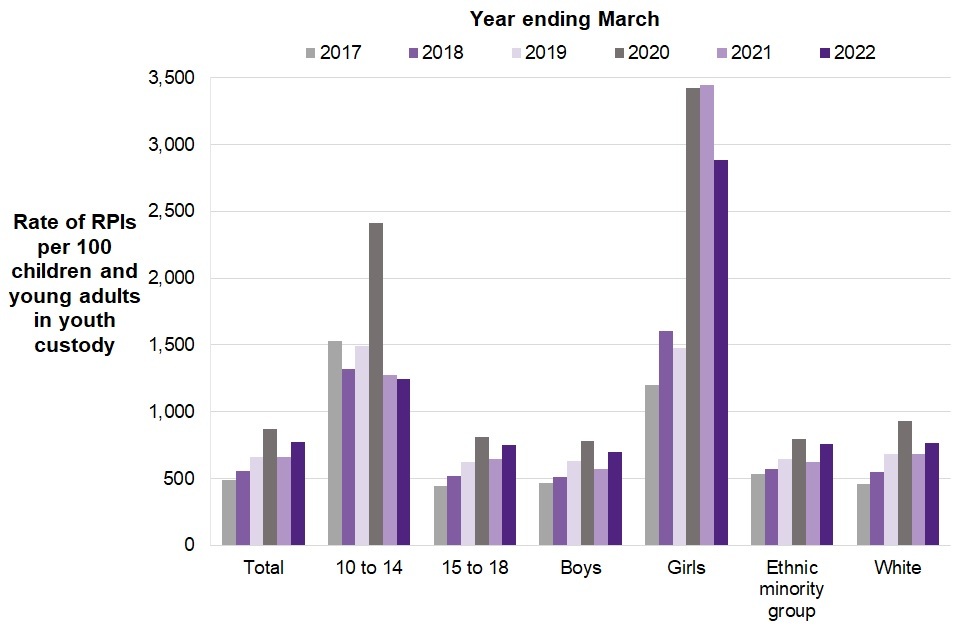
Figure 8.2 shows average yearly rates of RPIs were higher for those aged 10 to 14-year-olds, girls and white children and young adults from.
Figure 8.2 shows that in the year ending March 2022 the average yearly rate of RPIs per 100 children and young adults in custody was higher for:
-
those aged 10 to 14 (an average yearly rate of around 1,240 per 100 children compared to 750 for children and young adults aged 15 to 18) maintaining the trend since the time series began, although the two rates have been converging in recent years;
-
girls, at around 2,900 per 100 girls in the youth secure estate compared to 700 per 100 boys in the youth secure estate, though the small number of girls in the population should be taken into account (an average population of 16 girls in custody compared with just over 500 boys).
-
White children and young adults (at 765 compared to 760 for children and young adults from Ethnic Minority groups). This is the fourth consecutive year that the rate has been higher for White children and young adults than those from Ethnic Minority groups but the difference is smaller than previous years and is now less than one percent.
Figure 8.3: The number of injuries requiring medical treatment to children and young adults by severity of injury resulting from an RPI, youth secure estate in England and Wales, years ending March 2017 to 2022
| Severity of RPI injury requiring medical treatment | 2017 | 2018 | 2019 | 2020 | 2021 | 2022 |
| Minor injury requiring medical treatment on site | 92 | 76 | 54 | 79 | 34 | 40 |
| Serious injury requiring hospital treatment | 8 | 2 | 7 | 3 | 7 | 4 |
| Total injuries requiring medical treatment | 100 | 78 | 61 | 82 | 41 | 44 |
| Proportion of RPIs that resulted in an injury requiring medical treatment | 2% | 1% | 1% | 1% | 1% | 1% |
In the year ending March 2022, the number of RPIs resulting in medical treatment were broadly similar compared to the previous year (44 compared with 41 in the year ending March 2021). 1% of all RPIs resulted in injuries requiring medical treatment. This proportion is unchanged from the previous year and has remained broadly stable for the last five years (Supplementary Table 8.7).
As shown in Figure 8.3, there were 44 RPIs that resulted in an injury requiring medical treatment, of which:
-
40 (91%) were minor injuries requiring medical treatment on site; and
-
four incidents (9%) were serious injuries requiring hospital treatment.
8.3 Self harm in the youth secure estate
The number of self harm incidents has increased by 4% in the latest year, to around 1,500 incidents. This remains much lower than the peak in the year ending March 2020.
The rate of self harm incidents has increased to around 290 per 100 children and young adults in custody. This is compared to a rate of around 220 self harm incidents per 100 children and young adults in custody per year in the year ending March 2021 and is more than double the rate of five years ago (around 140 incidents per 100 children).
The rate of self harm incidents per child and young adult involved has remained stable compared to the previous year at around six.
Figure 8.4: Average yearly rate of self harm incidents per 100 children and young adults in custody by demographic characteristics, youth secure estate in England and Wales, years ending March 2017 to 2022
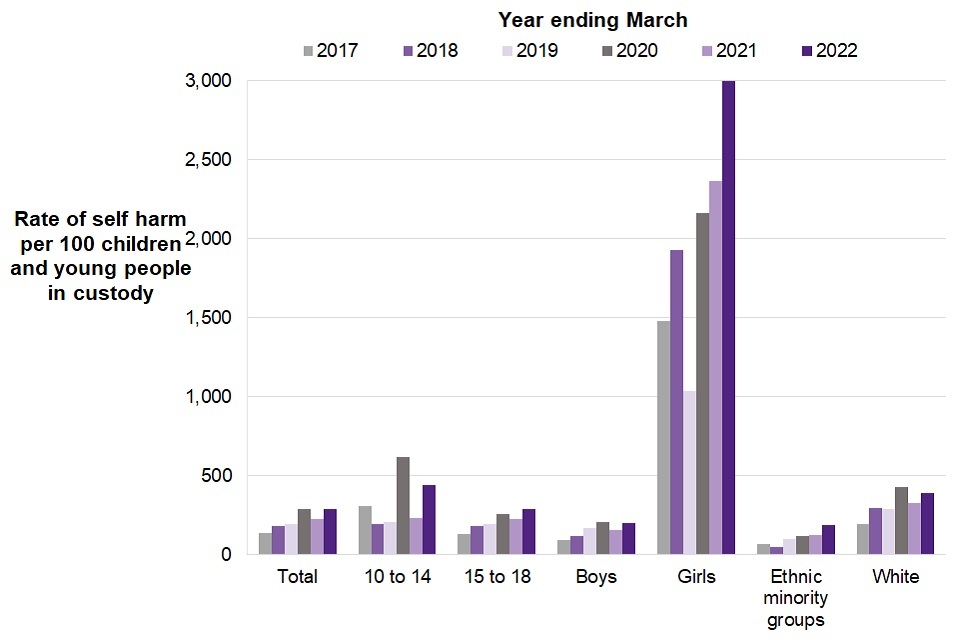
Figure 8.4 shows average yearly rates of self-harm were higher for those aged 10 to 14-year-olds, girls and white children and young adults.
Looking at the demographic characteristics of the children and young adults involved in self harm incidents (Figure 8.4), in the year ending March 2022 the rate of self harm per 100 children and young adults in youth custody was higher for:
-
girls (at around 3,000 compared to 200 for boys), continuing the upward trend seen in the previous three years;
-
those aged 10 to 14 (around 440 compared to 290 for 15 to 18 year olds), which is the second highest rate for 10 to 14 year olds since the year ending March 2017 and continues the trend of the younger age group having higher rates of self harm; and
-
White children and young adults (around 390 compared to around 190 for children and young adults from Ethnic Minority groups), which continues the trend of White children and young adults having consistently higher rates over the last five years.
Figure 8.5: The number of injuries requiring medical treatment to children and young adults by severity of injury as a result of self harm, youth secure estate in England and Wales, years ending March 2017 to 2022
| Year ending | 2017 | 2018 | 2019 | 2020 | 2021 | 2022 |
| Severity of self harm injury requiring medical treatment | ||||||
| Minor injury requiring medical treatment on site | 319 | 501 | 621 | 558 | 308 | 374 |
| Serious injury requiring hospital treatment | 19 | 34 | 39 | 69 | 81 | 48 |
| Total injuries requiring medical treatment | 338 | 535 | 660 | 627 | 389 | 422 |
| Proportion of self harm that resulted in an injury requiring medical treatment | 27% | 30% | 36% | 25% | 27% | 28% |
In the year ending March 2022, over a quarter (28%) of self harm incidents resulted in injuries which required medical treatment (Supplementary Table 8.12). This proportion is a small increase compared with the previous year (27%) but lower than the peak of 36% three years ago.
As shown in Figure 8.5, in the year ending March 2022 there were just over 420 incidents of self harm that resulted in an injury requiring medical treatment, of which:
-
89% (around 370 incidents) were minor injuries requiring medical treatment on site; and
-
11% (around 50 incidents) requiring hospital treatment, a fall of around 40% from the previous year but still more than twice the number five years ago.
The number of injuries requiring medical treatment to children and young adults following a self harm incident increased by 8% in the last year, after two consecutive falls. The increase was driven by a large increase in Young Offender Institutions (137%). Secure Training Centres saw a decrease of two thirds (66%), with a fall in Secure Children’s Homes of 20% (Supplementary Table 8.12).
8.4 Assault incidents in the youth secure estate
In the year ending March 2022 there were 2,100 assault incidents, with around 3,300 children and young adults involved as assailants or fighters. In the latest year, there was an average of around 400 incidents of assault per 100 children and young adults in custody. However the number of assailant or fighter involvements per 100 children and young adults in custody in the year was around 640.
Figure 8.6: Average yearly number of assailant or fighter involvements per 100 children and young adults in custody, youth secure estate in England and Wales, years ending March 2020 to 2022
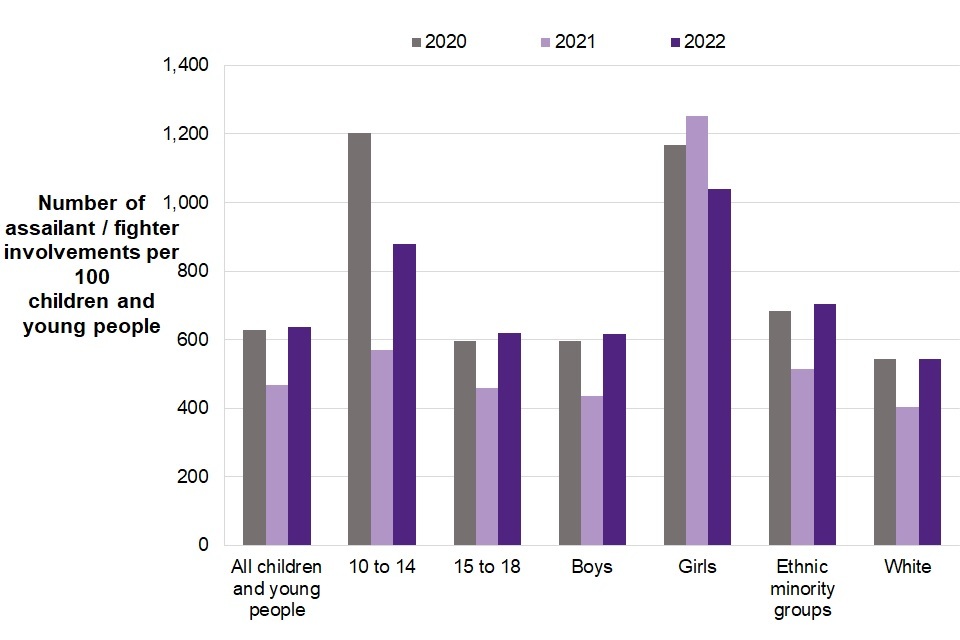
Figure 8.6 shows that the children and young adults involved as assailants or fighters in the year ending March 2022, the average yearly rates per 100 was higher for those aged 10 to 14, girls, and those from ethnic minority groups.
Figure 8.6 shows that for demographic characteristics of the children and young adults involved as assailants or fighters in the year ending March 2022, the average yearly rates per 100 children and young adults was higher for:
-
those aged 10 to 14 (at 880, compared to 620 for those aged 15 to 18 years old);
-
girls (around 1,000, compared to around 620 for boys); and
-
children and young adults from Ethnic Minority groups (at around 700, compared to around 540 for White children and young adults).
Supplementary Table 8.17 shows that in the year ending March 2022, just over half of all assault incidents involved child on staff assaults with most of the rest being child on child assaults, although this differed by sector. Most assault incidents in YOIs (64%) involved child on child assaults, whereas the majority of assault incidents in both SCHs and STCs were child on staff assaults.
Figure 8.7: The severity of injuries to children and young adults resulting from assault incidents, youth secure estate in England and Wales, years ending March 2020 to 2022
| Severity of assault injury | Year ending 2020 | Year ending 2021 | Year ending 2022 | |
| Minor injury | 570 | 273 | 300 | |
| Serious injury | 71 | 44 | 40 | |
| Total assault incidents resulting in injury | 641 | 317 | 340 | |
| Proportion of assault incidents that resulted in an injury to a child or young adult | 17% | 15% | 16% |
In the year ending March 2022, 16% of assault incidents resulted in an injury to a child or young adults. Most of these (300) were minor injuries, with 40 serious injuries.
8.5 Separation in SCHs and STCs
Data are only published for SCHs and STCs. Comparable data are not held for public YOIs. There were around 2,100 separation incidents in SCHs and STCs in the year ending March 2022. This is a 22% increase compared with the previous year. This is the first increase since the year ending March 2018 but is still 46% lower than that year.
The rate of separation incidents per 100 children and young adults follows a similar trend to the number of incidents (Table 8.20) as both have risen in the year ending March 2022 after three consecutive year-on-year falls (Figure 8.8). In the latest year, the rate was around 1,700 per 100 children and young adults. This is an increase compared to the previous year (around 1,100) and is now at the highest rate in the last five years.
Figure 8.8: The average yearly rate of separation incidents per 100 children and young adults in custody by demographic characteristics, SCHs and STCs only, England and Wales, years ending March 2017 to 2022
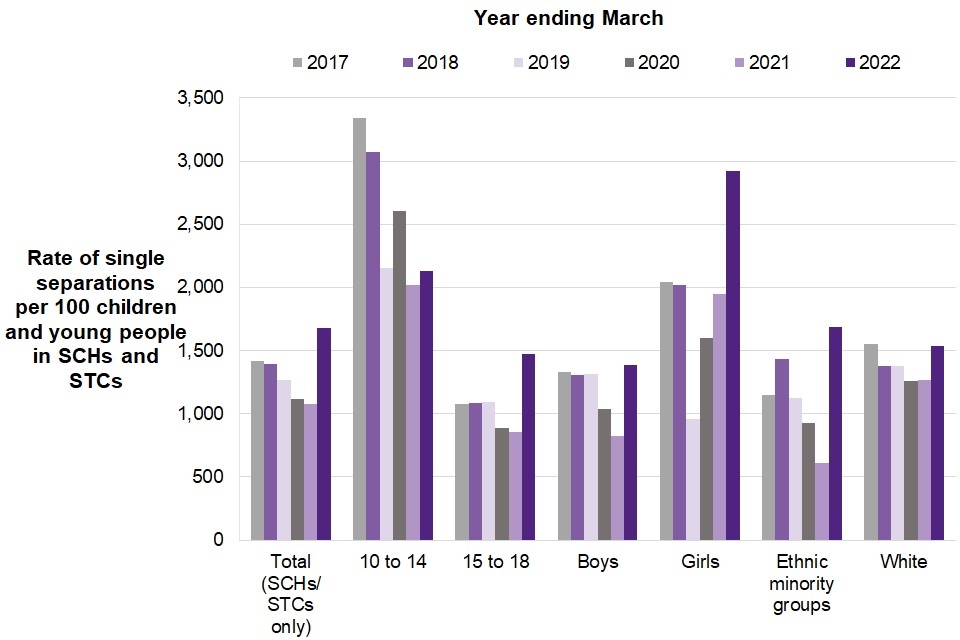
Figure 8.8 shows the average yearly rates increased across all demographic groups for the average yearly rate of separation incidents per 100 children and young adults in custody.
Figure 8.8 shows that in the year ending March 2022 average yearly rates were higher for:
-
those aged 10 to 14 (who had a higher rate of around 2,100 compared to around 1,500 for those aged 15 to 18), whilst the rate for the older age group has increased for the first time since the year ending March 2019;
-
Ethnic Minority children and young adults (around 1,700 compared to around 1,500 for those from a White background), with the rate for the Ethnic Minority group overtaking the rate for the White group for the first time since the year ending March 2018; and
-
girls, for whom the rate has seen a large increase in the latest year (around 2,900 compared to around 1,400 for boys), which continues the trend in recent years of much higher rates for girls.
8.6 Use of force incidents in STCs and YOIs
Use of force data is presented as monthly in contrast to the annual figures presented for the other behaviour management measures. This is because of the staggered rollout of Managing and Minimising Physical Restraint techniques across the youth secure estate it is more difficult to calculate annual rates in earlier years.
Figure 8.9: Average monthly rate of use of force incidents per 100 children and young adults in the youth secure estate and per children or young adults involved, STCs and YOIs only, England and Wales, years ending March 2017 to 2022
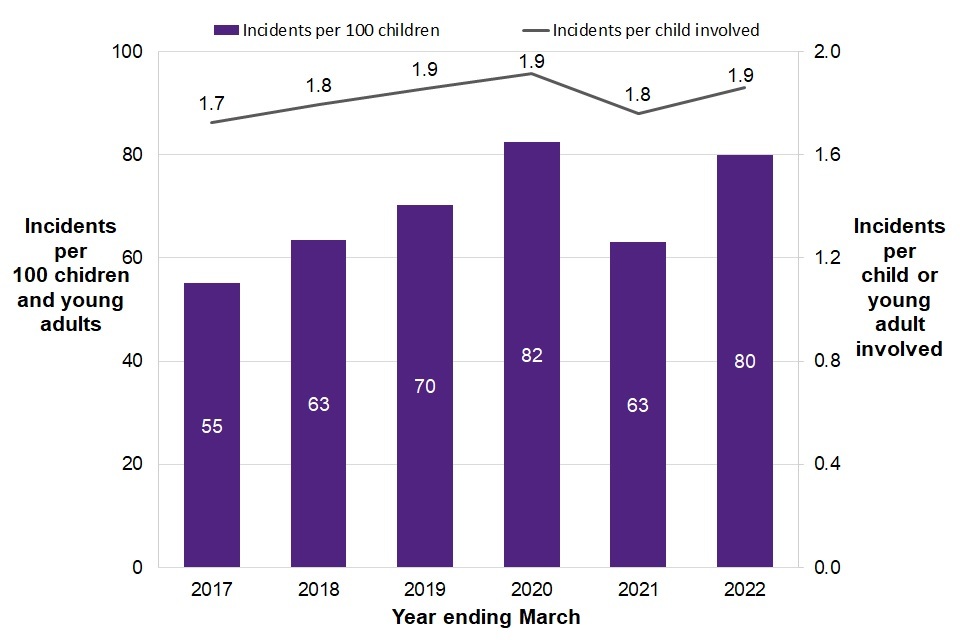
Figure 8.9 shows an increase in the average monthly rate of use of force incidents per 100 children and young adults in the youth secure estate in the year ending March 2022.
8.7 Characteristics of use of force incidents in STCs and YOIs
Data are only published for STCs and YOIs. Comparable data are not held for SCHs. In the year ending March 2022, there were 4,300 use of force incidents in STCs and YOIs, which is an average of just under 360 incidents per month. In the latest year, the average monthly rate of 80 use of force incidents per 100 children and young adults (Supplementary Table 8.23).
In the year ending March 2022, Managing and Minimising Physical Restraint (MMPR) techniques were used in 78% of all use of force incidents, an average of around 280 MMPR incidents per month.
Supplementary table 8.27 shows that in the year ending March 2022, the highest level technique recorded in each MMPR incident was:
-
pain inducing for 1% of all MMPR incidents;
-
high level used for 46% of all MMPR incidents;
-
medium level for 33% of all MMPR incidents; and
-
low level for 20% of all MMPR incidents.
Supplementary Table 8.24 shows that the most common reason given for use of force being applied was “preventing harm to a third party” (75% of reasons given). The second most common was “preventing harm to self” at 13%.
Over half (58%) of use of force incidents in STCs and YOIs lasted for two minutes or less. Nearly a third (32%) lasted between three and five minutes. The remaining 10% of incidents lasted for six minutes or more. Handcuffs were used in 14% of incidents (just over 610) (Supplementary Table 8.24).
8.8 Demographic characteristics of children and young adults involved in use of force incidents
Figure 8.10: Average monthly rate of use of force incidents per 100 children and young adults in youth custody by age and by gender STCs and YOIs only, England and Wales, year ending March 2022
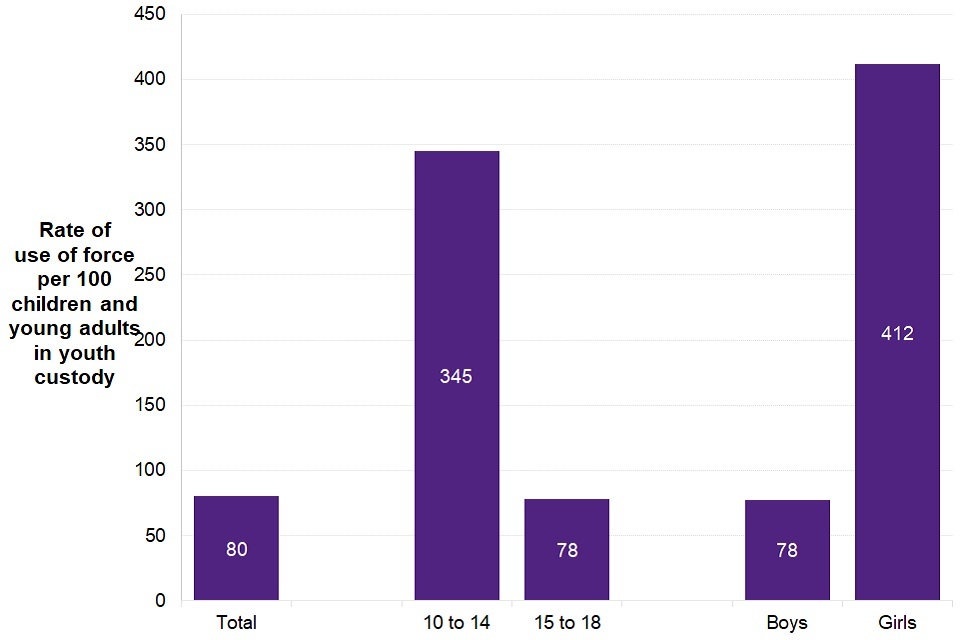
Figure 8.10 shows that the average monthly rate of use of force per 100 children and young adults in youth custody was higher for those aged 10 to 14 and girls.
In the year ending March 2022, the average monthly rate of use of force per 100 children and young adults in youth custody was higher for:
-
those aged 10 to 14 years (at around 350 compared to around 80 for 15 to 18 year olds); and
-
girls (at around 410 compared to around 80 for boys).
Figure 8.11: Average monthly rate of use of force incidents per 100 children and young adults in custody by ethnicity, STCs and YOIs only, England and Wales, year ending March 2022
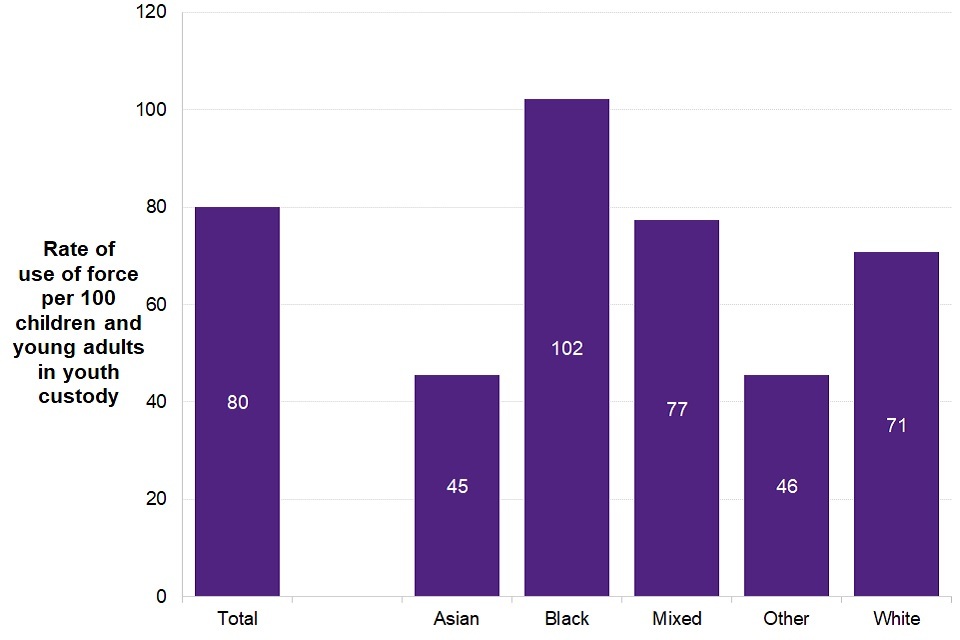
Figure 8.11 shows that the average monthly rate of use of force per 100 children and young adults in youth custody was highest for black children.
In the year ending March 2022, the average monthly rate of use of force per 100 children and young adults in youth custody was:
-
higher for ethnic minority children and young adults (around 90 compared to an overall average of 80); and
-
lower for children and young adults of a White background than the overall average at around 70.
8.9 Use of force incidents involving injuries requiring medical treatment
In the year ending March 2022, there were 24 occasions in which children and young adults required medical treatment for an injury following the use of force (1% of all incidents). Of these, 22 injuries were minor injuries requiring medical treatment on site and two were serious injuries requiring hospital treatment (Supplementary Table 8.26).
Establishments are also required to record a number of warning signs and symptoms which are not in themselves injuries but may be indicative of an underlying medical condition, which in turn may be related to the use of force. These are included in the use of force data return. Warning signs were observed on around 180 occasions during the year ending March 2022 (Supplementary Table 8.26).
9. Proven reoffending by children
In the year ending March 2021 aggregated cohort[footnote 31]:
-
The proven reoffending rate fell to 31.2%, a 3.0 percentage point decrease on the previous year. This was the lowest reoffending rate on record and the second largest year on year fall in the time series, though is likely to be affected by the impacts of limits on court activity in the periods of restrictions during the first year of the COVID-19 pandemic and the subsequent backlogs that meant some reoffences weren’t counted.
-
The long-term falls in the number of children in the cohort, children who reoffended and reoffences have continued. The number of children in the annually aggregated cohort has fallen by 23% compared to the previous year, the number of children who reoffended has fallen by 30% and the number of reoffences committed decreased by 32%.
-
Children who reoffended committed around 17,600 reoffences giving an average of 3.54 reoffences per reoffender (frequency rate). While this is a 3% decrease compared with the previous year, it is still 11% higher than ten years ago (3.18).
This chapter covers data on trends in proven reoffending by sentence type and demographics as well as trends in numbers of children in the cohort, children who reoffended and the number of proven reoffences committed by children.
9.1 Children in the cohort, children who reoffend and reoffences
Figure 9.1: Number of children in the cohort, children who reoffended and reoffences, England and Wales, for children entering the cohort in the years ending March 2011 to March 2021
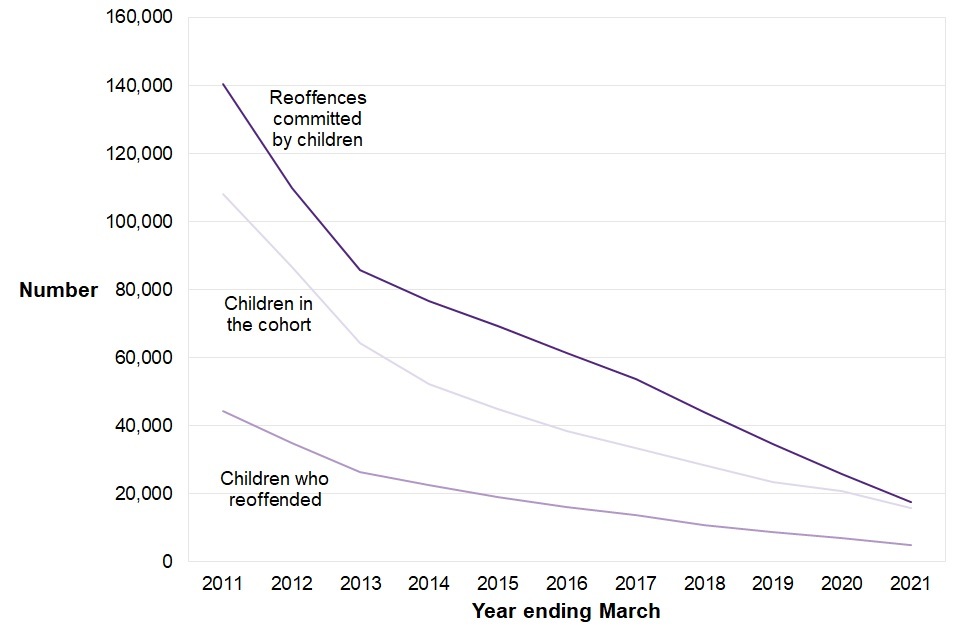
Figure 9.1 shows downward trends in the number of children in the overall cohort, children who reoffended, and number of reoffences committed.
As shown in Figure 9.1, the long-term falls in the number of children in the cohort, those who reoffended and the number of reoffences they committed have continued.
The number of children in the annually aggregated cohort has fallen by 23% in the latest year. The number of children reoffending has fallen by 30% and the number of reoffences being committed decreased by 32%.
9.2 Reoffending rate and frequency rate
Figure 9.2: Reoffending rate and frequency rate for children, England and Wales, for children entering the cohort in the years ending March 2011 to March 2021
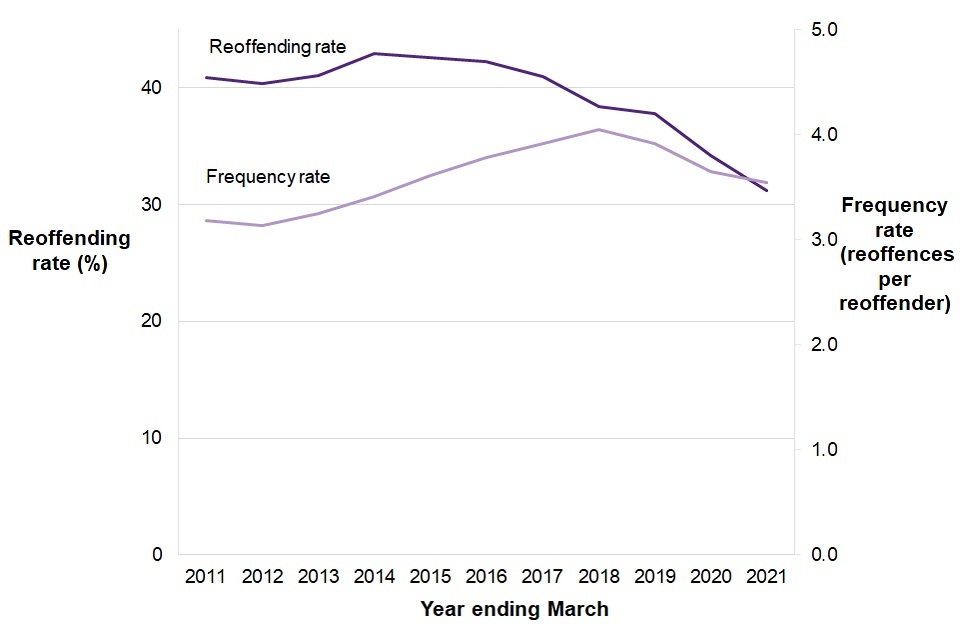
Figure 9.2 shows a decrease in the proven reoffending rate over the last five years to the lowest reoffending rate in the time series, whilst the reoffending frequency rate has also declined in this time, to 3.54, but remains higher than ten years ago.
For the year ending March 2021 cohort, the proven reoffending rate fell to 31.2%, which was both the lowest reoffending rate and the second largest year on year fall in the time series, decreasing by 3.0 percentage points.
The reoffending rate has fallen in each of the last seven years. As with the previous year, the amount it has decreased in the latest year may be due to the impacts of limits on court activity in the periods of restrictions during the first year of the COVID-19 pandemic and the subsequent backlogs that meant some reoffences were not counted. This is because they were not dealt with at court during the one-year follow-up period or the additional six-month waiting period to allow for offences to be proven in court.
In the latest year, children who reoffended committed an average of 3.54 reoffences each (frequency rate). This is the third consecutive year in which the frequency rate has fallen having steadily increased every previous year since the year ending March 2013, although it remains higher than ten years ago (3.18).
9.3 Reoffending by demographic characteristics of children
Figure 9.3: Reoffending rate for children by sex, England and Wales, for children entering the cohort in the years ending March 2011 to March 2021
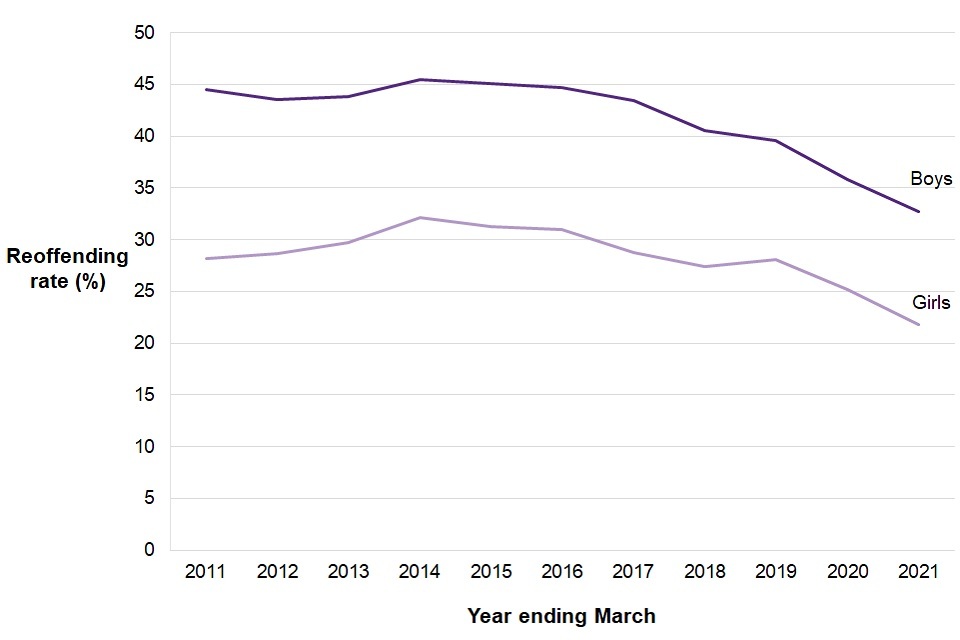
Figure 9.3 shows that the reoffending rate for boys has been higher than for girls with the reoffending rates for both following a similar trend of decreasing every year since 2015, except for girls in the year ending March 2019.
Boys have always made up the majority of the cohort, and the proportion they comprise has been increasing over the last ten years, from 78% to 86% in the year ending March 2021 (Supplementary Table 9.2), the largest it has been in the time series.
As shown in Figure 9.3, the reoffending rate for boys has been higher than for girls in each of the last ten years. In the latest year, the reoffending rate for boys was 32.7%, compared to 21.8% for girls. The reoffending rates for both sexes have followed a similar trend, decreasing each year since the year ending March 2015, except for the year ending March 2019 when the reoffending rate for girls increased by 0.8 percentage points. The most recent year showed the largest fall over the last ten years for girls (falling by 3.3 percentage points) compared with a 3.1 percentage point decrease for boys.
Supplementary Table 9.2 shows that the average number of reoffences per reoffender (frequency rate) fell for boys in the last year but rose slightly for girls causing the frequency rate for girls (4.37 reoffences per offender) to be higher than that for boys (3.45 reoffences per offender) for the second consecutive year in the time series.
Figure 9.4: Reoffending rate by age group, England and Wales, for children entering the cohort in the years ending March 2011 to March 2021
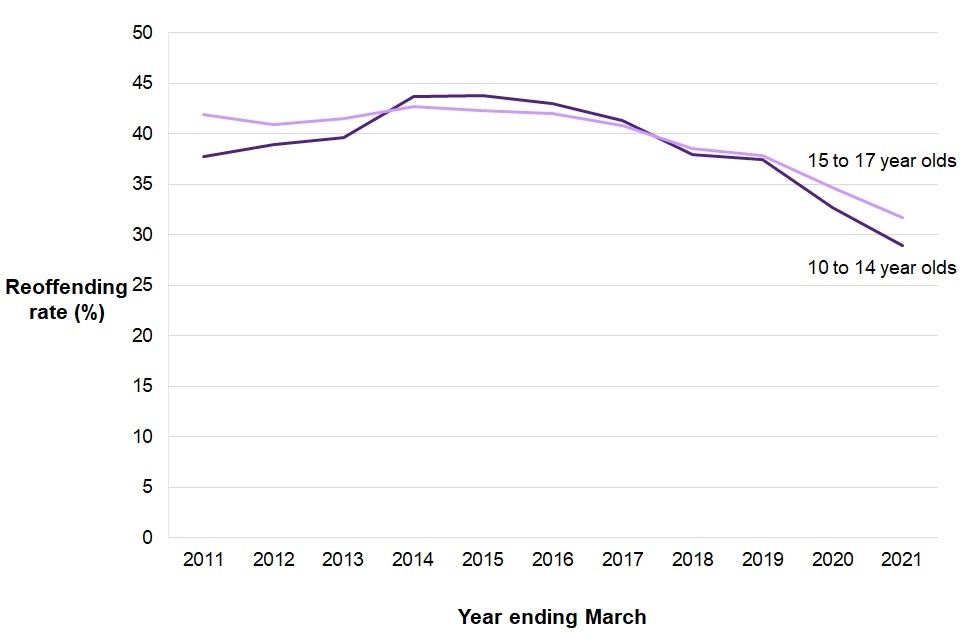
Figure 9.4 shows that the reoffending rate continues to decrease for both 10 to 14 year olds and 15 to 17 year olds, with the rate for 10 to 14 years lower over the last two years.
The majority of children who entered the aggregated cohort were aged 15 to 17, with the proportion increasing from 78% in the year ending March 2020 to 82% in the year ending March 2021 (Supplementary Table 9.3a).
Historically, the reoffending rate for 15 to 17 year olds was higher than that for the younger age group (10 to 14 year olds). From the year ending March 2014, the difference between the two age groups became smaller, and the rate for the younger age group (10 to 14 year olds) overtook 15 to 17 year olds and remained higher for four years. However, while the reoffending rate for both age groups has been falling, that for 15 to 17 year olds has decreased at a slower rate and so has now been higher for the last four years. In the year ending March 2021, the reoffending rate for 15 to 17 year olds was 31.7%, compared to 28.9% for 10 to 14 year olds.
Supplementary Table 9.3a shows that 10 to 14 year olds who reoffended committed more reoffences on average than those aged 15 to 17 (3.66 and 3.52 respectively in the latest year), as has been the trend since the year ending March 2012 aggregated cohort.
Figure 9.5: Reoffending rate for children by ethnicity[footnote 32], England and Wales, for children entering the cohort in the years ending March 2011 to March 2021
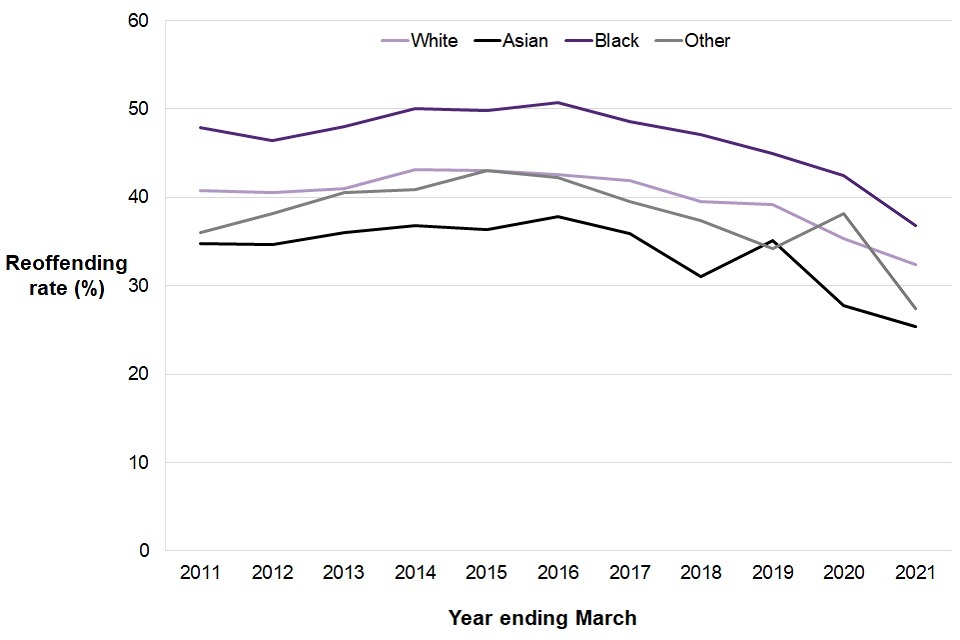
Figure 9.5 shows that there have been decreases in the reoffending rate across all ethnicities in the last five years, except for an increase for Asian children in the year ending March 2019 and for Other children in the year ending March 2020.
As shown in Figure 9.5, there have been decreases in the reoffending rate across all ethnicities in the last five years, except for an increase for Asian children in the year ending March 2019 and for Other children in the year ending March 2020. However, these are the two smallest cohorts and so are subject to greater fluctuations.
The reoffending rate has consistently been highest for Black children over the last ten years. In the latest year, 36.8% of Black children reoffended, which is the lowest value in the time series, a fall of 5.6 percentage points from the previous year and a decrease of 11.1 percentage points compared with ten years ago. Over the time series, Black children have made up an increasing proportion of the offending cohort and now make up nearly a fifth (19%) which is almost twice what it was ten years ago (10%).
White children make up most of the offending cohort at 73%, though this is the lowest this proportion has been in the time series. White children had the second highest reoffending rate in the year ending March 2021, at 32.4% which was a decrease of 3.0 percentage points in the last year. In the latest year, White children who went on to reoffend committed the highest number of reoffences on average (3.74) compared to children of all other ethnicities.
In the latest year, the reoffending rate for children from an Asian background was 25.4%, a decrease of 2.3 percentage points compared to the previous year, which was the lowest fall in reoffending rates across all ethnicities. However, children from an Asian background have had the lowest reoffending rate compared to other ethnic groups every year since the year ending March 2011 except for the year ending March 2019.
Those from an Other ethnic background have made up a very small proportion of the offending cohort in each of the last ten years (always 1%). Unlike previous years, this ethnic group has seen a decrease both since the year ending March 2011 and the previous year (by 8.5 percentage points and 10.7 percentage points respectively). However, these figures should be treated with caution due to the small cohort size.
9.4 Reoffending by criminal history
As might be expected, the rate of reoffending increases with the number of previous offences committed. For the year ending March 2021 aggregated cohort, those with no previous offences had a reoffending rate of 16.4%, compared to 63.8% for those who had committed 11 or more previous offences (Supplementary Table 9.6a).
Those who had committed no previous offences made up 47% of all children in the aggregated cohort, the highest proportion in the time series, but committed only 18% of all proven reoffences. Those with 11 or more previous offences made up only 10% of all children in the aggregated cohort but committed 29% of all proven reoffences.
The average number of previous offences per offender has now decreased for three consecutive years after six consecutive year on year increases. In the latest year, there was a decrease of 3%, to 3.54 which is lowest number of previous offences per offender since the year ending March 2015 (Supplementary Table 9.1a).
9.5 Reoffending by index offence
The offence that leads to an offender being included in the offender cohort is called the index offence. Supplementary Table 9.5a shows that for the year ending March 2021 cohort:
-
children who committed a summary non-motoring offence as their index offence made up the largest proportion of all index offences committed by children, accounting for 21% of the cohort. Drugs offences made up the second largest index offence group, at 15%. Their associated reoffending rates were 33.3% and 35.4%, respectively.
-
children with an index offence of fraud had the highest reoffending rate, at 37.7% for the second consecutive year: This is a change from all previous years in the time series in which an index offence of either public order or miscellaneous crimes against society had the highest reoffending rate. This is followed by those who committed theft offences (37.2%) and public order offences (36.2%). In the latest year, Fraud offences had the highest frequency rate in the latest year, at 5.01.
-
children who committed a sexual offence accounted for just 1% of the cohort and had the lowest reoffending rate (6.8%); this has been a consistent trend over the last ten years.
9.6 Reoffending by index disposal
Figure 9.6: Reoffending rate for children by index disposal, England and Wales, for those entering the cohort in the years ending March 2011 to March 2021
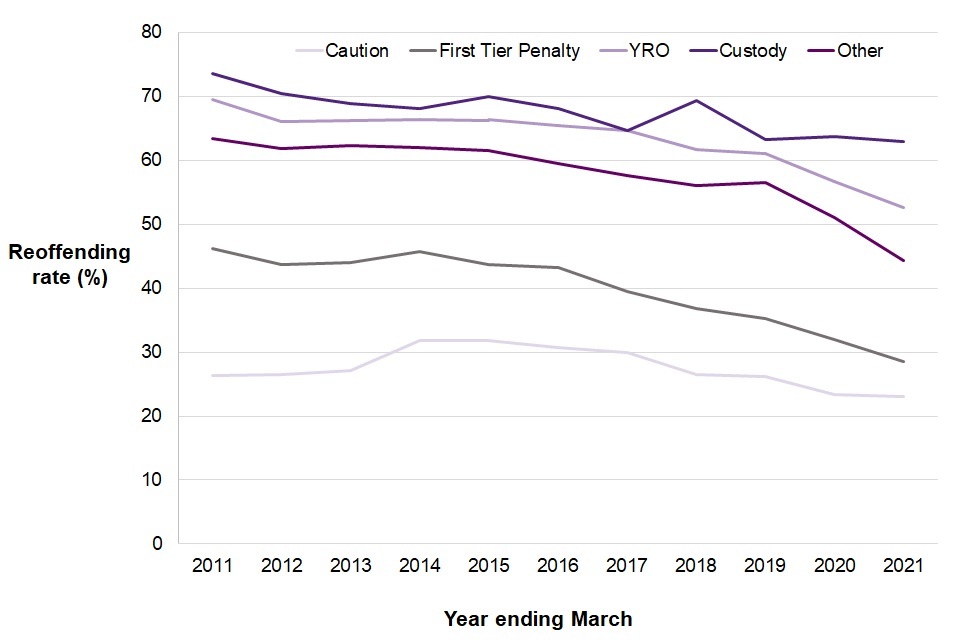
Figure 9.6 shows that the reoffending rate remains highest for those released from custody (followed by Youth Rehabilitation Orders, other sentences, first tier penalties, and cautions), consistent with the pattern for the last ten years.
The index disposal is the caution or type of sentence the child received for their index offence.
In the year ending March 2021 aggregated cohort, children who received a caution had the lowest reoffending rate (23.0%) of all index disposal types.
As shown in Figure 9.6, the reoffending rate remains highest for those released from custody, consistent with the pattern for the last ten years. For children released from custody in the year ending March 2021, 62.9% reoffended, a decrease of 0.8 percentage points from the previous year. All other index disposal types also saw a fall in reoffending rates in the last year.
Supplementary Table 9.7a shows that in the latest year the frequency rate for those given an Other disposal was the highest at an average of 4.72 reoffences per reoffender. This is the second consecutive in which those released from custody did not have the highest frequency rate.
For the group whose index disposal was a custodial sentence, those who were given sentences of more than six months but less than 12 months had the highest reoffending rate (71.8%) in the latest year (Supplementary Table 9.8a). This has varied over the last three years, with the reoffending rate for those given sentences of less than six months fluctuating with the reoffending rate for those given sentences of between six and 12 months. However, caution should be taken when using these figures due to the small cohort sizes: In the most recent year, both cohorts were less than 100 children or young people.
Proven reoffending rates by index disposal should not be compared to assess the effectiveness of sentences, as there is no control for known differences in offender characteristics, the offence committed, and the type of sentence given.
10. Criminal histories of children
In the year ending December 2021:
-
Children cautioned or sentenced had an average of 1.5 previous cautions or sentences, the lowest in the time series. This was a decrease from 1.6 in the previous year and from 2.5 ten years ago.
-
For the second consecutive year, more children didn’t have a prior criminal history, with 54% of those cautioned or sentenced being first time entrants.
-
Of the children cautioned or sentenced who had a criminal history of 15 or more previous cautions or sentences, 42% were sentenced to immediate custody compared to just 1% for those with no previous criminal history.
This chapter presents on trends of criminal histories for children with a caution or conviction. Data for the year ending March 2022 is not available, therefore data for the year ending December 2021 is presented in this chapter.
10.1 Criminal histories of children
Figure 10.1: Average number of previous cautions or sentences of children cautioned or sentenced for any offence by ethnicity, England and Wales, years ending December 2011 to December 2021
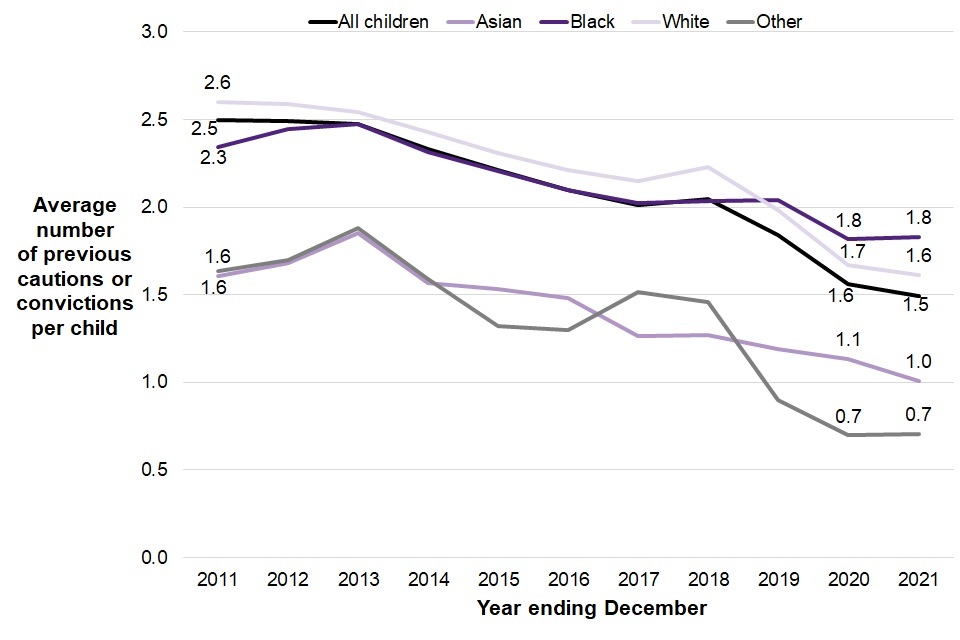
Figure 10.1 shows that the average number of previous cautions or sentences for children cautioned or sentenced varied by ethnicity, with black children having the highest in the latest year at 1.8.
Children cautioned or sentenced had an average of 1.5 previous cautions or sentences, the lowest in the time series. This was a decrease from 1.6 in the previous year and from 2.5 ten years ago.
Figure 10.1 shows that the average number of previous cautions or sentences for children cautioned or sentenced varied by ethnicity. In the year ending December 2021, children across all ethnicities had the same or a lower average number of previous cautions or sentences compared with the previous year.
There was a decrease from 1.7 previous cautions or sentences to 1.6 previous cautions or sentences for White children and a decrease from 1.1 previous cautions or sentences to 1.0 previous cautions or sentences for Asian children compared with the previous year.
Black children had the highest number of previous cautions or sentences with 1.8, which remained the same compared with the previous year.
Figure 10.2: Number and proportion of children cautioned or sentenced with no criminal history compared with those with a criminal history, England and Wales, years ending December 2011 to 2021
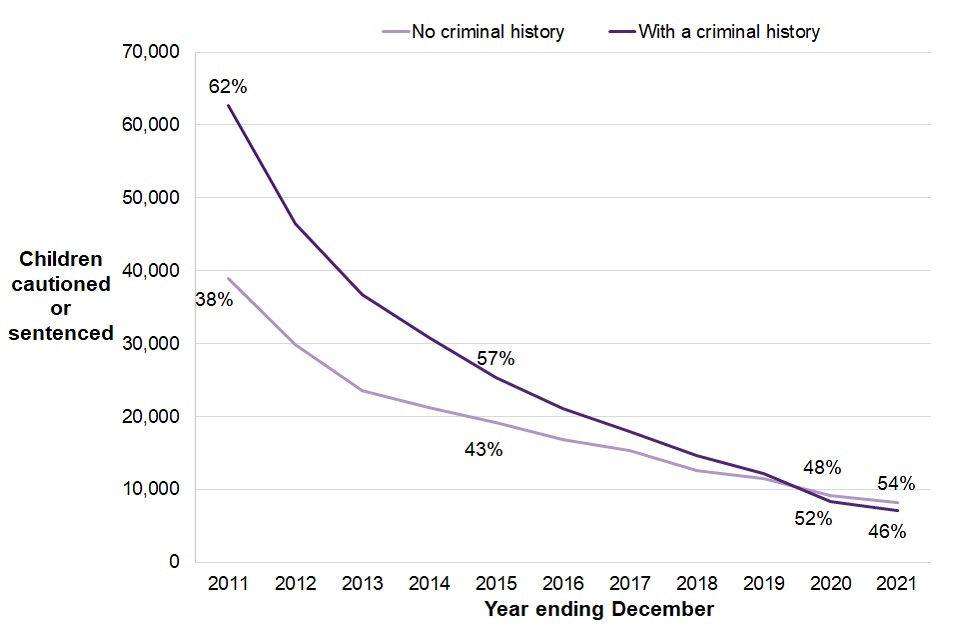
Figure 10.2 shows downward trends in the proportions of children cautioned or sentenced both with no criminal history and with a criminal history.
For the second consecutive year, more children didn’t have a prior criminal history, with 54% of those cautioned or sentenced being first time entrants.
The proportion of children who didn’t have a prior criminal history compared to those with a criminal history had been narrowing in recent years, with the proportion of those without a criminal history increasing by two percentage points in the latest year.
The number of children cautioned or sentenced with a criminal history was around 7,100 in the year ending December 2021. This has decreased by 15% since the previous year when the figure was around 8,400.
10.2 Criminal histories of children – indictable and summary offences
Figure 10.3: Number and proportion of children cautioned or sentenced for summary and indictable offences by number of previous cautions and sentences, England and Wales, year ending December 2021
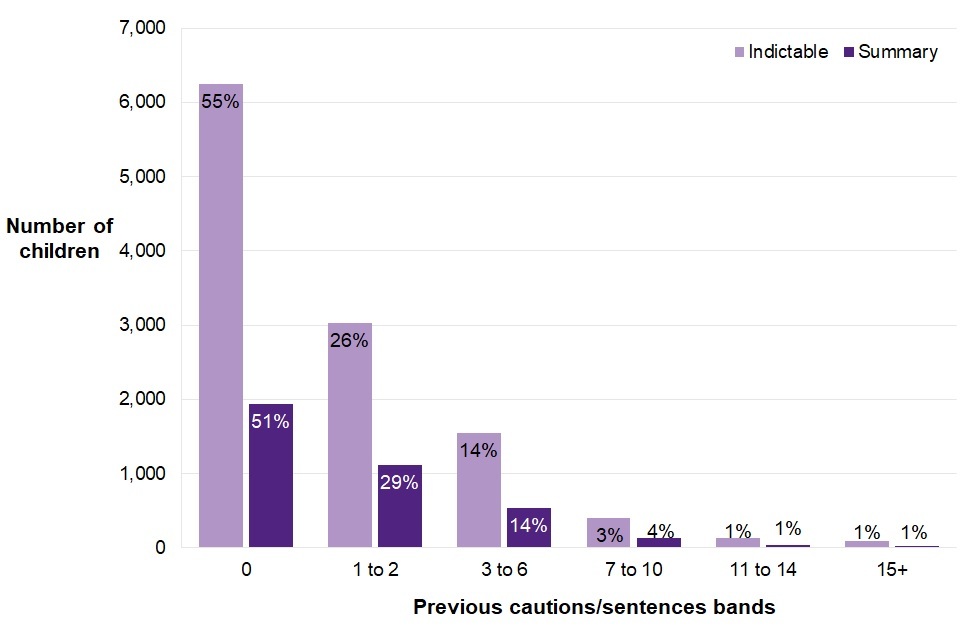
Figure 10.3 shows that more than half of children cautioned or sentenced had no previous cautions or sentences for both indictable and summary offences.
Supplementary Table 10.4 shows that while there were two thirds fewer summary offences as indictable offences (around 3,800 summary offences compared to around 11,500 indictable offences), the offending histories are quite similar despite indictable offences being more serious. 49% of children cautioned or sentenced for summary offences had a previous caution or sentence compared to 45% for indictable offences.
Figure 10.4: Proportion[footnote 33] of children cautioned or sentenced with no criminal history compared to those with 15+ previous cautions or sentences by type of disposal, England and Wales, year ending December 2021
| Disposal type | Number of cautions and sentences | Caution | Absolute discharge | Conditional discharge | Fine | Community sentence | Immediate custody | Other |
| No criminal history | 8,183 | 52% | 1% | 3% | 2% | 39% | 1% | 2% |
| 15+ cautions/sentences | 121 | 2% | 1% | 13% | 6% | 26% | 42% | 9% |
For children cautioned or sentenced with a criminal history of 15 or more previous cautions or sentences, the largest proportion were sentenced to immediate custody (42%). For those with no previous cautions or sentences, the majority received a caution (52%).
11. Comparisons with the adult system
In the year ending March 2022:
-
There were around 88,600 first time entrants (FTEs) to the Criminal Justice System, of which around 8,000 (9%) were children (aged 10 to 17). There have been year-on-year decreases for child FTEs over the last ten years, with the number of child FTEs decreasing by 78% in this time. In the latest year adult FTEs saw an increase, but overall numbers are still 56% lower than ten years ago.
-
Of all knife and offensive weapon offences committed in the year ending March 2022, 18% were committed by children. The number of offences involving a knife or offensive weapon committed by children fell by 2% in the last year, but increased by 6% for adults (18+).
-
The number of sentencing occasions (for people whose age was known) increased by 27% compared to the previous year, reflecting a recovery in the courts from the first year of the COVID-19 pandemic, with sentencing occasions for young adults and adults both increasing (by 25% and 27% respectively) while sentencing occasions for children continued to decrease (by 7%).
For the 30th June 2022 snapshot:
- The custodial population of children was at its lowest level in the last ten years, whilst the adult population increased by 4%. Children accounted for 1% of the overall custody population.
For the year ending March 2021 reoffending cohort:
- Children (aged 10 to 17) had the highest reoffending rate of the age groups at 31.2%, compared to 23.7% for young adults (aged 18 to 20) and 24.0% for adults (aged 21 and over).
This chapter looks at the comparisons at different stages of the criminal justice system between children aged 10 to 17, young adults aged 18 to 20 (where available) and adults (aged 21+).
11.1 Arrests by age group
Figure 11.1: Number and proportion of arrests by age group, England and Wales[footnote 34], years ending March 2012 to 2022
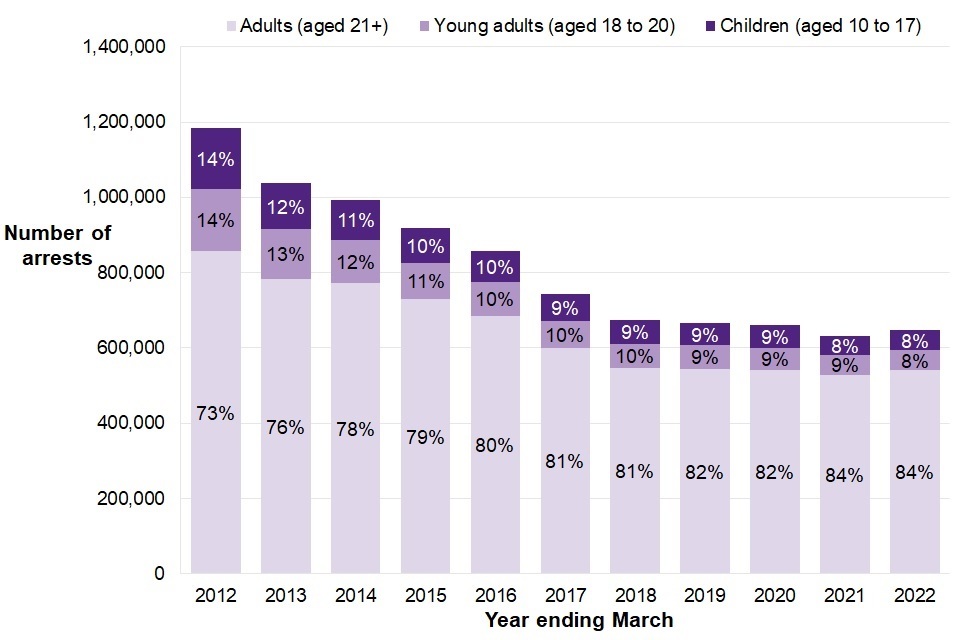
Figure 11.1 shows the number of arrests of each age group (adult, young adults, children) decreasing over time, and the proportions each age group form of the total changing – children formed 14% ten years ago and 8% in the latest year.
There were around 646,000 arrests (where age was known) in the year ending March 2022, which is a 2% increase from the previous year (around 631,000) and a 45% decrease compared with around 1.2 million arrests in the year ending March 2012.
Compared with the previous year, arrests of children increased by 7%, compared with a 3% decrease in the arrests of young adults and an increase of 3% for adults.
The overall number of arrests has generally been decreasing over the last ten years for all age groups. As the volumes of arrests have decreased at different rates across the three age groups, the proportions have changed over the course of the decade.
Children and young adults each accounted for 8% of overall arrests in the year ending March 2022, both falling from 14% ten years previously. In the same period, the proportion of adults arrested has increased from 73% to 84%.
11.2 First time entrants to the criminal justice system by age group
Figure 11.2: Number and proportion of first time entrants to the criminal justice system by age group, England and Wales, years ending March 2012 to 2022
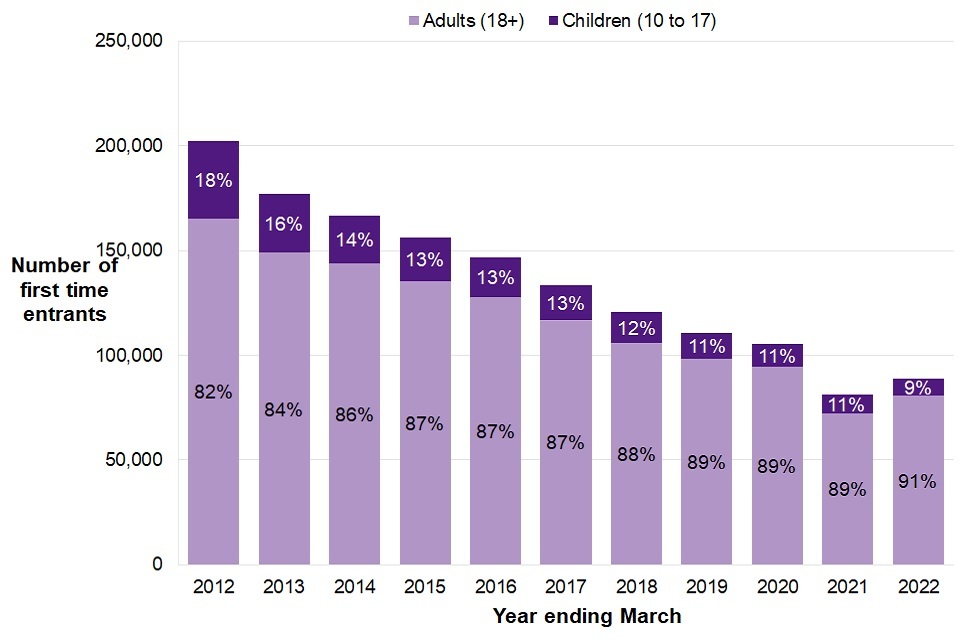
Figure 11.2 shows the number of first time entrants into the criminal justice system declining over time for both children and adults, with the proportion children comprise reducing from 18% ten years ago to 9% in the latest year.
In the year ending March 2022, there were around 88,600 first time entrants (FTEs) to the criminal justice system, of which 9% were children (aged 10 to 17). This proportion was the lowest in the time series and compares with 11% in the previous year and 18% in the year ending March 2012.
Following nine years of consecutive year-on-year decreases, there was a 9% increase in the total number of FTEs compared with the previous year though was lower than the year ending March 2020 which was consistent with the pre COVID-19 pandemic trend. The year ending March 2021 figure was the lowest on record and partly affected by the periods of restrictions during the first year of the COVID-19 pandemic where people’s behaviour changed, including less social contact, court closures and pauses to jury trials and court backlogs as a result of these. The increase in the latest year was driven solely by adults as child FTEs decreased by 10% compared with the previous year.
11.3 People sentenced at court by age group
Figure 11.3: Number and proportion of sentencing occasions of people by age group where age group was known[footnote 35], England and Wales, years ending March 2012 to 2022
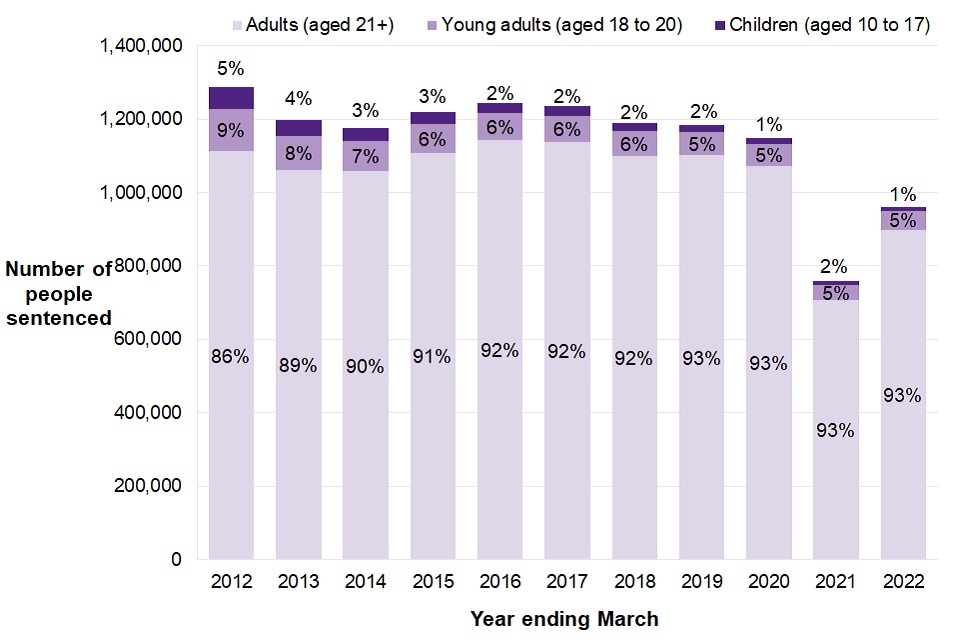
Figure 11.3 shows in the latest year children aged 10 to 17 only made up 1% of court sentencing occasions, which is a decrease of 4 percentage points since the year ending March 2012.
In the year ending March 2022, there were around 999,000 court sentencing occasions. Of these, around 11,400 (1%) were for children.
The number of sentencing occasions increased by 31% in the latest year, and has increased for young adults and adults but decreased for children:
-
The number of occasions when children (aged 10 to 17) were sentenced reduced by 7%;
-
The number of occasions when young adults (aged 18 to 20) were sentenced increased by 25%; and
-
The number of occasions when adults (aged 21+) were sentenced increased by 27%.
These figures reflect a recovery in the courts system following the first year of the COVID-19 pandemic, though this was the second lowest year in the time series for sentences given.
11.4 Custody population by age group
Figure 11.4: Number and proportion of people in custody by age groups, England and Wales, 30th June 2012 to 2022
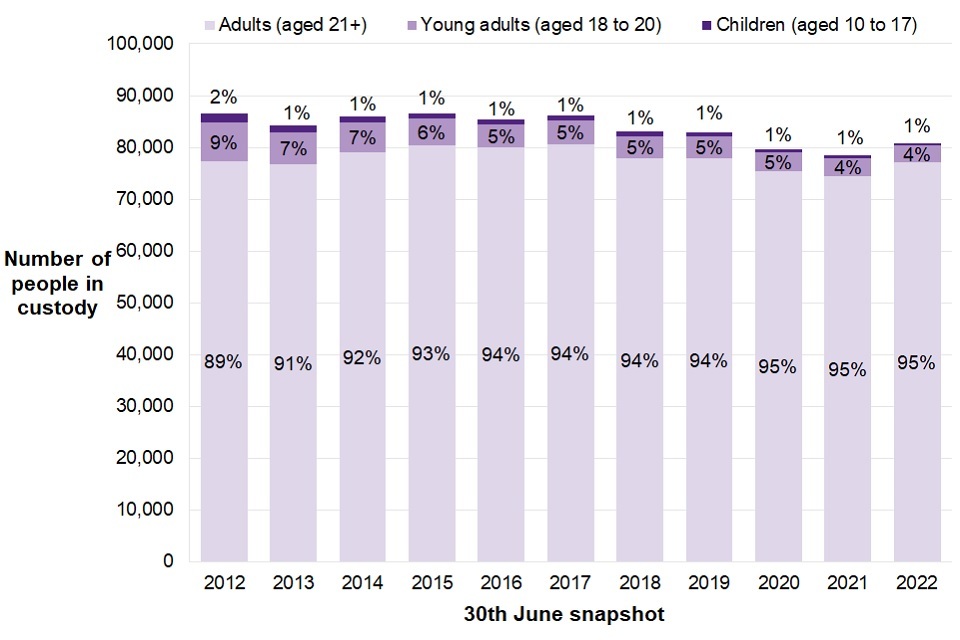
Figure 11.4 shows that in the latest year children aged 10-17 made up 1% of the custodial population across all age groups, compared to 4% for young adults and 95% of adults. These proportions have remained stable across the last 10 years.
On the 30th June 2022 there were around 80,800 people in custody. Children accounted for 1% (around 440) of the custodial population while young adults (aged 18 to 20) accounted for 4% (around 3,200) and adults (aged 21+) accounted for 95% (around 77,100). These proportions have remained relatively stable over the last ten years.
The custodial populations for children and young adults are at their lowest levels in the last ten years, decreasing by 12% and 8% respectively compared with the previous year. The custodial population for children has decreased in each of the last ten years and the custodial population for young adults has decreased in nine of the last ten years. For adults aged 21 and over, the custody population is back to pre-pandemic levels, increasing by 4% compared with the previous year.
11.5 Knife and offensive weapon offences resulting in a caution or sentence by age group
Figure 11.5: Number and proportion of knife or offensive weapon offences resulting in a caution or sentence, by age group, England and Wales, years ending March 2012 to 2022
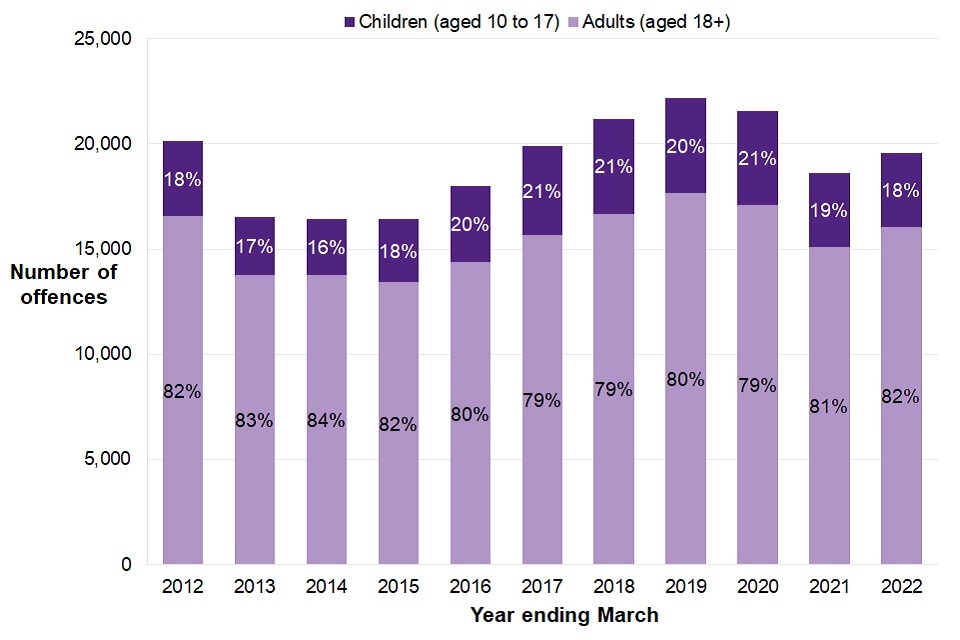
Figure 11.5 shows that in the latest year children made up 18% of knife or offensive weapon offences resulting in a caution or sentence, which is the same proportion as ten years ago despite fluctuations in between.
In the latest year, children were involved in around 3,500 knife or offensive weapon offences, a fall of 2% from the previous year. Adults were involved in around 16,100 knife or offensive weapon offences, an increase of 6% from the previous year.
11.6 Reoffending
Figure 11.6: Annual reoffending rates by age group, England and Wales, years ending March 2011 to 2021
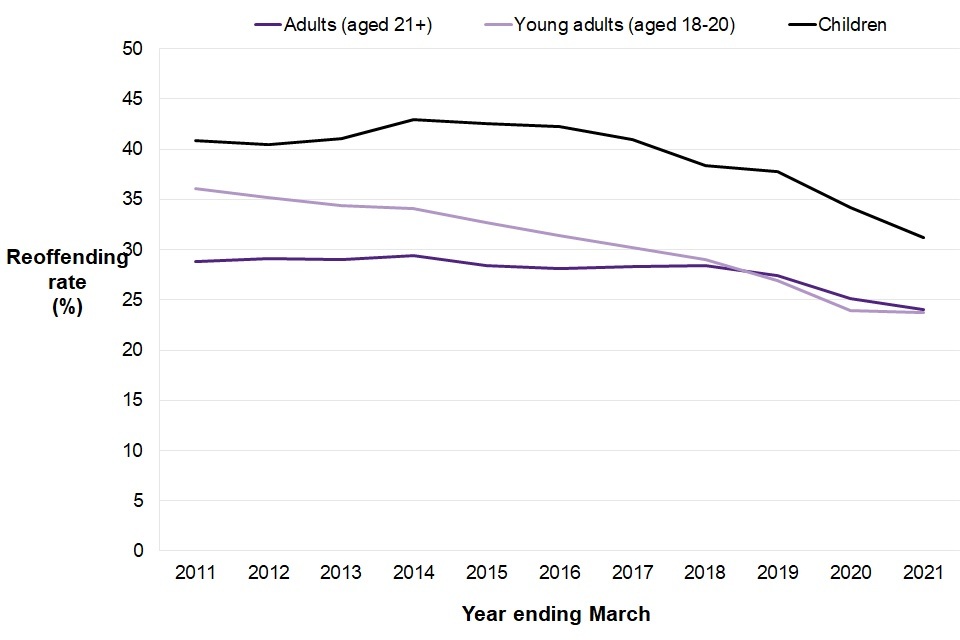
Figure 11.6 shows that the reoffending rates of children (aged 10 to 17) and young adults (aged 18 to 20) have diverged over the last ten years, with children having the highest reoffending rate of all age groups.
For the aggregated cohort in the year ending March 2021, children (aged 10 to 17) had the highest reoffending rate of the age groups, at 31.2% compared to 23.7% for young adults (aged 18 to 20) and 24.0% for adults (aged 21+).
Figure 11.6 shows that the reoffending rates of children (aged 10 to 17) and young adults (aged 18 to 20) have diverged over the last ten years. For the year ending March 2011 cohorts there was a difference of 4.8 percentage points between the reoffending rate for the two groups, compared to 7.5 percentage points for the year ending March 2021 cohorts.
The reoffending rate for young adults has followed a general downward trend over the last ten years and is now the lowest reoffending rate of the three age groups.
The reoffending rates for children (aged 10 to 17) and young adults (aged 18 to 20) have seen year on year decreases since the year ending March 2015.
The adult reoffending rate of 24.0% is the lowest seen in the ten year period for that age group, with decreases seen in each of the last three years.
The extent of the reoffending rate decreases for all three age groups are likely in part due to the impacts of limits on court activity in the periods of restrictions during the COVID-19 pandemic and the subsequent backlogs that meant some reoffences weren’t counted. This is because they were not dealt with at court during the one-year follow-up period or the additional six-month waiting period to allow for offences to be proven in court.
Further information
Most of the figures in this report have been drawn from administrative IT systems, which, as with any large scale recording system, are subject to possible errors with data entry and processing and may be subject to change over time. Steps are taken to improve the completeness and accuracy of this information each year.
Other figures have been taken from official published statistics, which may be National Statistics. Further details on the sources of information are given in the Guide to Youth Justice Statistics.
Accompanying files
As well as this bulletin, the following products are published as part of this release:
-
A Guide to Youth Justice Statistics providing further information on the data included in this publication and how these data are collected and processed. This includes a glossary of the terms used in this bulletin;
-
a set of additional annexes;
-
an Infographic, covering the main points;
-
a set of Supplementary Tables, covering each section of this bulletin;
-
a set of open explorable data; and
-
a set of maps showing local level data.
National Statistics status
National Statistics status means that official statistics meet the highest standards of trustworthiness, quality and public value.
All official statistics should comply with all aspects of the Code of Practice for Statistics. They are awarded National Statistics status following an assessment by the Authority’s regulatory arm. The Authority considers whether the statistics meet the highest standards of Code compliance, including the value they add to public decisions and debate.
It is the Youth Justice Board’s responsibility to maintain compliance with the standards expected for National Statistics. If concerns arise about whether these statistics are still meeting the appropriate standards, these will be discussed promptly with the Authority. National Statistics status can be removed at any point when the highest standards are not maintained and reinstated when standards are restored.
Contact
Press enquiries should be directed to the Ministry of Justice press office:
Tel: 020 3334 3536
Email: newsdesk@justice.gov.uk
Other enquiries about these statistics should be directed to:
Rhian Manley
Head of Statistics and Analysis
Youth Justice Board
General information about the official statistics system of the UK is available from: www.statisticsauthority.gov.uk
Next update: 25 January 2024
URL: www.gov.uk/government/collections/youth-justice-statistics
© Crown copyright
Produced by the Youth Justice Board for England and Wales
-
Lancashire could not supply data for the years ending March 2018 and 2019.Data have been removed for this force for all years so valid comparisons can be made. ↩
-
Ethnicity was unknown for 19% of stop and searches of children aged 10 to 17 in the year ending March 2022. ↩
-
Proportions may not sum to 100% due to rounding. ↩
-
Notifiable offences are those offences which require the police to record an incident as a crime and report the occurrence to the Home Office. ↩
-
Includes children recorded as receiving a youth caution, and reprimands and warnings which were the available out of court disposals before youth cautions were introduced in 2013. ↩
-
Ethnicity is police officer identified. There is not a Mixed ethnicity group in officer identified ethnicities, so caution should be used if comparing with data using self-identified ethnicities. ↩
-
Proportions are based on where sex is known. In the year ending March 2022, sex was unknown for 2% (around 140) of child FTEs. ↩
-
Based on ONS 2021 mid-year population estimates ↩
-
Based on the numbers of child FTEs by age on date of caution or sentence. ↩
-
Proportions are based on where ethnicity is known. In the year ending March 2022, sex was unknown for 15% (around 1,200) of child FTEs. ↩
-
Where sex is known. Sex was unknown for around 470 (3%) of children cautioned or sentenced. ↩
-
Proportions are calculated on where ethnicity was known. In the year ending March 2022, ethnicity was unknown for 4% of children who received a youth caution or sentence. ↩
-
Acquisitive crime is defined as an offence where the offender derives material gain from the crime. ↩
-
Proportions are based on where the demographic characteristics were known. In the year ending March 2022, the ethnicity of the child was not known for 3% of the proven offences, and the sex of the child was not known for 3% of the proven offences. ↩
-
A ten year comparison is not available. In December 2012 offences involving threatening with a knife or offensive weapon in a public place or in a school premises were introduced and included from this point on. ↩
-
Where ethnicity is known. In the year ending March 2022, ethnicity was unknown in 29% of sentencing occasions. ↩
-
Youth Courts are categorised as magistrates’ courts in the data. This will impact the figures for indictable only defendants at the magistrates’ court which will include a high volume of children. ↩
-
Indictable offences include triable either way offences. ↩
-
Data on summary level offences are not included as many defendants are not required to be present when sentenced so data on ethnicity is limited. ↩
-
Figures for ethnicity are categorised using the 5+1 self-identified classification. Data based on the 18+1 classification used in the 2011 Census Ethnicity is only able to be shown for indictable offences from year ending March 2010 onwards due to improvements in data quality, in magistrates’ courts associated with the introduction of the LIBRA case management system at that time. The not stated category includes all others for whom ethnicity information is not available, either because they have chosen not to state their ethnicity or because no information has been recorded. ↩
-
Proportions are calculated where ethnicity is known. In the year ending March 2022, ethnicity was unknown for 29% of children sentenced for indictable offences at all courts. ↩
-
Excludes life and indeterminate sentences. ↩
-
Where ethnicity was known. In the year ending March 2022, the ethnicity of children was unknown for 4% of remand episodes. ↩
-
Proportions are calculated where ethnicity was known. In the year ending March 2022, the ethnicity was unknown for 3% of the monthly average remand population. ↩
-
At magistrates’ court, outcomes include proceedings discontinued, withdrawn, discharged or dismissed. At Crown court, outcomes include acquitted and not tried. ↩
-
Offence group is the offence group for the most serious offence for the most precedent legal basis ↩
-
Proportions are calculated where ethnicity is known. The ethnicity was unknown for 2% of the youth custody population in the year ending March 2022. ↩
-
Proportions are based on where distance was known. In the year ending March 2022, the distance from home was unknown for 2% of children in the youth secure estate. ↩
-
Proportions may not sum to 100% due to rounding. ↩
-
Proportions may not sum to 100% due to rounding. ↩
-
Proven reoffending by children entering the cohort between April 2020 and March 2021. The focus in this chapter is on the annual data based on the aggregate of the four quarterly offender cohorts. ↩
-
This figure is based on children for whom ethnicity is known. In the aggregated cohort for the year ending March 2021, ethnicity was unknown for 8% of children who entered the cohort. ↩
-
Proportions may not sum to 100% due to rounding. ↩
-
Lancashire Police could not supply data for the years ending March 2018 and March 2019. Data has been removed for this force for all years so valid comparisons can be made. ↩
-
Only sentencing occasions where age group was known are included. In the year ending March 2022, age group was unknown in 4% of sentencing occasions. ↩