Universal Credit deductions statistics June 2025 to May 2026
Published 18 August 2026
Applies to England, Scotland and Wales

© Crown copyright 2026
This publication is licensed under the terms of the Open Government Licence v3.0 except where otherwise stated. To view this licence, visit nationalarchives.gov.uk/doc/open-government-licence/version/3 or write to the Information Policy Team, The National Archives, Kew, London TW9 4DU, or email: psi@nationalarchives.gov.uk.
Where we have identified any third party copyright information you will need to obtain permission from the copyright holders concerned.
This publication is available at https://www.gov.uk/government/statistics/universal-credit-quarterly-statistics-29-april-2013-to-14-may-2026/universal-credit-deductions-statistics-june-2025-to-may-2026
This release includes statistics on:
-
the number of households with deductions from their Universal Credit (UC) entitlement
-
the average amount deducted in total, and for each of the three main deduction types: advances, third-party and government deductions (see the “What you need to know” section for more information on types of deduction)
-
the distribution of the proportion of the UC standard allowance deducted
-
the combination of deductions applied to UC households
Where appropriate, these figures are broken down by region, local authority and parliamentary constituency. More detailed breakdowns are available in the supplementary tables.
1. Main stories
The headline statistics are:
-
approximately 3.3 million UC households (47% of all UC households) had one or more deductions taken from their UC entitlement in May 2026. North East England has the largest proportion of UC households with one or more deductions, at 52%. South West England has the lowest proportion, at 42%
-
the average amount deducted was £53 in May 2026
-
in May 2026, around 21% of UC households had deductions capped at 15% of their Universal Credit standard allowance. A further 2% had deductions taken over the cap to help prevent eviction or disconnection of their energy supply or to ensure child maintenance obligations are met
2. What you need to know
A “deduction” refers to an amount of money taken off the monthly UC entitlement amount towards reducing a debt owed to the government or other organisation.[footnote 1] Deductions are subtracted from the monthly UC entitlement after any adjustments have been made to account for the household’s financial circumstances e.g. earnings.
There are 3 main types of deduction:
-
advances – deductions taken towards the repayment of a UC advance payment. The four types of UC advances are: new claim, benefit transfer, change of circumstances and budgeting[footnote 2]
-
third-party deductions (TPD) – deductions for money owed by the UC household to organisations such as energy companies or landlords
-
government deductions – deductions for money owed to government organisations such as the Department for Work and Pensions (DWP) or HM Revenue & Customs (HMRC)
The amount deducted for each debt depends on the type of debt and combination of debts owed by the household. In most cases the maximum amount that can be deducted from a UC household is capped at 15% of the monthly UC standard allowance. There is a priority order of deductions, starting with advances, followed by third-party debts like rent and utility arrears, then government debts such as social fund loans and tax credit overpayments. Any deductions that would push the total amount deducted above the 15% overall deduction cap are not taken but are addressed when there is room within the cap. Therefore, for households with multiple debt types, deductions for debts further down the priority order are more likely to push the total amount over the cap, and so would not be taken.
The overall deduction cap can be exceeded only for ‘last resort deductions’, which are child maintenance payments, housing cost arrears (rent and/or service charges) and gas and electricity arrears. This helps ensure child maintenance obligations are met, prevents eviction, and avoids disconnection of essential utilities.[footnote 3]
3. Households with deductions from their UC entitlement
Figure 1: Number and proportion of households with one or more deductions from their monthly UC entitlement, June 2025 to May 2026
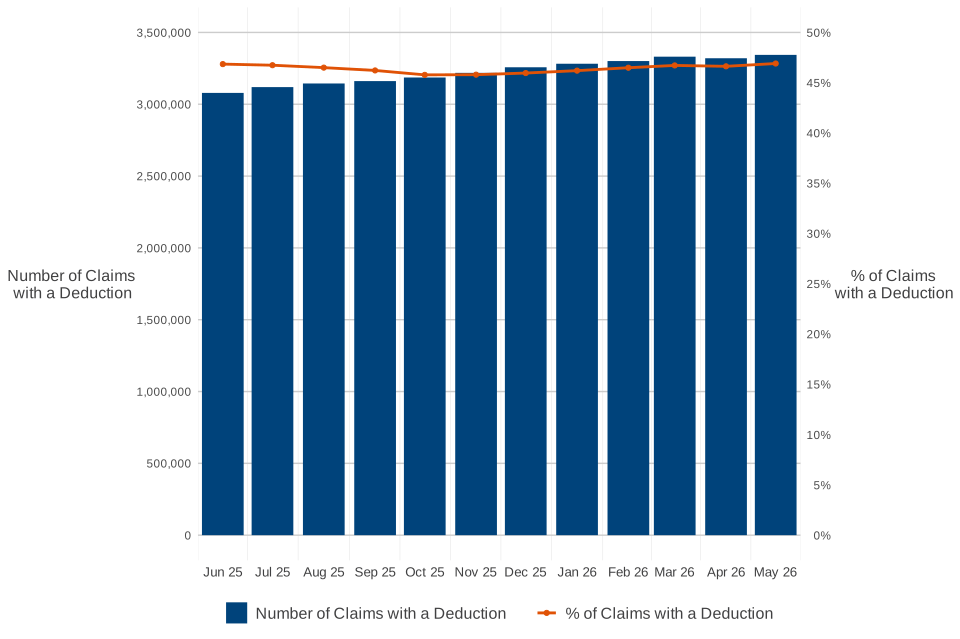
3.3 million UC households had one or more deductions taken from their UC entitlement in May 2026. Whilst this is 200,000 more households than had a deduction in June 2025, the proportion of all UC households with a deduction has been relatively stable over the whole period. This is because the UC household caseload has increased over this period but the likelihood of any household having a deduction has remained the same.
Figure 2: Distribution of total deduction amount relative to the standard allowance, June 2025 to May 2026
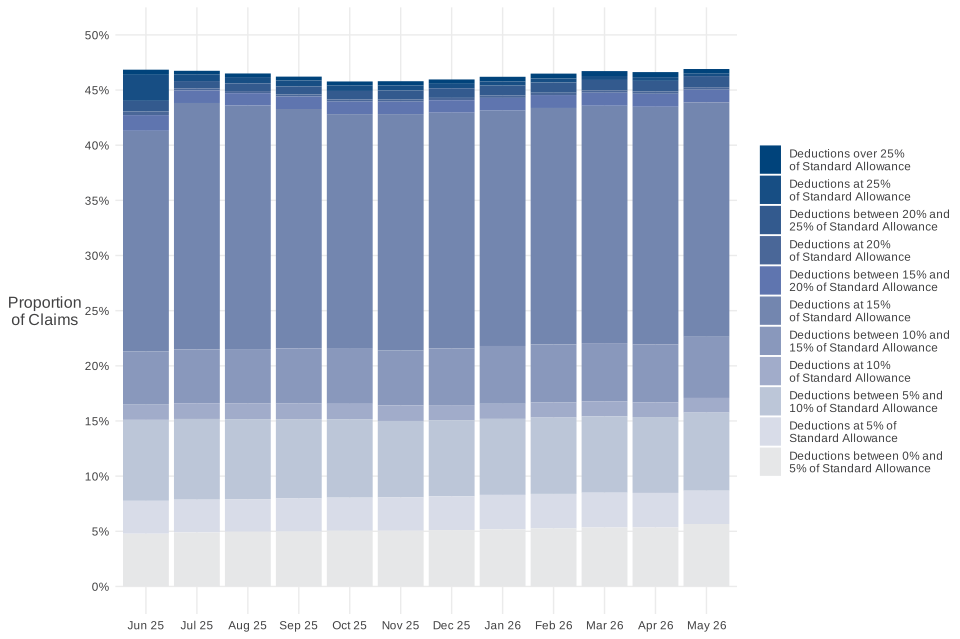
21% of UC households had monthly deductions capped at 15% of Standard Allowance (SA) in May 2026 – these proportions have not changed substantially over the reporting period. A further 2% had monthly deductions above the 15% cap. The 15% cap can be exceeded only for certain last-resort deductions, including child maintenance, housing-cost arrears where there is a risk of eviction, and gas or electricity arrears where there is a risk of disconnection.
4. Deductions by type of deduction
Figure 3: Proportion of UC households with each deduction type
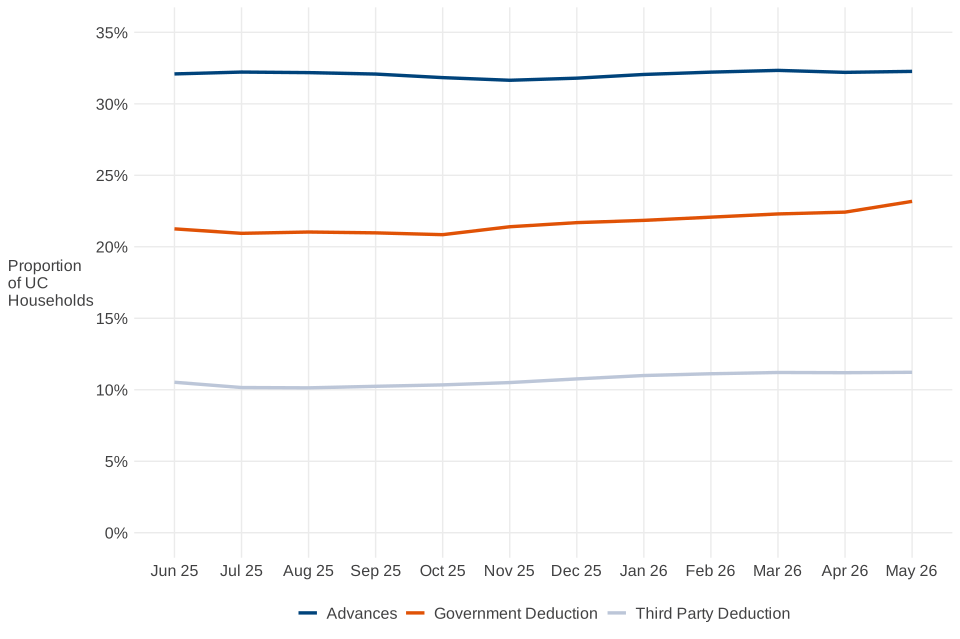
The proportion of UC households with each main deduction type is stable over time. Advances are the most common, with 32% of UC households repaying advance debt in May 2026. Government deductions are the second most common, at 23%, followed by third-party deductions at 11%.
5. Mean amount deducted per UC household
Figure 4: Average (mean) monthly UC household deduction by deduction type
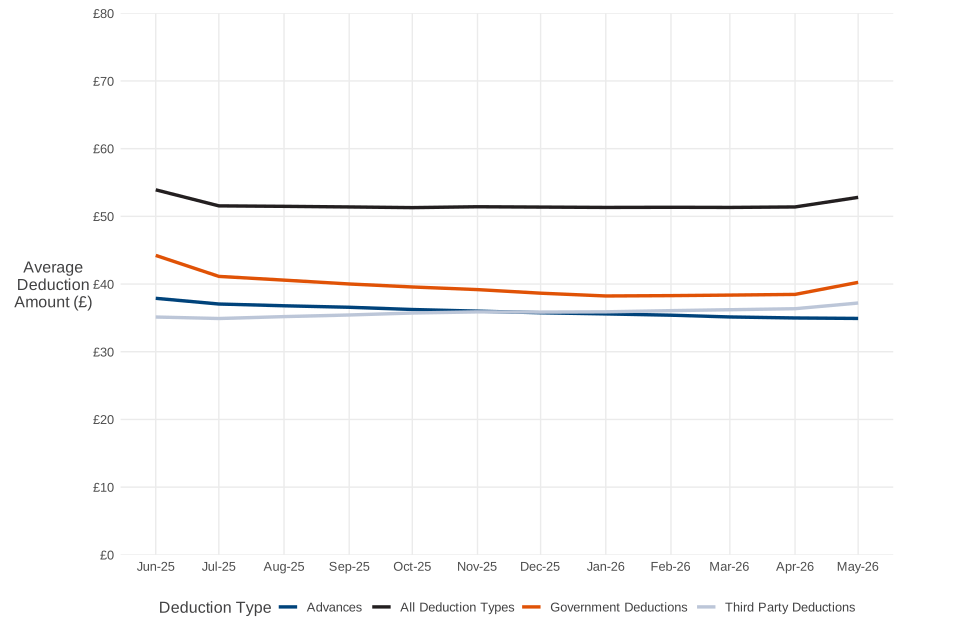
The mean total deduction amount for UC households increased from £51 in April 2026 to £53 in May 2026. This is due to the annual uprating of the standard allowance that happened in April 2026. Since most deductions are set at a fixed percentage of the standard allowance, as the standard allowance increases, the deduction amount also increases.
In May 2026, the mean deduction amount for government deductions was £40, for advances it was £35 and for third-party deductions it was £37.
6. Combinations of deductions
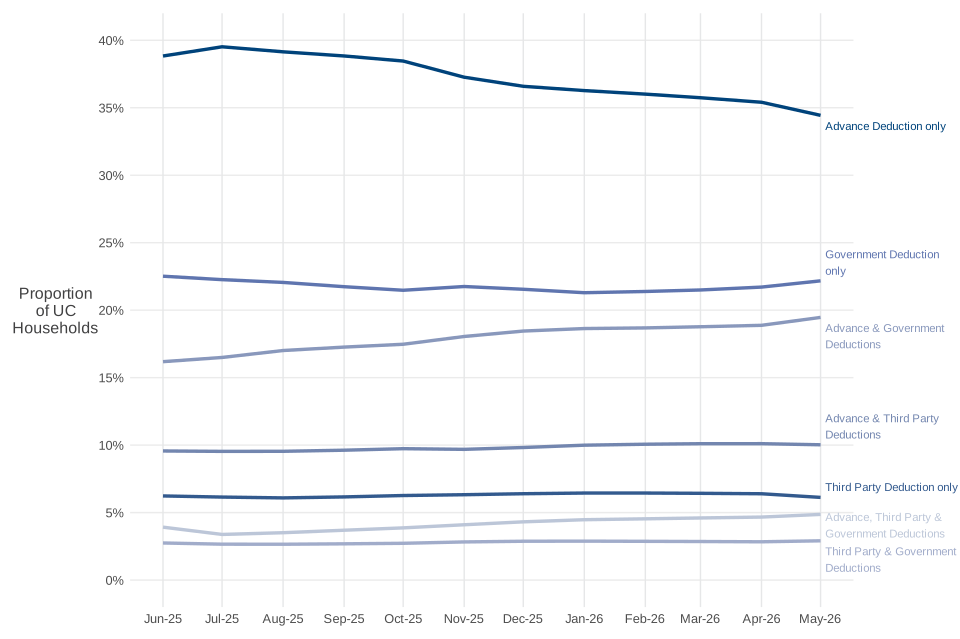
Of all the UC households with a deduction, around 34% have deductions for advances only in May 2026 – the most common deduction type. There has been some variation in the trends in deduction combinations over the past year:
- a small increase in the proportion of households with:
- a combination of advance deductions and government deductions
- a combination of advance, government and third-party deductions
- small reductions in the proportion of households with:
- advance deductions only
The annual uprating of the standard allowance happened in April 2026. Since most deductions are set at a fixed percentage of the standard allowance, as the standard allowance increases, the deduction amount also increases. However, deduction amounts for advances are set at a fixed monetary amount agreed with the claimant(s) when the advance is taken out. Therefore, households with advance deductions may then be able to make repayments towards other debts that will now fit within the standard allowance cap, which potentially leads to these debts being paid off sooner.
Figure 5: Proportion of UC households with a deduction by specified combinations of deductions
7. Regional breakdown of deductions
The table below provides the regional breakdown of UC households, the number and proportion of households with one or more deductions and the total and average amount deducted.
Around 47% of all Universal Credit households in Great Britain had one or more deductions taken from their UC entitlement in May 2026. The mean monthly deduction amount was £53.
The table shows that North East England has the largest proportion, excluding unknowns, of UC households with one or more deductions, at 52%. Whereas South West England has the lowest proportion, excluding unknowns, at 42%. UC households with a deduction have similar average monthly deduction amounts across Great Britain, at around £53. Further breakdowns by local authority and parliamentary constituency are available in the accompanying supplementary data tables.
Figure 6: Regional breakdown of UC households with deductions in May 2026
| May 2026 | UC Households with one or more deductions | Proportion of UC households with one or more deductions | Total amount deducted | Average monthly deduction per household |
|---|---|---|---|---|
| All | 3,300,000 | 47% | £177,000,000 | £53 |
| North East | 180,000 | 52% | £10,000,000 | £54 |
| North West | 480,000 | 51% | £26,000,000 | £54 |
| Yorkshire and The Humber | 320,000 | 49% | £17,000,000 | £52 |
| East Midlands | 230,000 | 46% | £12,000,000 | £52 |
| West Midlands | 340,000 | 47% | £18,000,000 | £52 |
| East of England | 250,000 | 44% | £13,000,000 | £53 |
| London | 500,000 | 45% | £27,000,000 | £54 |
| South East | 340,000 | 43% | £18,000,000 | £52 |
| South West | 210,000 | 42% | £11,000,000 | £52 |
| Wales | 180,000 | 49% | £9,500,000 | £52 |
| Scotland | 310,000 | 51% | £16,000,000 | £52 |
| Unknown | 180 | 58% | £10,000 | £53 |
8. About these statistics
These statistics have been classed as official statistics in development.
All figures in this publication are derived from Universal Credit administrative data.
Figures are provisional and may be subject to minor change in subsequent releases. This is partly because a household’s UC entitlement, and therefore appropriate deductions, can be altered retrospectively e.g. if evidence is received late. This means that the number of households with deductions for any given month may be revised in subsequent releases.
All figures are for Great Britain only. Figures in tables are rounded according to the following convention:
| Range | Rounded to the nearest | |
|---|---|---|
| 0 to 1,000 | 10 | |
| 1,001 to 10,000 | 100 | |
| 10,001 to 100,000 | 1,000 | |
| 100,001 to 1,000,000 | 10,000 | |
| 1,000,001 to 10,000,000 | 100,000 | |
| Over 10,000,000 | 1,000,000 |
In the case of broad ranges, a single convention is used. Percentages are rounded to the nearest 1% and average monetary amounts have been rounded to the nearest £1.
Figures in charts are based on unrounded numbers. Therefore, charts may show trends not visible in the supplementary tables.
Notes
This bulletin counts households by the month their UC payment was received, whereas the main Universal Credit statistics count households whose assessment period spans a particular date in each month.
When information is given for regions of Great Britain, this is derived from the claimants’ residential address. Not all claimants have a valid address listed, which means that a small number of households have “Unknown” region information.
For the full data, see the supplementary data tables published alongside this release.
The following changes to deductions policy have been implemented:
-
December 2024 – Increasing the maximum repayment period for budgeting advances from 12 months to 24 months[footnote 4]
-
April 2025 – The Fair Repayment Rate, which caps the overall deduction rate applied to deductions from Universal Credit (UC) at 15% of the UC claimant’s standard allowance[footnote 5]
9. Further information and feedback
Lead Statistician: Owen Magrath
Analysts: Thomas Milner, Ayaan Halim
Feedback on the content of these statistics and any non-media enquiries should be directed to ucad.briefinganalysis@dwp.gov.uk
For media enquiries on these statistics, please contact the DWP press office.
Note that these contact details cannot provide any information or assistance with claiming Universal Credit.
-
Fraud penalties and benefit sanctions are considered to be reductions to the UC entitlement and are excluded from these statistics. ↩
-
More information on Universal Credit advances ↩
-
More information on Universal Credit deduction types ↩
-
More information on the Spring Budget 2024 changes ↩
-
More information on the Autumn Budget 2024 changes ↩