Universal Credit childcare element statistics to May 2026
Published 18 August 2026
Applies to England, Scotland and Wales

© Crown copyright 2026
This publication is licensed under the terms of the Open Government Licence v3.0 except where otherwise stated. To view this licence, visit nationalarchives.gov.uk/doc/open-government-licence/version/3 or write to the Information Policy Team, The National Archives, Kew, London TW9 4DU, or email: psi@nationalarchives.gov.uk.
Where we have identified any third party copyright information you will need to obtain permission from the copyright holders concerned.
This publication is available at https://www.gov.uk/government/statistics/universal-credit-quarterly-statistics-29-april-2013-to-14-may-2026/universal-credit-childcare-element-statistics-to-may-2026
1. Main stories
The main stories are:
-
in May 2026, 164,000 households received the Universal Credit (UC) childcare element. The number of UC households receiving childcare element has decreased by 15% when comparing May 2025 and May 2026. This is equivalent to an approximately 2ppt fall in the proportion of households with children in which all claimants had earnings who were in receipt of UC childcare element. Figures for the latest recorded month are generally lower since households may report childcare later
-
since July 2025, there has been a steady decline in the number of households receiving childcare element (except for the usual seasonal peaks in September/October 2025). Since September 2025, the Department for Education (DfE) has expanded its childcare offer so eligible households can access 30 hours of free childcare per week for children aged 9 months up to school age. We don’t know for certain whether this expansion is linked to the decline in households receiving UC childcare element, however the drop is driven by households with a youngest child aged four or less
-
in May 2026, of the 164,000 households receiving childcare element, 134,000 were single households and 30,000 were couple households
-
The average amount of childcare element received was £400 in May 2026, a 3% decrease from May 2025. This was higher in London (£680)
-
in May 2026, 2% of childcare element households received the maximum amount of childcare element available
-
in May 2026, 27% of households on Universal Credit with pre-school children and in which all claimants had earnings received the childcare element. For households on UC whose youngest child was primary school age, the proportion was lower (12%), and for households whose youngest child was secondary school age, it was lower still (1%). Overall, 13% of households with children and in which all claimants had earnings received the UC childcare element in May 2026
2. What you need to know
To qualify for the childcare element, the claimant (or, where a couple is claiming, both claimants), must usually be in paid work or have accepted an offer of paid work and pay for childcare for the relevant child or young person.
UC households can also make use of other types of childcare, which do not require the childcare element. These include the wider government offer of free childcare for pre-school children.
UC childcare maximum amounts
Universal Credit (UC) reimburses up to 85% of eligible childcare costs, up to a maximum amount. In May 2026, the maximum was £1,071.09 for one child and £1,836.16 for two or more children.
The maximum amount of childcare has changed over time and is shown in the following table.
| Period | One child in childcare | Two or more children in childcare |
|---|---|---|
| Before June 2023 | £646.35 | £1,108.04 |
| From June 2023 | £950.92 | £1,630.15 |
| From April 2024 | £1,014.63 | £1,739.37 |
| From April 2025 | £1,031.88 | £1,768.94 |
| From April 2026 | £1,071.09 | £1,836.16 |
Read further information on the childcare offer for UC claimants.
3. Households receiving the childcare element
Chart 1: Universal Credit households receiving childcare element and children in childcare paid for by the childcare element, May 2024 to May 2026
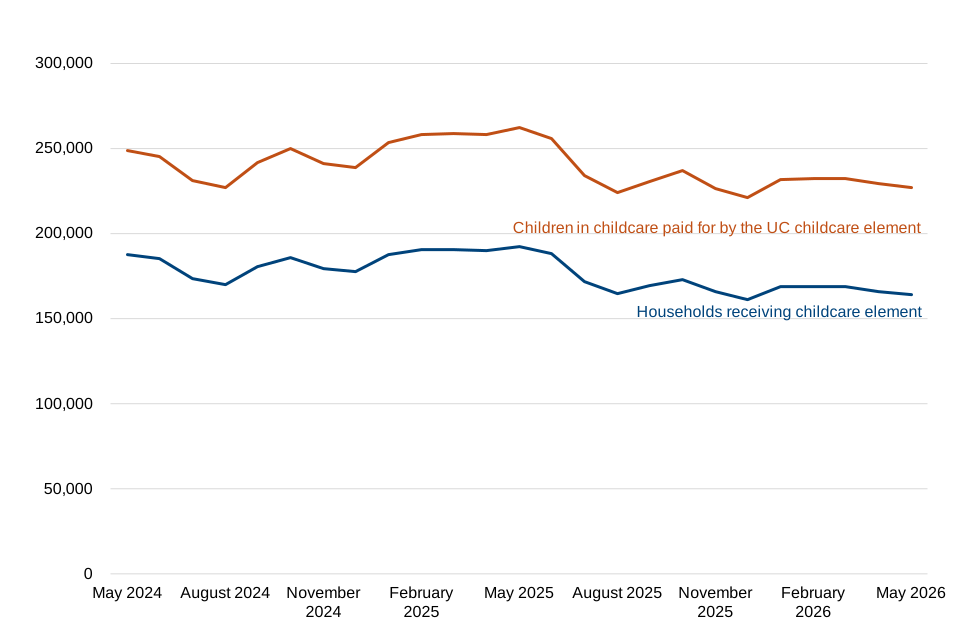
In May 2026, 164,000 households received the childcare element, of which 134,000 were single households and 30,000 were couples. The number of UC households receiving childcare element has decreased by 15% when comparing May 2025 and May 2026.
The number of households receiving the childcare element appears to have fallen over the course of the last year, with the steepest drop among households with a youngest child aged four or under. This is unlikely to be a seasonal effect as the same period a year earlier shows no similar pattern.
In May 2026, 227,000 children were in childcare paid for by childcare element.
Figures for the latest recorded month are generally lower than for previous months, since households may report childcare later. In summer and winter holiday periods, the number of households receiving the childcare element falls slightly, which is likely because households use childcare less during these periods.
Chart 2: Universal Credit households receiving childcare element, by age of youngest child, May 2026
| Age of youngest child | Households receiving childcare element |
|---|---|
| 0 | 7,000 |
| 1 | 17,200 |
| 2 | 23,100 |
| 3 | 24,400 |
| 4 | 21,700 |
| 5 | 11,500 |
| 6 | 11,600 |
| 7 | 11,600 |
| 8 | 11,000 |
| 9 | 9,800 |
| 10 | 7,300 |
| 11 | 4,000 |
| 12 | 1,300 |
| 13 | 1,000 |
| 14 | 800 |
| 15 | 600 |
| 16 | 300 |
44% of households receiving the childcare element have a youngest child aged 3 years or younger.
For households where the youngest child is over 3 years old, the number of households receiving the childcare element tends to decrease as the age of the youngest child increases.
In May 2026, households with a youngest child aged 3 were the largest group receiving the UC childcare element.
4. Average amount of childcare element
Chart 3: Mean amount of Universal Credit childcare element, May 2024 to May 2026
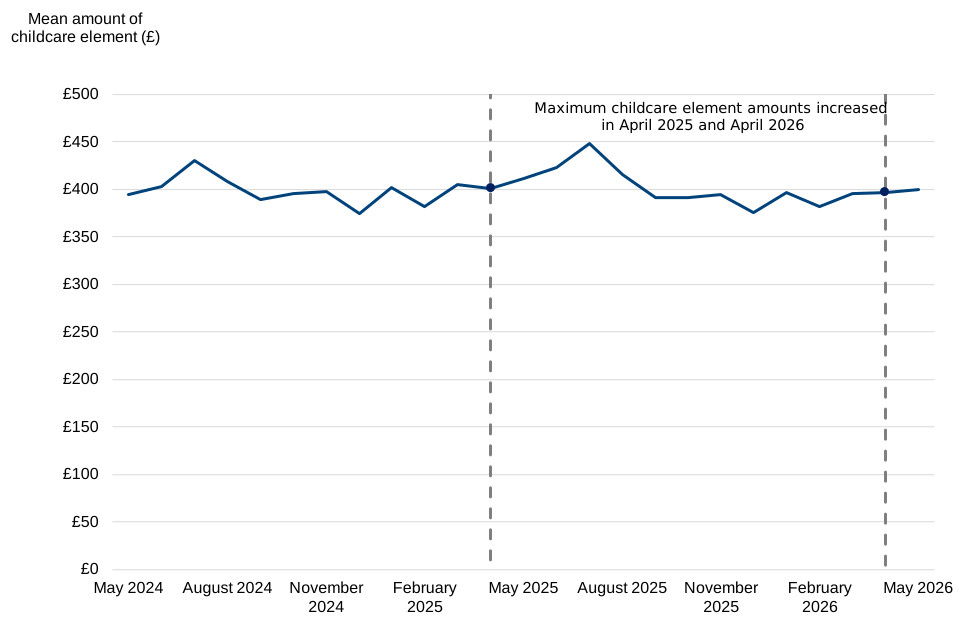
In May 2026, the average (mean) amount of childcare element was £400, a 3% decrease from May 2025.
Chart 4: Distribution of Universal Credit childcare element amounts, May 2026
| Childcare element band | Number of households receiving childcare element |
|---|---|
| 1-100 | 41,900 |
| 101-200 | 32,300 |
| 201-300 | 20,800 |
| 301-400 | 13,500 |
| 401-500 | 9,900 |
| 501-600 | 7,900 |
| 601-700 | 6,200 |
| 701-800 | 5,100 |
| 801-900 | 4,800 |
| 901-1000 | 3,400 |
| 1001-1100 | 5,100 |
| 1101-1200 | 1,800 |
| 1201-1300 | 1,500 |
| 1301-1400 | 1,600 |
| 1401-1500 | 1,500 |
| 1501-1600 | 1,500 |
| 1601-1700 | 2,400 |
| 1701-1800 | 1,200 |
| 1801-1900 | 1,600 |
In May 2026, over half of households (58%) receiving the childcare element received £300 or less.
Chart 5: Mean Universal Credit childcare element amount by age of youngest child, May 2026
| Age of youngest child | Mean amount of childcare element (£) |
|---|---|
| 0 | £550 |
| 1 | £520 |
| 2 | £480 |
| 3 | £430 |
| 4 | £390 |
| 5 | £320 |
| 6 | £290 |
| 7 | £280 |
| 8 | £290 |
| 9 | £300 |
| 10 | £300 |
| 11 | £390 |
| 12 | £740 |
| 13 | £770 |
| 14 | £700 |
| 15 | £600 |
| 16 | £570 |
The average amount of childcare element varied with the age of the youngest child in the household. In May 2026, the average amount generally decreased as the age of the youngest child increased from 0 to 7 years, before increasing for households with older children. The highest average amounts were for households whose youngest child was aged 12 to 14. However, these age groups accounted for a relatively small proportion of households receiving the childcare element.
Chart 6: Mean Universal Credit childcare element amount by region, May 2026, percent increases since May 2025
| Region | Mean amount of childcare element (£) | % increase compared to May 2025 |
|---|---|---|
| East Midlands | £270 | -16% |
| East of England | £330 | -9% |
| London | £680 | 2% |
| North East | £330 | -8% |
| North West | £370 | -8% |
| Scotland | £400 | 3% |
| South East | £300 | -10% |
| South West | £230 | -13% |
| Wales | £390 | 0% |
| West Midlands | £360 | -6% |
| Yorkshire and The Humber | £320 | -6% |
The average amount of childcare element was lowest for households in South West England (£230) and highest for households in London (£680). Compared to May 2025, the average amount of childcare element slightly increased in London (by 2%) and Scotland (by 3%) and stayed the same in Wales. The average amount of childcare element decreased in all other regions, particularly in South West England (by 13%), East Midlands (by 16%) and South East England (by 10%). In Great Britain as a whole, the average amount of childcare element decreased by 3%. The average amount of childcare element for Great Britain excluding London decreased by 7%.
There is more variation at a lower geographical level. For example, the mean amount of childcare element in the parliamentary constituency of Salford is over twice as much (£880, see Table 13, supplementary table) as the North West region as a whole (£370) and six times as much as the parliamentary constituency in the North West receiving the least amount, Westmorland and Lonsdale (£160).
5. Households receiving maximum childcare element amounts
Chart 7: Universal Credit households receiving the maximum amount of childcare element as a proportion of households receiving childcare element, by month, May 2024 to May 2026
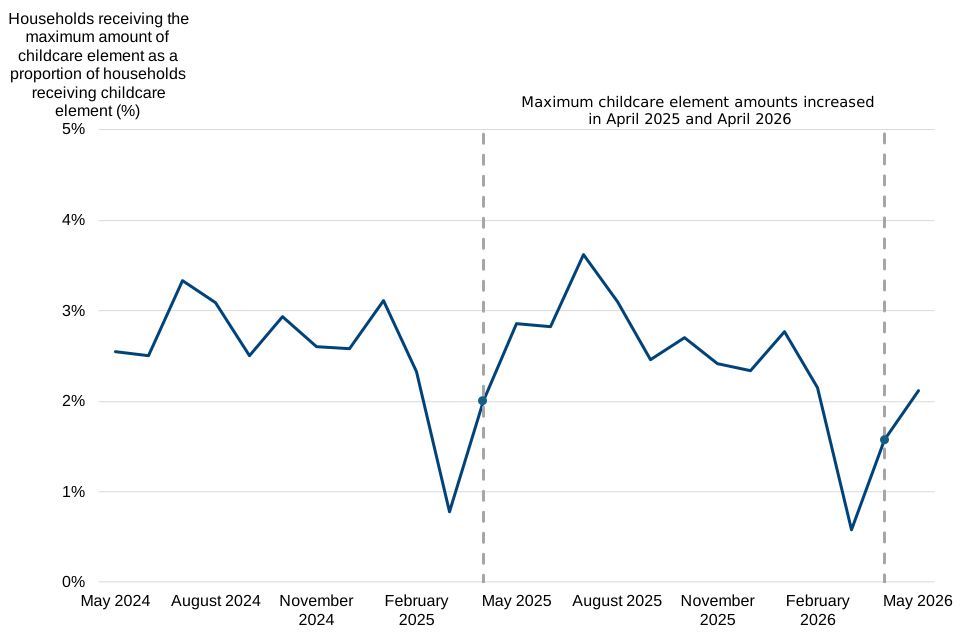
In May 2026, 2% of households receiving the childcare element received the maximum amount. This compares to 3% in May 2025. In London, 6% of households receiving the childcare element received the maximum amount (see table 12, supplementary data). This compares to 7% in May 2025.
6. Usage of the childcare element
We can compare the number of households receiving the childcare element to an estimate of the number who might be able to claim it. This estimate is the number of Universal Credit households with children aged 16 or younger in which all claimants are earning.
Chart 8: Universal Credit households receiving childcare element as a proportion of households where everyone is earning with a child aged up to and including age 16, May 2024 to May 2026
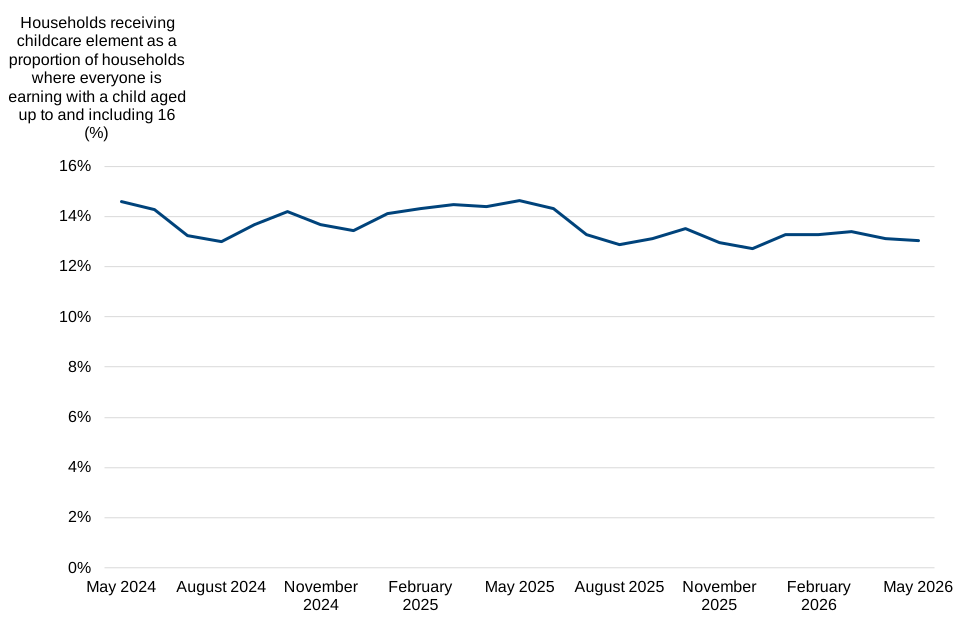
In May 2026, 13% of UC households with children and in which all claimants were earning received the childcare element.
This figure was similar for single households and couples (13% and 11% respectively) and varies across regions of GB, with a minimum of 9% in the North East, and a maximum of 17% in London (see table 11, supplementary data tables).
It is likely that some households make use of other forms of childcare that do not require the childcare element. These include the wider government offer of free childcare for pre-school children and friends and family helping with childcare.
Chart 9: Universal Credit households receiving childcare element as a proportion of households where everyone is earning with a child aged up to and including age 16, banded by age of youngest child, May 2026
| Age of youngest child | Households receiving childcare element as a proportion of households where everyone is earning with a child aged up to and including 16 (%) |
|---|---|
| 0 to 4 | 27% |
| 5 to 11 | 12% |
| 12 to 16 | 1% |
In UC households with children of pre-school age (aged 4 or younger), 27% of households with everyone earning received the childcare element. For households whose youngest child was of primary school age (5 to 11), the proportion was lower (12%). For households whose youngest child was of secondary school age (12+), the proportion was lower still (1%).
Chart 10: Universal Credit households receiving childcare element as a proportion of households where everyone is earning with a child aged up to and including age 16, by age of youngest child, May 2026
| Age of youngest child | Earning single households receiving childcare element as a proportion of earning single households with a child aged up to and including 16 (%) |
|---|---|
| 0 | 11% |
| 1 | 28% |
| 2 | 34% |
| 3 | 33% |
| 4 | 28% |
| 5 | 17% |
| 6 | 16% |
| 7 | 16% |
| 8 | 15% |
| 9 | 13% |
| 10 | 10% |
| 11 | 6% |
| 12 | 2% |
| 13 | 1% |
| 14 | 1% |
| 15 | 1% |
| 16 | 0% |
The proportion receiving the childcare element was highest for households whose youngest child was two years old. For households with older children, the proportion was progressively lower as the age of the youngest child increased.
7. Ethnicity statistics
In May 2026, among households receiving the childcare element that responded to the ethnicity question, the largest high-level ethnic group was White, accounting for 79% of claimants living in a household receiving the childcare element. The second largest group was Black/African/Caribbean/Black British, representing 10% of claimants. The Asian/Asian British ethnic group represented 5% of claimants and the Mixed/Multiple ethnic group represented 4% of claimants living in a household receiving the childcare element. The smallest group was the Other ethnic group, accounting for 3% of claimants.
These figures exclude the “unspecified” 16% of claimants receiving childcare element that did not respond to the question or answered, “prefer not to say”. By “claimants”, we refer to the adults in the Universal Credit household.
The number and percentage of claimants living in households receiving childcare element, broken down by ethnic group, can be found in Supplementary Table 15.
8. About these statistics
These statistics have been released as official statistics.
All figures in this publication are derived from Universal Credit administrative data.
Figures are provisional and may be subject to minor change. This is partly because a household may claim childcare for previous months. This means that a household could still claim childcare for any of the months listed in this publication, so that the number of recipients for any given month may increase slightly when revised in subsequent releases. For the same reason, the figures listed in this publication have changed slightly (and usually increased) compared to those in previous publications.
All figures are for Great Britain (GB) only and include only households where Universal Credit was in payment.
Figures are rounded according to the following convention.
| Range | Rounded to the nearest |
|---|---|
| 0 to 1,000 | 10 |
| 1,001 to 10,000 | 100 |
| 10,001 to 100,000 | 1,000 |
| 100,001 to 1,000,000 | 10,000 |
| 1,000,001 to 10,000,000 | 100,000 |
| Over 10,000,000 | 1,000,000 |
Note, percentages are rounded to the nearest 1% where appropriate. For this reason, totals may not add up exactly.
Charts 2, 4, 5, 6, 9 and 10 are produced using rounded figures, in line with the rounding convention outlined above. Charts 1, 3, 7 and 8 are produced using unrounded figures.
Childcare element is paid for childcare for children aged up to and including 16. It is theoretically possible for the childcare element to be received for a 17-year-old: this happens when the child turns 17 in the last assessment period for which they are eligible. We expect this number of cases to be very small and we have excluded any such cases from our data.
For each month, the number of households receiving the childcare element is defined as the number of households who were in payment of Universal Credit and with childcare element entitlement for an assessment period that began in that month. An assessment period is one calendar month in duration starting from the date of which a UC claim is made. By counting households this way, rather than counting when a household is paid, the statistics more closely reflect when childcare is used.
When the maximum amount of childcare element has increased it applies to assessment periods starting on or after the date that the increase began.
When information is given for regions of Great Britain, this is derived from the claimants’ residential address. Not all claimants have a valid address listed, which means that a small number of households have “Unknown” region information.
For the full data, see the Supplementary data tables published alongside this release.
9. Further information and feedback
Lead Statistician: A Snowsill
Analyst: A Abbas
Feedback on the content of these statistics and any non-media enquiries should be directed to ucad.briefinganalysis@dwp.gov.uk
For media enquiries on these statistics, please contact the DWP press office.
Note that these contact details cannot provide any information or assistance with claiming Universal Credit.