UK regional trade in goods statistics, second quarter, April to June 2026: commentary
Published 17 September 2026

© Crown copyright 2026
This publication is licensed under the terms of the Open Government Licence v3.0 except where otherwise stated. To view this licence, visit nationalarchives.gov.uk/doc/open-government-licence/version/3 or write to the Information Policy Team, The National Archives, Kew, London TW9 4DU, or email: psi@nationalarchives.gov.uk.
Where we have identified any third party copyright information you will need to obtain permission from the copyright holders concerned.
This publication is available at https://www.gov.uk/government/statistics/uk-regional-trade-in-goods-statistics-second-quarter-april-to-june-2026/uk-regional-trade-in-goods-statistics-second-quarter-april-to-june-2026-commentary
UK Regional trade in goods summary
This commentary reports the UK’s regional trade in goods statistics by broad area (EU and non-EU), Country and Standard International Trade Classification (SITC) Revision 4. Users must refer to the explanatory notes accompanying this commentary, covering data sources and compilation methodology. Aggregated data can be found in our accompanying tables.
Trade in goods values (£) are reported in current prices. Values are not adjusted for inflation or seasonality, so please take caution when making comparisons with historic data.
In the year ending June 2026, the overall value of UK trade in goods increased by 1.6% for exports and increased by 6.2% for imports, when compared with the previous year. At a regional level:
- Scotland experienced a decrease in the value of exports, while all other UK countries experienced increases
- all UK countries experienced increases in the value of imports
- export values for the West Midlands and Yorkshire and The Humber decreased, while all other English regions experienced increases
- import values for Yorkshire and The Humber decreased while all other English regions experienced increases
England’s trade in goods
In the year ending June 2026, compared with the year ending June 2025:
England’s exports of goods to EU countries were £128 billion, an increase of £6.2 billion or 5.1%. The commodity with the largest value increase in EU exports was SITC 75 - Office machines & automatic data processing machines, an increase of £1.8 billion or 71%. The country with the largest value increase in EU exports was Germany, an increase of £2.8 billion or 12%.
England’s exports of goods to non-EU countries were £142 billion, an increase of £2.3 billion or 1.6%. The commodity with the largest value increase in non-EU exports was SITC 68 - Non-ferrous metals, an increase of £4.3 billion or 40%. The country with the largest value increase in non-EU exports was Hong Kong, an increase of £5.1 billion or 60%.
In the year ending June 2026, the largest English export region by value was London, accounting for 11% of the UK’s total exports of goods. The smallest was the North East, accounting for 4.0%.
England’s imports of goods from EU countries were £249 billion, an increase of £12.3 billion or 5.2%. The commodity with the largest value increase in EU imports was SITC 75 - Office machines & automatic data processing machines, an increase of £1.8 billion or 35%. The country with the largest value increase in EU imports was Germany, an increase of £3.2 billion or 5.3%.
England’s imports of goods from non-EU countries were £217 billion, an increase of £16.1 billion or 8.0%. The commodity with the largest value increase in non-EU imports was SITC 68 - Non-ferrous metals, an increase of £11.4 billion or 2.5 times the value. The country with the largest value increase in non-EU imports was the USA, an increase of £6.6 billion or 16%.
In the year ending June 2026, the largest English import region by value was the South East, accounting for 18% of the UK’s total imports of goods. The smallest was the North East, accounting for 2.5%.
Figure 1: England’s trade in goods, first quarter, January to March 2021 onwards
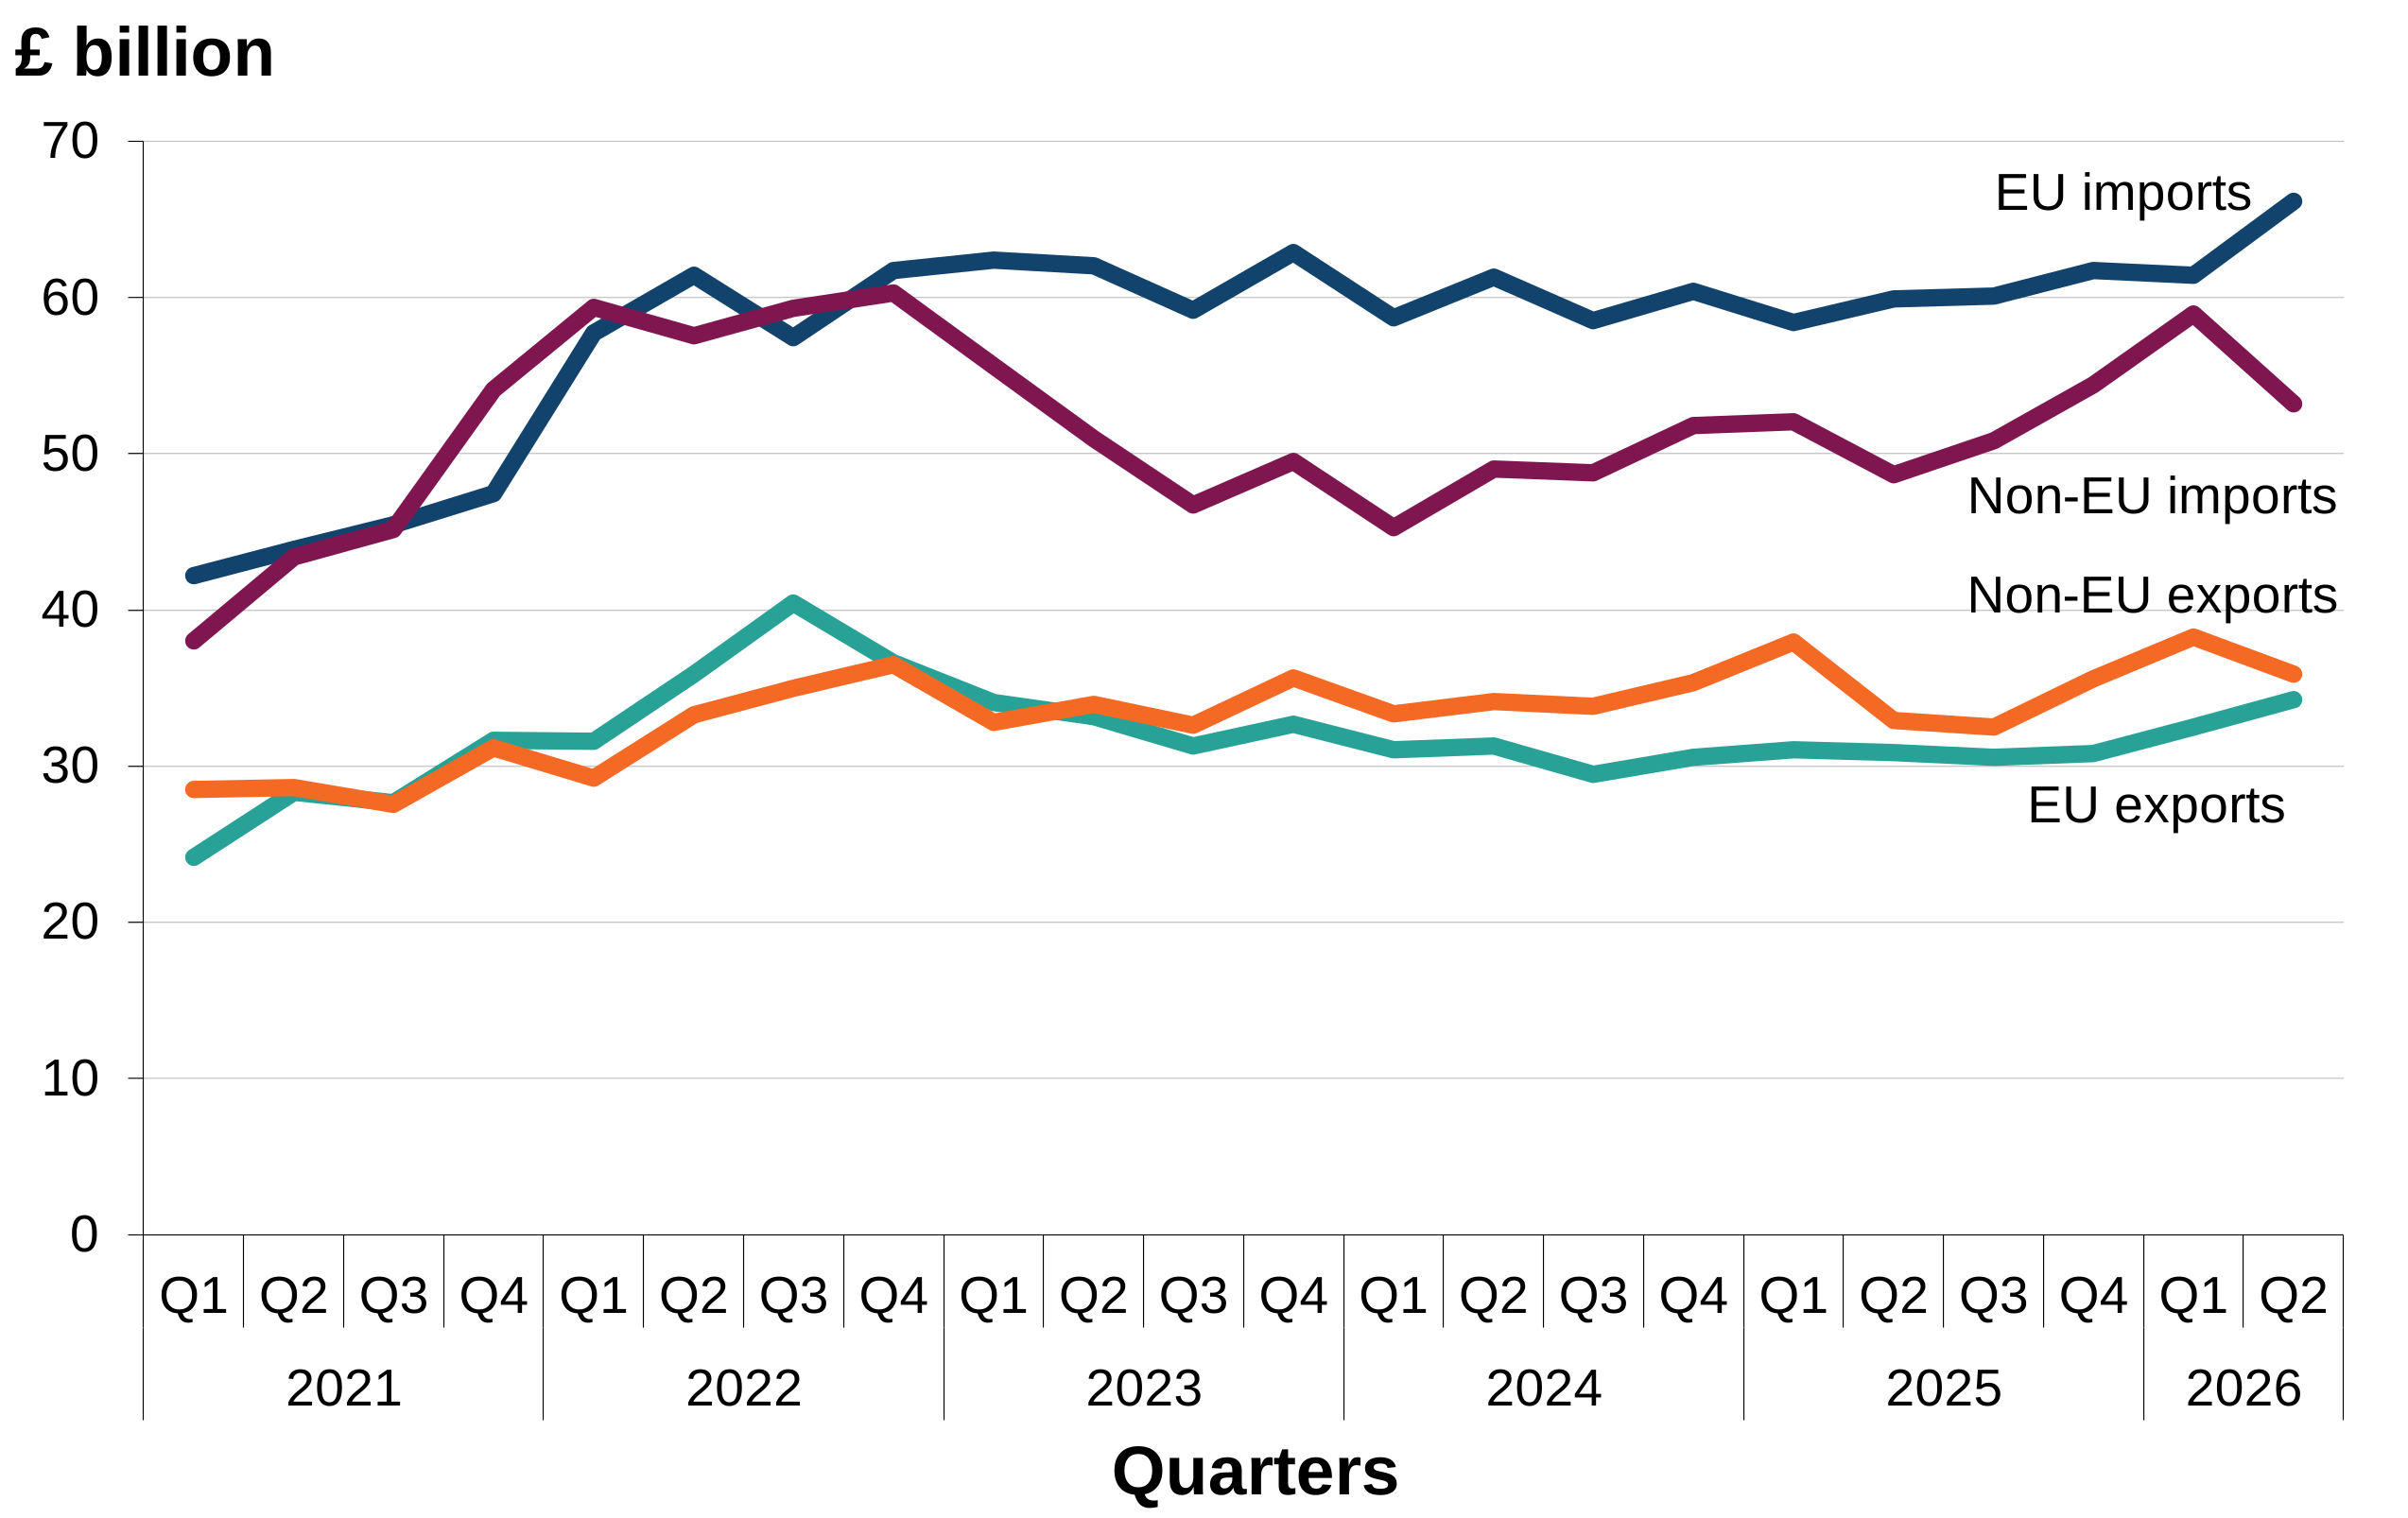
Figure 1 shows a time series of England’s trade in goods with EU and non-EU countries, for both exports and imports.
Source: UK regional trade in goods statistics from HM Revenue & Customs
Download figure 1: England’s trade in goods, first quarter, January to March 2021 onwards (ODS 15KB)
Note: 2026 data is provisional.
Wales’ trade in goods
In the year ending June 2026, compared with the year ending June 2025:
Wales’ exports of goods to EU countries were £11.7 billion, an increase of £1.1 billion or 11%. The commodity with the largest value increase in EU exports was SITC 33 - Petroleum, petroleum products & related materials, an increase of £0.4 billion or 32%. The country with the largest value increase in EU exports was Ireland, an increase of £0.3 billion or 14%.
Wales’ exports of goods to non-EU countries were £8.3 billion, a reduction of £0.1 billion or 1.1%. The commodity with the largest value decrease in non-EU exports was SITC 33 - Petroleum, petroleum products & related materials, a reduction of £0.1 billion or 8.8%. The country with the largest value decrease in non-EU exports was Canada, a reduction of £0.2 billion or 38%.
Wales’ imports of goods from EU countries were £8.1 billion, an increase of £0.1 billion or 1.3%. The commodity with the largest value increase in EU imports was SITC 68 - Non-ferrous metals, an increase of £0.3 billion or 87%. The country with the largest value increase in EU imports was France, an increase of £0.2 billion or 22%.
Wales’ imports of goods from non-EU countries were £13.5 billion, an increase of £0.9 billion or 7.0%. The commodity with the largest value increase in non-EU imports was SITC 33 - Petroleum, petroleum products & related materials, an increase of £0.7 billion or 17%. The country with the largest value increase in non-EU imports was the USA, an increase of £0.8 billion or 22%.
Figure 2: Wales’ trade in goods, first quarter, January to March 2021 onwards
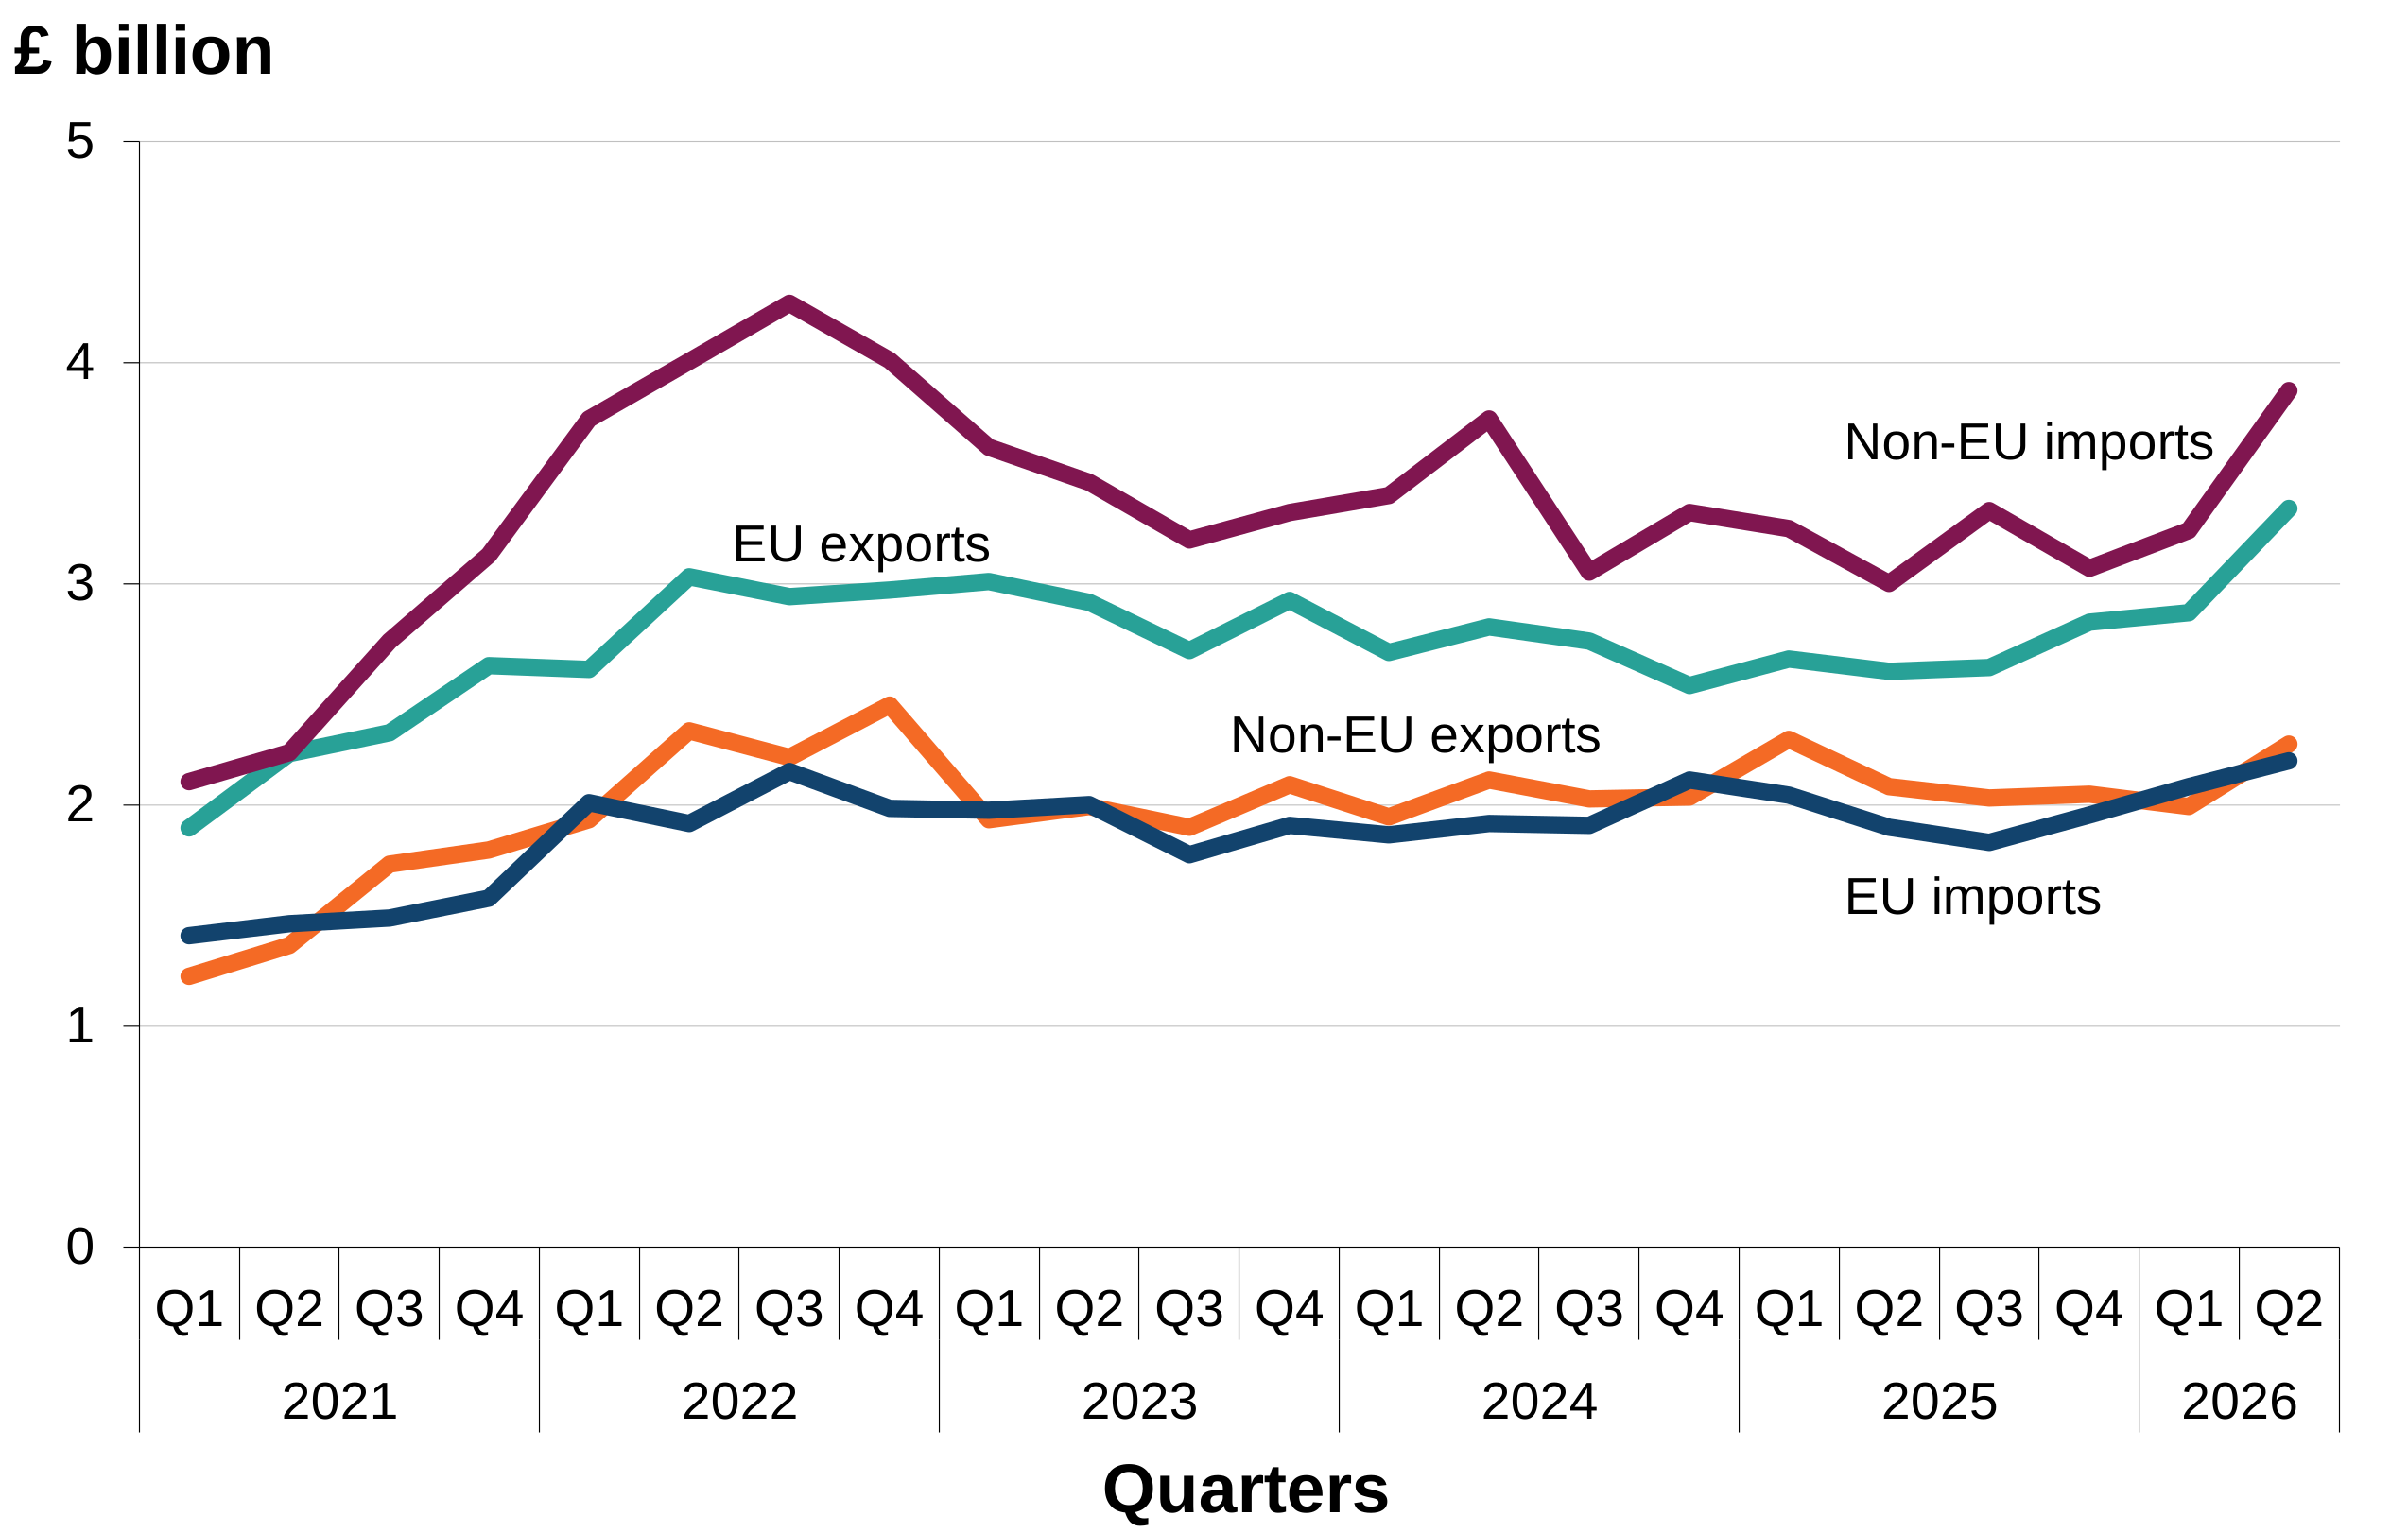
Figure 2 shows a time series of Wales’ trade in goods with EU and non-EU countries, for both exports and imports.
Source: UK regional trade in goods statistics from HM Revenue & Customs
Download figure 2: Wales’ trade in goods, first quarter, January to March 2021 onwards (ODS 9.5KB)
Note: 2026 data is provisional.
Scotland’s trade in goods
In the year ending June 2026, compared with the year ending June 2025:
Scotland’s exports of goods to EU countries were £15.8 billion, a reduction of £2.3 billion or 13%. The commodity with the largest value decrease in EU exports was SITC 33 - Petroleum, petroleum products & related materials, a reduction of £2.7 billion or 35%. The country with the largest value decrease in EU exports was the Netherlands, a reduction of £1.2 billion or 24%.
Scotland’s exports of goods to non-EU countries were £15.5 billion, a reduction of £0.8 billion or 4.7%. The commodity with the largest value decrease in non-EU exports was SITC 33 - Petroleum, petroleum products & related materials, a reduction of £0.8 billion or 68%. The country with the largest value decrease in non-EU exports was the USA, a reduction of £0.7 billion or 15%.
Scotland’s imports of goods from EU countries were £12.8 billion, an increase of £1.1 billion or 9.5%. The commodity with the largest value increase in EU imports was SITC 75 - Office machines & automatic data processing machines, an increase of £0.4 billion or 28%. The country with the largest value increase in EU imports was the Netherlands, an increase of £0.3 billion or 12%.
Scotland’s imports of goods from non-EU countries were £18.0 billion, an increase of £0.8 billion or 4.9%. The commodity with the largest value increase in non-EU imports was SITC 68 - Non-ferrous metals, an increase of £0.7 billion or more than 2.5 times the value. The country with the largest value increase in non-EU imports was China, an increase of £0.5 billion or 18%.
Figure 3: Scotland’s trade in goods, first quarter, January to March 2021 onwards
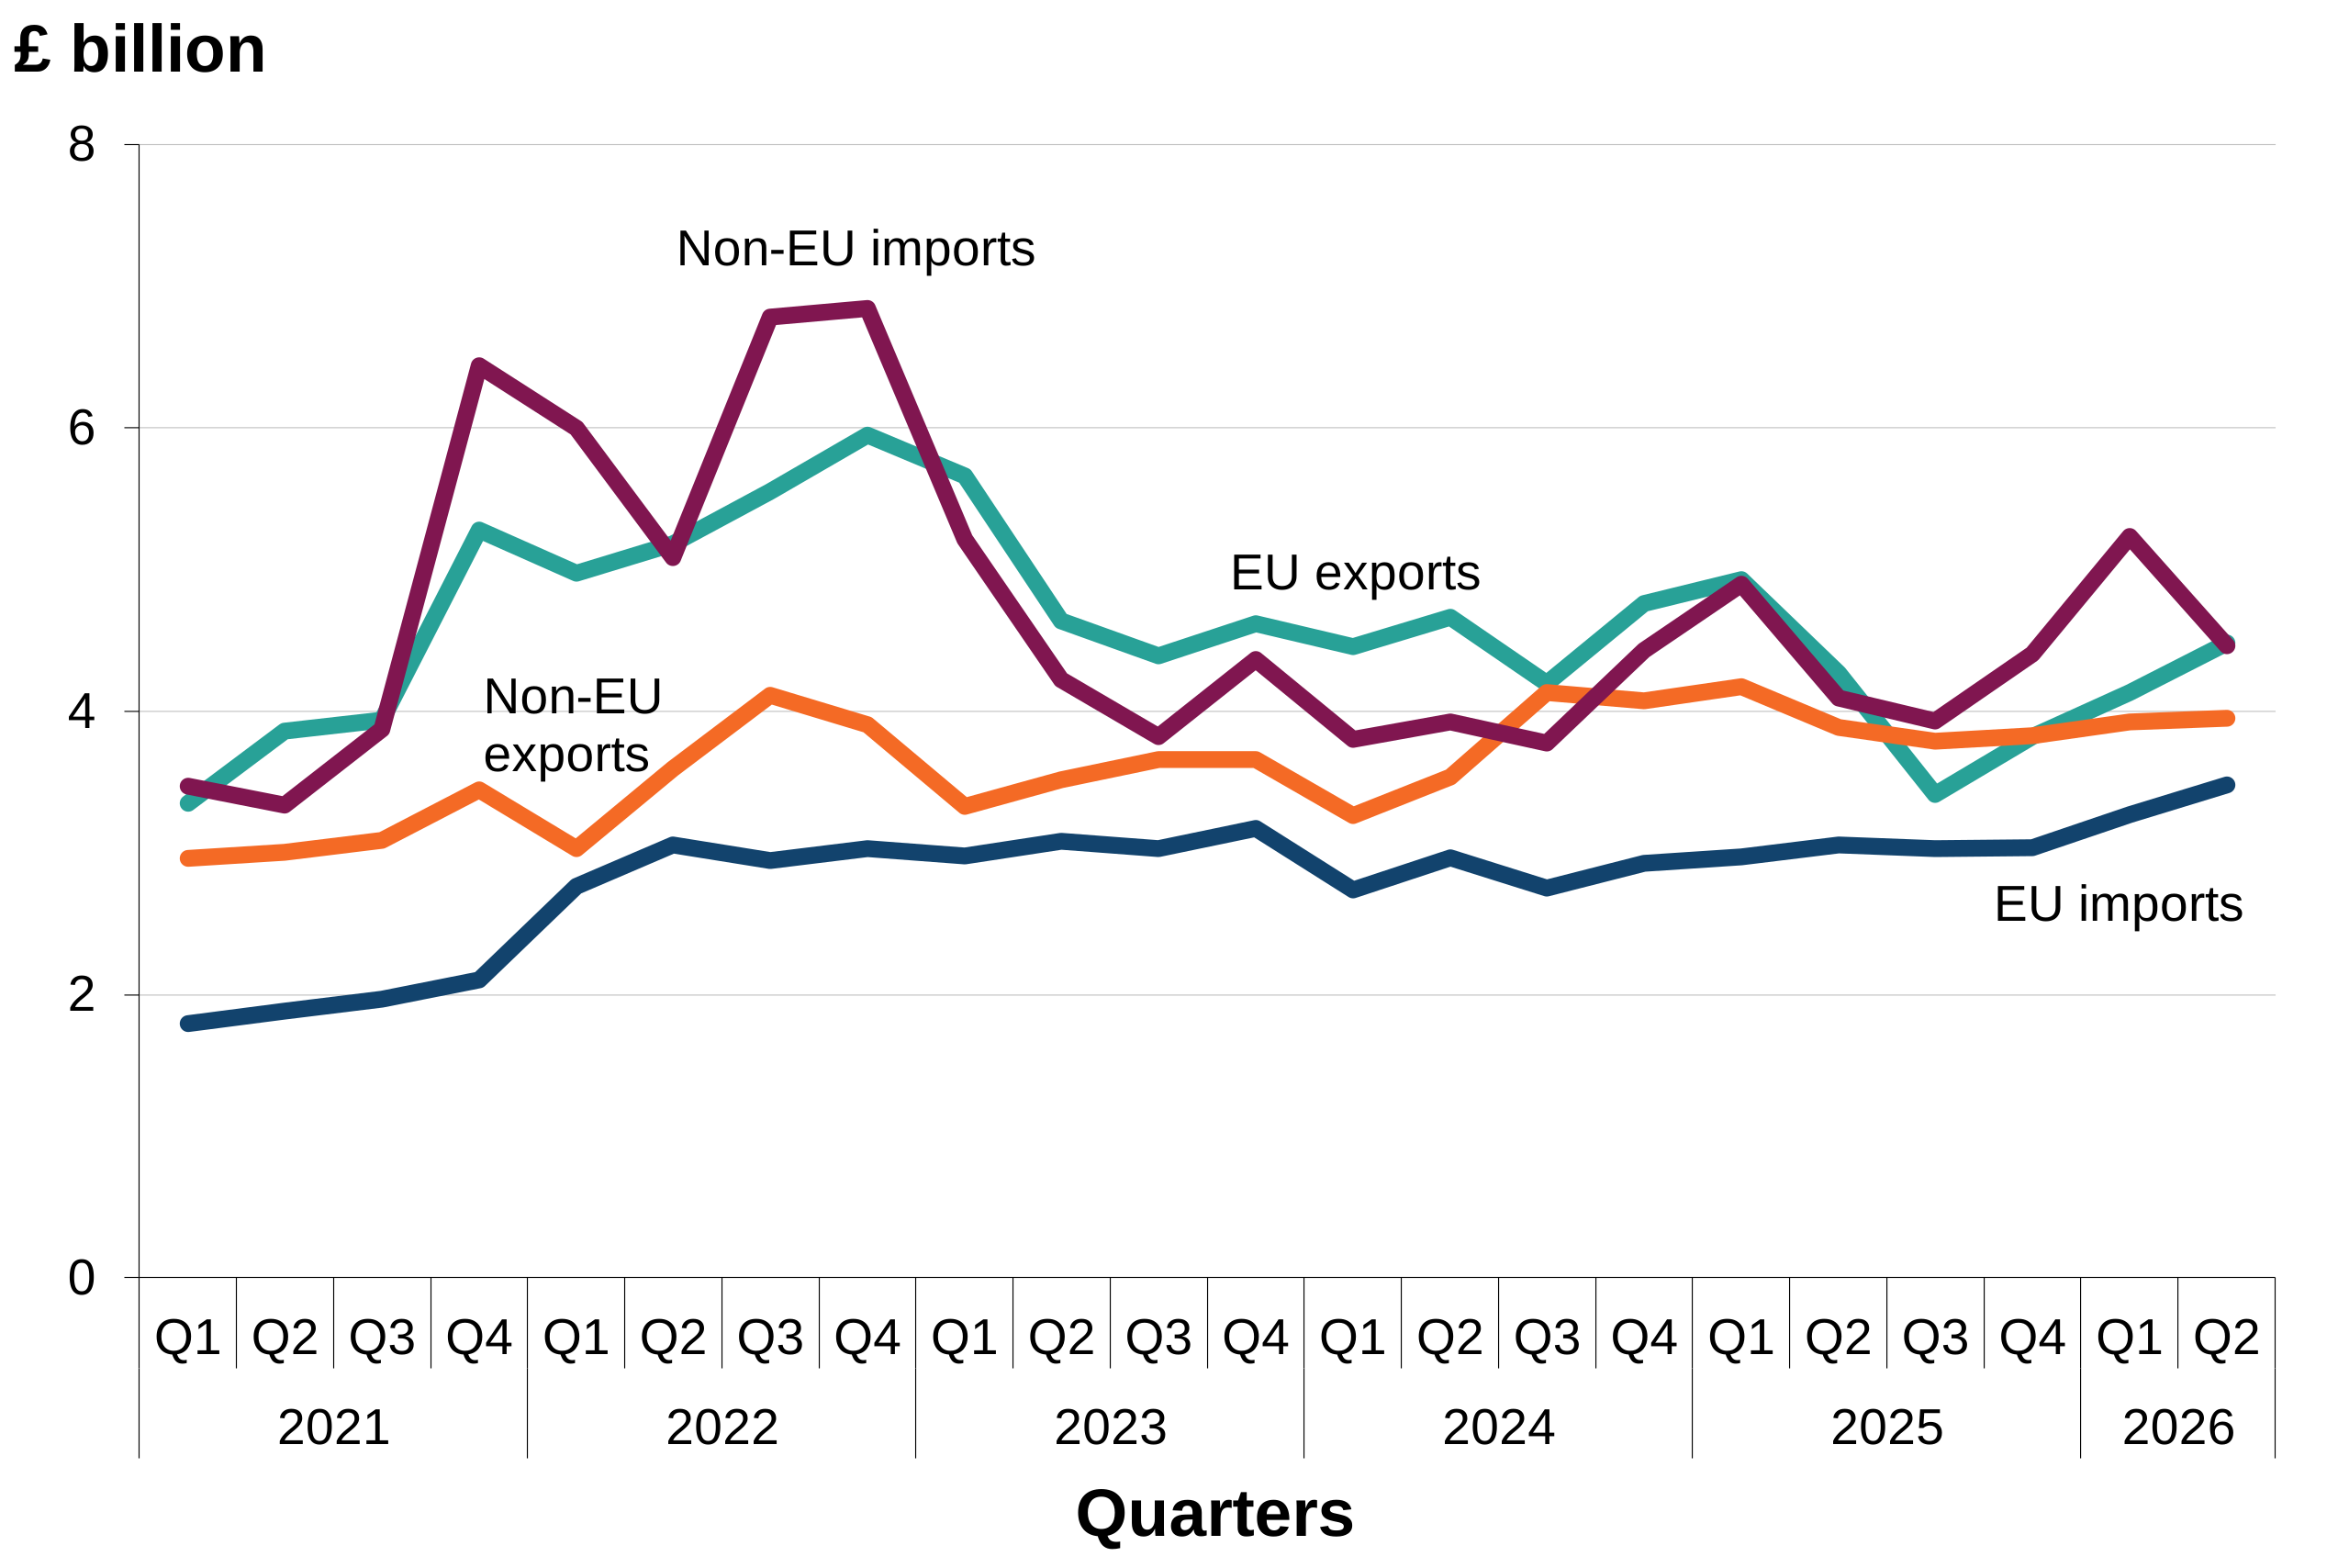
Figure 3 shows a time series of Scotland’s trade in goods with EU and non-EU countries, for both exports and imports.
Source: UK regional trade in goods statistics from HM Revenue & Customs
Note: 2026 data is provisional.
Northern Ireland’s trade in goods
In the year ending June 2026, compared with the year ending June 2025:
Northern Ireland’s exports of goods to EU countries were £7.4 billion, an increase of £0.5 billion or 6.7%. The commodity with the largest value increase in EU exports was SITC 77 - Electric machinery, apparatus, appliances, and electrical parts thereof, an increase of £0.3 billion or more than 2.5 times the value. The country with the largest value increase in EU exports was Ireland, an increase of £0.3 billion or 6.9%.
Northern Ireland’s exports of goods to non-EU countries were £3.7 billion, a reduction of £0.1 billion or 2.0%. The commodity with the largest value decrease in non-EU exports was SITC 77 - Electric machinery, apparatus, appliances, and electrical parts thereof, a reduction of £0.1 billion or 56%. The country with the largest value decrease in non-EU exports was Thailand, a reduction of £0.2 billion or 86%.
Northern Ireland’s imports of goods from EU countries were £7.0 billion, a reduction of £0.1 billion or 1.1%. The commodity with the largest value decrease in EU imports was SITC 02 - Dairy products & birds’ eggs, a small value decrease, down 16%. The country with the largest value decrease in EU imports was Ireland, a reduction of £0.1 billion or 1.7%.
Northern Ireland’s imports of goods from non-EU countries were £3.5 billion, an increase of £0.3 billion or 8.9%. The commodity with the largest value increase in non-EU imports was SITC 77 - Electric machinery, apparatus, appliances, and electrical parts thereof, an increase of £0.2 billion or 55%. The country with the largest value increase in non-EU imports was China, an increase of £0.1 billion or 9.3%.
Figure 4: Northern Ireland’s trade in goods, first quarter, January to March 2021 onwards
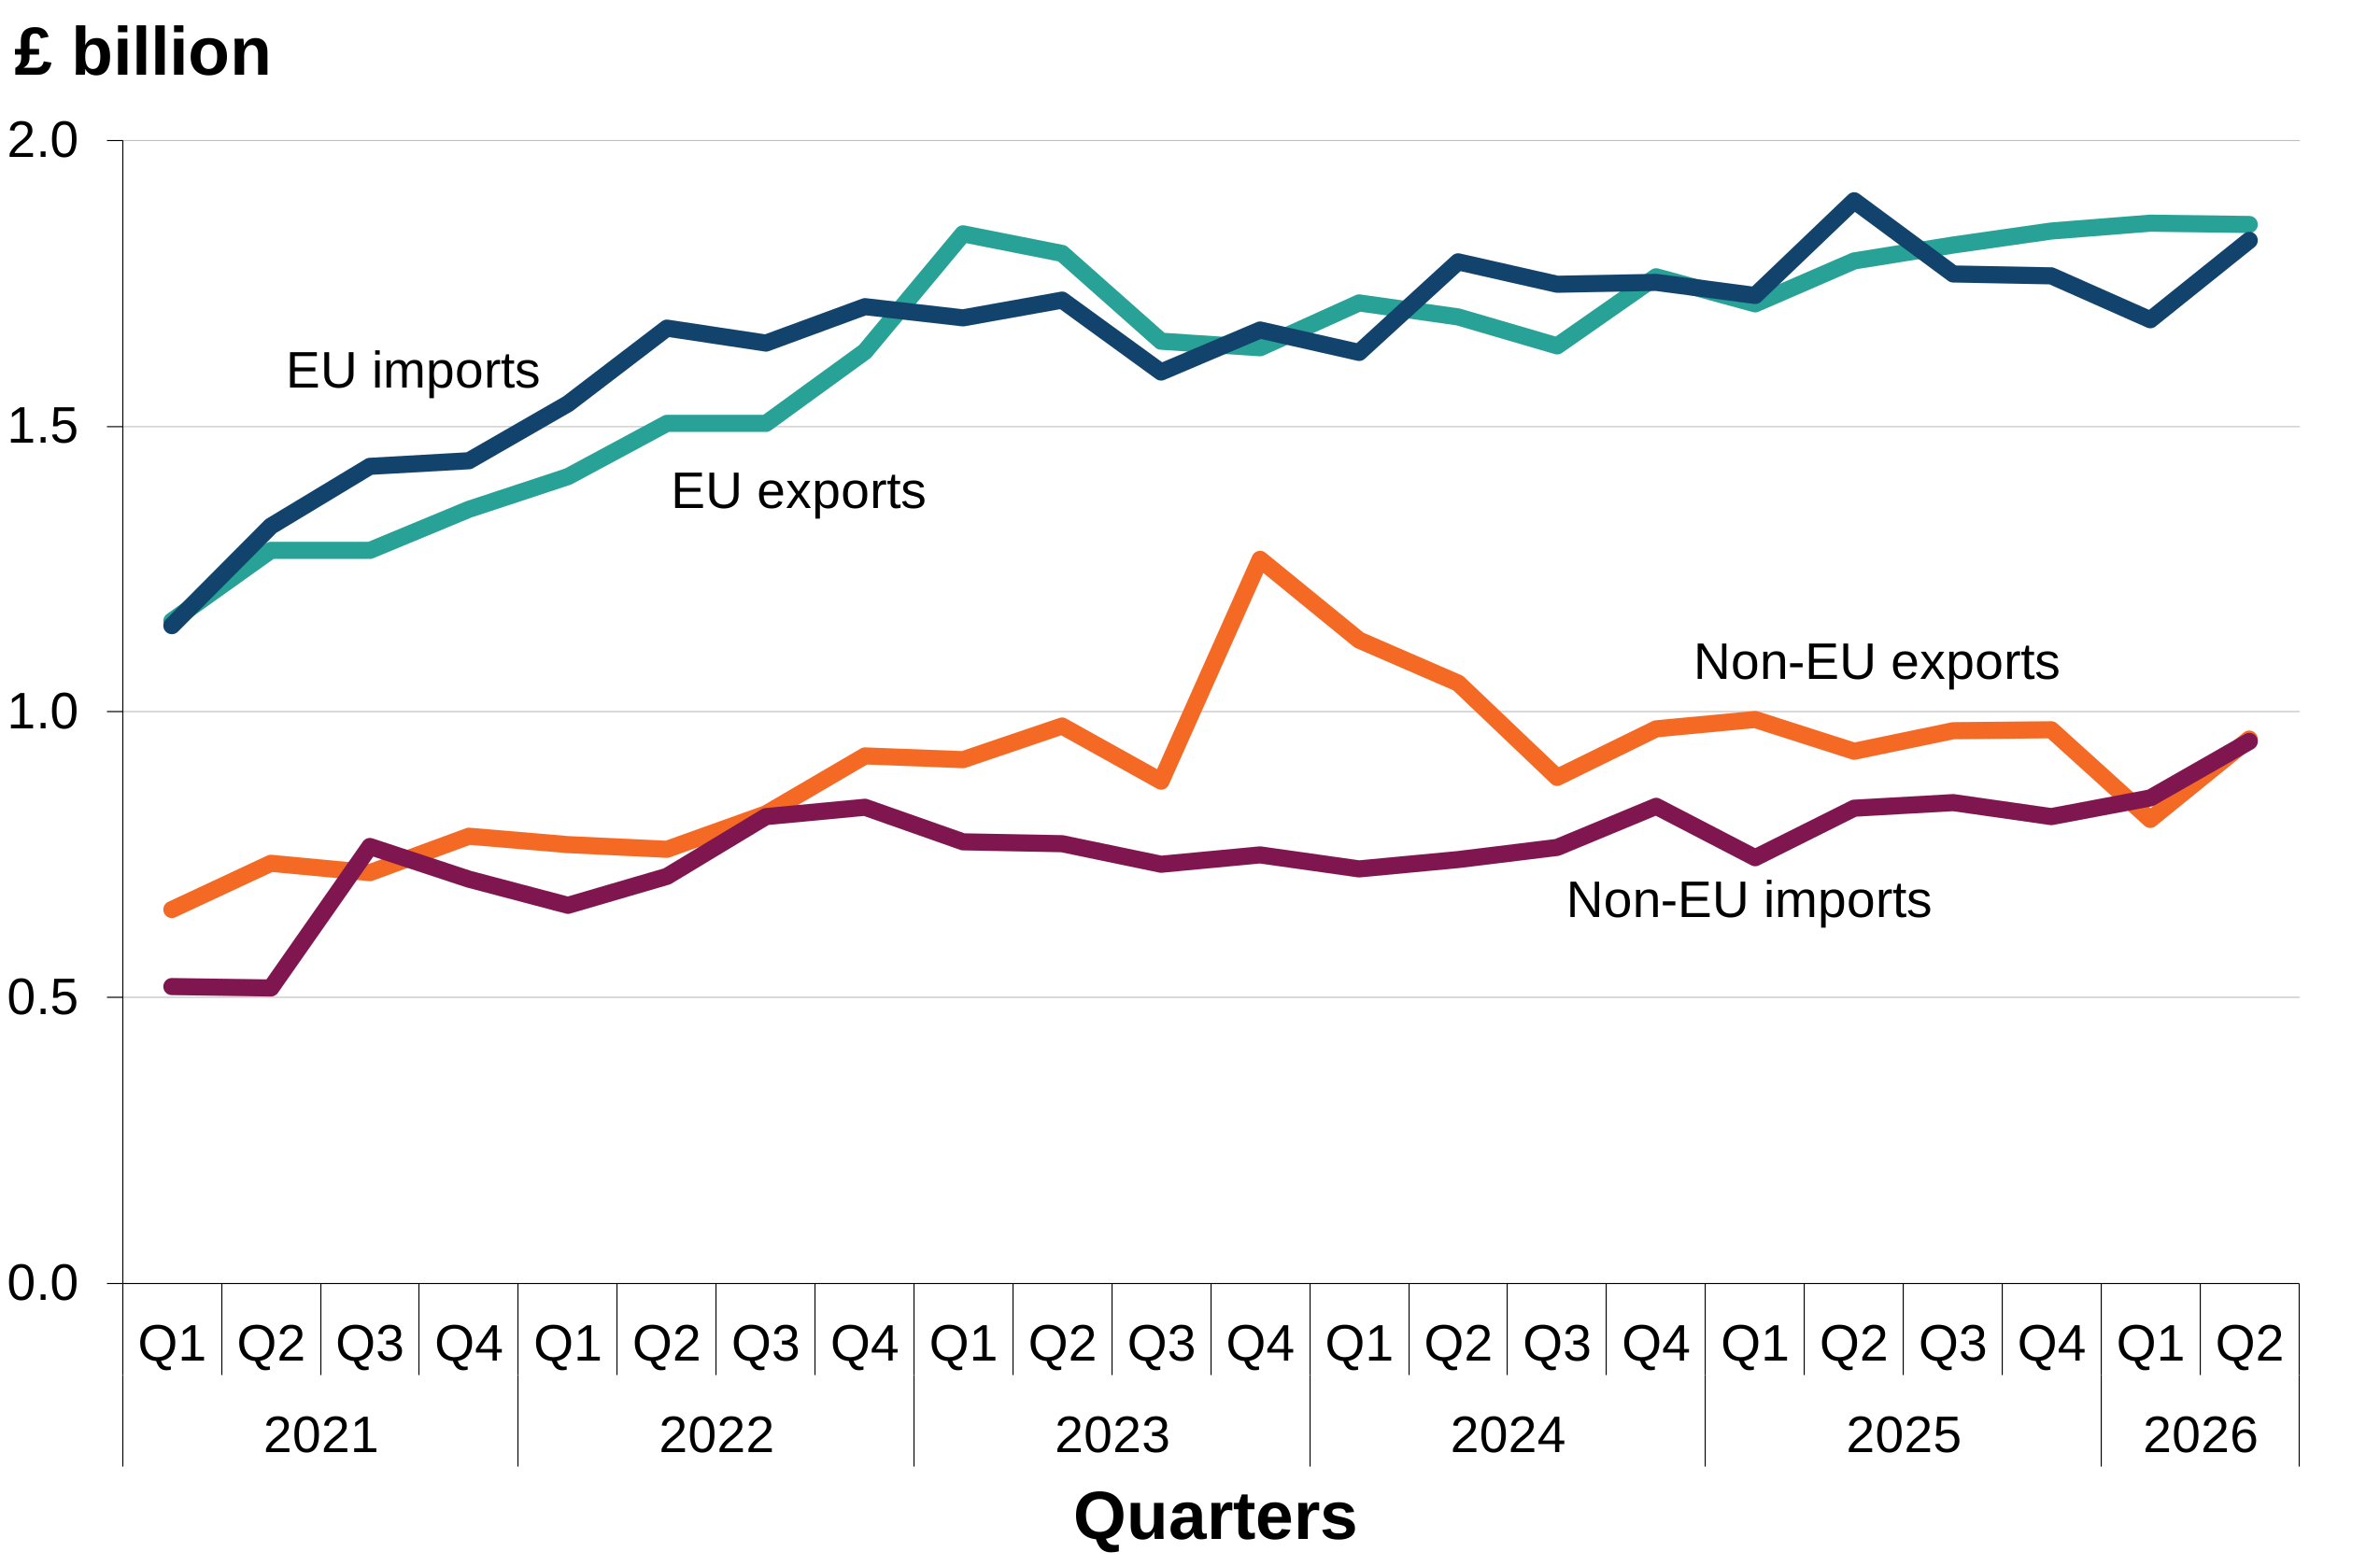
Figure 4 shows a time series of Northern Ireland’s trade in goods with EU and non-EU countries, for both exports and imports.
Source: UK regional trade in goods statistics from HM Revenue & Customs
Note: 2026 data is provisional.