UK overseas trade in goods statistics May 2026: commentary
Published 16 July 2026

© Crown copyright 2026
This publication is licensed under the terms of the Open Government Licence v3.0 except where otherwise stated. To view this licence, visit nationalarchives.gov.uk/doc/open-government-licence/version/3 or write to the Information Policy Team, The National Archives, Kew, London TW9 4DU, or email: psi@nationalarchives.gov.uk.
Where we have identified any third party copyright information you will need to obtain permission from the copyright holders concerned.
This publication is available at https://www.gov.uk/government/statistics/uk-overseas-trade-in-goods-statistics-may-2026/uk-overseas-trade-in-goods-statistics-may-2026-commentary
Trade in goods summary
Data behind this bulletin is available through the UK Trade Info website, where users can build their own tables according to the countries, commodities, and ports selected.
For more information on how we compile the trade in goods statistics, users must refer to the accompanying methodology notes. Further information about trade in non-monetary gold (NMG) can be found in the monthly gold table.
Total exports of goods for May 2026
£39.2 billion up £2.8 billion, or 8%, on April 2026, up £6.2 billion, or 19%, on May 2025
Total imports of goods for May 2026
£63.7 billion up £0.1 billion, or less than 1%, on April 2026, up £5.2 billion, or 9%, on May 2025
Source: UK overseas trade in goods statistics from HM Revenue & Customs
Note: 2025 and 2026 data is provisional.
The UK was a net importer this month, with imports exceeding exports by £24.5 billion, narrowing the trade gap by £2.7 billion compared with April 2026.
Figure 1: Total UK monthly trade in goods, December 2024 to May 2026
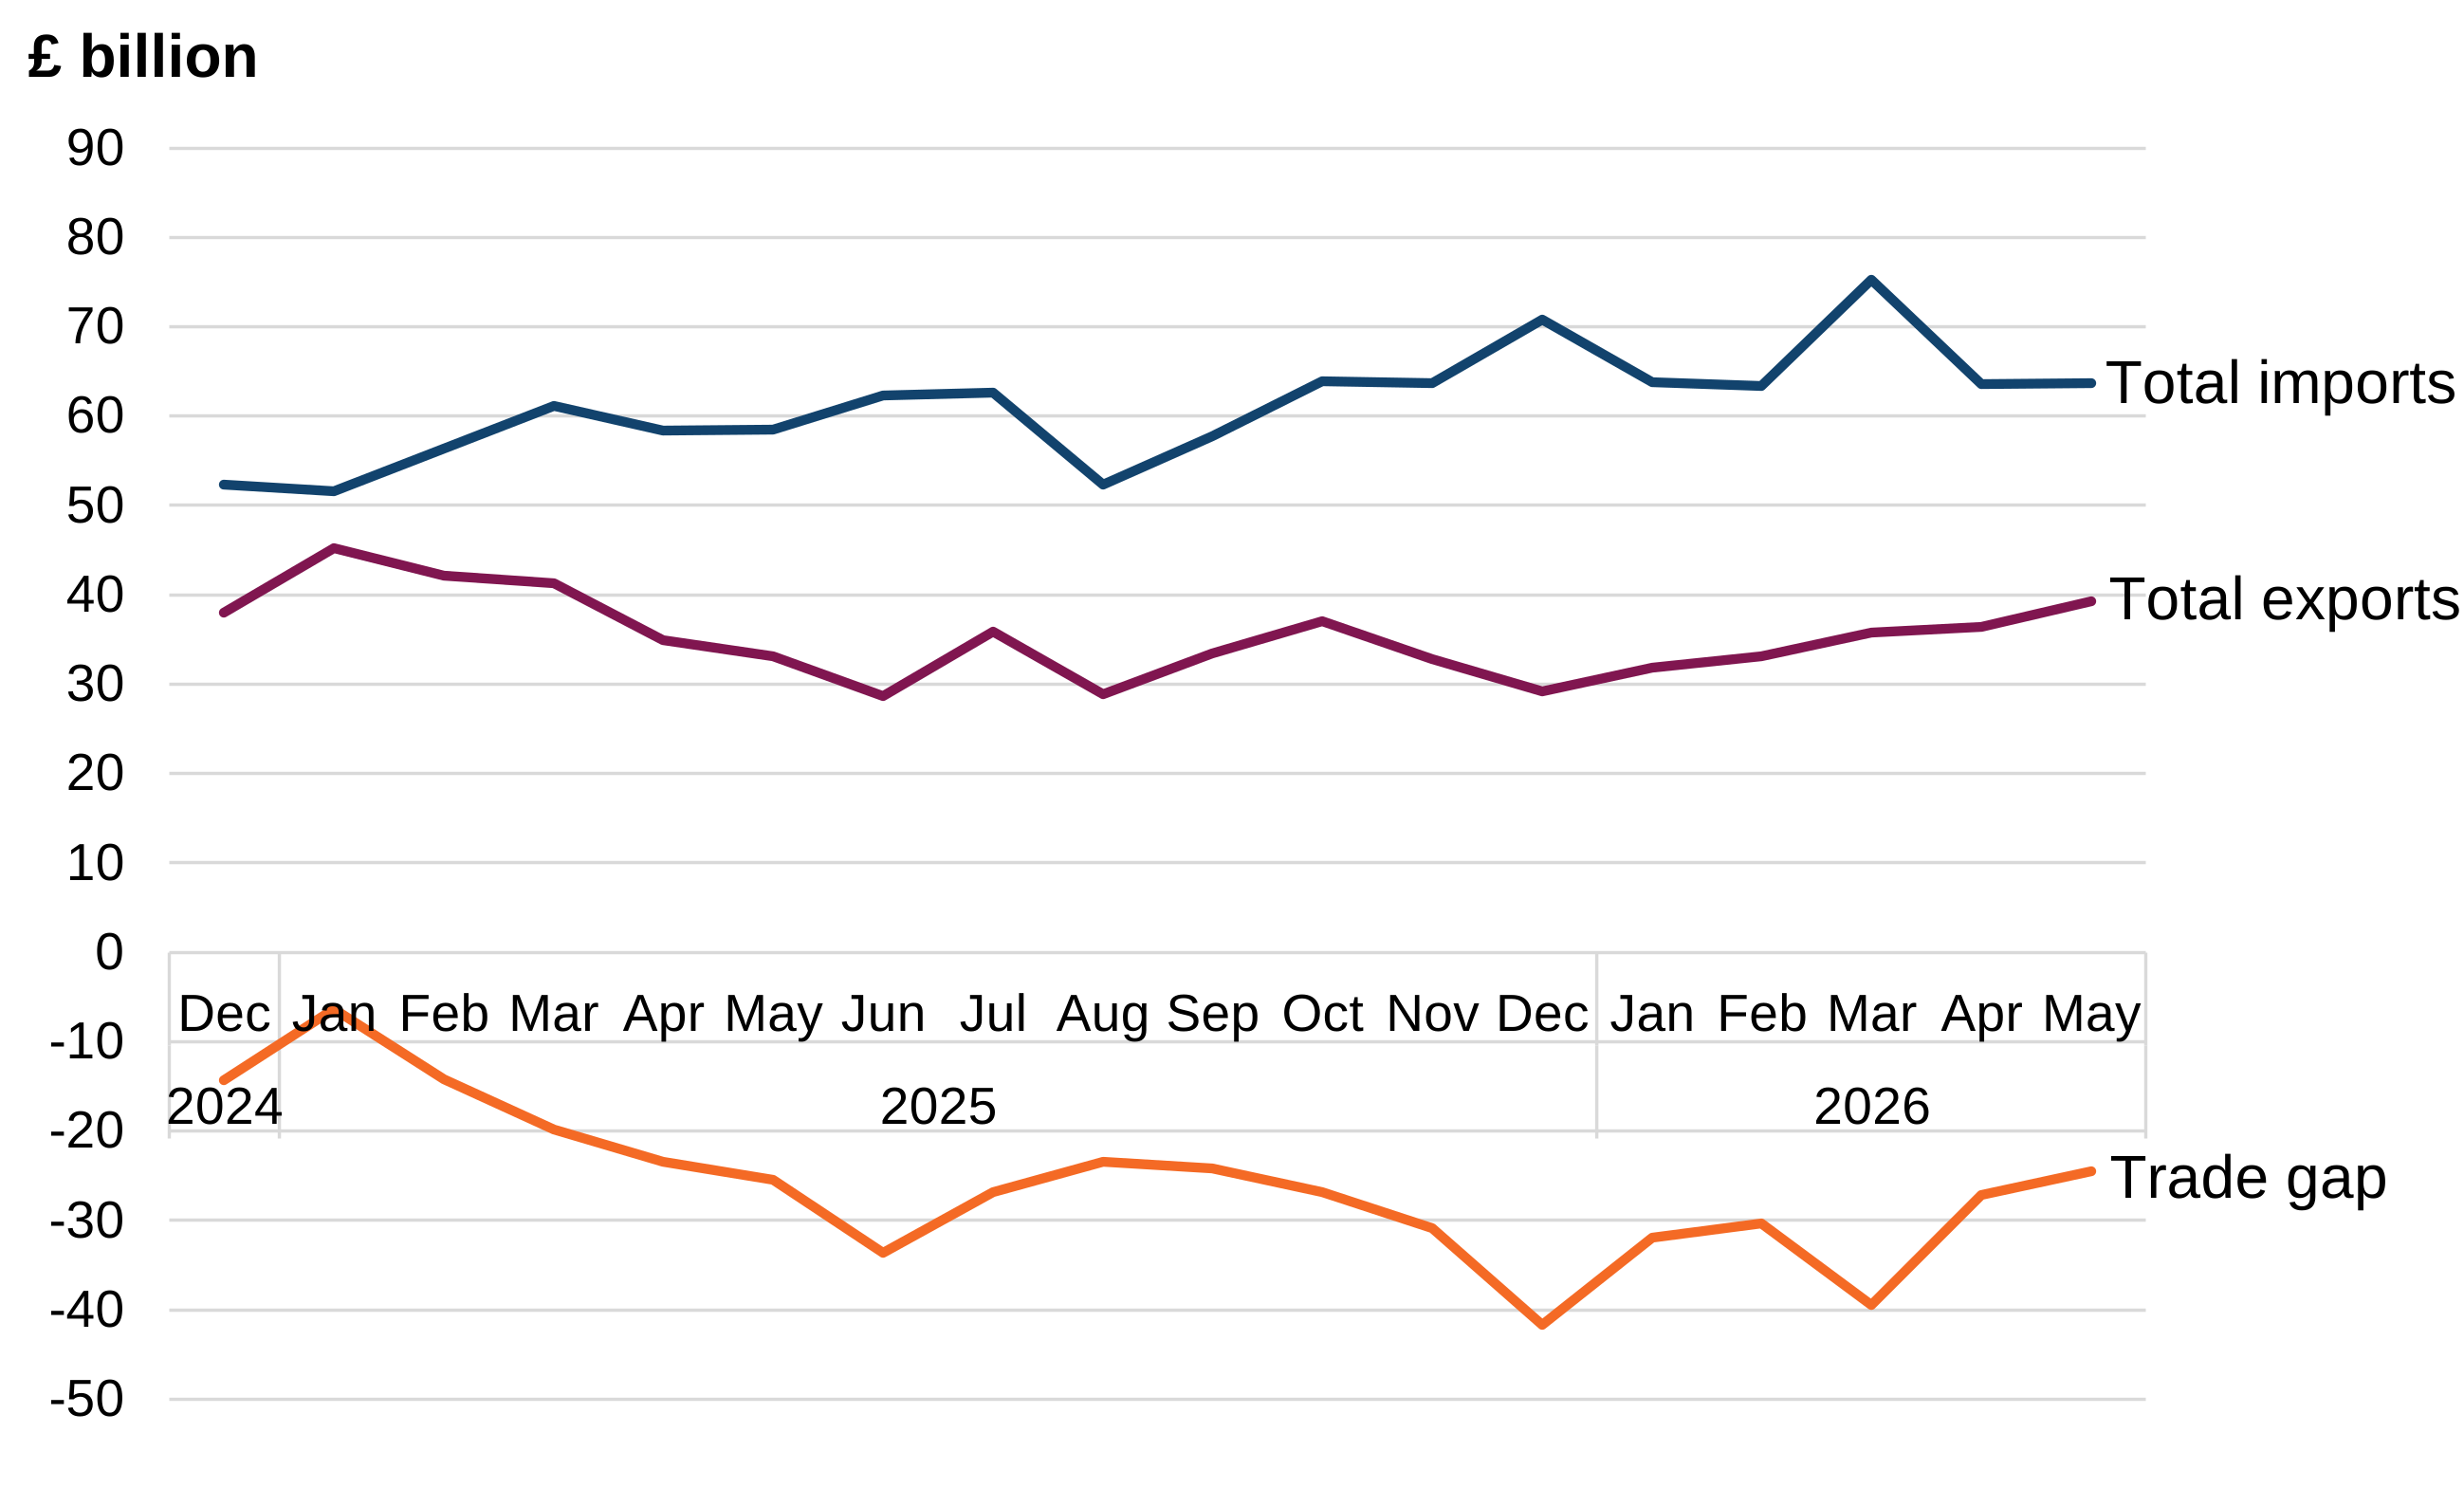
Figure 1 shows total exports, imports and the trade gap for the period from December 2024 to May 2026.
Source: UK overseas trade in goods statistics from HM Revenue & Customs
Download figure 1: Total UK monthly trade in goods, December 2024 to May 2026 (ODS, 12.6 KB)
Note: 2025 and 2026 data is provisional.
In May 2026, both exports and imports increased, with exports increasing by a greater magnitude. As a result of this, the trade gap narrowed.
Impact of non-monetary gold (NMG)
Movements in NMG can be large and highly volatile, impacting underlying trends in trade figures. More information can be found in the accompanying methodology notes and in the monthly gold table.
Figure 2: Total UK monthly trade in goods including and excluding NMG, December 2024 to May 2026
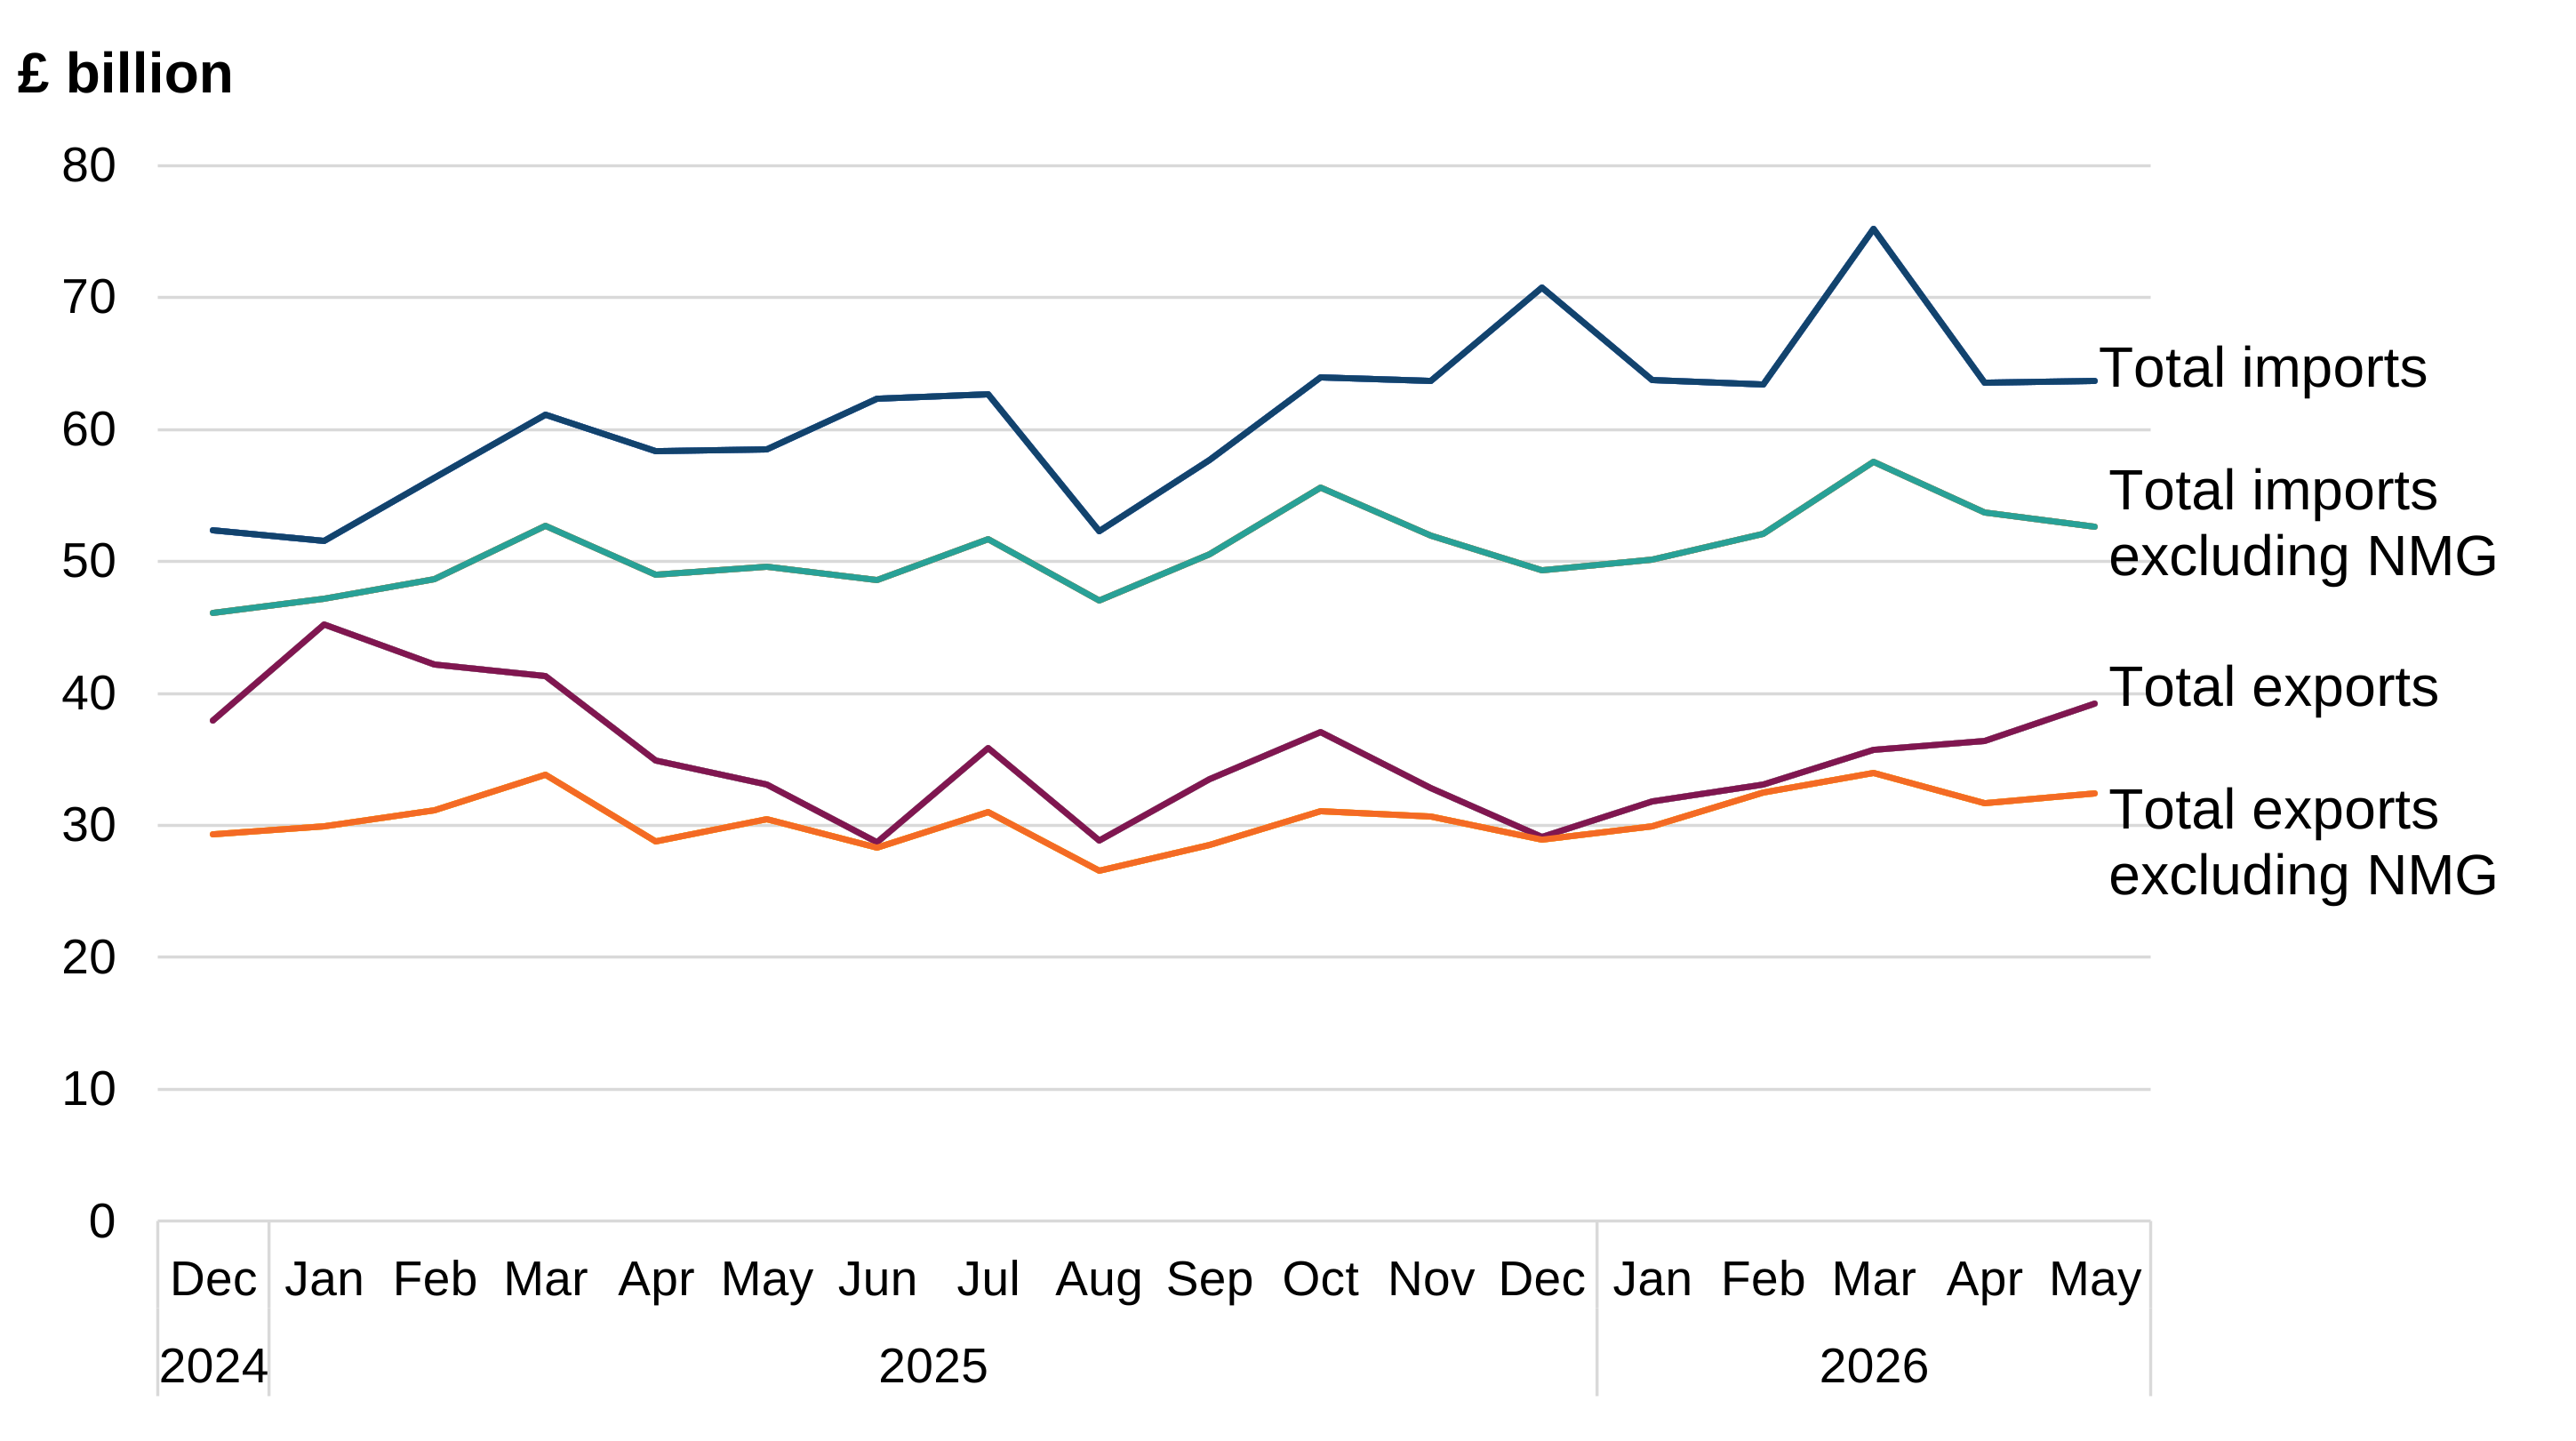
Figure 2 shows exports and imports including and excluding non-monetary gold for the period from December 2024 to May 2026.
Source: UK overseas trade in goods statistics from HM Revenue & Customs
Note: 2025 and 2026 data is provisional.
NMG exports increased by £2.1 billion in May 2026, and all other exports increased by £0.7 billion.
NMG imports increased by £1.2 billion in May 2026, while all other imports decreased by £1.1 billion.
Table 1: UK monthly imports of NMG from non-EU countries by value and net mass, January 2026 to May 2026
| Month of account | Value (£ billion) | Net mass (kg) | Unit price per kg (£) |
|---|---|---|---|
| January 2026 | 12.7 | 177,005 | 71,691 |
| February 2026 | 10.3 | 99,940 | 103,246 |
| March 2026 | 16.4 | 148,139 | 110,545 |
| April 2026 | 9.4 | 87,227 | 107,384 |
| May 2026 | 10.6 | 112,779 | 93,949 |
Source: UK overseas trade in goods statistics from HM Revenue & Customs
The increase in value of imports of NMG was driven by an increase in quantity from non-EU countries on April 2026, up 29%. There was a decrease in unit price in imports from non-EU countries, down 13% over the same period. Overall, this led to an increase in value of 13%.
EU and non-EU trade in goods
Exports to the EU accounted for 42% of the total value of exports, or 50% when excluding NMG.
Imports from the EU accounted for 44% of the total value of imports, or 53% when excluding NMG.
Table 2: Total UK trade in goods with EU and non-EU, including and excluding the impact of NMG, May 2026 (£ billion)
| Flow | EU |
EU excl NMG |
Non-EU |
Non-EU excl NMG |
Total | Total excl NMG |
|---|---|---|---|---|---|---|
| Exports | 16.6 | 16.4 | 22.7 | 16.0 | 39.2 | 32.4 |
| Imports | 28.3 | 27.8 | 35.4 | 24.8 | 63.7 | 52.7 |
Source: UK overseas trade in goods statistics from HM Revenue & Customs
Note: 2025 and 2026 data is provisional.
EU exports for May 2026 were £16.6 billion. This was a decrease of £0.4 billion, or 2%, on April 2026, but an increase of £0.9 billion, or 5%, compared with May 2025.
Non-EU exports for May 2026 were £22.7 billion. This was an increase of £3.2 billion, or 16%, on April 2026, and an increase of £5.3 billion, or 31%, compared with May 2025.
EU imports for May 2026 were £28.3 billion. This was a decrease of £1.2 billion, or 4%, on April 2026, but an increase of £0.7 billion, or 3%, compared with May 2025.
Non-EU imports for May 2026 were £35.4 billion. This was an increase of £1.3 billion, or 4%, on April 2026, and an increase of £4.5 billion, or 14%, compared with May 2025.
Figure 3: Total UK monthly trade in goods with EU and non-EU, December 2024 to May 2026
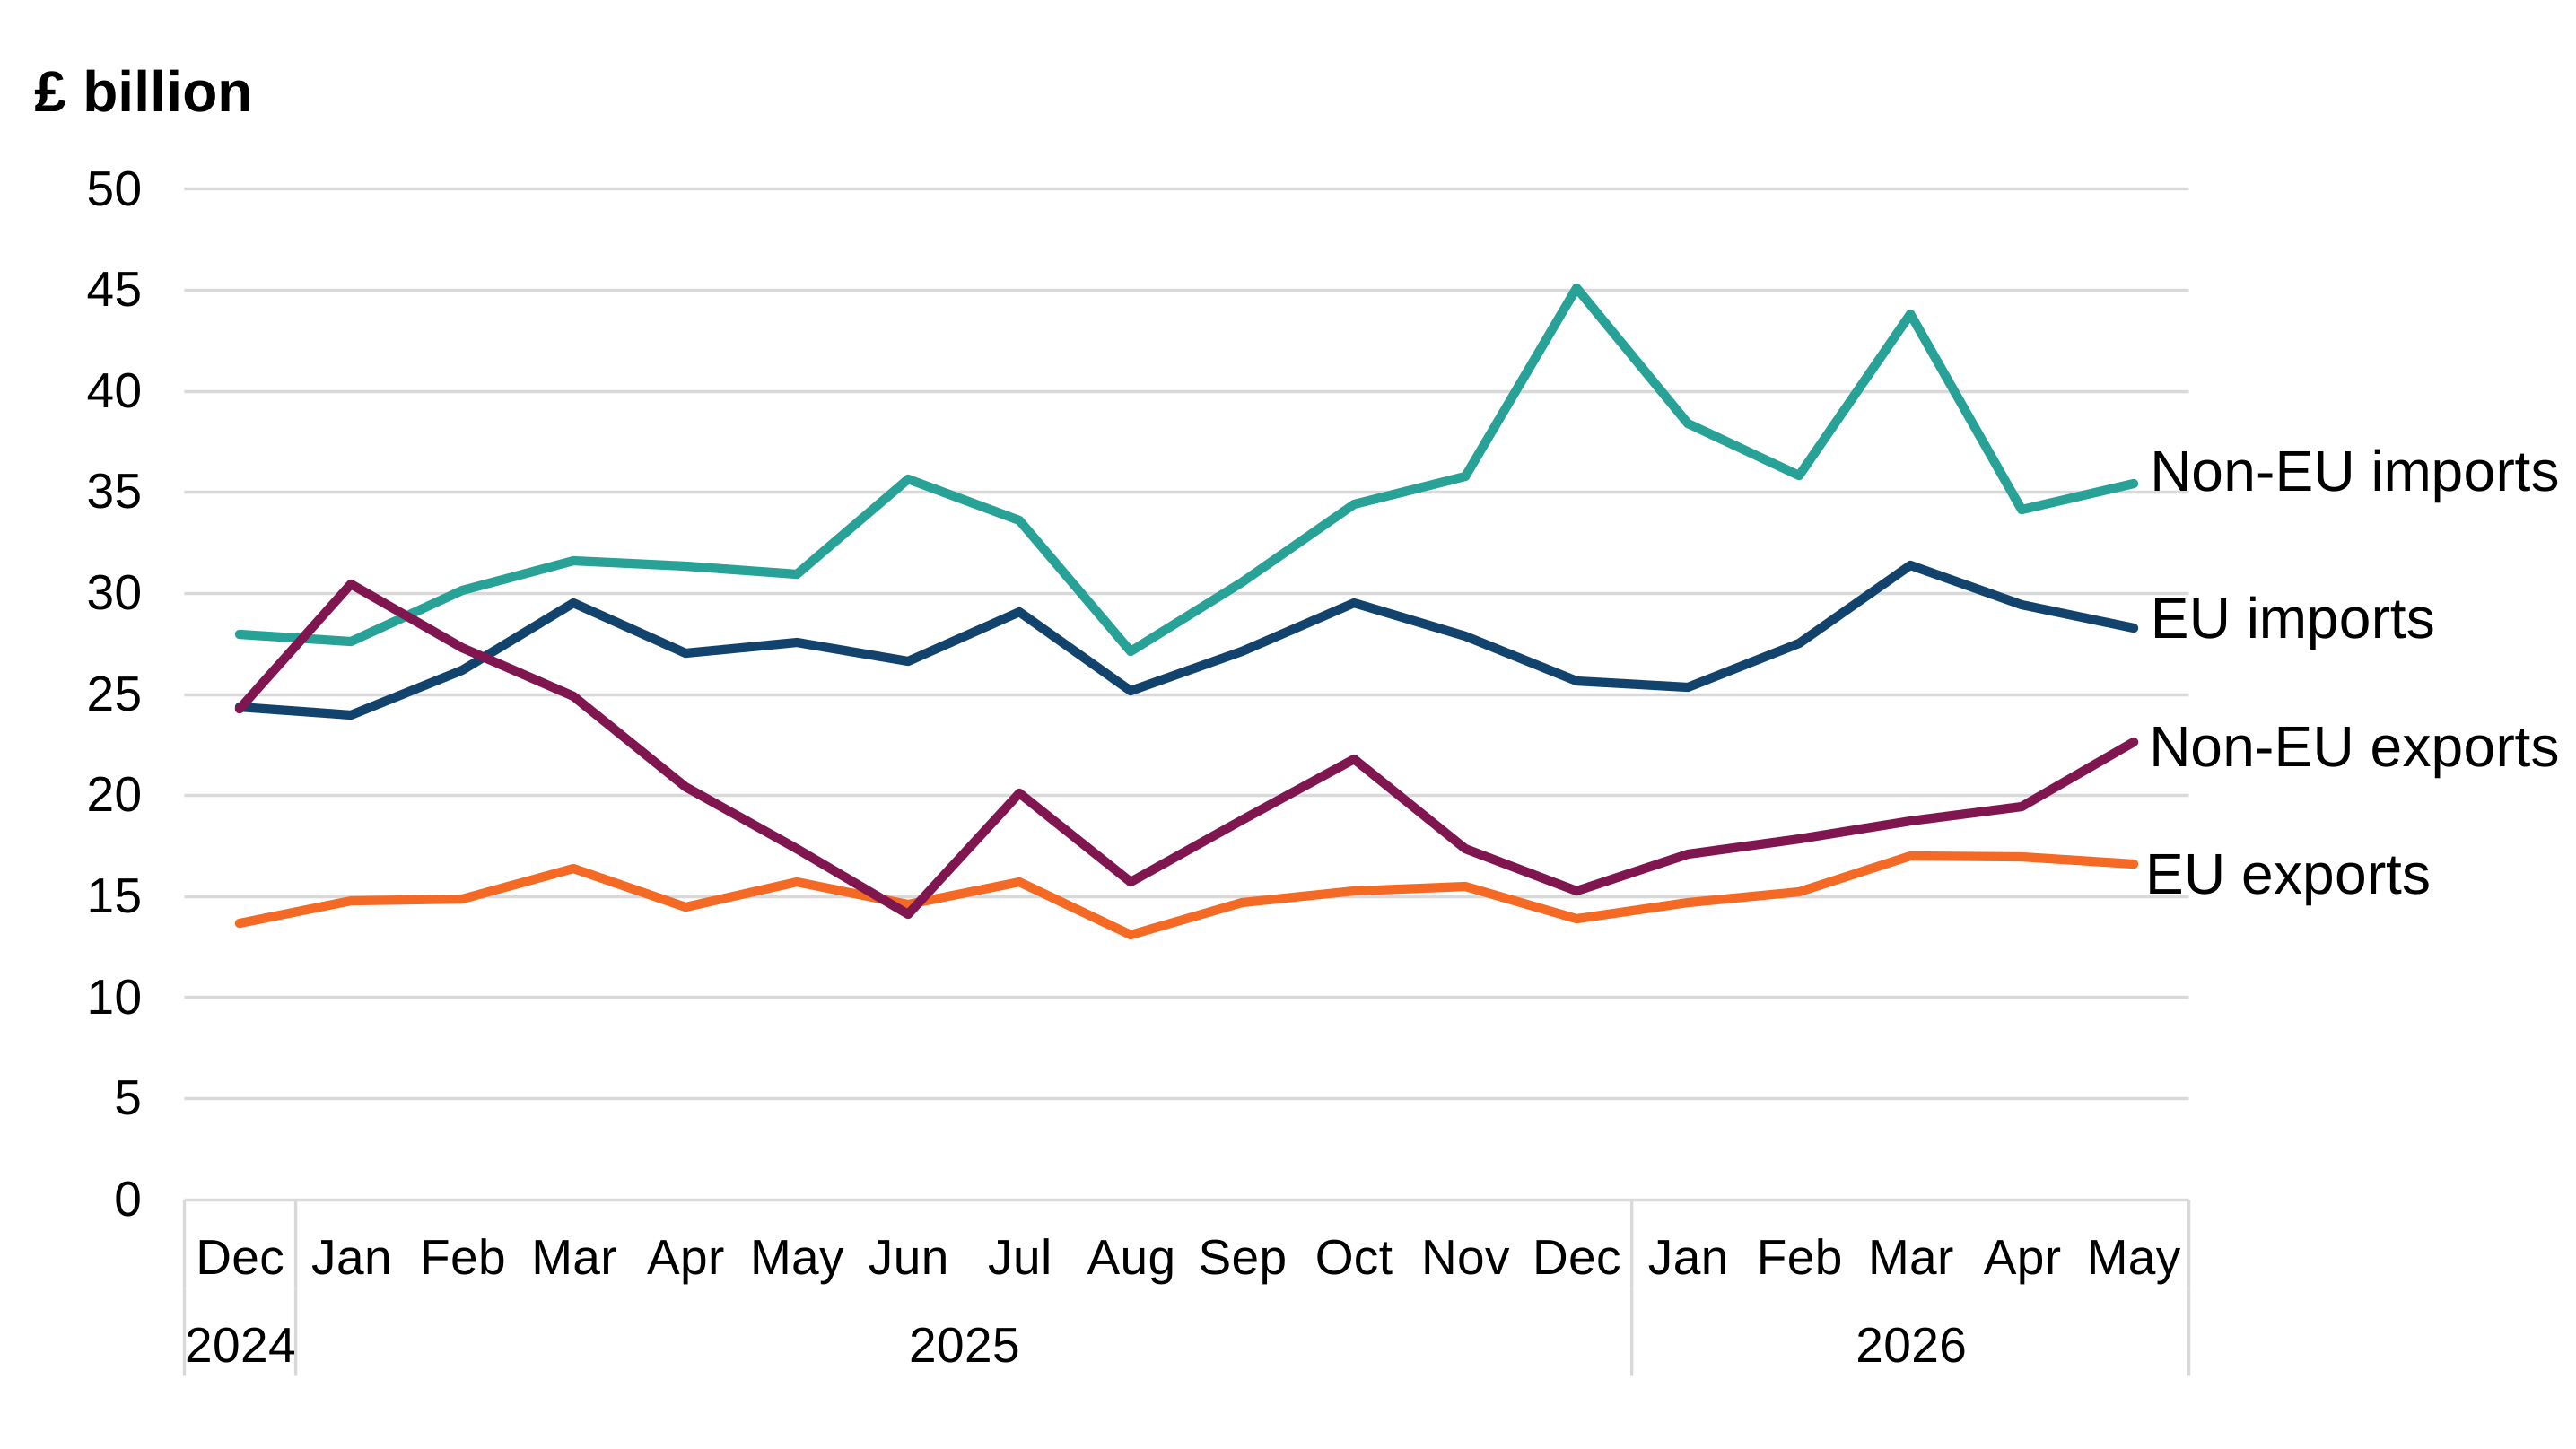
Figure 3 shows total exports and imports for EU and non-EU trade for the period from December 2024 to May 2026.
Source: UK overseas trade in goods statistics from HM Revenue & Customs
Note: 2025 and 2026 data is provisional.
EU exports decreased by £0.4 billion in May 2026, driven by Precious metals and Aircraft, partially offset by Mechanical appliances and Motor vehicles. Non-EU exports increased by £3.2 billion, driven by Precious metals.
EU imports decreased by £1.2 billion in May 2026, driven by Motor vehicles and Mechanical appliances. Non-EU imports increased by £1.3 billion, driven by Precious metals.
Exports: Country analysis
You can explore more UK export country data in the interactive data tables.
China had the largest value increase on April 2026, up 67%.
China had the largest value increase on May 2025, up to 2.5 times the value.
Table 3: UK exports of goods to the top 5 partner countries, value comparison with April 2026 and May 2025 (£ million)
| Partner country | May 2026 | April 2026 | May 2025 |
|---|---|---|---|
| China | 6,406 | 3,828 | 2,598 |
| USA | 4,929 | 4,076 | 4,390 |
| Germany | 3,111 | 3,022 | 2,718 |
| Netherlands | 2,690 | 2,527 | 2,245 |
| France | 2,187 | 2,718 | 2,078 |
Source: UK overseas trade in goods statistics from HM Revenue & Customs
Note: 2025 and 2026 data is provisional.
China rose to become the UK’s largest export partner country by value in May 2026, up from second. It had an increase in value on April 2026, up £2.6 billion. It also increased in value on May 2025, up £3.8 billion. Both increases were dominated by Precious metals.
The USA fell to second largest export partner in May 2026. This was despite an increase in value on April 2026, up £853 million. This was led by Precious metals and Inorganic chemicals. It also had an increase in value on May 2025, up £539 million. This was led by Mechanical appliances and Precious metals.
Germany remained the third largest export partner in May 2026. It had an increase in value on April 2026, up £89 million. This was driven by Mineral fuels and Pharmaceutical products, partially offset by Mechanical appliances. It also had an increase in value on May 2025, up £393 million. This was also led by Mineral fuels and Pharmaceutical products.
Figure 4: Historical export values for the top 3 export partner countries in May 2026
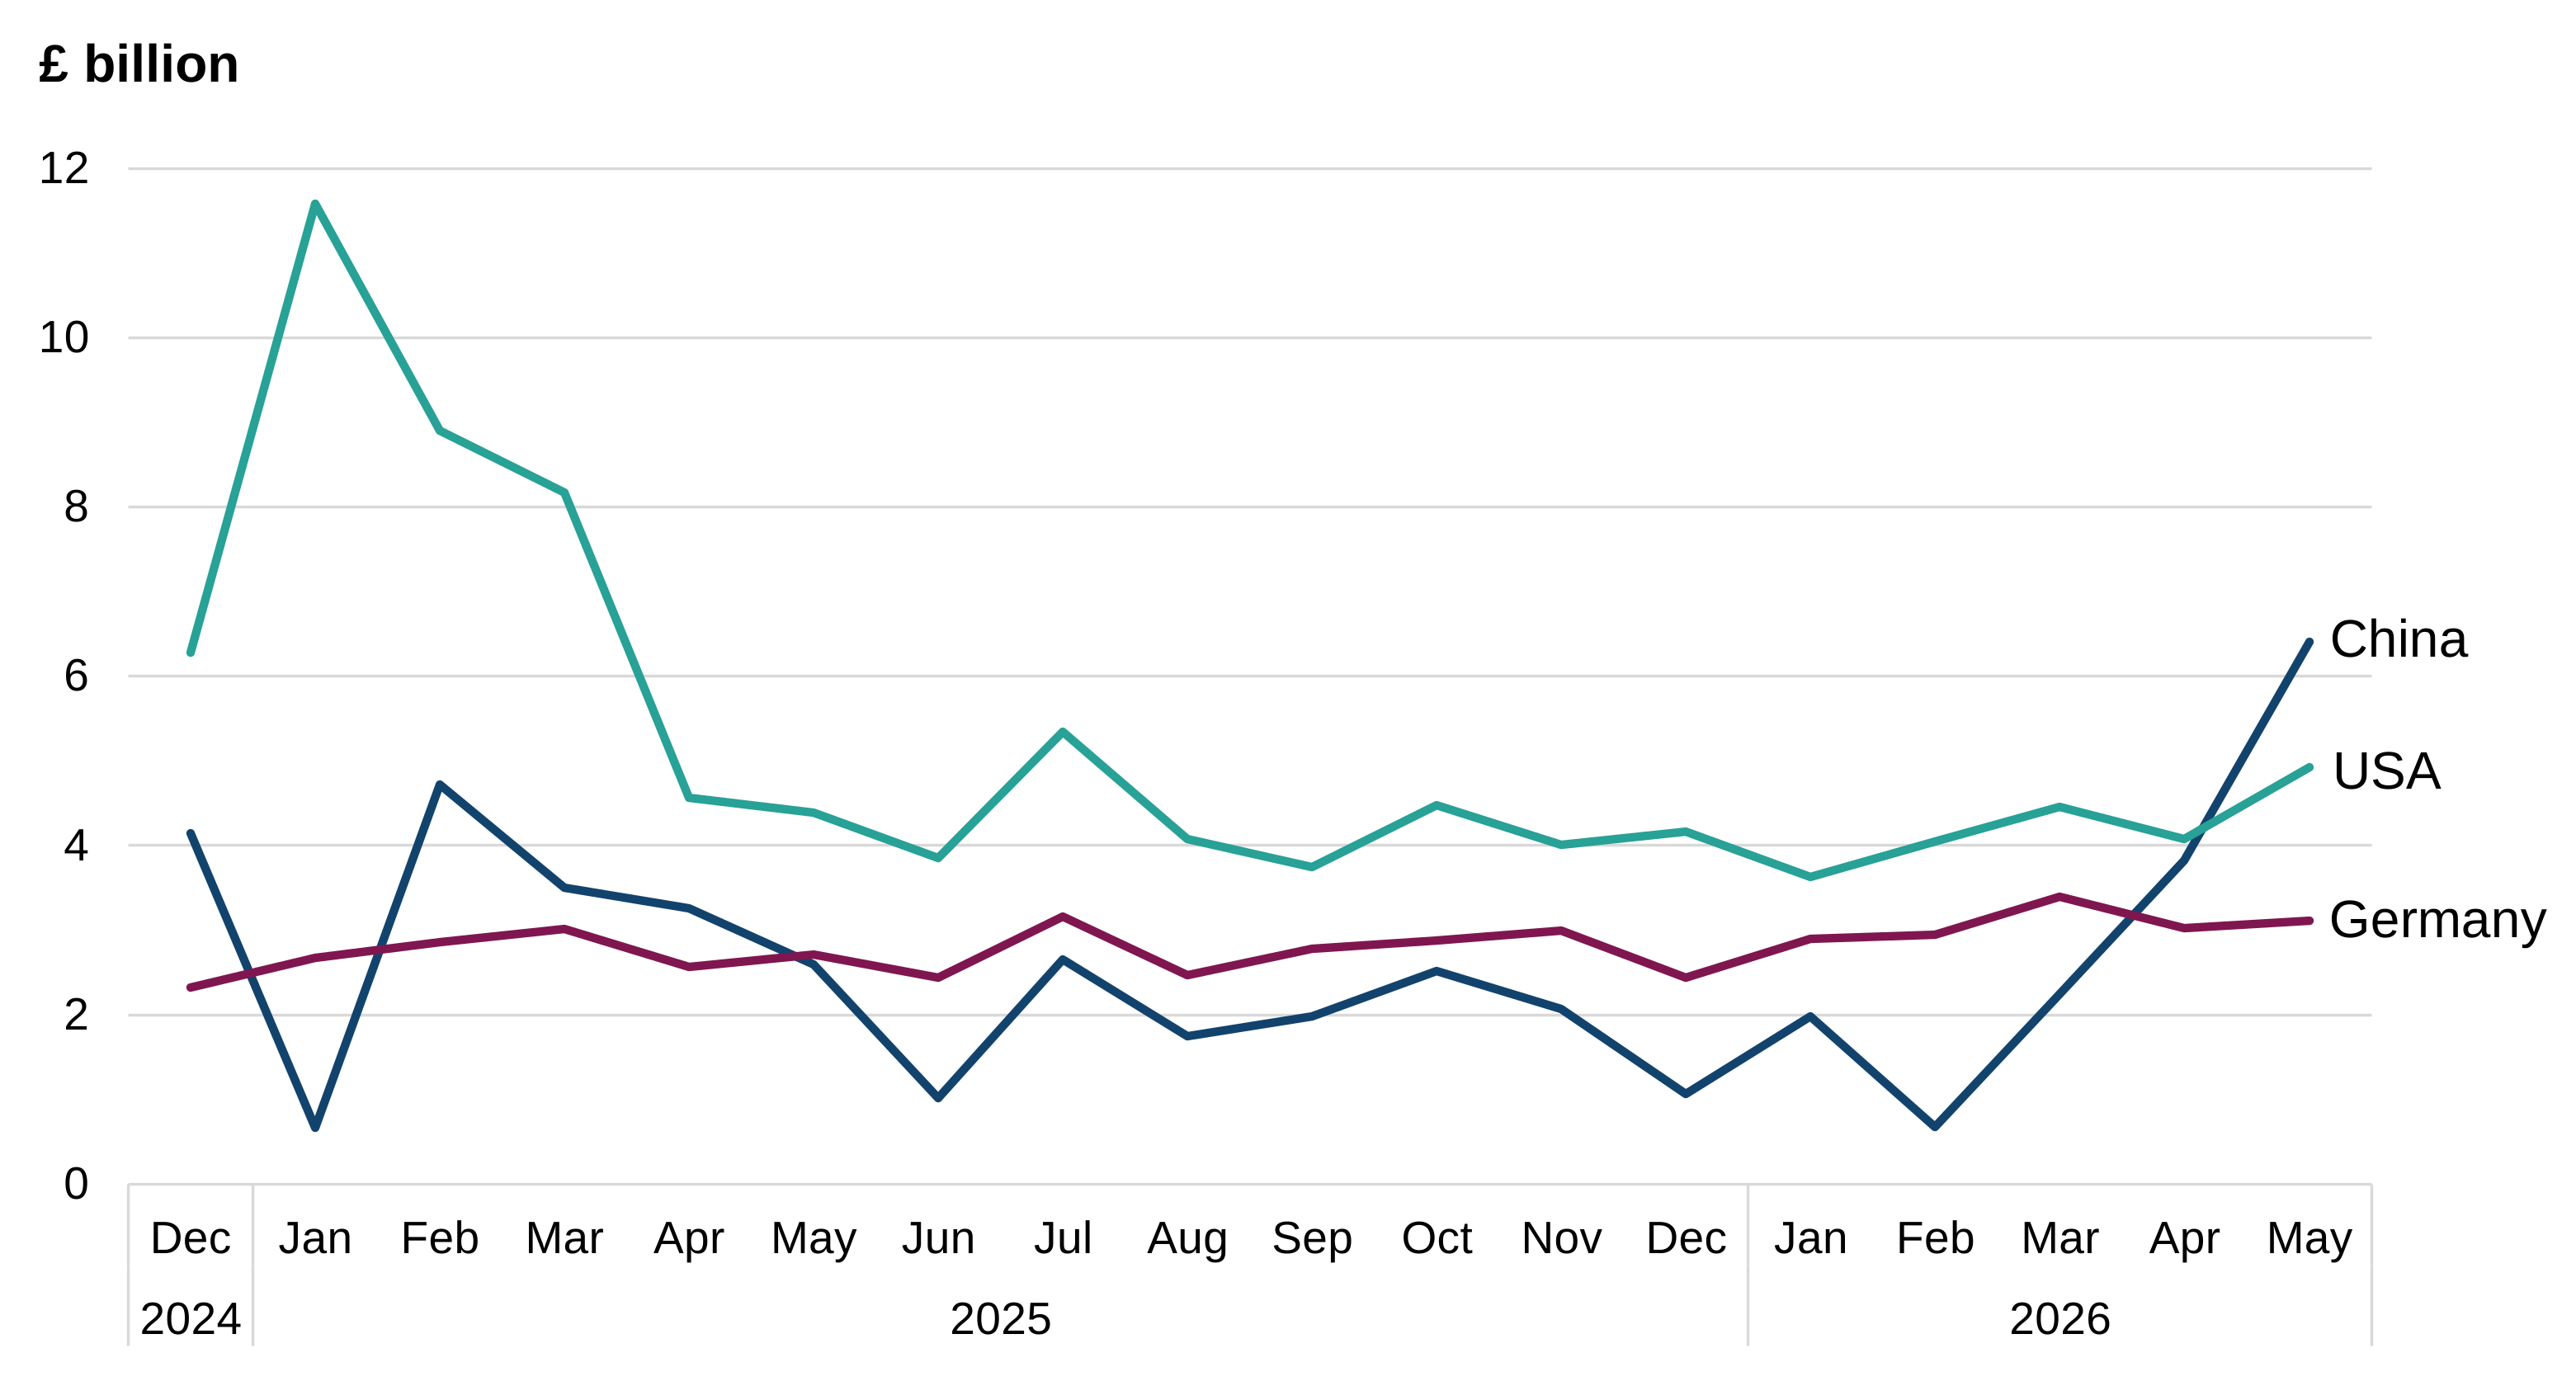
Figure 4 shows the values for the top 3 export partner countries in May 2026, from December 2024 to May 2026.
Source: UK overseas trade in goods statistics from HM Revenue & Customs
Note: 2025 and 2026 data is provisional.
China accounted for 16% of the UK’s total exports in May 2026. This was up from 11% in April 2026 and up from 8% in May 2025. The value of exports to China increased by 67% on April 2026 and to 2.5 times the value on May 2025. This took China to its highest monthly total for the period shown.
The USA accounted for 13% of the UK’s total exports in May 2026. This was up from 11% in April 2026 but unchanged from 13% in May 2025. The value of exports to the USA increased by 21% on April 2026 and increased by 12% on May 2025.
Germany accounted for 8% of the UK’s total exports in May 2026. This was unchanged on both April 2026 and May 2025. The value of exports to Germany increased by 3% on April 2026 and increased by 14% on May 2025.
Exports: Chapter analysis
You can explore more UK export chapter data in the interactive data tables.
Precious metals had the largest value increase on April 2026, up 24%.
Precious metals had the largest value increase on May 2025, more than doubling in value.
Table 4: UK exports of goods of the top 5 chapters, value comparison with April 2026 and May 2025 (£ million)
| Chapter | May 2026 | April 2026 | May 2025 |
|---|---|---|---|
| Precious metals | 8,284 | 6,704 | 3,899 |
| Mechanical appliances | 7,504 | 7,427 | 6,812 |
| Mineral fuels | 3,000 | 3,116 | 2,667 |
| Motor vehicles | 2,797 | 2,325 | 2,693 |
| Electronic equipment | 2,355 | 2,333 | 2,070 |
Source: UK overseas trade in goods statistics from HM Revenue & Customs
Note: 2025 and 2026 data is provisional.
Precious metals rose to become the UK’s top export chapter in May 2026, up from second. It had an increase in value on April 2026, up £1.6 billion. This was dominated by China, partially offset by Hong Kong and France. It also had an increase in value on May 2025, up £4.4 billion. This was dominated by China.
Mechanical appliances fell to second place in May 2026. This was despite an increase in value on April 2026, up £77 million. This was driven by the Netherlands, partially offset by Iceland. It also had an increase in value on May 2025, up £692 million. This was led by the Netherlands, France, and the USA.
Mineral fuels remained in third place in May 2026. It had a decrease in value on April 2026, down £117 million. This was driven by Spain and China, partially offset by Germany and France. In contrast it had an increase in value on May 2025, up £332 million. This was driven by the Netherlands, Germany, and France, partially offset by Poland and China.
Figure 5: Historical export values for the top 3 export chapters in May 2026
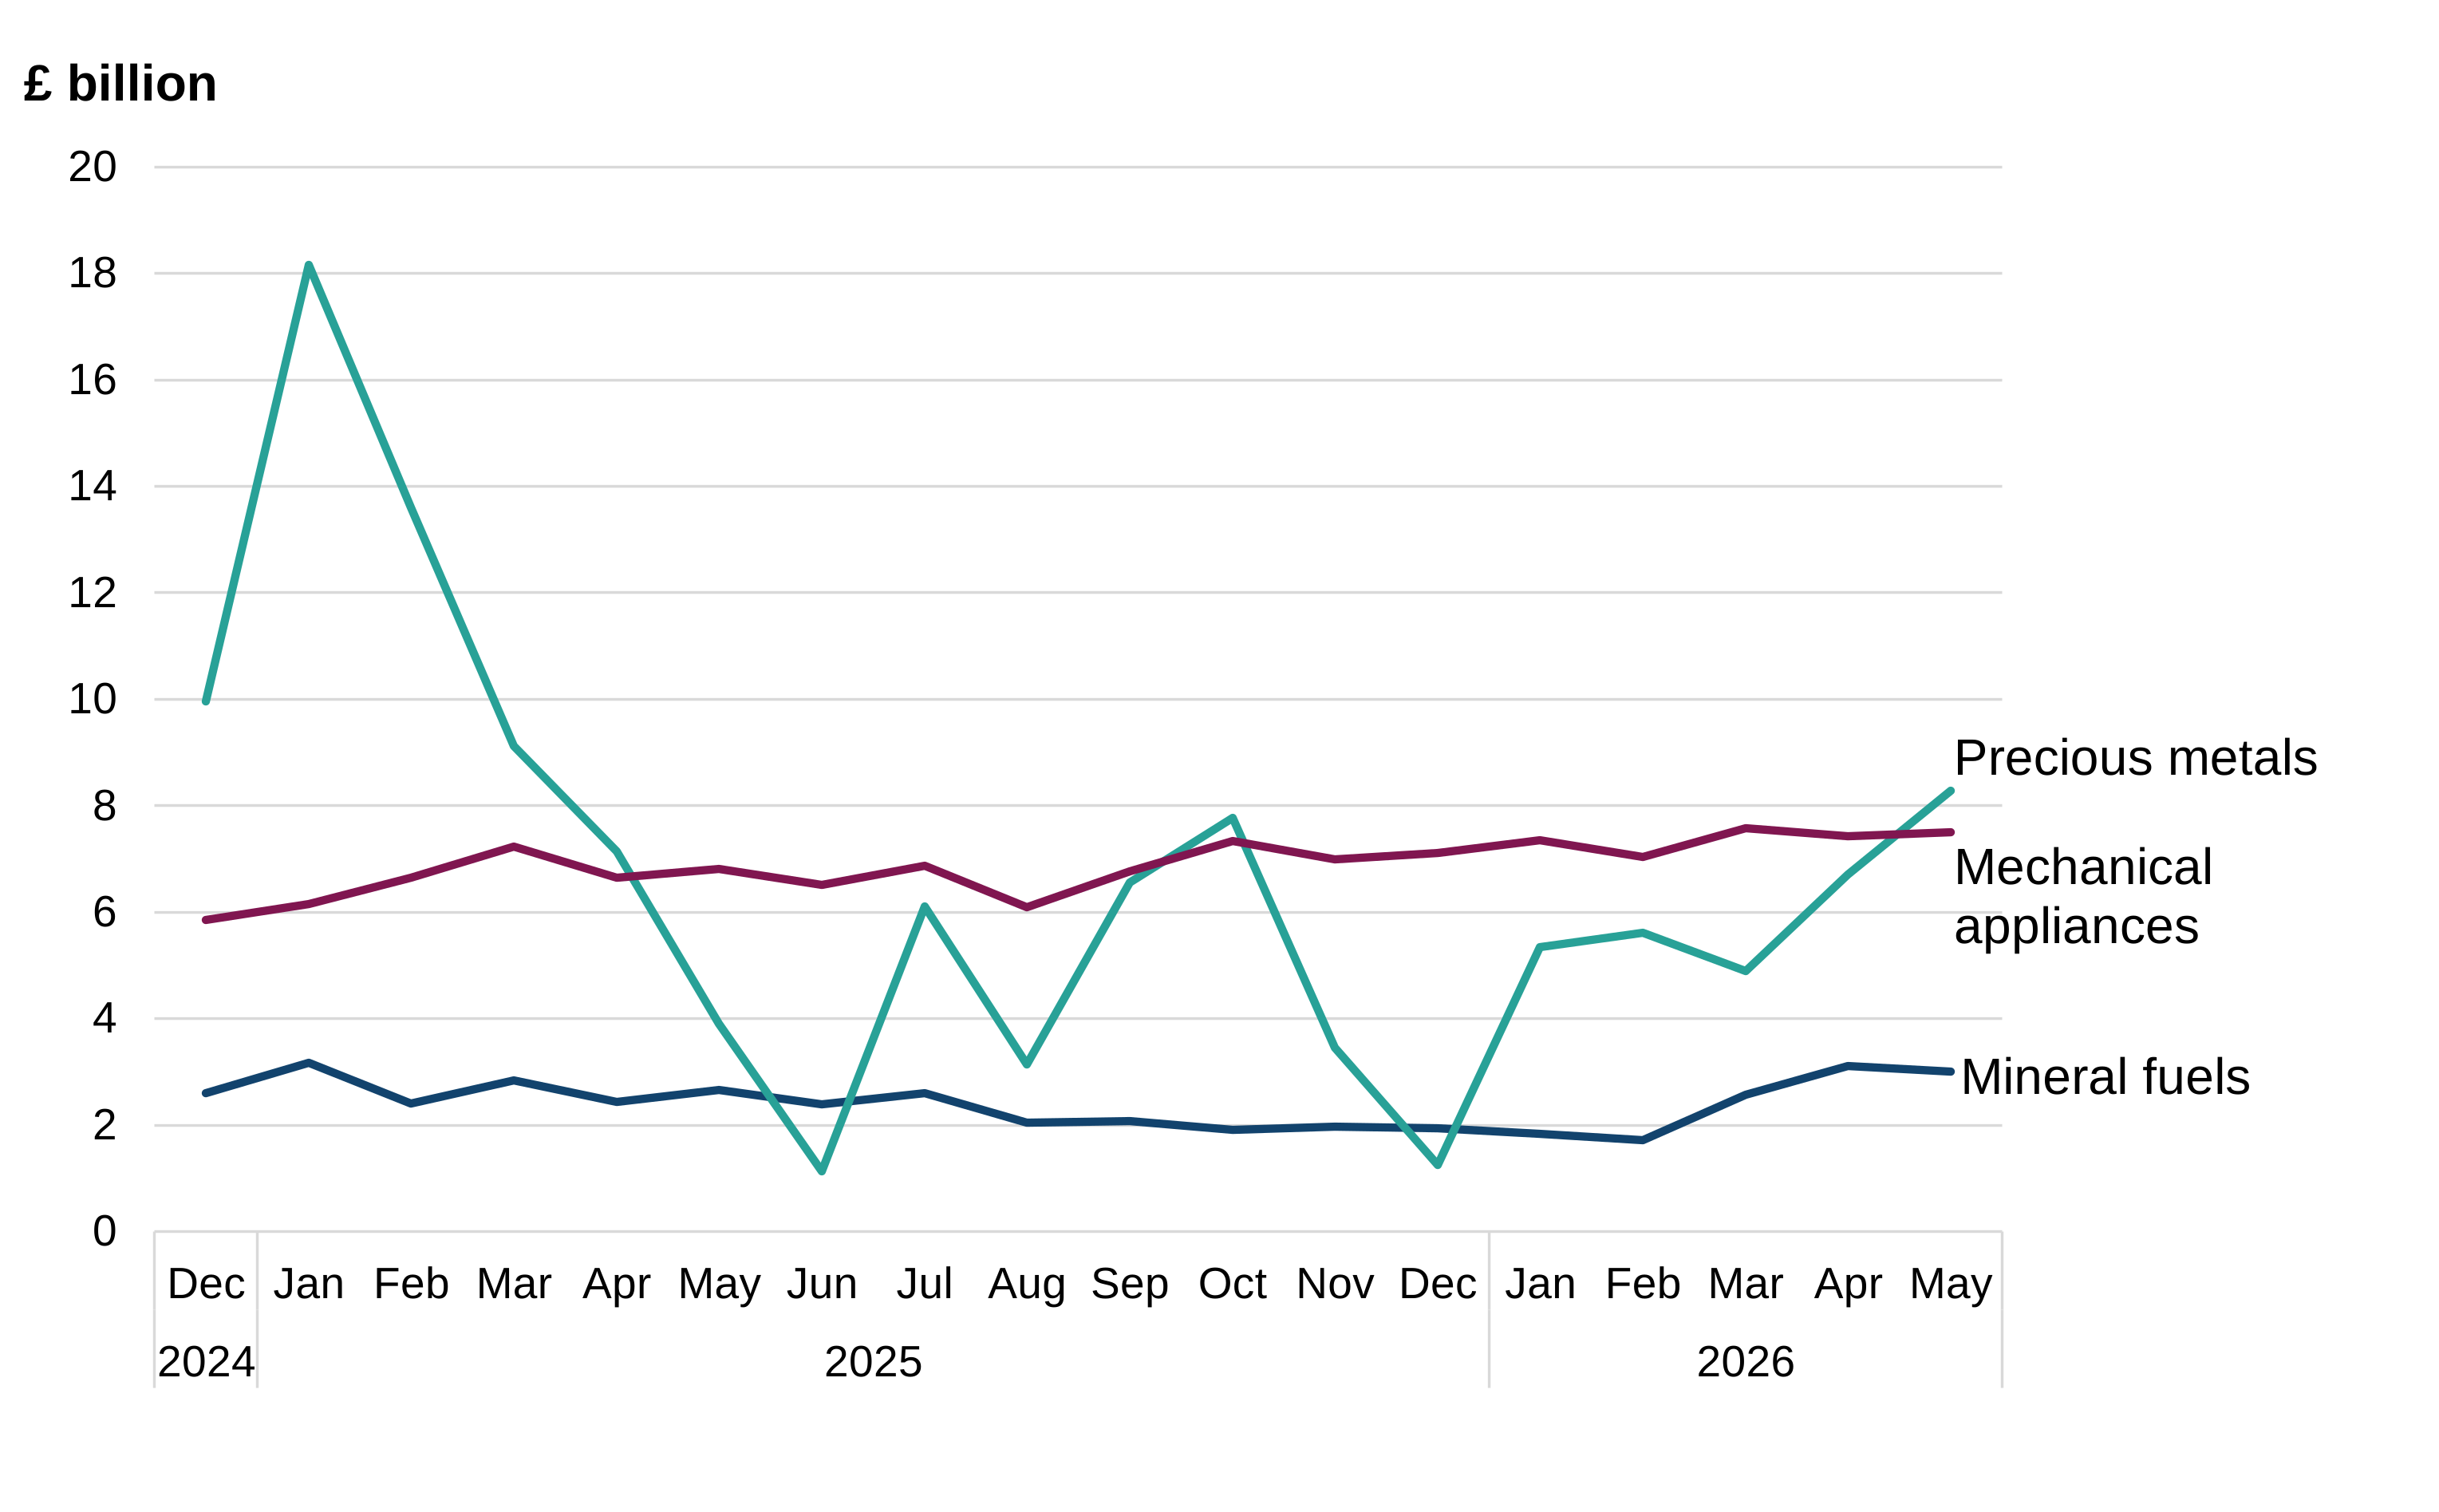
Figure 5 shows the values for the top 3 export chapters in May 2026, from December 2024 to May 2026.
Source: UK overseas trade in goods statistics from HM Revenue & Customs
Download figure 5: Historical export values for the top 3 export chapters in May 2026 (ODS, 12.6 KB)
Note: 2025 and 2026 data is provisional.
Precious metals accounted for 21% of the UK’s total exports in May 2026. This was up from 18% in April 2026, and from 12% in May 2025. The value of exports of Precious metals increased by 24% on April 2026 and increased to more than double the value on May 2025.
Mechanical appliances accounted for 19% of the UK’s total exports in May 2026, down from 20% in April 2026, and from 21% in May 2025. The value of exports of Mechanical appliances increased by 1% on April 2026 and increased by 10% on May 2025.
Mineral fuels accounted for 8% of the UK’s total exports in May 2026. This was down from 9% in April 2026, but unchanged on May 2025. The value of exports of Mineral fuels decreased by 4% on April 2026 but increased by 12% on May 2025.
Imports: Country analysis
You can explore more UK import country data in the interactive data tables.
Switzerland had the largest value increase on April 2026, up 40%.
Switzerland had the largest value increase on May 2025, to more than 2.5 times the value.
Table 5: UK imports of goods from the top 5 partner countries, value comparison with April 2026 and May 2025 (£ million)
| Partner country | May 2026 | April 2026 | May 2025 |
|---|---|---|---|
| Germany | 5,873 | 6,430 | 6,456 |
| USA | 5,541 | 6,314 | 6,082 |
| Switzerland | 5,496 | 3,927 | 2,074 |
| China | 5,194 | 5,341 | 5,006 |
| Netherlands | 4,199 | 4,741 | 4,250 |
Source: UK overseas trade in goods statistics from HM Revenue & Customs
Note: 2025 and 2026 data is provisional.
Germany remained the UK’s largest import partner in May 2026. This was despite it having a decrease in value on April 2026, down £557 million. This was dominated by Motor vehicles, partially offset by Aircraft. It also had a decrease in value on May 2025, down £583 million. This was driven by Motor vehicles and Precious metals, partially offset by Aircraft.
The USA remained the second largest import partner in May 2026. It had a decrease in value on April 2026, down £772 million. This was driven by Precious metals, Aircraft, and Mineral fuels. It also had a decrease in value on May 2025, down £541 million. This was dominated by Precious metals and Mechanical appliances, partially offset by Mineral fuels.
Switzerland became the third largest import partner in May 2026, up from fifth. It had an increase in value on April 2026, up £1.6 billion. It also had an increase in value on May 2025, up £3.4 billion. Both changes were dominated by Precious metals.
Figure 6: Historical import values for the top 3 import partner countries in May 2026
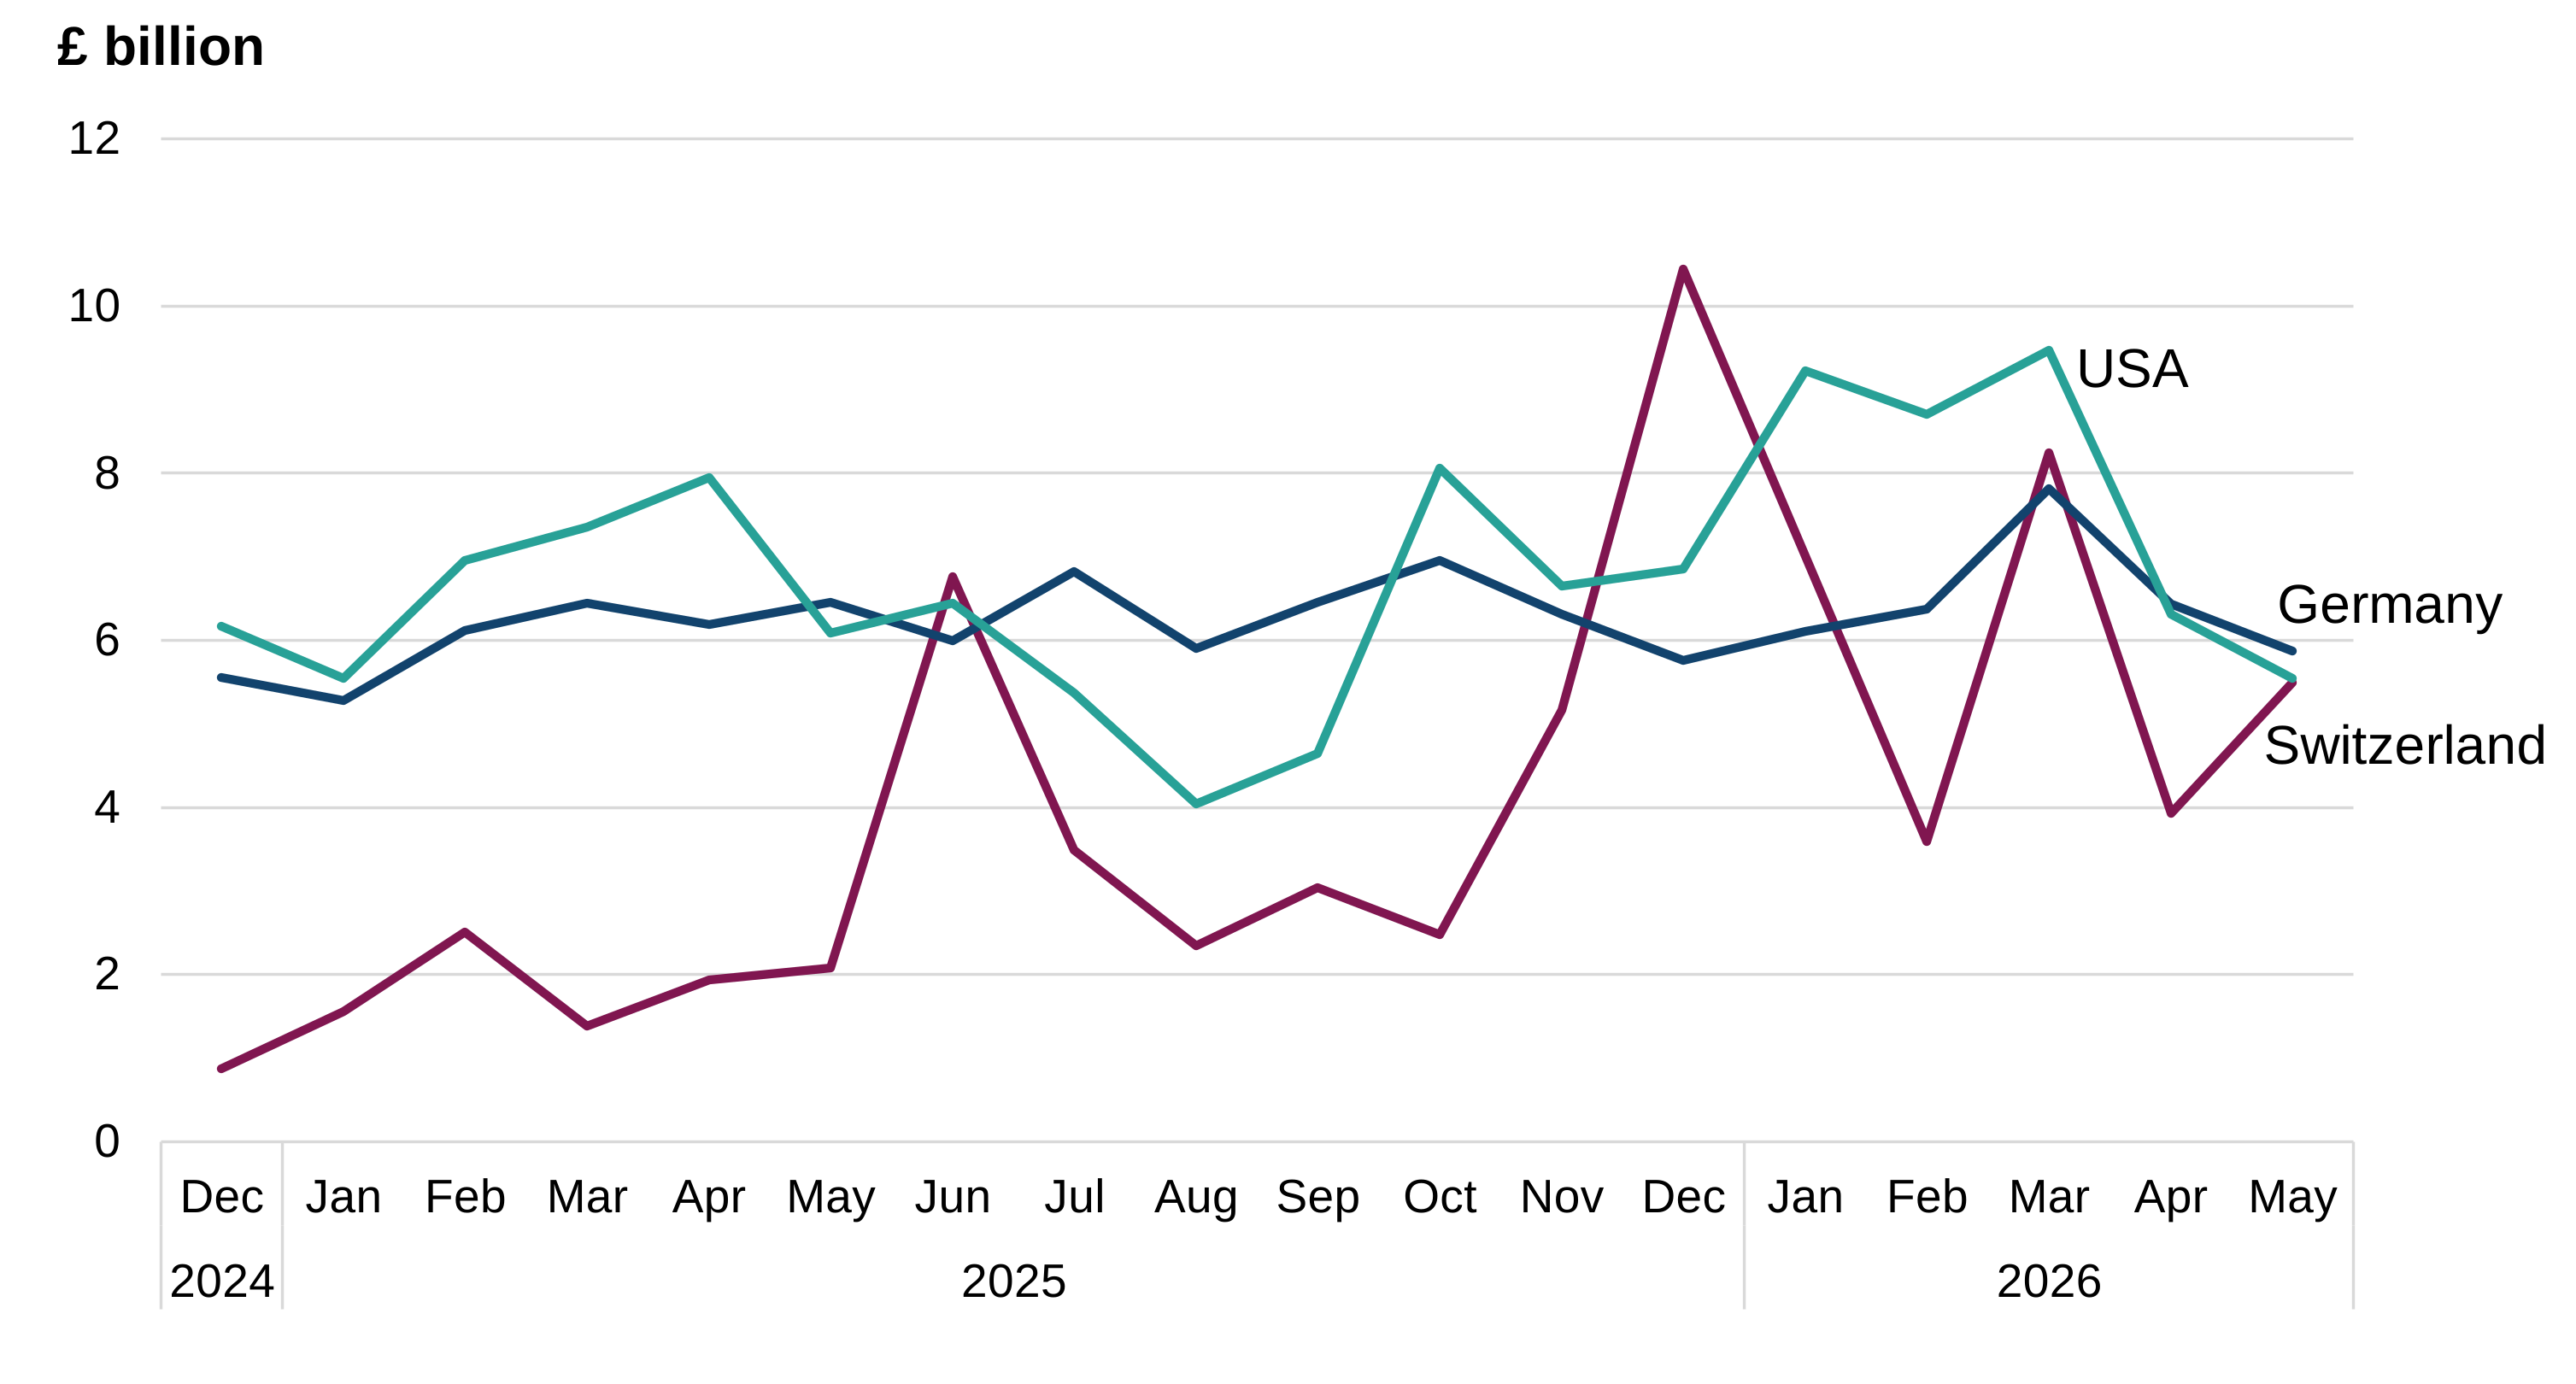
Figure 6 shows the values for the top 3 import partner countries in May 2026, from December 2024 to May 2026.
Source: UK overseas trade in goods statistics from HM Revenue & Customs
Note: 2025 and 2026 data is provisional.
Germany accounted for 9% of the UK’s total imports in May 2026. This was down from 10% in April 2026 and from 11% in May 2025. The value of imports from Germany decreased by 9% on both April 2026 and May 2025.
The USA accounted for 9% of the UK’s total imports in May 2026. This was down from 10% in both April 2026 and May 2025. The value of imports from the USA decreased by 12% on April 2026 and decreased by 9% on May 2025.
Switzerland accounted for 9% of the UK’s total imports in May 2026. This was up from 6% in April 2026 and up from 4% in May 2025. The value of imports from Switzerland increased by 40% on April 2026 and increased to more than 2.5 times the value on May 2025.
Imports: Chapter analysis
You can explore more UK import chapter data in the interactive data tables.
Precious metals had the largest value increase on April 2026, up 8%.
Mineral fuels had the largest value increase on May 2025, up 59%.
Table 6: UK imports of goods of the top 5 chapters, value comparison with April 2026 and May 2025 (£ million)
| Chapter | May 2026 | April 2026 | May 2025 |
|---|---|---|---|
| Precious metals | 12,594 | 11,684 | 10,221 |
| Mechanical appliances | 8,031 | 8,195 | 7,403 |
| Mineral fuels | 6,391 | 6,401 | 4,016 |
| Motor vehicles | 5,565 | 6,315 | 5,741 |
| Electronic equipment | 4,919 | 5,194 | 4,666 |
Source: UK overseas trade in goods statistics from HM Revenue & Customs
Note: 2025 and 2026 data is provisional.
Precious metals remained the UK’s top import chapter in May 2026. It had an increase in value on April 2026, up £910 million. This was dominated by Switzerland and the Philippines, partially offset by Uzbekistan. It also had an increase in value on May 2025, up £2.4 billion. This was dominated by Switzerland and South Africa, partially offset by the USA.
Mechanical appliances remained the UK’s second largest import chapter in May 2026. It had a decrease in value on April 2026, down £164 million. This was led by Ireland and France, partially offset by Saudi Arabia. In contrast, imports of Mechanical appliances increased in value on May 2025, up £628 million. This was driven by Ireland, Saudi Arabia, and the UAE, partially offset by the USA.
Mineral fuels remained the UK’s third largest import chapter in May 2026. It had a decrease in value on April 2026, down £10 million. This was dominated by the Netherlands, partially offset by Nigeria. In contrast, imports of Mineral fuels increased in value on May 2025, up £2.4 billion. This was led by the USA, Norway, and Canada.
Figure 7: Historical import values for the top 3 import chapters in May 2026
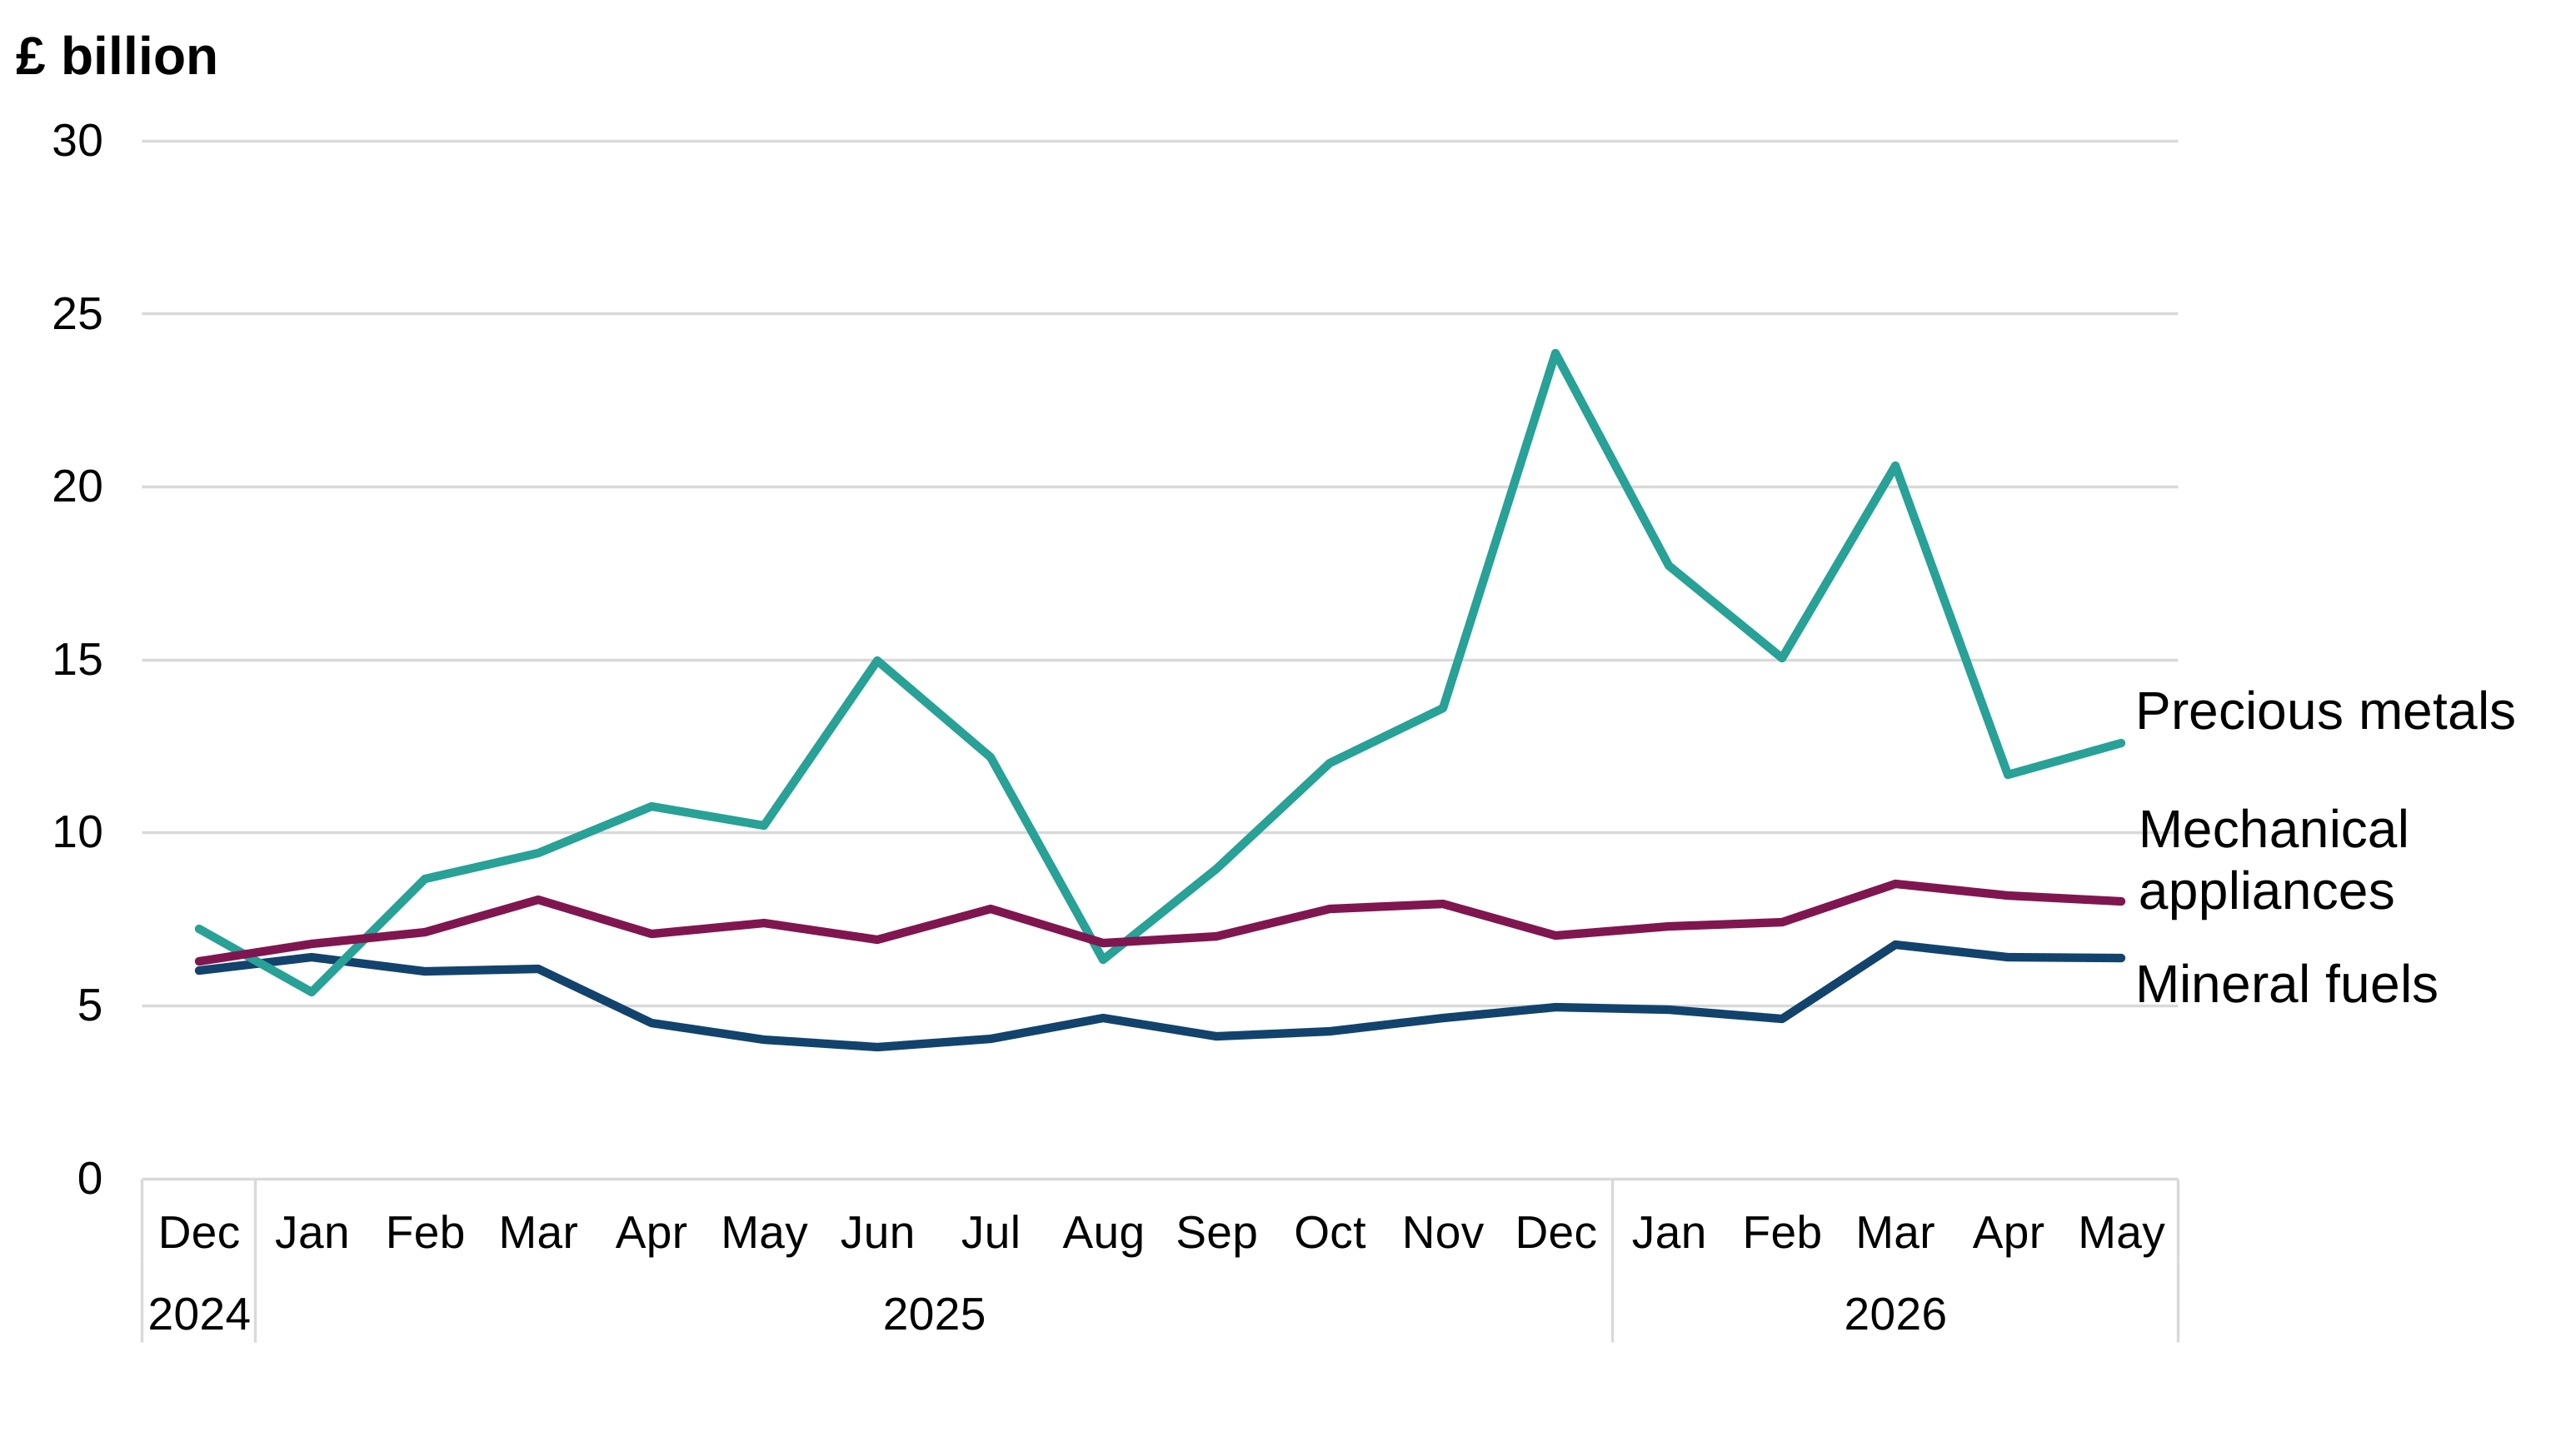
Figure 7 shows the values for the top 3 import chapters in May 2026, from December 2024 to May 2026.
Source: UK overseas trade in goods statistics from HM Revenue & Customs
Download figure 7: Historical import values for the top 3 import chapters in May 2026 (ODS, 12.9 KB)
Note: 2025 and 2026 data is provisional.
Precious metals accounted for 20% of the UK’s total imports in May 2026. This was up from 18% in April 2026 and up from 17% in May 2025. The value of imports of Precious metals increased by 8% on April 2026 and increased by 23% on May 2025.
Mechanical appliances accounted for 13% of the UK’s total imports in May 2026. This was unchanged on April 2026 and May 2025. The value of imports of Mechanical appliances decreased by 2% on April 2026 but increased by 8% on May 2025.
Mineral fuels accounted for 10% of the UK’s total imports in May 2026. This was unchanged on April 2026 and up from 7% in May 2025. The value of imports of Mineral fuels decreased by less than 1% on April 2026 but increased by 59% on May 2025.
Focus
Table 7: UK exports of Motor vehicles, value comparison with April 2026
| Partner country |
May 2026 (£ million) |
April 2026 (£ million) |
Change (£ million) |
Change (%) |
|---|---|---|---|---|
| China | 253 | 125 | 128 | 103 |
| USA | 601 | 539 | 62 | 11 |
Source: UK overseas trade in goods statistics from HM Revenue & Customs
Download table 7: UK exports of Motor vehicles, value comparison with April 2026 (ODS, 11.4 KB)
Note: 2025 and 2026 data is provisional.
In May 2026, UK exports of Motor vehicles had the second largest value increase of all chapters on April 2026. This was an increase of £472 million, or 20%.
Between April 2026 and May 2026, exports of Motor vehicles to China rose by the largest amount, £128 million, doubling in value.
Exports of Motor vehicles to the USA rose by £62 million, or 11%.
There were also smaller increases for several other countries.
Table 8: UK imports of Mineral fuels, value comparison with April 2026
| Partner country |
May 2026 (£ million) |
April 2026 (£ million) |
Change (£ million) |
Change (%) |
|---|---|---|---|---|
| Netherlands | 682 | 1,081 | -399 | -37 |
| USA | 1,378 | 1,490 | -112 | -8 |
| Saudi Arabia | 0 | 105 | -105 | -100 |
| Nigeria | 323 | 0 | 323 | not applicable |
| Canada | 362 | 213 | 150 | 70 |
Download table 8: UK imports of Mineral fuels, value comparison with April 2026 (ODS, 11.6 KB)
Note: 2025 and 2026 data is provisional.
In May 2026, UK imports of Mineral fuels decreased by £10 million on April 2026, or less than 1%. Despite this marginal decrease, import values from several countries increased and decreased notably, with these opposing changes largely offsetting one another.
Between April 2026 and May 2026, imports of Mineral fuels from the Netherlands decreased by the largest amount, £399 million, or 37%.
Imports of Mineral fuels from the USA decreased by £112 million, or 8%.
Imports of Mineral fuels from Saudi Arabia decreased by £105 million to zero in May 2026.
In contrast, imports of Mineral fuels from Nigeria increased by £323 million from zero in April 2026.
Imports of Mineral fuels from Canada increased by £150 million, or 70%.