UK overseas trade in goods statistics June 2026: commentary
Published 13 August 2026

© Crown copyright 2026
This publication is licensed under the terms of the Open Government Licence v3.0 except where otherwise stated. To view this licence, visit nationalarchives.gov.uk/doc/open-government-licence/version/3 or write to the Information Policy Team, The National Archives, Kew, London TW9 4DU, or email: psi@nationalarchives.gov.uk.
Where we have identified any third party copyright information you will need to obtain permission from the copyright holders concerned.
This publication is available at https://www.gov.uk/government/statistics/uk-overseas-trade-in-goods-statistics-june-2026/uk-overseas-trade-in-goods-statistics-june-2026-commentary
Trade in goods summary
Data behind this bulletin is available through the UK Trade Info website, where users can build their own tables according to the countries, commodities, and ports selected.
For more information on how we compile the trade in goods statistics, users must refer to the accompanying methodology notes. Further information about trade in non-monetary gold (NMG) can be found in the monthly gold table.
Total exports of goods for June 2026
£37.2 billion down £1.8 billion, or 5%, on May 2026, up £8.5 billion, or 30%, on June 2025
Total imports of goods for June 2026
£64.4 billion up £0.7 billion, or 1%, on May 2026, up £2.1 billion, or 3%, on June 2025
Source: UK overseas trade in goods statistics from HM Revenue & Customs
Note: 2026 data is provisional.
The UK was a net importer this month, with imports exceeding exports by £27.2 billion, widening the trade balance by £2.6 billion compared with May 2026.
Figure 1: Total UK monthly trade in goods, January 2025 to June 2026
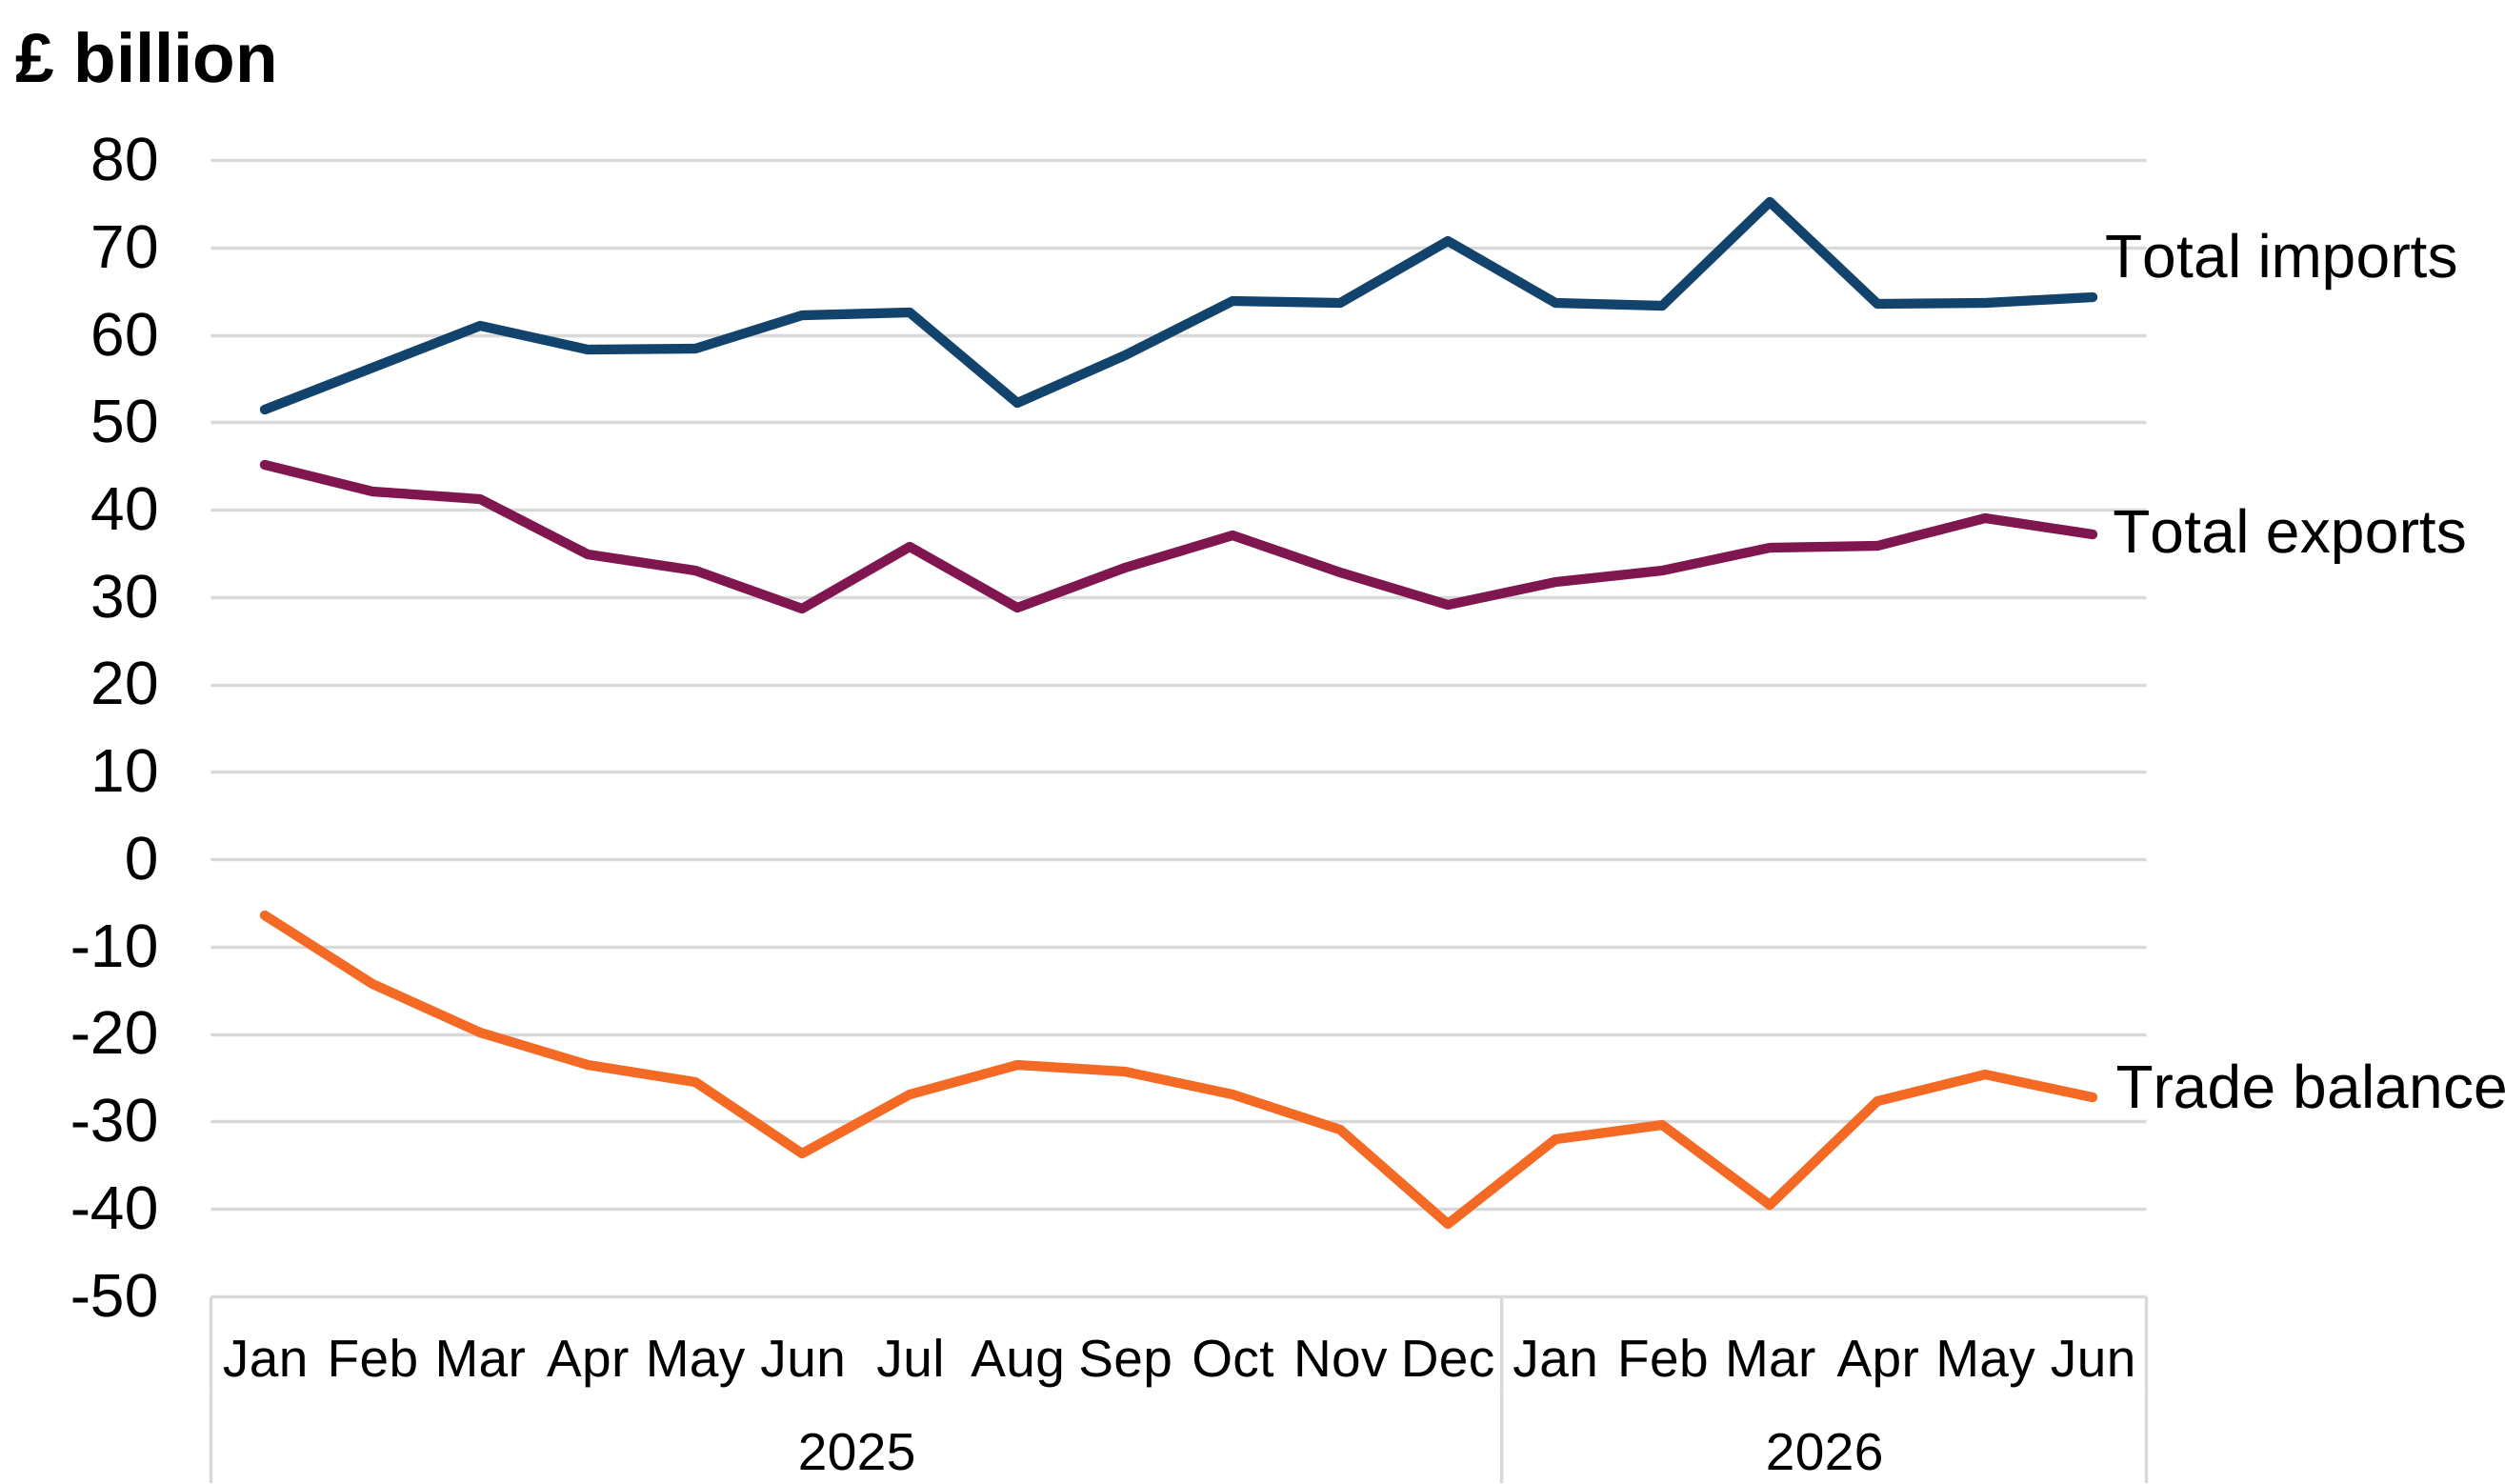
Figure 1 shows total exports, imports and the trade balance for the period from January 2025 to June 2026.
Source: UK overseas trade in goods statistics from HM Revenue & Customs
Download figure 1: Total UK monthly trade in goods, January 2025 to June 2026 (ODS, 10.3 KB)
Note: 2026 data is provisional.
In June 2026, imports increased while exports decreased. As a result of this, the trade balance widened.
Impact of non-monetary gold (NMG)
Movements in NMG can be large and highly volatile, impacting underlying trends in trade figures. More information can be found in the accompanying methodology notes and in the monthly gold table.
Figure 2: Total UK monthly trade in goods including and excluding NMG, January 2025 to June 2026
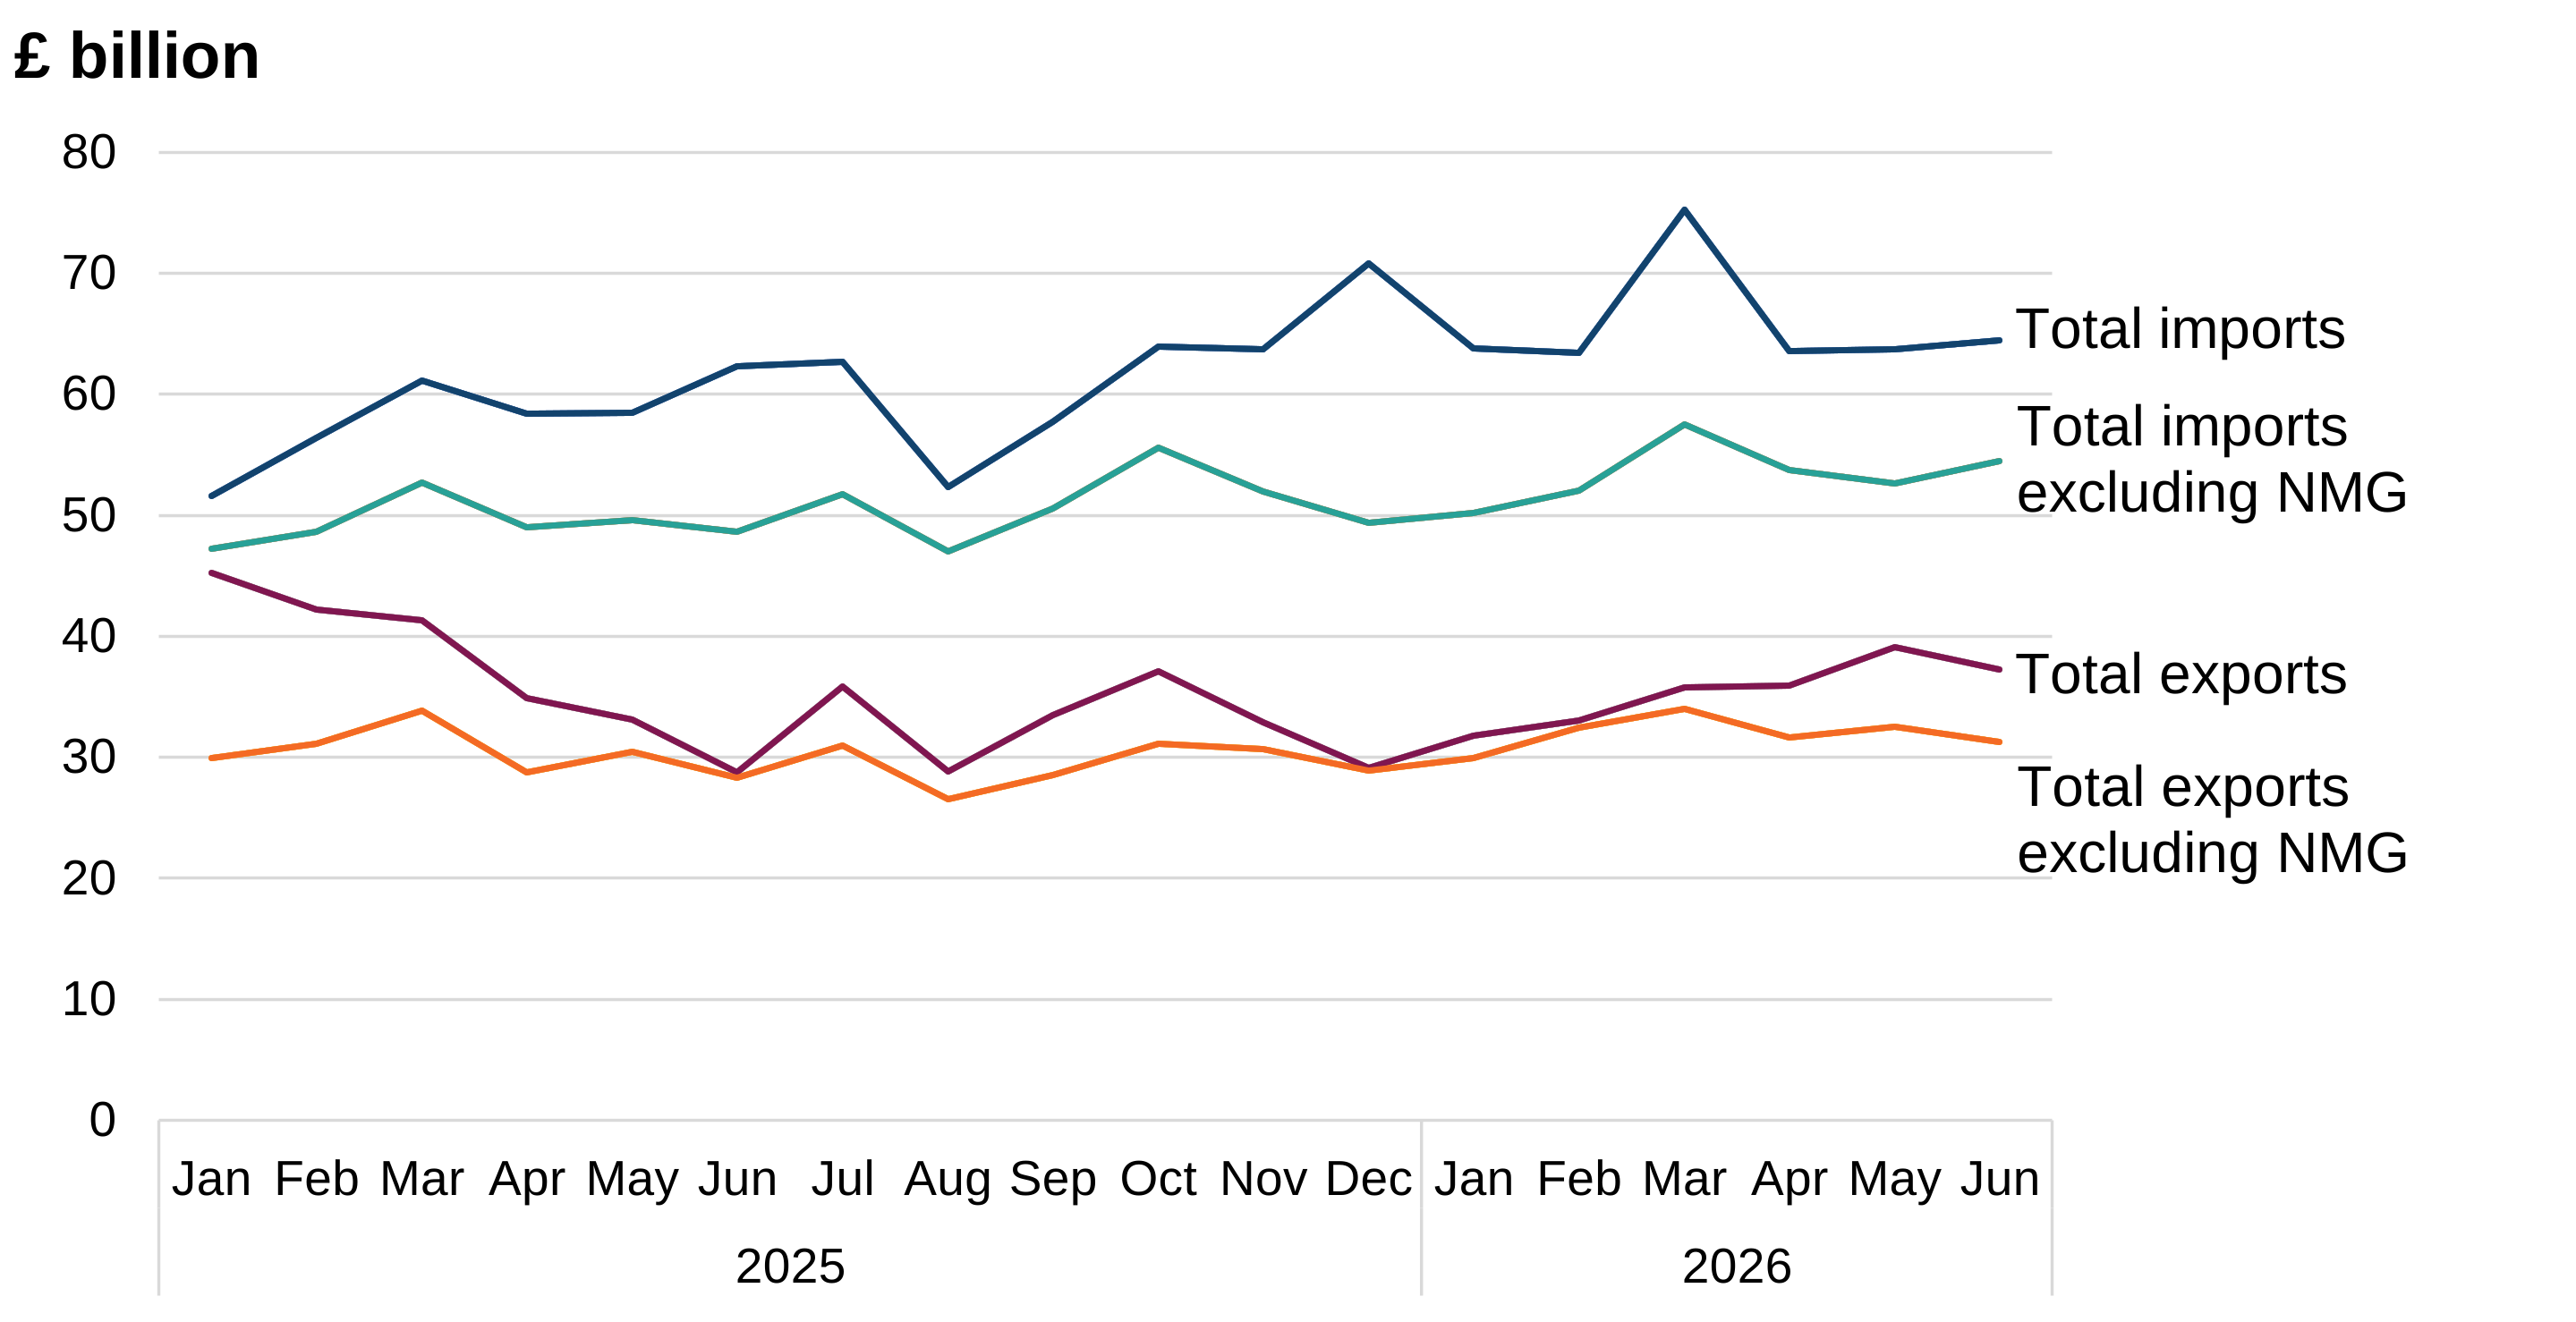
Figure 2 shows exports and imports including and excluding non-monetary gold for the period from January 2025 to June 2026.
Source: UK overseas trade in goods statistics from HM Revenue & Customs
Note: 2026 data is provisional.
NMG exports decreased by £0.6 billion in June 2026, whilst all other exports decreased by £1.3 billion.
NMG imports decreased by £1.1 billion in June 2026, whilst all other imports increased by £1.8 billion.
EU and non-EU trade in goods
Exports to the EU accounted for 43% of the total value of exports, or 51% when excluding NMG.
Imports from the EU accounted for 48% of the total value of imports, or 55% when excluding NMG.
Table 1: Total UK trade in goods with EU and non-EU, including and excluding the impact of NMG, June 2026 (£ billion)
| Flow | EU |
EU excl. NMG |
Non-EU |
Non-EU excl. NMG |
Total | Total excl. NMG |
|---|---|---|---|---|---|---|
| Exports | 16.1 | 15.9 | 21.1 | 15.3 | 37.2 | 31.3 |
| Imports | 30.7 | 29.7 | 33.7 | 24.7 | 64.4 | 54.5 |
Source: UK overseas trade in goods statistics from HM Revenue & Customs
Note: 2026 data is provisional.
EU exports for June 2026 were £16.1 billion. This was a decrease of £0.6 billion, or 3%, on May 2026, but an increase of £1.5 billion, or 10%, compared with June 2025.
Non-EU exports for June 2026 were £21.1 billion. This was a decrease of £1.3 billion, or 6%, on May 2026, but an increase of £7.0 billion, or 49%, compared with June 2025.
EU imports for June 2026 were £30.7 billion. This was an increase of £2.4 billion, or 9%, on May 2026, and an increase of £4.1 billion, or 15%, compared with June 2025.
Non-EU imports for June 2026 were £33.7 billion. This was a decrease of £1.7 billion, or 5%, on May 2026, and a decrease of £2.0 billion, or 6% compared with June 2025.
Figure 3: Total UK monthly trade in goods with EU and non-EU, January 2025 to June 2026
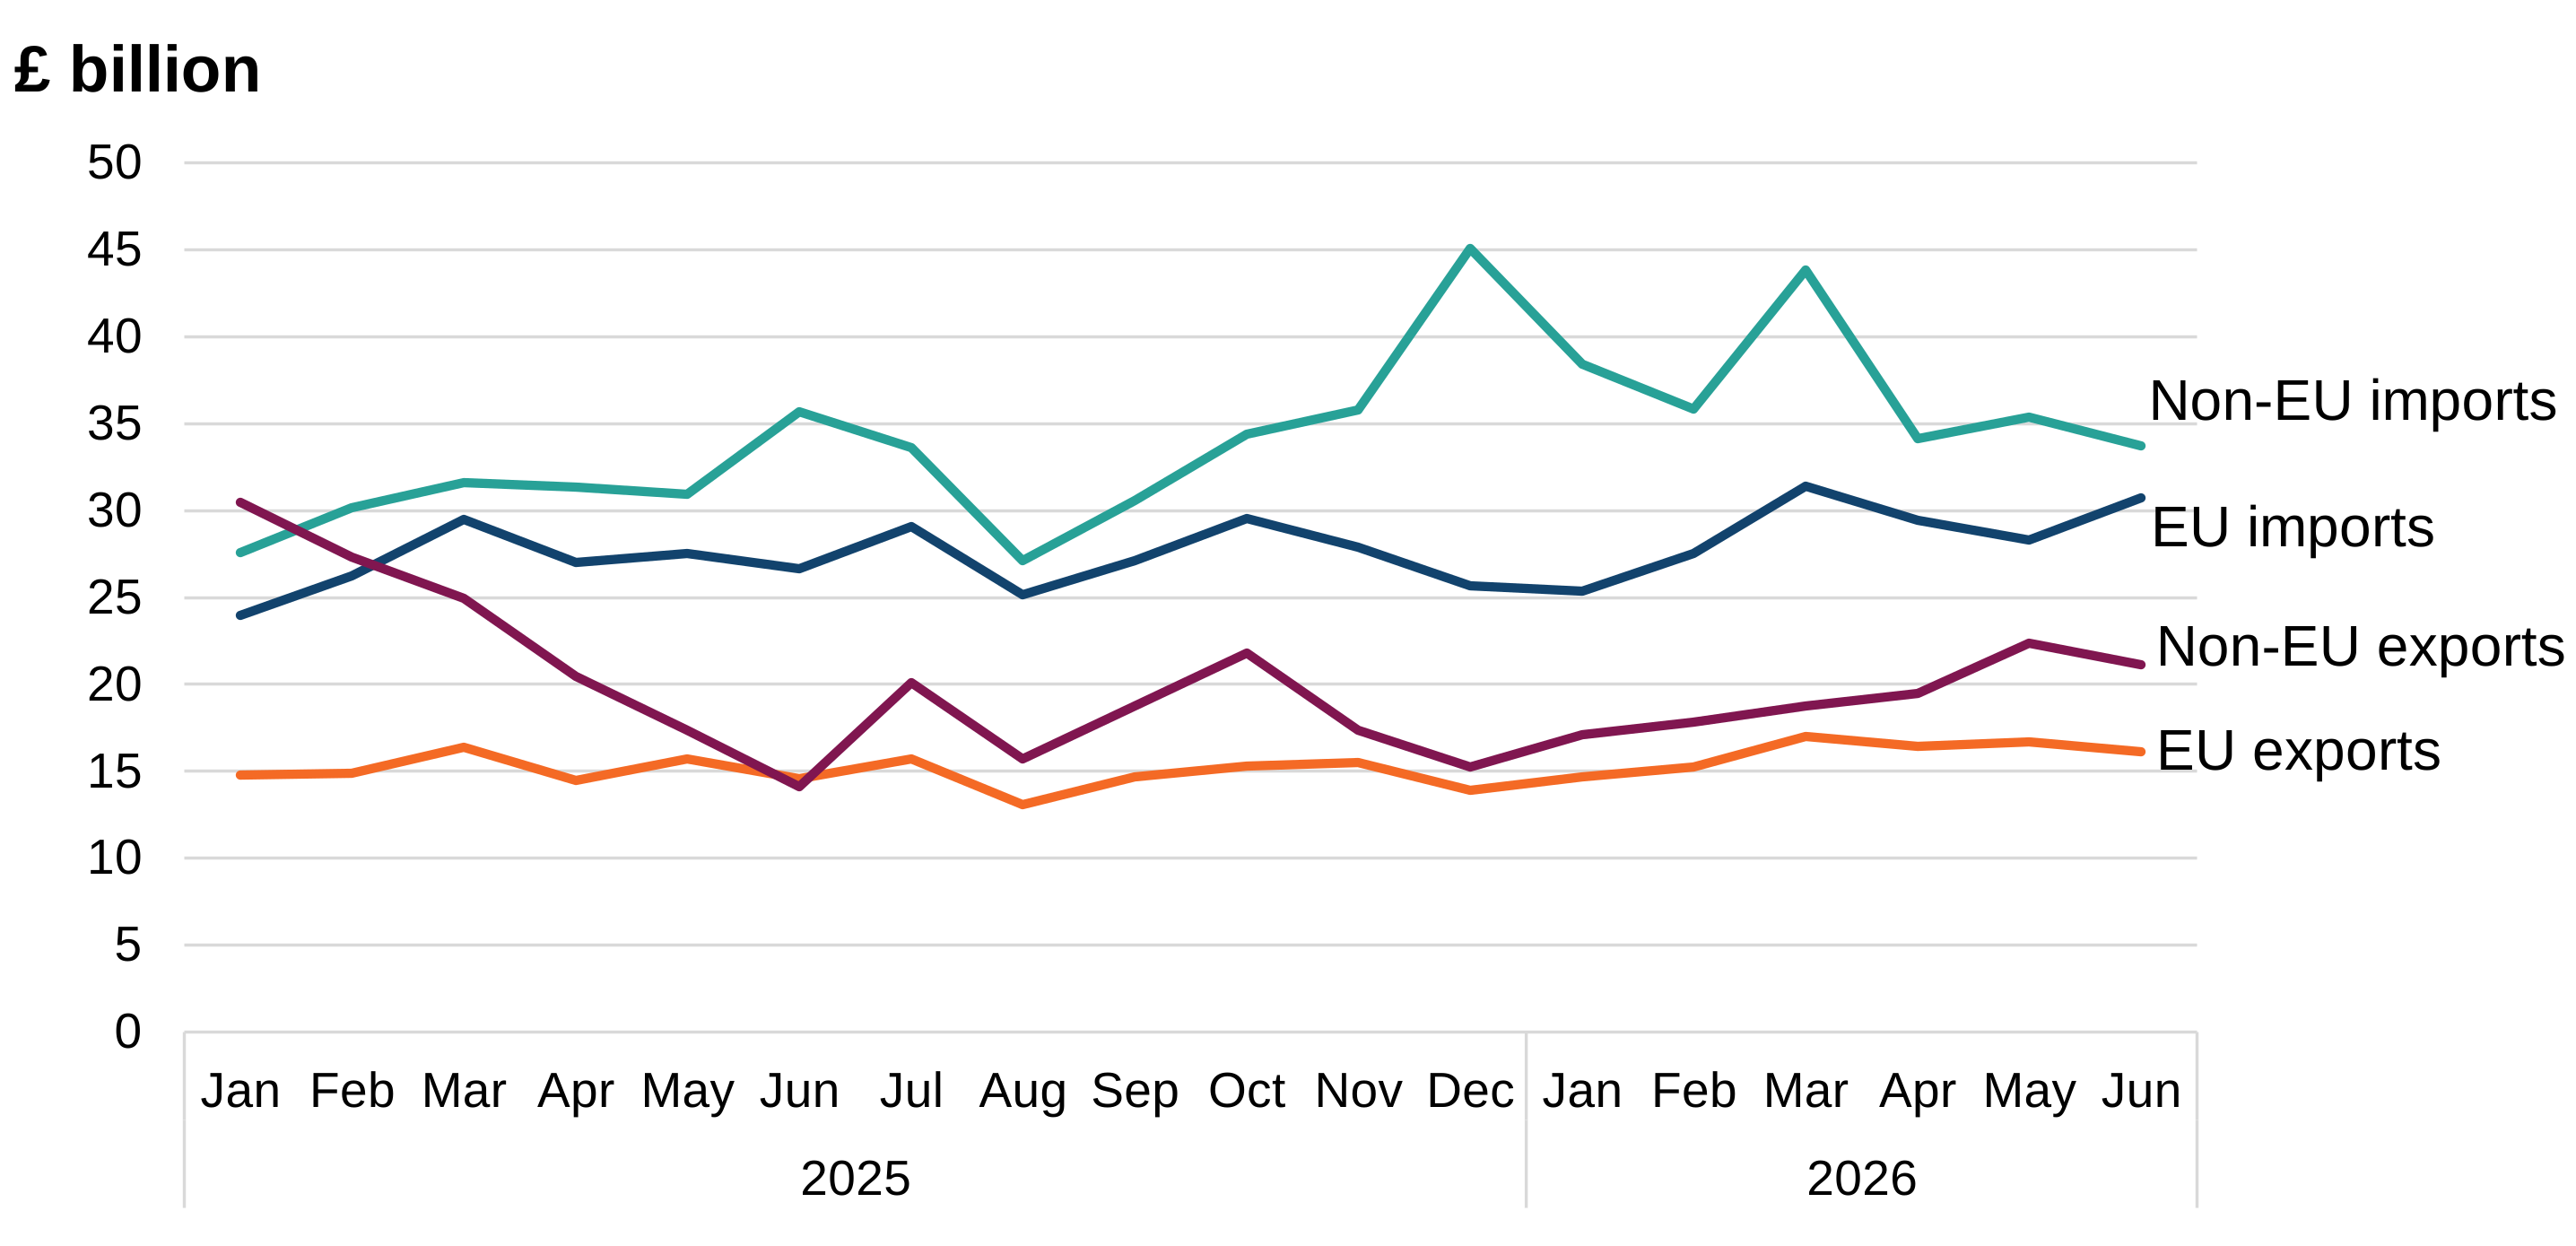
Figure 3 shows total exports and imports for EU and non-EU trade for the period from January 2025 to June 2026.
Source: UK overseas trade in goods statistics from HM Revenue & Customs
Note: 2026 data is provisional.
EU exports decreased by £0.6 billion in June 2026, driven by Precious metals, Mechanical appliances, and Mineral fuels, partially offset by Aircraft. Non-EU exports decreased by £1.3 billion, driven by Precious metals.
EU imports increased by £2.4 billion in June 2026, driven by Motor vehicles and Precious metals. Non-EU imports decreased by £1.7 billion, dominated by Precious metals.
Exports: Country analysis
You can explore more UK export country data in the interactive data tables.
China had the largest value decrease on May 2026, down 17%.
China had the largest value increase on June 2025, up to more than 5 times the value.
Table 2: UK exports of goods to the top 5 partner countries, value comparison with May 2026 and June 2025 (£ million)
| Partner country | June 2026 | May 2026 | June 2025 |
|---|---|---|---|
| China | 5,317 | 6,406 | 1,016 |
| USA | 4,743 | 4,929 | 3,856 |
| Germany | 2,977 | 3,192 | 2,439 |
| Hong Kong | 2,562 | 1,868 | 886 |
| Netherlands | 2,533 | 2,557 | 2,052 |
Source: UK overseas trade in goods statistics from HM Revenue & Customs
Note: 2026 data is provisional.
China remained the UK’s largest export partner country by value in June 2026. This was despite it having a decrease in value on May 2026, down £1.1 billion. In contrast, it increased in value on June 2025, up £4.3 billion. Both changes were dominated by Precious metals.
The USA remained the UK’s second largest export partner in June 2026. It had a decrease in value on May 2026, down £186 million. This was driven by Precious metals and Mineral fuels. In contrast, it had an increase in value on June 2025, up £887 million. This was led by Motor vehicles, Inorganic chemicals, and Precious metals.
Germany remained the third largest export partner in June 2026. It had a decrease in value on May 2026, down £215 million. This was driven by Mineral fuels, Precious metals, and Pharmaceutical products, partially offset by Aircraft. In contrast, it had an increase in value on June 2025, up £539 million. This was driven by Aircraft.
Figure 4: Historical export values for the top 3 export partner countries in June 2026
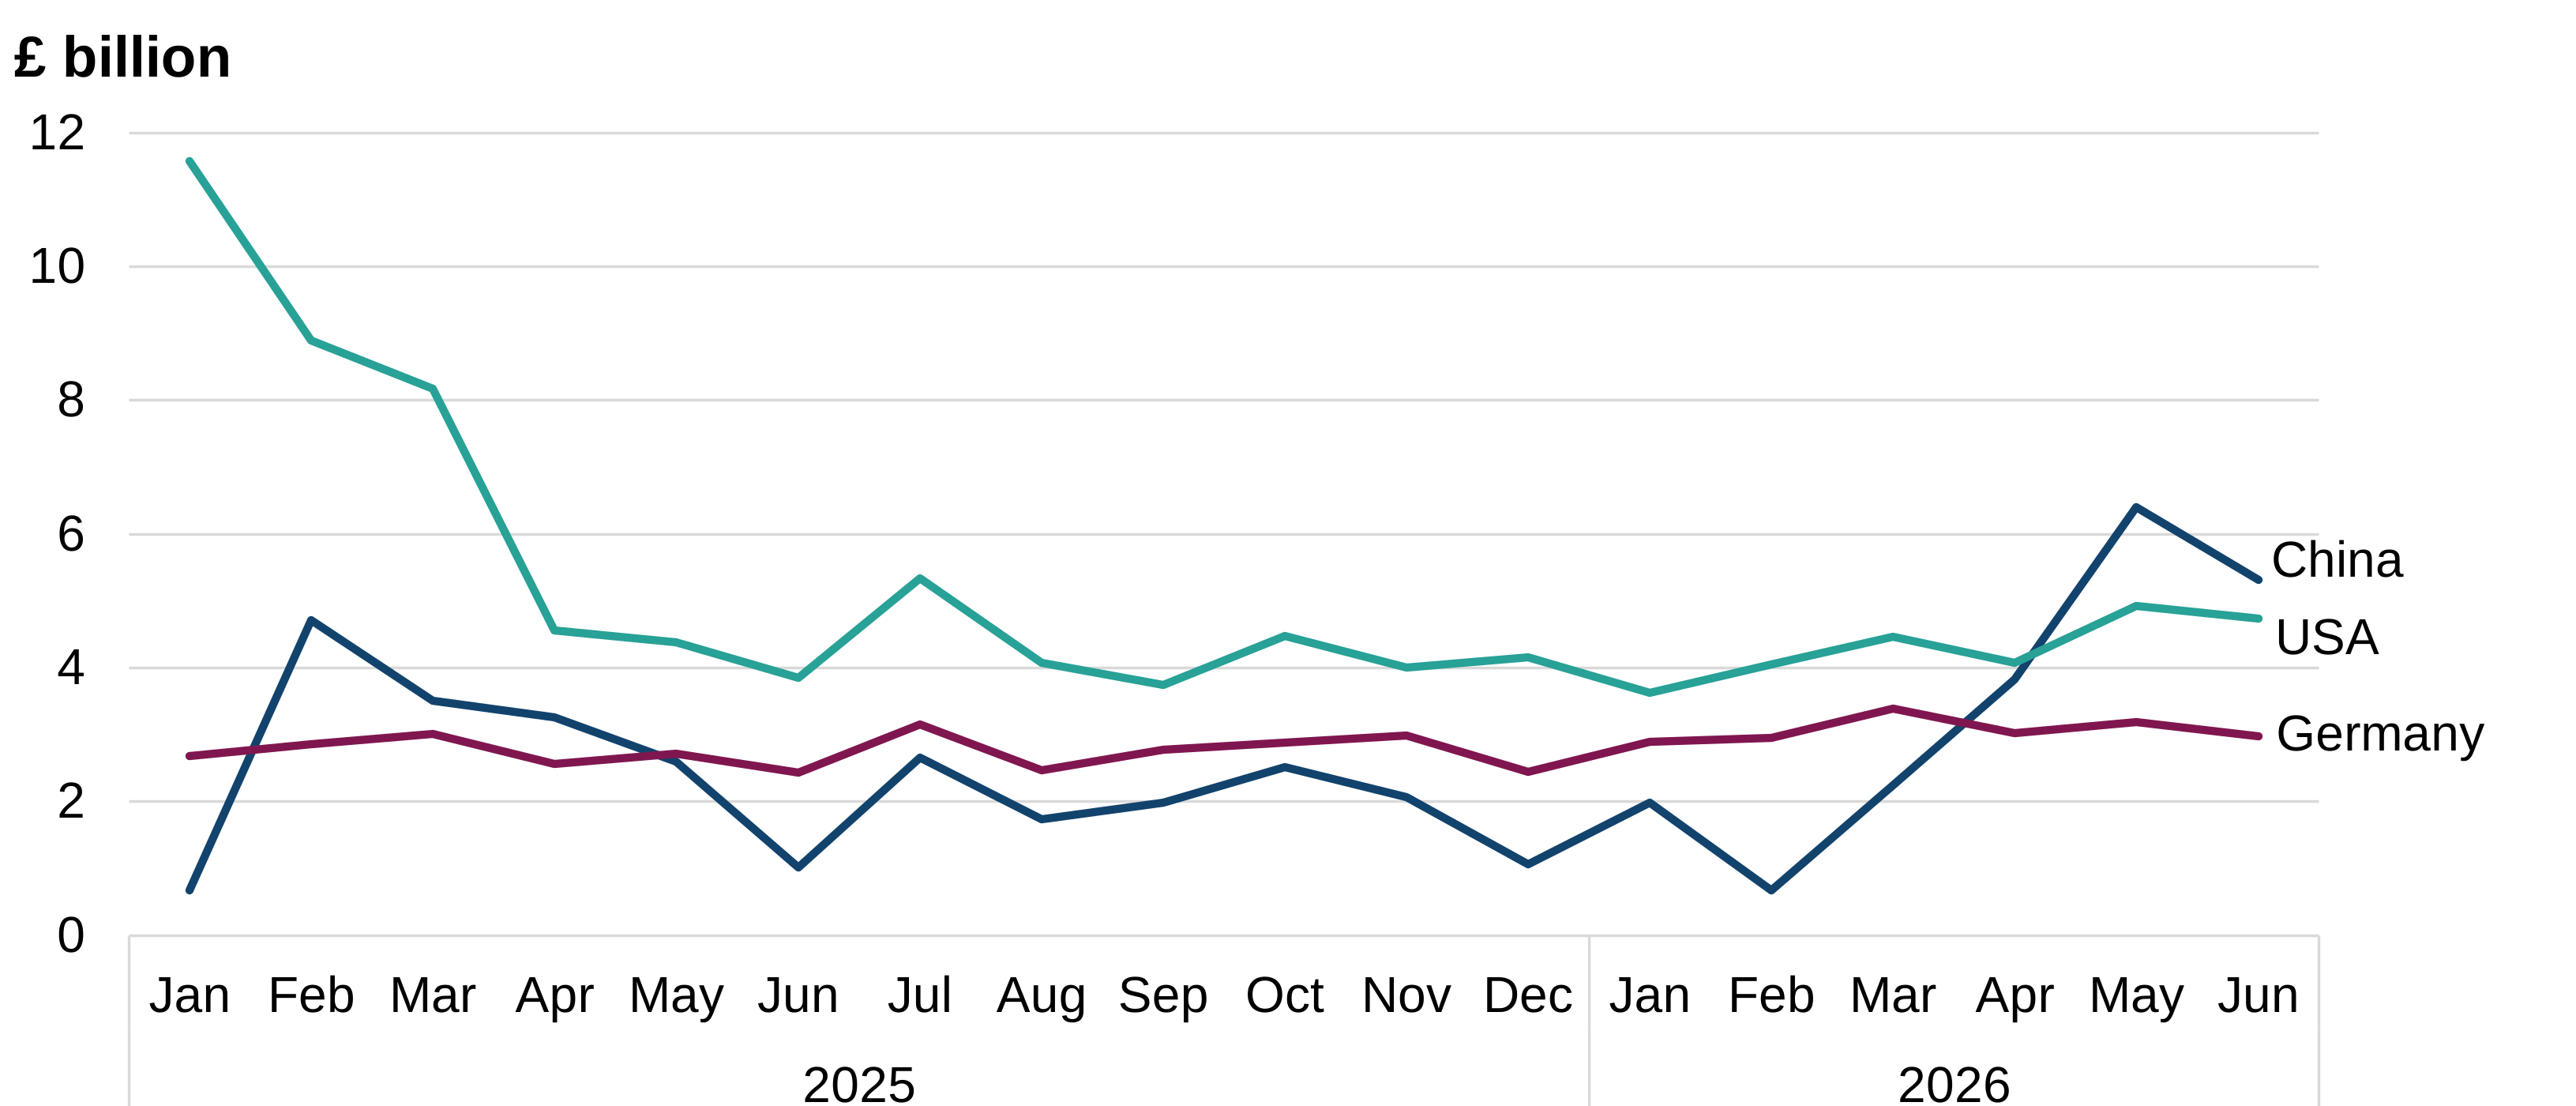
Figure 4 shows the values for the top 3 export partner countries in June 2026, from January 2025 to June 2026.
Source: UK overseas trade in goods statistics from HM Revenue & Customs
Note: 2026 data is provisional.
China accounted for 14% of the UK’s total exports in June 2026. This was down from 16% in May 2026 but up from 4% in June 2025. The value of exports to China decreased by 17% on May 2026 but increased to more than 5 times the value on June 2025.
The USA accounted for 13% of the UK’s total exports in June 2026. This was unchanged on both May 2026 and June 2025. The value of exports to the USA decreased by 4% on May 2026 but increased by 23% on June 2025.
Germany accounted for 8% of the UK’s total exports in June 2026. This was unchanged on both May 2026 and June 2025. The value of exports to Germany decreased by 7% on May 2026 but increased by 22% on June 2025.
Exports: Chapter analysis
You can explore more UK export chapter data in the interactive data tables.
Precious metals had the largest value decrease on May 2026, down 12%.
Precious metals had the largest value increase on June 2025, up to more than 6 times the value.
Table 3: UK exports of goods of the top 5 chapters, value comparison with May 2026 and June 2025 (£ million)
| Chapter | June 2026 | May 2026 | June 2025 |
|---|---|---|---|
| Mechanical appliances | 7,127 | 7,504 | 6,538 |
| Precious metals | 7,045 | 7,986 | 1,141 |
| Mineral fuels | 2,825 | 3,108 | 2,398 |
| Motor vehicles | 2,576 | 2,796 | 2,302 |
| Electronic equipment | 2,305 | 2,357 | 2,063 |
Source: UK overseas trade in goods statistics from HM Revenue & Customs
Note: 2026 data is provisional.
Mechanical appliances rose to become the UK’s top export chapter in June 2026, up from second. This was despite a decrease in value on May 2026, down £376 million. This decrease was led by the Netherlands, France, and the UAE, partially offset by China. In contrast, it had an increase in value on June 2025, up £589 million. This was led by Hong Kong and France, partially offset by Saudi Arabia.
Precious metals fell to second place in June 2026. It had a decrease in value on May 2026, down £941 million. This was driven by China, partially offset by Hong Kong. In contrast it had an increase in value on June 2025, up £5.9 billion. This was driven by China and Hong Kong.
Mineral fuels remained in third place in June 2026. It had a decrease in value on May 2026, down £283 million. This was driven by Germany, Poland, and Sweden, partially offset by Belgium and the Netherlands. In contrast, it had an increase in value on June 2025, up £426 million. This was driven by the Netherlands, Belgium, and Ireland, partially offset by Poland.
Figure 5: Historical export values for the top 3 export chapters in June 2026
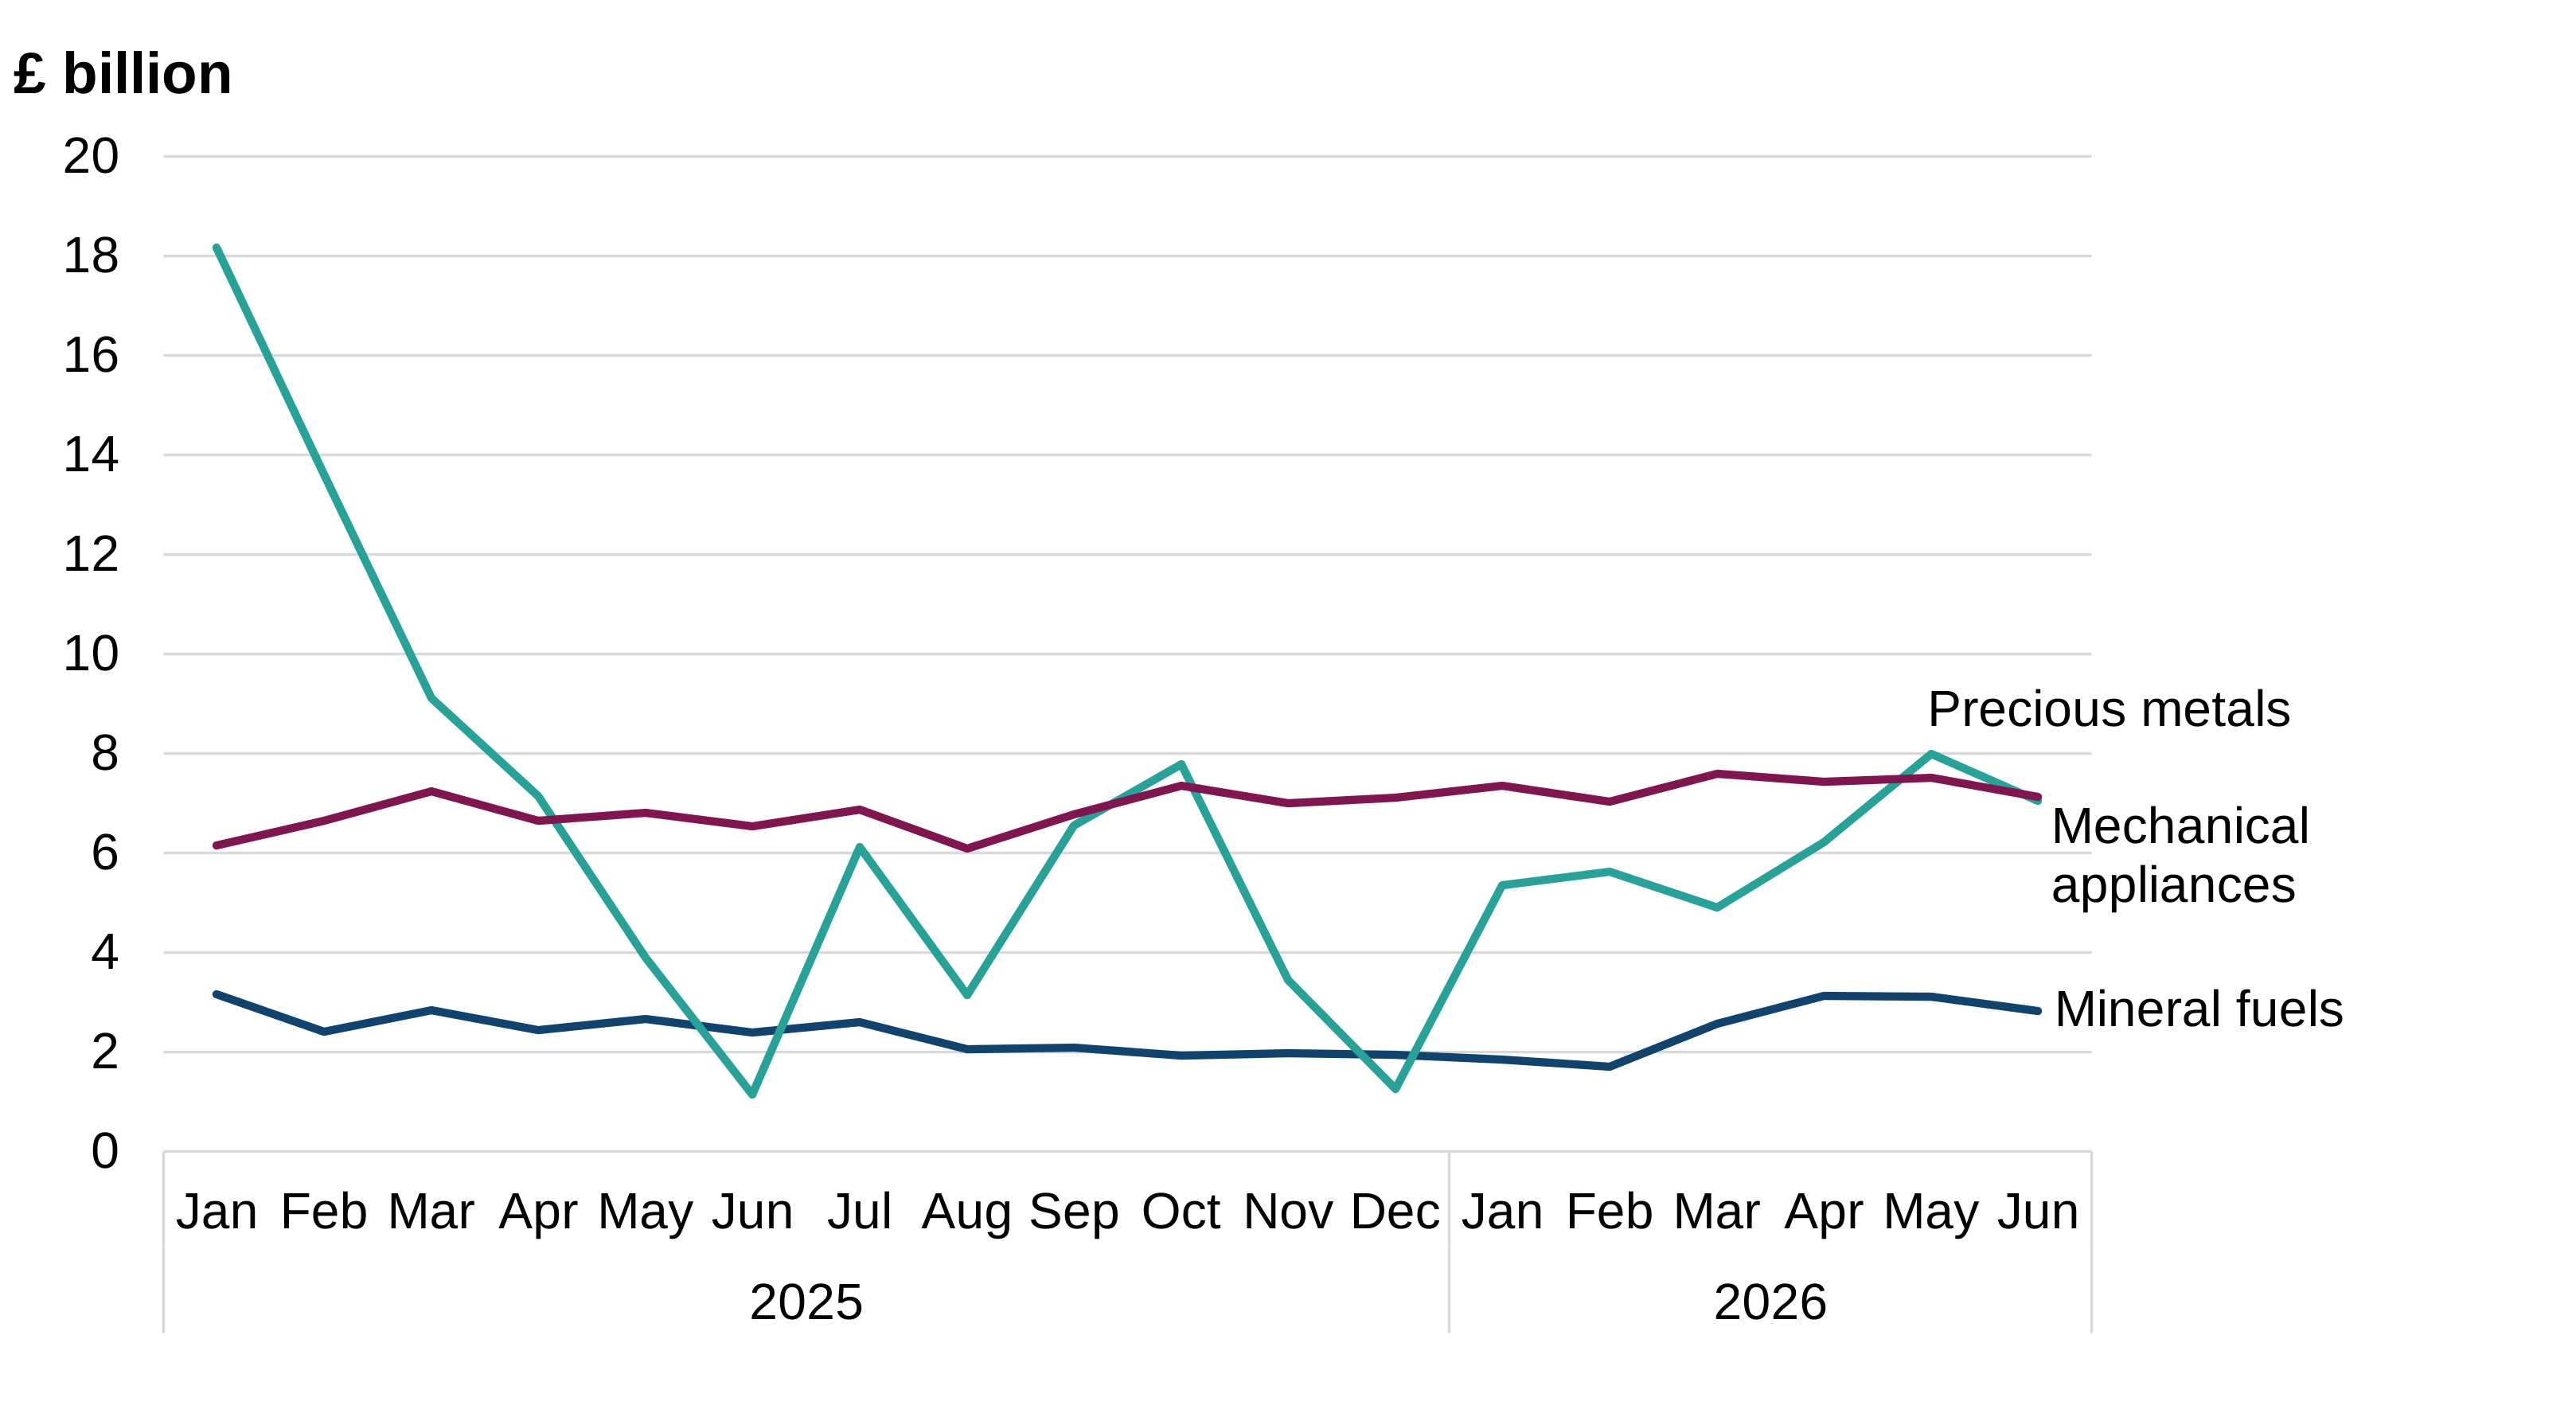
Figure 5 shows the values for the top 3 export chapters in June 2026, from January 2025 to June 2026.
Source: UK overseas trade in goods statistics from HM Revenue & Customs
Note: 2026 data is provisional.
Mechanical appliances accounted for 19% of the UK’s total exports in June 2026. This was unchanged on May 2026, but down from 23% in June 2025. The value of exports of Mechanical appliances decreased by 5% on May 2026 but increased by 9% on June 2025.
Precious metals accounted for 19% of the UK’s total exports in June 2026. This was down from 20% in May 2026, but up from 4% in June 2025. The value of exports of Precious metals decreased by 12% on May 2026 but increased to more than 6 times the value on June 2025.
Mineral fuels accounted for 8% of the UK’s total exports in June 2026. This was unchanged on both May 2026 and June 2025. The value of exports of Mineral fuels decreased by 9% on May 2026 but increased by 18% on June 2025.
Imports: Country analysis
You can explore more UK import country data in the interactive data tables.
Germany had the largest value increase on May 2026, up 21%.
Canada had the largest value increase on June 2025, up 76%.
Table 4: UK imports of goods from the top 5 partner countries, value comparison with May 2026 and June 2025 (£ million)
| Partner country | June 2026 | May 2026 | June 2025 |
|---|---|---|---|
| Germany | 7,133 | 5,872 | 5,999 |
| USA | 6,507 | 5,541 | 6,439 |
| China | 5,694 | 5,194 | 4,810 |
| Netherlands | 4,899 | 4,200 | 3,725 |
| Canada | 3,994 | 3,755 | 2,272 |
Source: UK overseas trade in goods statistics from HM Revenue & Customs
Note: 2026 data is provisional.
Germany remained the UK’s largest import partner in June 2026. It had an increase in value on May 2026, up £1.3 billion. This was led by Motor vehicles, Precious metals, and Aircraft. It also had an increase in value on June 2025, up £1.1 billion. This was led by Aircraft, Motor vehicles, and Mechanical appliances.
The USA remained the second largest import partner in June 2026. It had an increase in value on May 2026, up £965 million. This was dominated by Precious metals, partially offset by Mineral fuels. It also had an increase in value on June 2025, up £68 million. This was driven by Mineral fuels and Precious metals, partially offset by Aircraft.
China became the third largest import partner in June 2026, up from fourth. It had an increase in value on May 2026, up £500 million. This was led by Motor vehicles, Articles of iron or steel, and Electronic equipment. It also had an increase in value on June 2025, up £884 million. This was led by Motor vehicles and Electronic equipment.
Canada became the fifth largest import partner in June 2026, up from sixth. It had an increase in value on May 2026, up £239 million. This was driven by Precious metals, partially offset by Mineral fuels. It also had an increase in value on June 2025, up £1.7 billion, dominated by Precious metals.
Figure 6: Historical import values for the top 3 import partner countries in June 2026
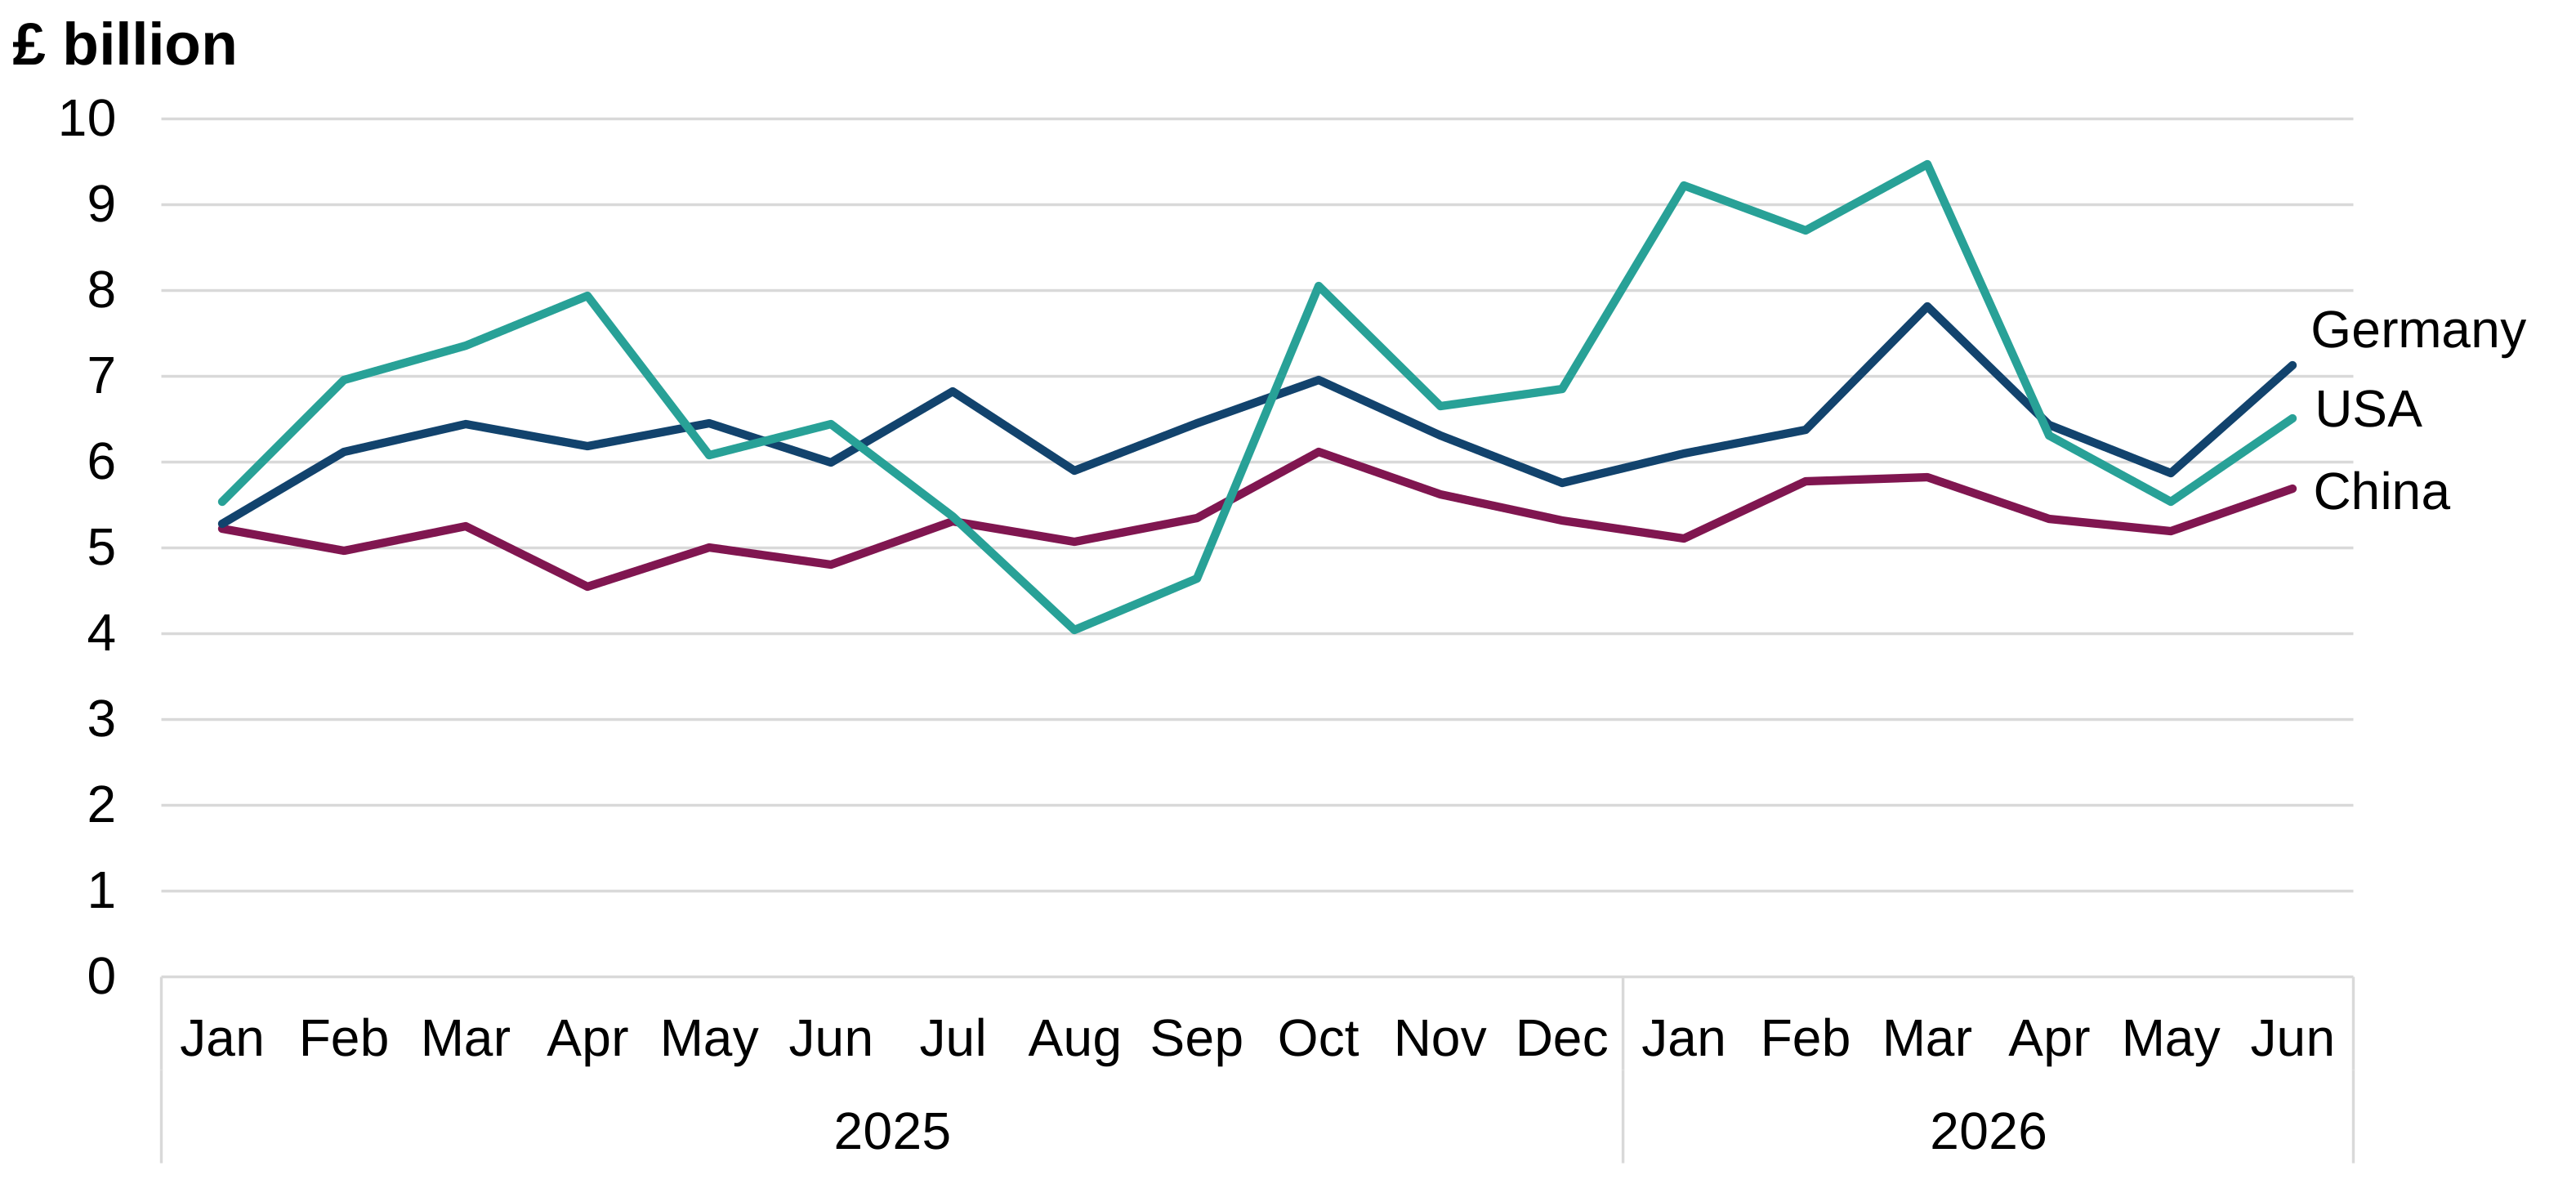
Figure 6 shows the values for the top 3 import partner countries in June 2026, from January 2025 to June 2026.
Source: UK overseas trade in goods statistics from HM Revenue & Customs
Note: 2026 data is provisional.
Germany accounted for 11% of the UK’s total imports in June 2026. This was up from 9% in May 2026 and from 10% in June 2025. The value of imports from Germany increased by 21% on May 2026 and increased by 19% on June 2025.
The USA accounted for 10% of the UK’s total imports in June 2026. This was up from 9% in May 2026 and unchanged on June 2025. The value of imports from the USA increased by 17% on May 2026 and increased by 1% on June 2025.
China accounted for 9% of the UK’s total imports in June 2026. This was up from 8% in both May 2026 and June 2025. The value of imports from China increased by 10% on May 2026 and increased by 18% on June 2025.
Imports: Chapter analysis
You can explore more UK import chapter data in the interactive data tables.
Motor vehicles had the largest value increase on May 2026, up 24%.
Mineral fuels had the largest value increase on June 2025, up 56%.
Table 5: UK imports of goods of the top 5 chapters, value comparison with May 2026 and June 2025 (£ million)
| Chapter | June 2026 | May 2026 | June 2025 |
|---|---|---|---|
| Precious metals | 11,625 | 12,594 | 14,974 |
| Mechanical appliances | 7,716 | 8,015 | 6,913 |
| Motor vehicles | 6,929 | 5,566 | 6,388 |
| Mineral fuels | 5,932 | 6,391 | 3,808 |
| Electronic equipment | 5,078 | 4,920 | 4,530 |
Source: UK overseas trade in goods statistics from HM Revenue & Customs
Note: 2026 data is provisional.
Precious metals remained the UK’s largest import chapter in June 2026. This was despite it having a decrease in value on May 2026, down £969 million. This was driven by Switzerland, South Africa, and the Philippines, partially offset by the USA. It also had a decrease in value on June 2025, down £3.3 billion. This was driven by Switzerland, Australia, and Singapore, partially offset by Canada.
Mechanical appliances remained the UK’s second largest import chapter in June 2026. It had a decrease in value on May 2026, down £299 million. This was driven by Ireland, Saudi Arabia, and Hong Kong, partially offset by Mexico. In contrast, imports of Mechanical appliances increased in value on June 2025, up £802 million. This was led by Mexico, the Netherlands, Germany, and Ireland.
Motor vehicles became the UK’s third largest import chapter in June 2026, up from fourth. It had an increase in value on May 2026, up £1.4 billion. This was led by Germany, Belgium, China, and France. It also had an increase in value on June 2025, up £541 million. This was driven by Germany, China, and France, partially offset by Turkey.
Mineral fuels fell to fourth place in June 2026, down from third. It had a decrease in value on May 2026, down £459 million. This was led by the USA, Belgium, Canada, and Sweden, partially offset by the Netherlands. In contrast, imports of Mineral fuels increased in value on June 2025, up £2.1 billion. This was driven by Norway, the Netherlands, and the USA.
Figure 7: Historical import values for the top 3 import chapters in June 2026
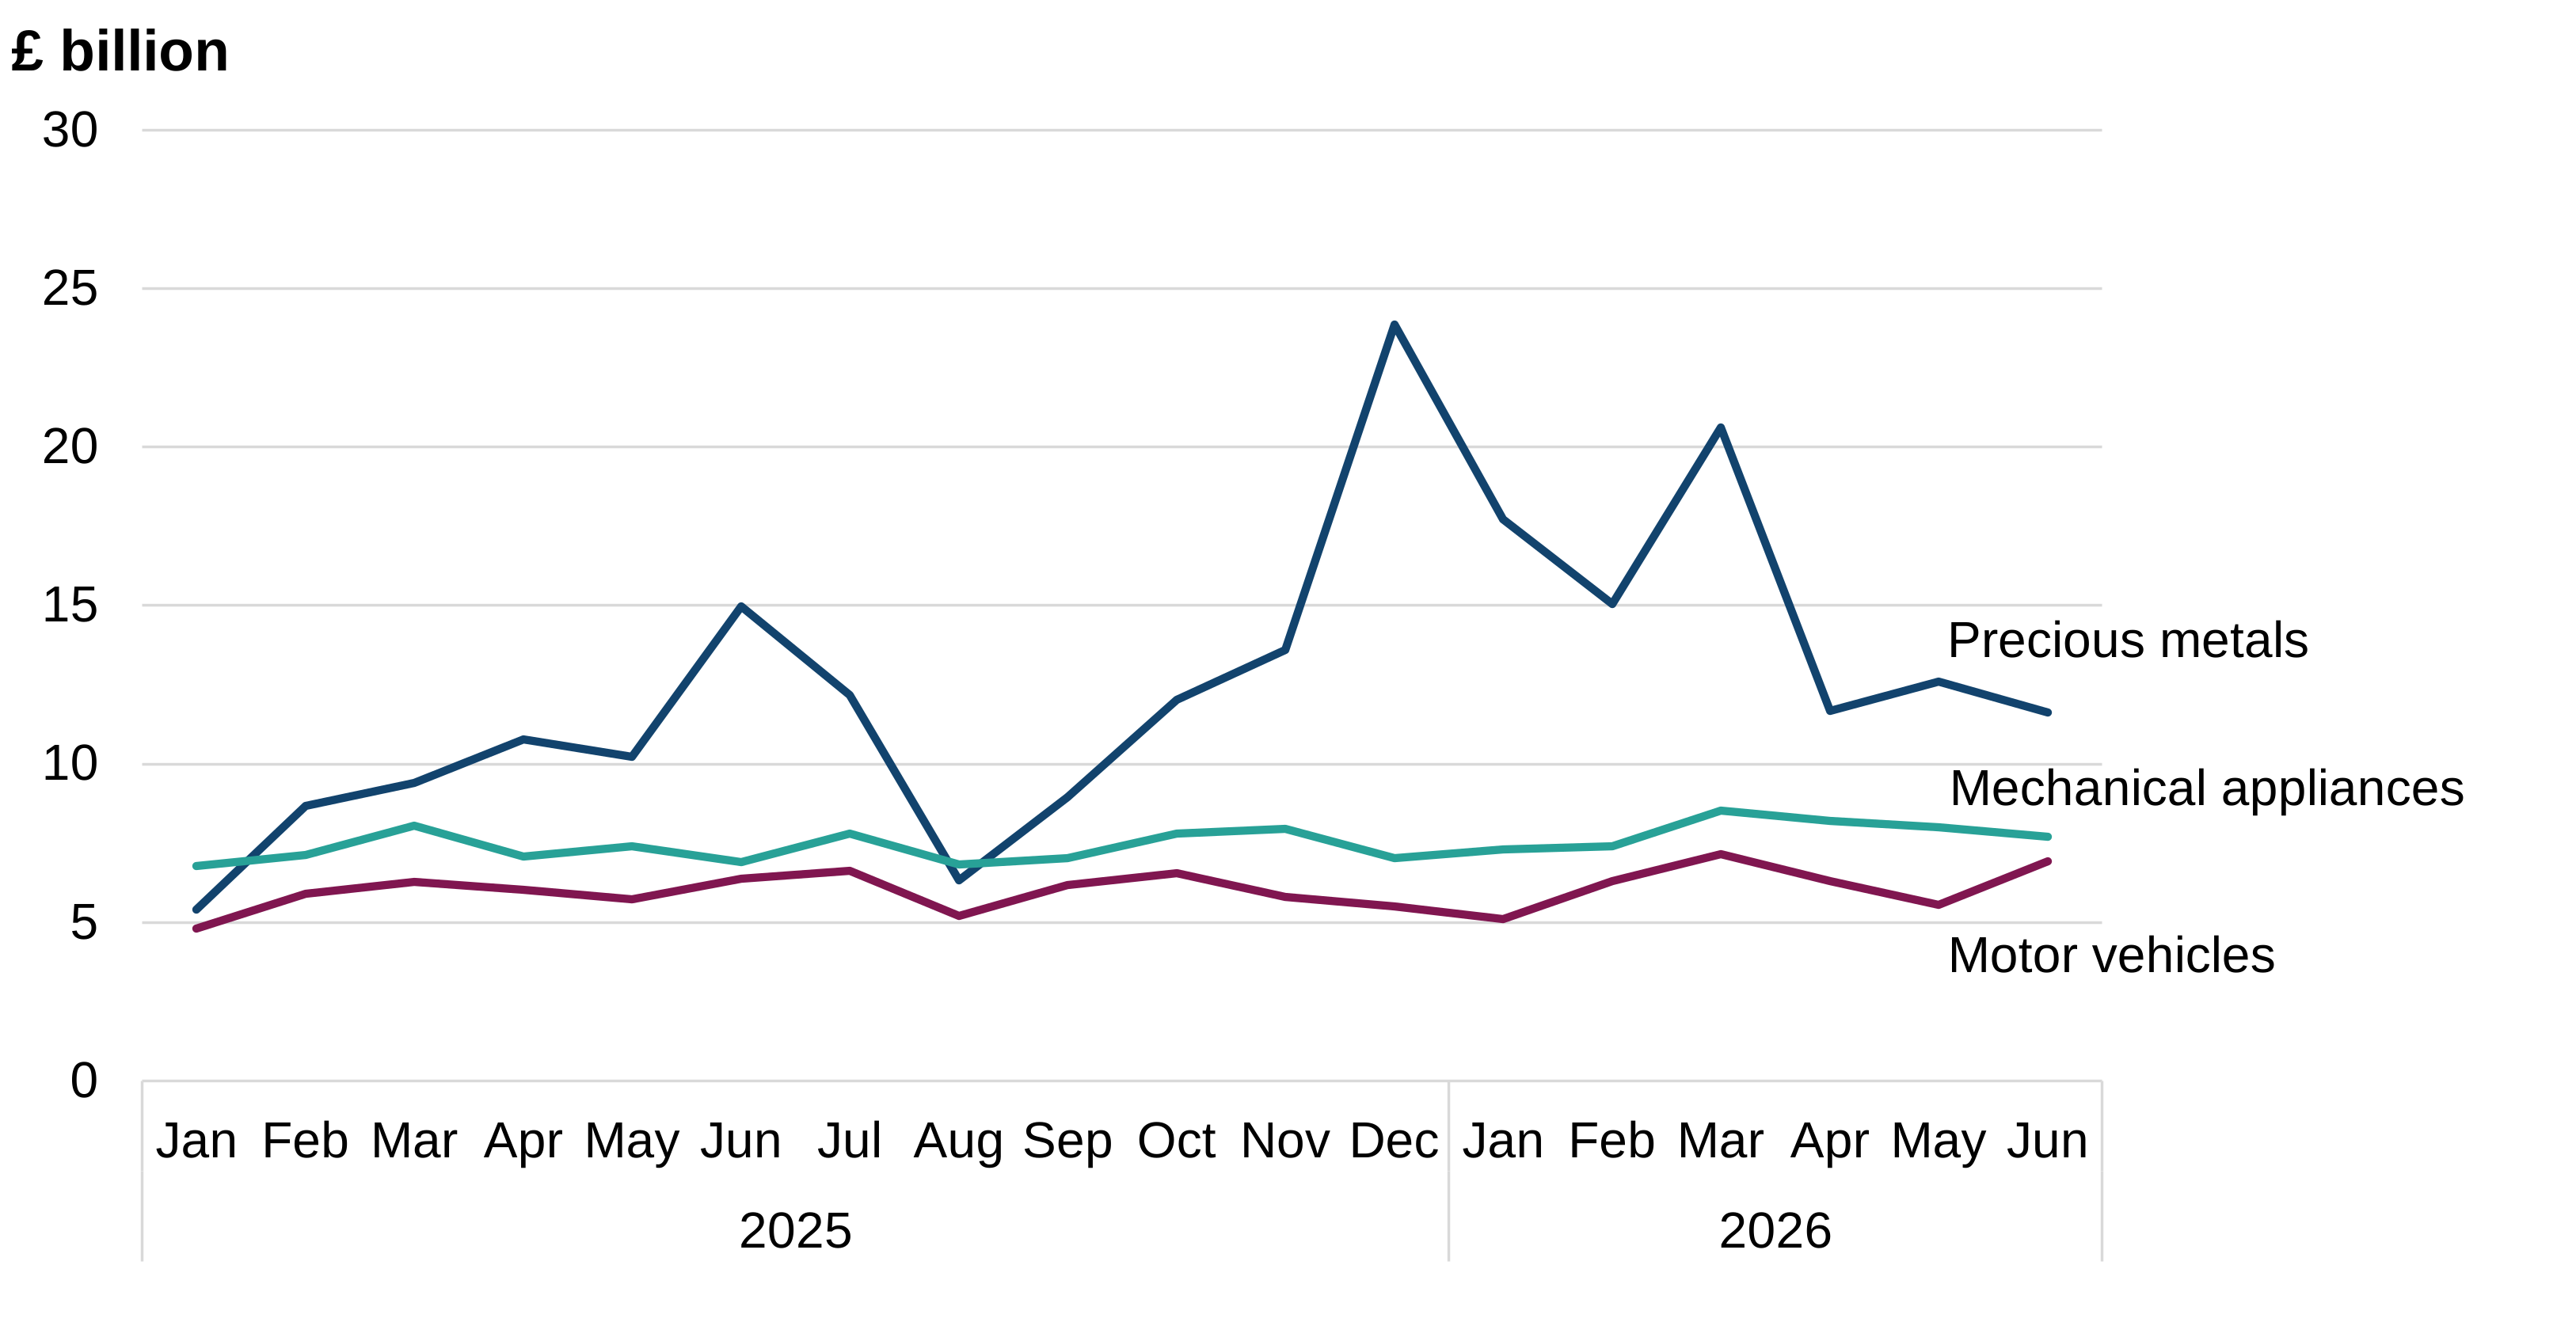
Figure 7 shows the values for the top 3 import chapters in June 2026, from January 2025 to June 2026.
Source: UK overseas trade in goods statistics from HM Revenue & Customs
Note: 2026 data is provisional.
Precious metals accounted for 18% of the UK’s total imports in June 2026. This was down from 20% in May 2026 and down from 24% in June 2025. The value of imports of Precious metals decreased by 8% on May 2026 and decreased by 22% on June 2025.
Mechanical appliances accounted for 12% of the UK’s total imports in June 2026. This was down from 13% in May 2026 but up from 11% in June 2025. The value of imports of Mechanical appliances decreased by 4% on May 2026 but increased by 12% on June 2025.
Motor vehicles accounted for 11% of the UK’s total imports in June 2026. This was up from 9% in May 2026 and up from 10% in June 2025. The value of imports of Motor vehicles increased by 24% on May 2026 and increased by 8% on June 2025.
Focus
Table 6: UK exports of Mineral fuels, value comparison with May 2026
| Partner country |
June 2026 (£ million) |
May 2026 (£ million) |
Change (£ million) |
Change (%) |
|---|---|---|---|---|
| Germany | 114 | 340 | -226 | -66 |
| Poland | 8 | 152 | -144 | -95 |
| Sweden | 98 | 202 | -104 | -52 |
| Belgium | 549 | 332 | 217 | 65 |
| Netherlands | 1,058 | 955 | 102 | 11 |
Source: UK overseas trade in goods statistics from HM Revenue & Customs
Download table 6: UK exports of Mineral fuels, value comparison with May 2026 (ODS, 10.2 KB)
Note: 2026 data is provisional.
In June 2026, UK exports of Mineral fuels had the third largest value decrease of all chapters on May 2026. This was a decrease of £283 million, or 9%.
Between May 2026 and June 2026, exports of Mineral fuels to Germany fell by the largest amount, £226 million, or 66%.
Exports of Mineral fuels to Poland fell by £144 million, or 95%.
Exports of Mineral fuels to Sweden fell by £104 million, or 52%.
In contrast, exports of Mineral fuels to Belgium increased by £217 million, or 65%.
Exports of Mineral fuels to the Netherlands increased by £102 million, or 11%.
Table 7: UK imports of Mineral fuels, value comparison with May 2026
| Partner country |
June 2026 (£ million) |
May 2026 (£ million) |
Change (£ million) |
Change (%) |
|---|---|---|---|---|
| USA | 1,153 | 1,378 | -225 | -16 |
| Belgium | 338 | 489 | -151 | -31 |
| Canada | 245 | 362 | -117 | -32 |
| Sweden | 74 | 175 | -101 | -58 |
| Netherlands | 836 | 682 | 154 | 23 |
Source: UK overseas trade in goods statistics from HM Revenue & Customs
Download table 7: UK imports of Mineral fuels, value comparison with May 2026 (ODS, 8.98 KB)
Note: 2026 data is provisional.
In June 2026, UK imports of Mineral fuels had the second largest value decrease of all chapters on May 2026. This was a decrease of £459 million, or 7%.
Between May 2026 and June 2026, imports of Mineral fuels from the USA decreased by the largest amount, £225 million, or 16%.
Imports of Mineral fuels from Belgium decreased by £151 million, or 31%.
Imports of Mineral fuels from Canada decreased by £117 million, or 32%.
Imports of Mineral fuels from Sweden decreased by £101 million, or 58%.
In contrast, imports of Mineral fuels from the Netherlands increased by £154 million, or 23%.