UK security exports market analysis 2019
Published 6 October 2020

© Crown copyright 2020
This publication is licensed under the terms of the Open Government Licence v3.0 except where otherwise stated. To view this licence, visit nationalarchives.gov.uk/doc/open-government-licence/version/3 or write to the Information Policy Team, The National Archives, Kew, London TW9 4DU, or email: psi@nationalarchives.gov.uk.
Where we have identified any third party copyright information you will need to obtain permission from the copyright holders concerned.
This publication is available at https://www.gov.uk/government/statistics/uk-defence-and-security-export-statistics-for-2019/uk-security-exports-market-analysis-2019
1. Scope of work and definitions
1.1 Strategic Imperative
To support the UK government’s Department of International Trade (DIT) in understanding and quantifying the export market size and potential for the UK Security industry, leveraging Frost & Sullivan’s knowledge and experience in this domain.
DIT – DSO
The Defence and Security Organisation (DSO), a part of DIT, in continuity of its role to provide the UK government with up to date statistics on the Security sector market size and potential (the UK and global) commissioned Frost & Sullivan to conduct this study. The base year contract is focused on 2019, with provision of years 2020 and 2021 to be added at the conclusion of this contract.
Aim of the project
The project aims were to support DSO responsibilities in assisting security companies achieve export success by providing export advice and practical assistance through:
a. Providing official statistics.
b. Identifying security market opportunities for business.
c. Providing global market size, competitors, expert market analysis and other intelligence.
Project Deliverables
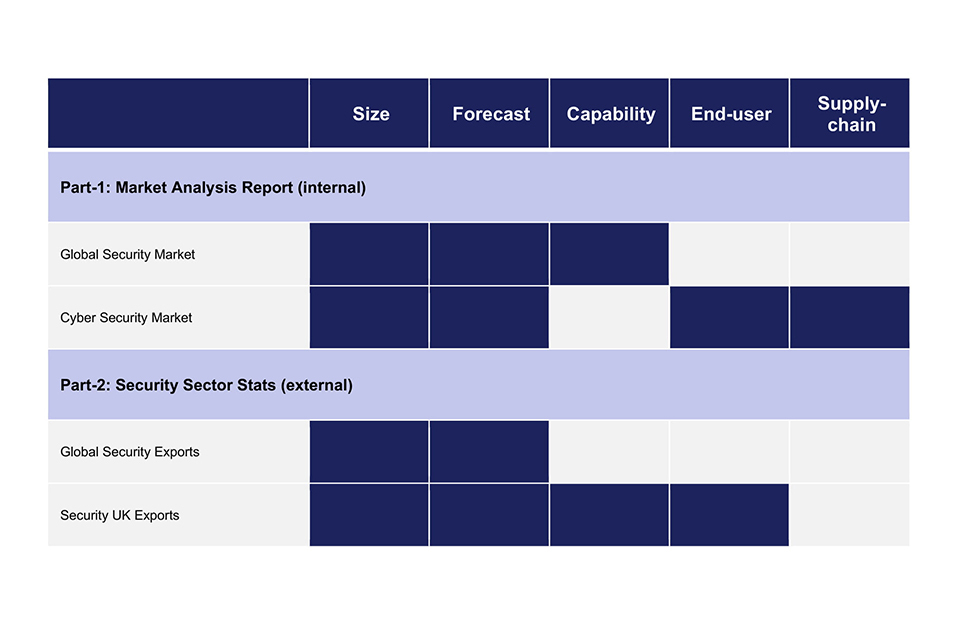
1.2 Definitions: end-user segments
Central government
Central government departments are seeking high assurance security solutions for their estates.
Infrastructure
Diverse group spanning commercial and residential urban developments to smart cities. Security solutions in this area are increasingly dictated by rules around compliance, international regulations and standards.
First responders
Emergency services and other first responders have a unique set of capability requirements that are shared between them; personal protective equipment, forensics and analysis of large data sets for example.
Border security
Covering the whole range of entry points (sea, land and air), border management and monitoring needs range from simple perimeter detection systems to more complex explosives trace detection and identity verification.
Major events security
Sporting and entertainment organisations are seeking expertise and guidance on how to provide enhanced discreet security at large scale events, while maintaining the flow of people through entry and exit points
Critical national infrastructure (CNI) protection
CNI buyers from both government and the commercial sector are seeking novel ways to design, manage and improve the security of often large infrastructure perimeter and security zones.
Transport Security
Transport hubs are becoming larger and more complex. Public and private sector bodies are looking for physical security solutions that do not unduly impede the flow of passengers and freight.
1.3 Security Sector Segmentation
Cyber security
The sub sectors for cyber security are:
- prisons
- government building/offices
- judiciary
Infrastructure
The sub sectors for infrastructure are:
- Smart cities
- Banking, financial services and insurance (BFSI)
First responders
The sub sectors for infrastructure are:
- Law enforcement
- Disaster/ emergency management
Border security
The sub sectors for infrastructure are:
- ports of entry: maritime
- ports of entry: airports
- land borders capability
Major events security
The sub sectors for infrastructure are:
- large-scale business events
- large-scale sports and entertainment
Critical national infrastructure (CNI)
The sub sectors for infrastructure are:
- oil and gas
- utilities-power/ water
Transport security
The sub sectors for infrastructure are:
- mass transportation: rail, bus and metro
The technology segments are:
- access control and identity management
- command and control
- communication equipment
- cyber security
- data analytics and storage
- disaster management
- fire equipment
- managed services
- personal protection gear
- risk averse security services
- screening and detection
- surveillance
- vehicles and platforms
1.4 Definitions: technology segments
Access control perimeter security and identity Management
Access control and identity management including cards, key pads, biometrics, door locks, bolts, physical barriers and area protection, perimeter fencing and counter-IED infrastructure.
Command and control
Command and control including information technology, computer-aided dispatch, physical security information management, geographical information systems, public service answering points, managed services and integration.
Communication equipment
Communications including radio equipment, fiberoptic and satellite equipment, network solutions and integration.
Data analytics and storage
Data analytics including storage, big data solutions and data intelligence.
Risk averse security services
Risk services including advisory and analysis, maritime protection, VIP protection and anti-theft systems.
Screening and detection
Detection technologies for the screening of baggage, vehicles and people from hand-held devices to large sensor arrays.
Surveillance
Surveillance including cameras, drone systems, CCTV systems, storage, analytics, networks, novel technologies for locating and identifying unmanned aerial vehicles and passive and active radar systems.
Vehicles and platforms
Vehicles including sirens and blue light services, unmanned air platforms.
Personal protection gear
Personal protective equipment including shields, vests and CBRN suits.
Fire equipment
Fire equipment including active fire protection (detection and alarm systems, sprinklers, mists and inert gas systems), passive fire protection (structural fire protection, fire stopping and fire doors) and fire and rescue (appliances, hoses, uniforms and breathing apparatus).
Managed services
Managed services including manned guarding, total security solutions, security as a service.
Disaster management
Provision of products and services in support of humanitarian aid and disaster relief efforts.
Cyber security
All technologies related to the protection of internet connected systems, the data on them, and the services they provide, from unauthorised access, harm or misuse.
1.5 Definitions: Exports
For the purpose of this project Frost & Sullivan defined an export under the following:
a. Any sale of security technology or services from a UK registered organisation - Any sale to defence organisations, MoD, DoD is not included as this has been classified as a ‘Defence Export’.
b. To be included the sale must be accounted to the UK office - If a UK company makes a sale from an office registered in another country and reports the revenues within that country, this will not be counted as a UK export as the revenues have not been attributed to the UK.
c. ‘New orders’ covers both legally binding contracts and routine or small orders (such as spares) - which though not legally binding are regarded as firm.
d. Revenues for multi-year contracts will be assigned equally through the life of the project. For example, a 5 year contract for equipment and support will be spread over those years.
e. Additions to existing orders - These are identified as new contracts.
f. Joint ventures - Only the UK value-added part of the venture is counted.
2. Methodology: global security market forecast
2.1 Methodology Overview
Data sources
Financial data included the following sources:
- annual/half yearly/quarterly financial reports
- SEC filings
- industry press release
- audit reports
Marco data included the following sources:
- annual/half
- world bank database
- United nations database
- International monetary fund
- OECD database
- other supranational org. data
- universities
- .gov databases
Micro data included the following sources:
- segment/ industry publications
- industry annual report
- strategic directive documents
- segment specific secondary databases
- relevant operational data/statistics from end-user domains
- contracts data
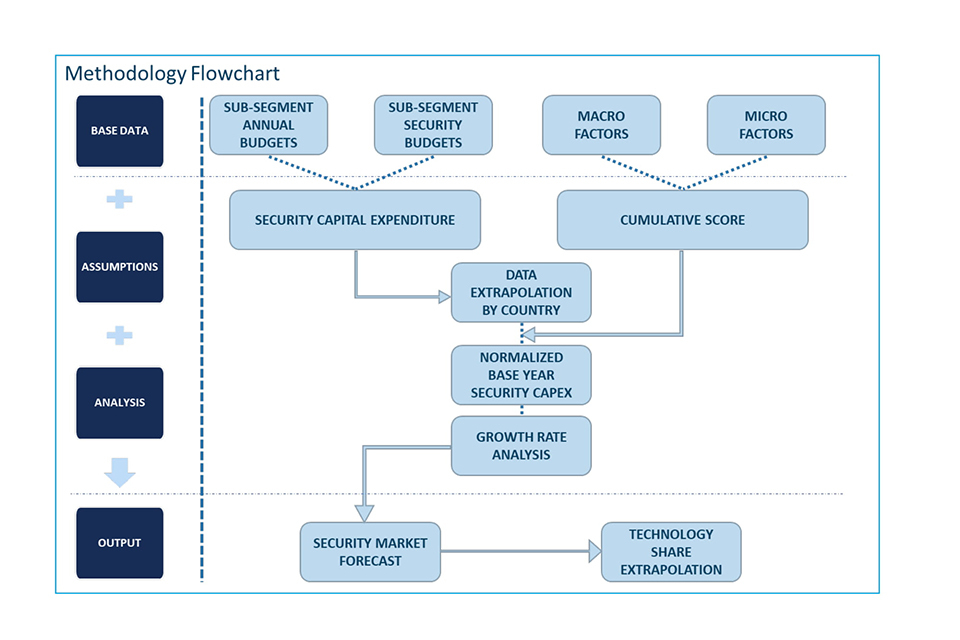
2.2 Methodology approach
The following methodology has been adopted for global security market forecast.
a. Global security expenditure is forecast using Frost & Sullivan forecast methodologies across a range of security segments.
b. Each of these is tailored to take into account the end-user organisations of in scope security technologies and capture the specific market dynamics.
c. The global forecast segments include CNI, border security, major events, first responders, central government, infrastructure and transport security.
d. These segments are further classified into 16 sub-segments for which individual security forecast models were developed.
e. Frost & Sullivan security markets are forecast through a bottom-up approach for each country which totals up into an overall regional market size. This includes 177 countries across seven regions.
f. Each country was assessed based on sub-segment specific macro and micro parameters and further differentiated by region and country development type. The individual ranks obtained by these countries mapped in the context of the sub-segment specific parameters were used to determine the cumulative scores.
g. The sub-segment level annual budget data /security budgets, where available, were identified for major countries in every region. This was leveraged to establish the security capital spending budget was extrapolated across other countries in the region based on their relative ranking of the gross domestic product against the benchmarked country. The security budgets assumption was based on specific sub-segment security spending data as a percentage of the overall budget.
h. The cumulative score was used to normalize the derived security capital expenditure across each country, in order to co-relate with sub-segment specific parameters and significance of security- thus arriving at base year forecast values.
i. The growth rate was analyzed across seven regions and four different country development types against multiple criteria namely:
i. Operational Needs.
ii. Technology Uptake.
iii. Ability to Invest.
iv. Strategic Intent, using which a percent growth rate was derived across short medium and long term in the forecast time frame.
j. Further, the forecasted values are distributed among 13 technology segments based on technology uptake, impact and demand analysis across each sub-segment- varying by country development type and region.
Important Considerations to Note:
a. Revenues exclude operational expenses and administrative costs, but includes managed services expenditure.
b. Revenue data, wherever not available, the values of countries with similar macro- economic status have been considered for extrapolation.
c. Technologies vary based on sub-segment capability requirement
d. Specific major sports (this may exclude marathons and events which are specific to a particular country or region alone) were taken into account for forecasting.
e. Limitations in OSINT data or dated information, has been overcome via primaries wherever possible and also the most recent published data available has been considered.
f. All figures are rounded. The base year is 2019.
g. All values are in US$ billion. Data reported in native currencies were converted to US$ using end-of-period exchange rates at the time of forecast model development.
3. Methodology: cyber buyer analysis
3.1 Methodology overview
Data sources
Financial data sources included the following:
- annual/half yearly/quarterly financial reports
- SEC filings
- industry press release
- audit reports
- company websites
- other secondary sources
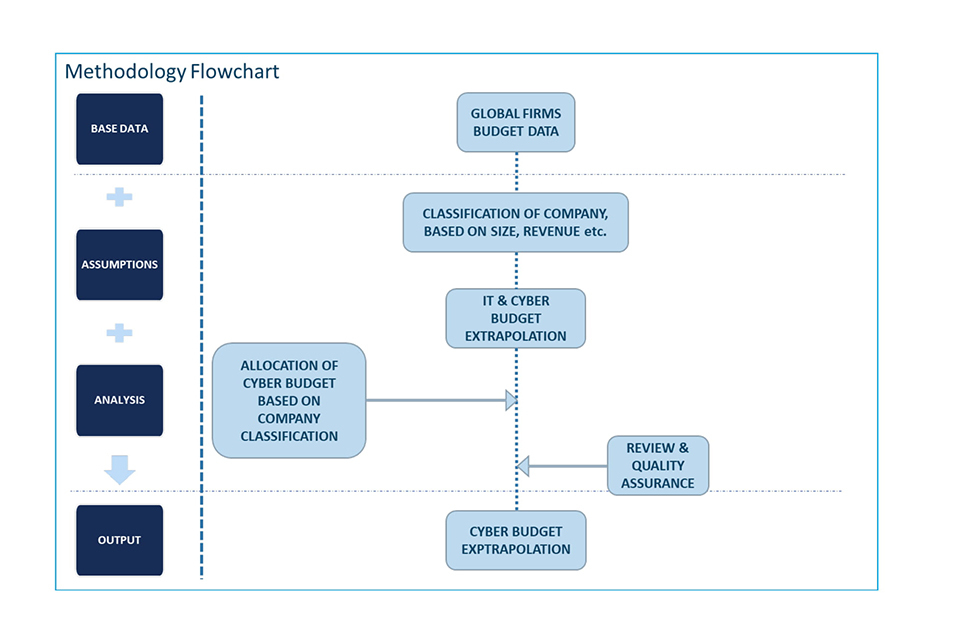
3.2 Methodology approach
F&S collated a list of companies operating in the in-scope domains (globally) through secondary research. To gather the revenue information, the following steps were performed:
a. F&S searched the company’s website to find the details from their annual/ quarterly balance sheets.
b. If revenue details are not available on the company website, then we captured the revenue details from other secondary sources. Respective sources are mentioned for each of the companies.
c. The companies are then sorted/ ranked by global revenue.
d. Please note, where 2019 data was not available, F&S used the most recent available data. Global revenue of listed/ private companies is reported.
e. Data is reported in native currencies and converted to USD using end-of-period exchange rates, as of 28 April 2020.
f. To calculate the IT spend percentage and cyber spend percentage, the following steps were performed:
i. F&S collected the actual IT and cyber budget for all the companies from their website. However, most companies did not give such classification in their annual balance sheets.
ii. As the information was not readily available, F&S sourced the information from other reliable secondary sources.
iii. F&S classified all the collected data into categories specific to segments considered for buyer analysis.
iv. To validate our findings, we further conducted primary interviews.
v. To reach the final numbers, we took the median of all collected data and percentages.
vi. Refer to the shared data outputs for more details.
Important Considerations to Note:
a. Revenues exclude operational expenses and administrative costs, but include managed services expenditure.
b. Limitations in OSINT data or dated information, has been overcome via primaries wherever possible and also the most recent published data available has been considered.
c. All figures are rounded.
d. All values are in US$ billion.
e. Detailed methodologies submitted with the corresponding data outputs.
4. Methodology: UK cyber security exports
4.1 Methodology overview

Data sources
The financial data sources included the following:
- annual/half yearly/quarterly financial reports
- SEC filings
- industry press release
- audit reports
- government financial filing website
- company websites
- other secondary sources
4.2 Methodology approach
The following methodology has been adopted for finding the UK Security exports data:
a. F&S collated a list of 245 companies operating in the cyber security domain in the UK through secondary research.
b. To gather the information, the following steps were performed:
i. F&S searched the company’s website to check whether a company has published its annual balance sheet.
ii. Send surveys & emails to these companies.
c. Financial information of 107 companies was available in the public domain. For the rest of the companies, no actionable information was present due to the following reasons:
i. On the companies’ house database, revenue was not mentioned.
ii. Company is a start-up and is still in development mode with no sales at all.
iii. Company has been acquired by some other company and stopped publishing its own revenue.
iv. Company is backed by private investors, who doesn’t allow the revenue data to be published in the public domain.
d. After collation of the data, the top 72 companies by revenue are presented in this research.
e. If the revenue is not available for 2019, then last known revenue data is taken for 2019.
f. Group revenue is considered for companies having headquarters in the UK.
g. For export revenue by region, in cases where limited information is available, the revenue is distributed by below-mentioned estimation. For EMEA, the revenue is divided as 70% to Europe, 20% to the Middle East and 10% to Africa. For the Americas, the revenue is divided as 80% to North America and 20% to South America.
Important Considerations to Note:
For this project, the following ‘security export’ definition has been used:
a. A security export consists of any sale of security product, service or solution sold from a UK registered organisation where the revenue is registered in the UK.
b. Sales from UK companies where revenue is reported and attributed to registered offices in other countries are not counted as an export, as these have not been attributed to the UK. For example, some companies have reported that it is their business model to have registered entities within countries and allocate revenue, work and sales to these countries and not the UK.
c. Sales to defense organisations (MoD or DoD) are not in scope when clearly defined. Although in some cases there was no clear differentiation of cyber security revenue when sold to governments whether it was for defense or security purposes, in such cases whole cyber security revenue is considered.
5. Methodology: UK security exports
5.1 Methodology overview

Data sources
The financial data included the following sources:
- annual/half yearly/quarterly financial reports
- SEC filings
- industry press release
- audit reports
- government financial filing website
- company websites
- other secondary sources
5.2 Methodology Approach
To capture the known market
a. F&S collated a list of more than 1,000 companies operating in the UK across 13 technology segments (as defined in the ITT), through secondary research.
b. Contact details (email ids) of all these companies were collected through their websites, annual balance sheets, and other reliable open sources.
c. Frost & Sullivan sent direct survey emails to 1700 email ids to gather revenue information about their annual revenue, security revenue, tech split, regional split etc.
d. Frost & Sullivan, also sent survey links to more than 3000 recipients associated with three reputed Industry associations working in the UK – FIA, BSIA, and ADS. However, the survey response rate was very low.
e. Despite sending multiple reminders through all these channels, only 25 companies responded to surveys, with 23 providing meaningful information. It is understood through feedback from the associations and the industry that the COVID situation has led to the low turnout as companies are priorities business continuity in these challenging times.
f. To gather the required information about the UK based companies following steps were also performed:
i. F&S searched the company’s website to find the details from their annual/ quarterly balance sheets.
ii. If revenue details were not available on the company website, then we searched UK Companies House data https://beta.companieshouse.gov.uk/, for their annual reports & financial statements.
iii. If revenue details were not available on any of the above sources, then we captured the details from other reputed secondary sources. Respective sources are mentioned for each of the companies.
iv. If regional or technology split was not available directly, numbers were derived through extrapolation and analysis of available data. Supporting details have been presented in the comments section of the associated Data sheets.
g. Revenue details of 244 companies were collected from the above methods and are presented in this research.
h. Please note, where 2019 data was not available, F&S used the most recent available data.
i. All the data is reported in GBP.
j. To validate our findings, we further conducted primary interviews.
k. The companies are sorted/ ranked by their security revenue.
To capture the unknown market
a. With the above steps we could find the value for known markets (wherein companies have published their numbers). To find out the total market, which also includes the market share of SME’s or the share of companies which are left? Two separate models have been created to identify the un-captured (or un-known) market.
b. These modes are based on quantitative and qualitative parameters such as UK Exports, Country Exports & Tech Segment Characteristics.
Important Considerations to Note:
For the purpose of this project, the following ‘security export’ definition has been used:
a. A security export consists of any sale of security product, service or solution sold from a UK registered organisation where the revenue is registered in the UK.
b. Sales from UK companies where revenue is reported and attributed to registered offices in other countries, is not counted as an export, as these have not been attributed to the UK. For example, some companies have reported that it is their business model to have registered entities within countries and allocate revenue, work and sales to these countries and not the UK.
c. Sales to defense organisations (MoD or DoD) are not in scope when clearly defined. Although in some cases there was no clear differentiation of security revenue when sold to governments whether it was for defense or security purposes, in such cases entire security revenue is considered.
6. Methodology: UK security exports by country
6.1 Methodology overview
Data sources
The financial data included the following sources:
- industry press release
- World bank database
- United nations database
- International monetary fund
- OECD database
- other supranational organisations data
- universities and .gov databases
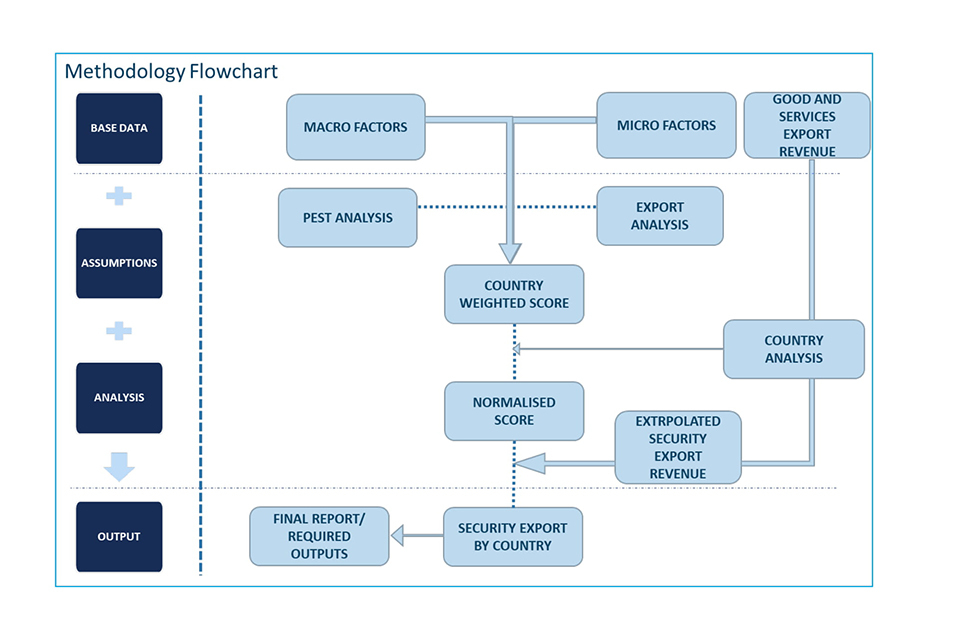
6.2 Methodology Approach
The following methodology has been adopted for finding the UK Security exports by country:
a. F&S researched and collated data from the verified open-source to get the primary estimate of Export strength of a country.
b. Conducted the PEST Analysis to find out the geopolitical stability and technological development of a country using the following macro parameters. c. Export strength was analysed by looking at the country’s arms export, high-tech export and cyber security strength.
d. F&S conducted the assessment of country’s security industrial base through knowledge gathered by extensive primary and secondary research.
e. A weighted score is calculated from PEST analysis, Export strength analysis and F&S assessment of country security industrial base.
f. A normalised score is generated with respect to benchmarked countries in the respective economic group where security export numbers are available, or other data points are available for estimation.
g. All countries are then assessed and benchmarked with respect to a country in their respective economic group, to give an estimate percentage of the total goods and services exports WRT security exports.
h. To calculate the security imports as per customer region the SIPRI region-wise Arms Import data is analysed, and equivalent percentage share is multiplied with total security export numbers (calculated in the above steps).
i. With these analyses and calculations, we established the estimated security exports by country. Output was then validated against benchmarks, including the total security market, and internal security market dynamics of each country.
Important Considerations to Note:
a. China was considered as a developed country for this exercise due to the country’s security industrial base maturity and its export reach.
b. Sweden - for the diversity of its portfolio and presence of companies across the tech segments- Assa Abloy, SaaB, Axis Communications, Sweden is assessed to have a higher percentage of the reference score (adjusted).
c. Germany - due to its overbearing exports data from other sectors (such as auto, aerospace) has been averaged between European Advanced Economies and Developed Economies.
d. All countries are then assessed and benchmarked with respect to a country in their respective economic group, to give an estimate percentage of the total goods and services exports with respect to the security exports. The following countries are considered for this exercise.
i. UK for advanced developed countries.
ii. Spain for developed countries.
iii. India for developing countries.