Tri-service reserves continuous attitude survey 2026: main report
Published 6 August 2026

© Crown copyright 2026
This publication is licensed under the terms of the Open Government Licence v3.0 except where otherwise stated. To view this licence, visit nationalarchives.gov.uk/doc/open-government-licence/version/3 or write to the Information Policy Team, The National Archives, Kew, London TW9 4DU, or email: psi@nationalarchives.gov.uk.
Where we have identified any third party copyright information you will need to obtain permission from the copyright holders concerned.
This publication is available at https://www.gov.uk/government/statistics/tri-service-reserves-continuous-attitude-survey-2026/tri-service-reserves-continuous-attitude-survey-2026-main-report
This survey of Volunteer Reserves covers satisfaction with various aspects of being a Reservist. These statistics are used to inform the development of policy and measure the impact of decisions affecting Reservists, such as those relating to the development of a modernised employment offer for the Armed Forces.
1. Key Points and Trends
Reserves continue to remain highly committed to Reserve Service in 2026
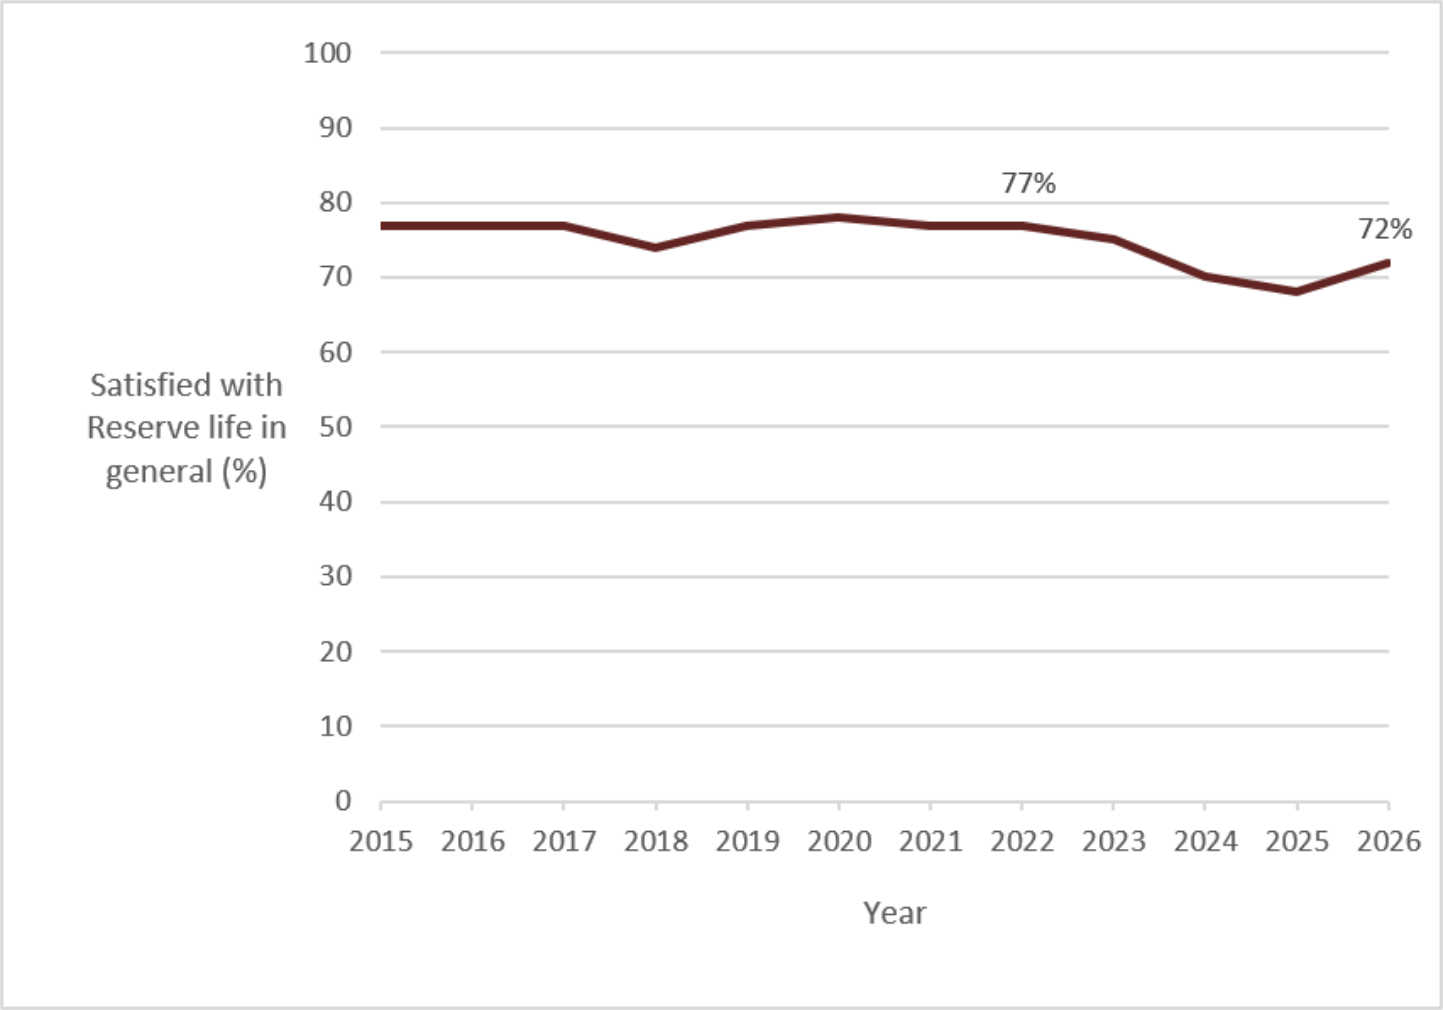
Volunteer Reserves continue to report high levels of commitment to Reserve Service in 2026. Nearly three quarters (72%) are satisfied with life in their Service in general, 91% are proud to be in the Reserves and 82% would recommend joining the Reserves to others.
Whilst these measures have remained similar to last year, levels of personal attachment and motivation have increased. Nearly three quarters (72%) report a strong personal attachment to their Service, up from 68% in 2025, while 61% feel motivated to help their Service achieve its objectives, up from 56% last year.
Figure 1 shows satisfaction with life in the Reserve since 2015. Satisfaction has remained broadly stable since 2023 but is generally lower than levels reported between 2015 and 2022.
Figure 1: Satisfied: Satisfaction with life in the [Service] Reserve in general since 2015
Satisfaction with Reserve Service pay remains below historical levels
Satisfaction with Reserve Service pay has remained stable since last year but continues to sit below levels reported in earlier years of the survey. In 2026, 45% of Volunteer Reserves are satisfied with their Reserve Service pay, compared with 54% in 2015 and down from a peak of 57% in 2021.
Officers remain more satisfied with their Reserve Service pay than Other Ranks (57% compared with 41%). Satisfaction with pay has decreased since 2021 for both Officers and Other Ranks.
Figure 2: Satisfied: Satisfaction with Reserve Service pay since 2015
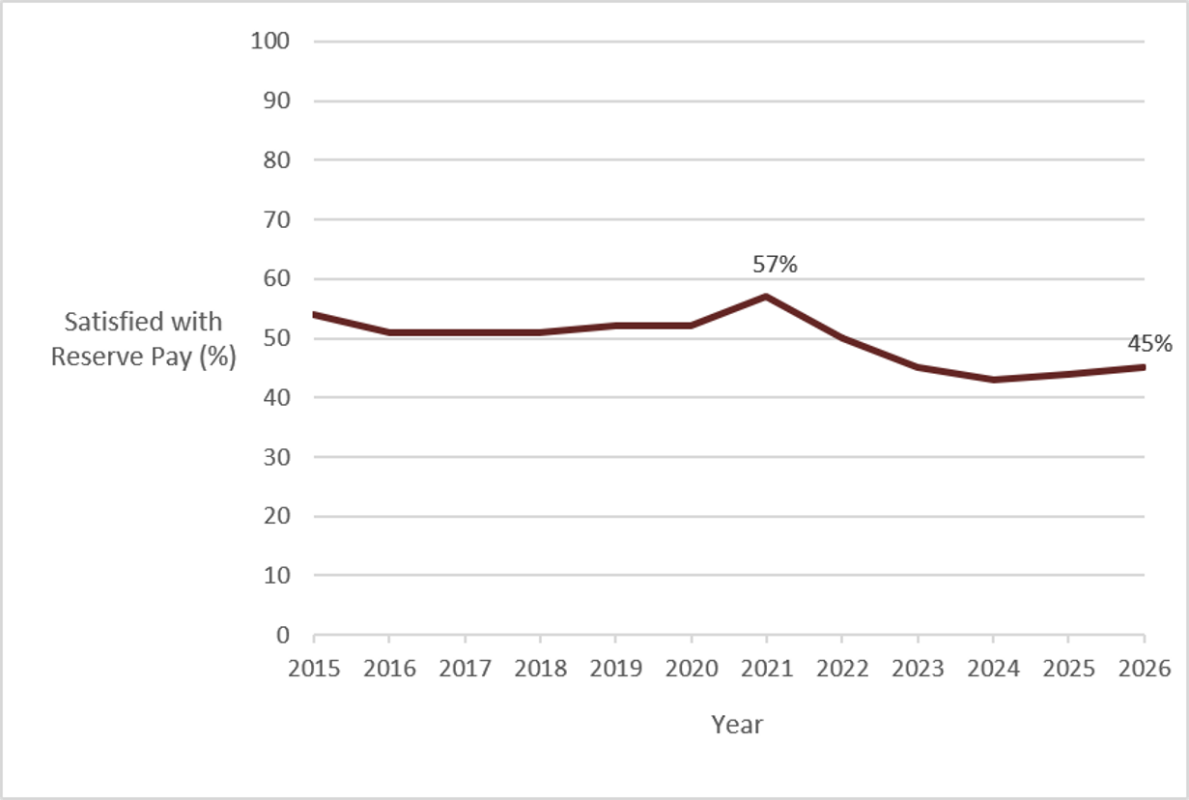
Figure 2 shows satisfaction with Reserve Service pay from 2015 to 2026. Satisfaction peaked at 57% in 2021 before falling to 45% in 2026. Whilst satisfaction has remained broadly stable since 2022, it remains below the levels reported prior to 2022.
Civilian employer support for Reserve Service remains higher than in 2015
Compared with the 2015 baseline, Volunteer Reserves are more positive about the support they receive from their civilian employers. The proportion reporting that their employer supports their Reserve Service has increased from 70% in 2015 to 78% in 2026, whilst those reporting that their employer values their Reserve Service has increased from 50% to 62%.
There has also been an increase in the proportion of Reservists who believe that being a Reservist is good for their civilian career, rising from 47% in 2015 to 59% in 2026.
Whilst these measures are higher than the 2015 baseline, perceptions of employer support and employer value of Reserve Service have remained broadly stable in recent years, with employer support unchanged since 2018 and employer value unchanged since 2019.
Figure 3: Agree: My main civilian employer supports my Reserve Service, values my Reserve Service and being a Reservist is good for my civilian career against the baseline year
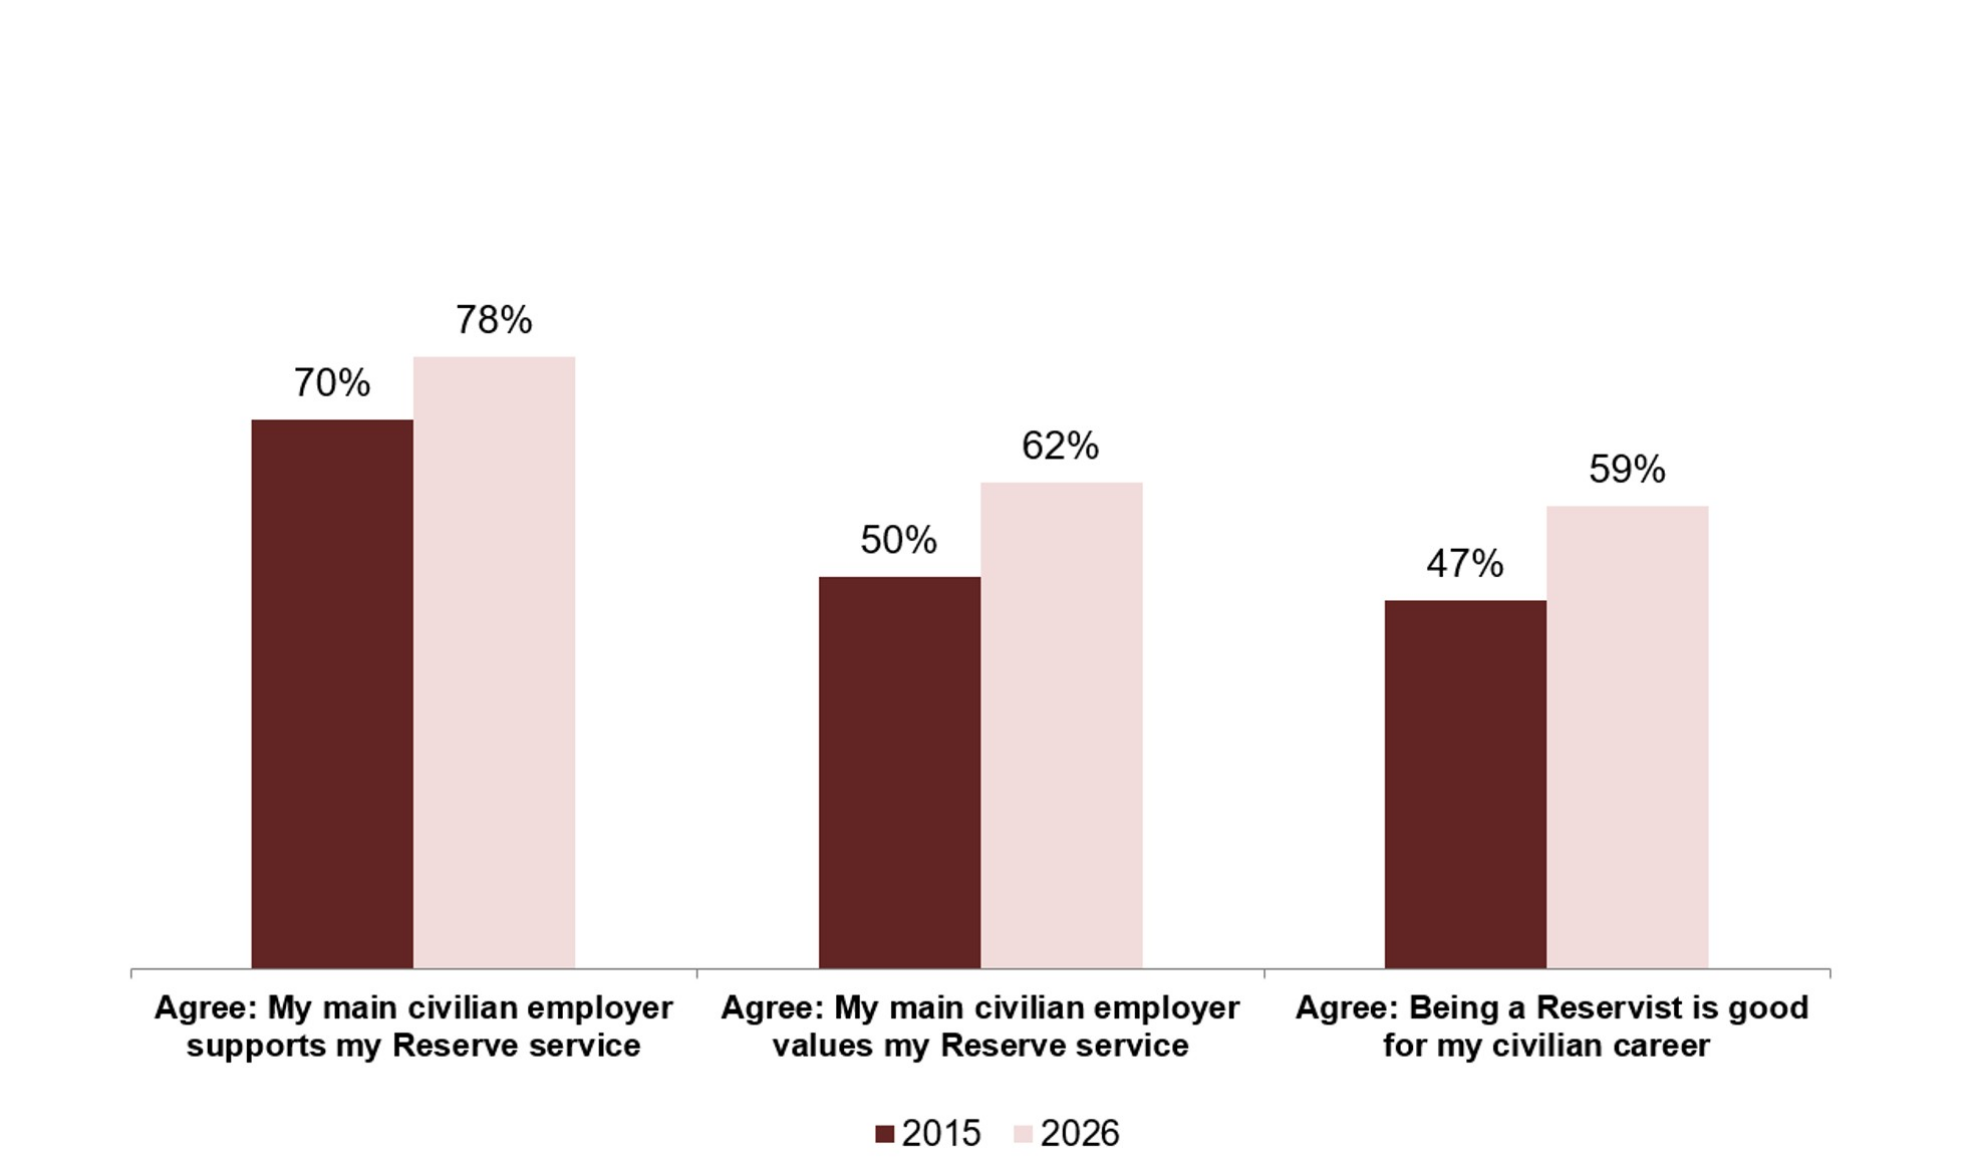
Figure 3 shows that perceptions of civilian employer support, employer value of Reserve Service and the benefits of Reserve Service for civilian careers have all increased since the 2015 baseline year.
Responsible Statistician: Surveys Head of Branch
Email: Analysis-Surveys-Enquiries@mod.gov.uk
Background Quality Report: ResCAS webpage
Would you like to be added to our contact list, so that we can inform you about updates to these statistics and consult you if we are thinking of making changes? You can subscribe to updates by emailing Analysis-Surveys-Enquiries@mod.gov.uk.
2. Introduction
The Reserves Continuous Attitude Survey (ResCAS) is a Tri-Service annual survey of Volunteer Reservists and is one of the main ways that the department gathers information on the attitudes and experiences of Volunteer Reservists. The data is used to inform and shape decisions and policy development in a range of areas including remuneration, training, equipment, support, and Conditions of Service (COS). The survey was distributed online between January 2026 and April 2026.
Tri-Service questions were first asked in 2014. However, due to substantial changes in 2015 to the ResCAS Army survey methodology and to the Army and RAF target populations, 2014 results are not comparable and no comparisons to the 2014 results have been made in this publication. UK trained Regular personnel results are presented in some places for contextual information, sourced from the Armed Forces Continuous Attitude Survey 2026 (AFCAS 2026). No statistical significance testing has been completed between AFCAS and ResCAS data.
Three new Tri-Service questions were added to the ResCAS in 2026. These questions measure satisfaction with three aspects of respondents’ current roles: the level of challenge, the amount of variety in their work, and the level of excitement in their role. The results are presented in Section 1b of the accompanying reference tables published alongside this report.
Response Rates:
4,587 responses were received representing an overall response rate of 24%, up from 21% last year. Despite increasing by three percentage points compared with last year, there has been a decrease of nine percentage points in the response rate since 2020, when the response rate was 33%.
Figure 4: ResCAS 2026 Response Rates
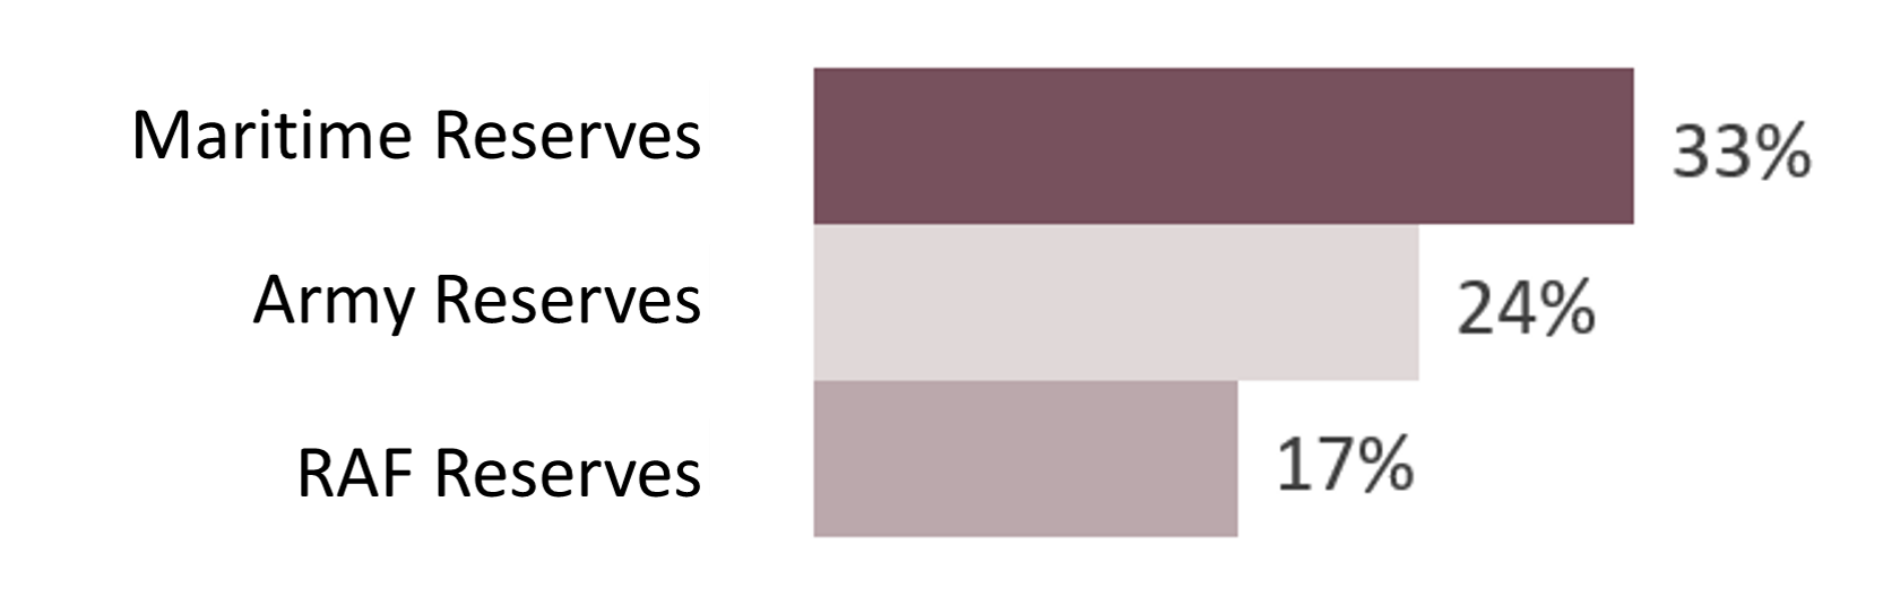
Figure 4 shows the breakdown of response rate by Service. Maritime Reserves had a 33% response rate, Army Reserves had a 24% response rate and RAF Reserves had a 17% response rate.
Reference tables and a list of the Tri-Service ResCAS 2026 questions are published as separate documents and can be found on the ResCAS webpage.
Please see the Background Quality Report for full details of survey methodology, analysis, and data quality considerations.
Only differences that are statistically significant are commented on in this report; statistical tests were carried out at the 99% confidence level. This is at a fairly stringent level and means that there should be less than a 1% (1 in 100) chance that differences observed in ResCAS results are not representative of the Volunteer Reserves as a whole. This reduces the likelihood of wrongly concluding that there has been an actual change based on the survey results, which only cover a sample of the Volunteer Reserves.
3. Summary of attitudinal questions (highest to lowest positive scoring)
Figure 5: Summary of Attitudinal Questions (Part 1 of 2)
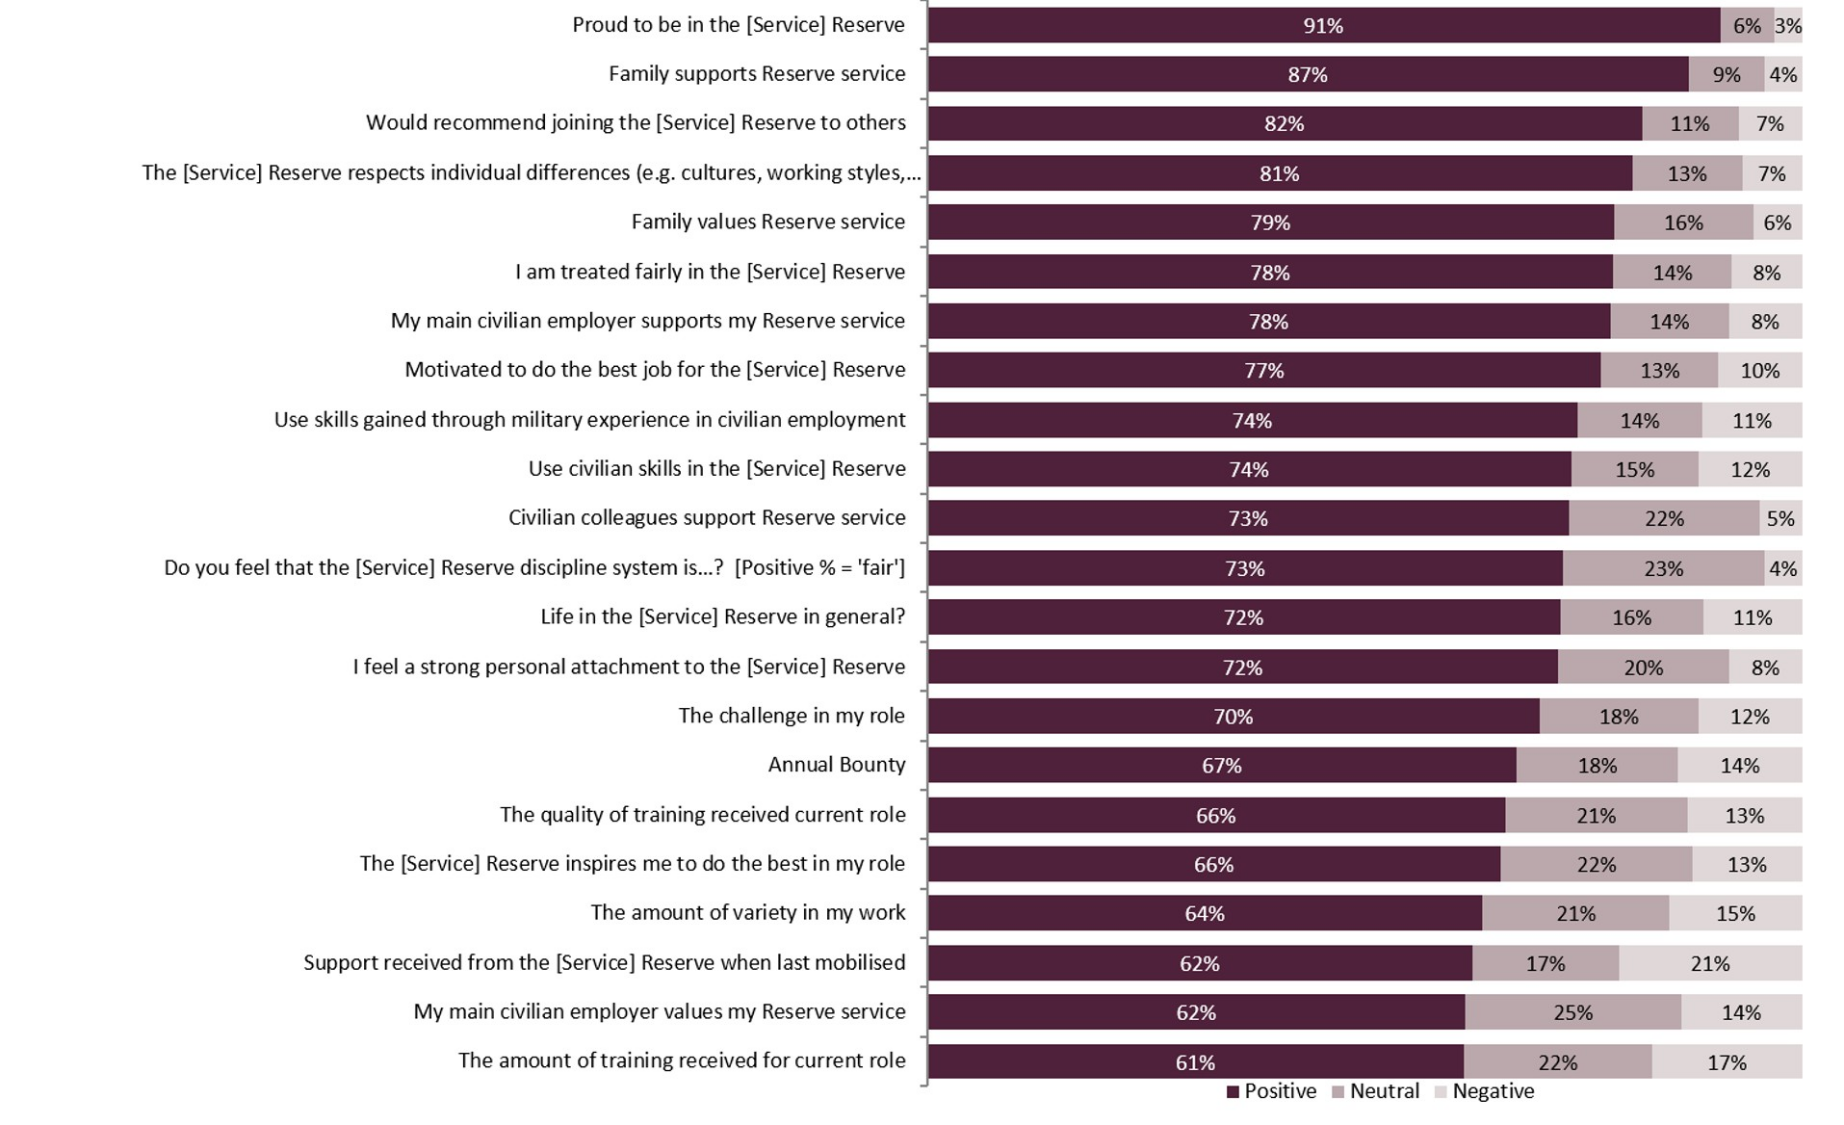
Figure 5 shows a stacked bar chart showing part one of the highest positive scoring attitudinal questions in descending order. ‘Proud to be in the Reserves’ is the highest scoring attitudinal measure, with 91% agreeing. This is followed by ‘My family supports my Reserve Service’ (87%) and ‘My main civilian employer supports my Reserve Service’ (82%).
Figure 6: Summary of Attitudinal Questions (Part 2 of 2)
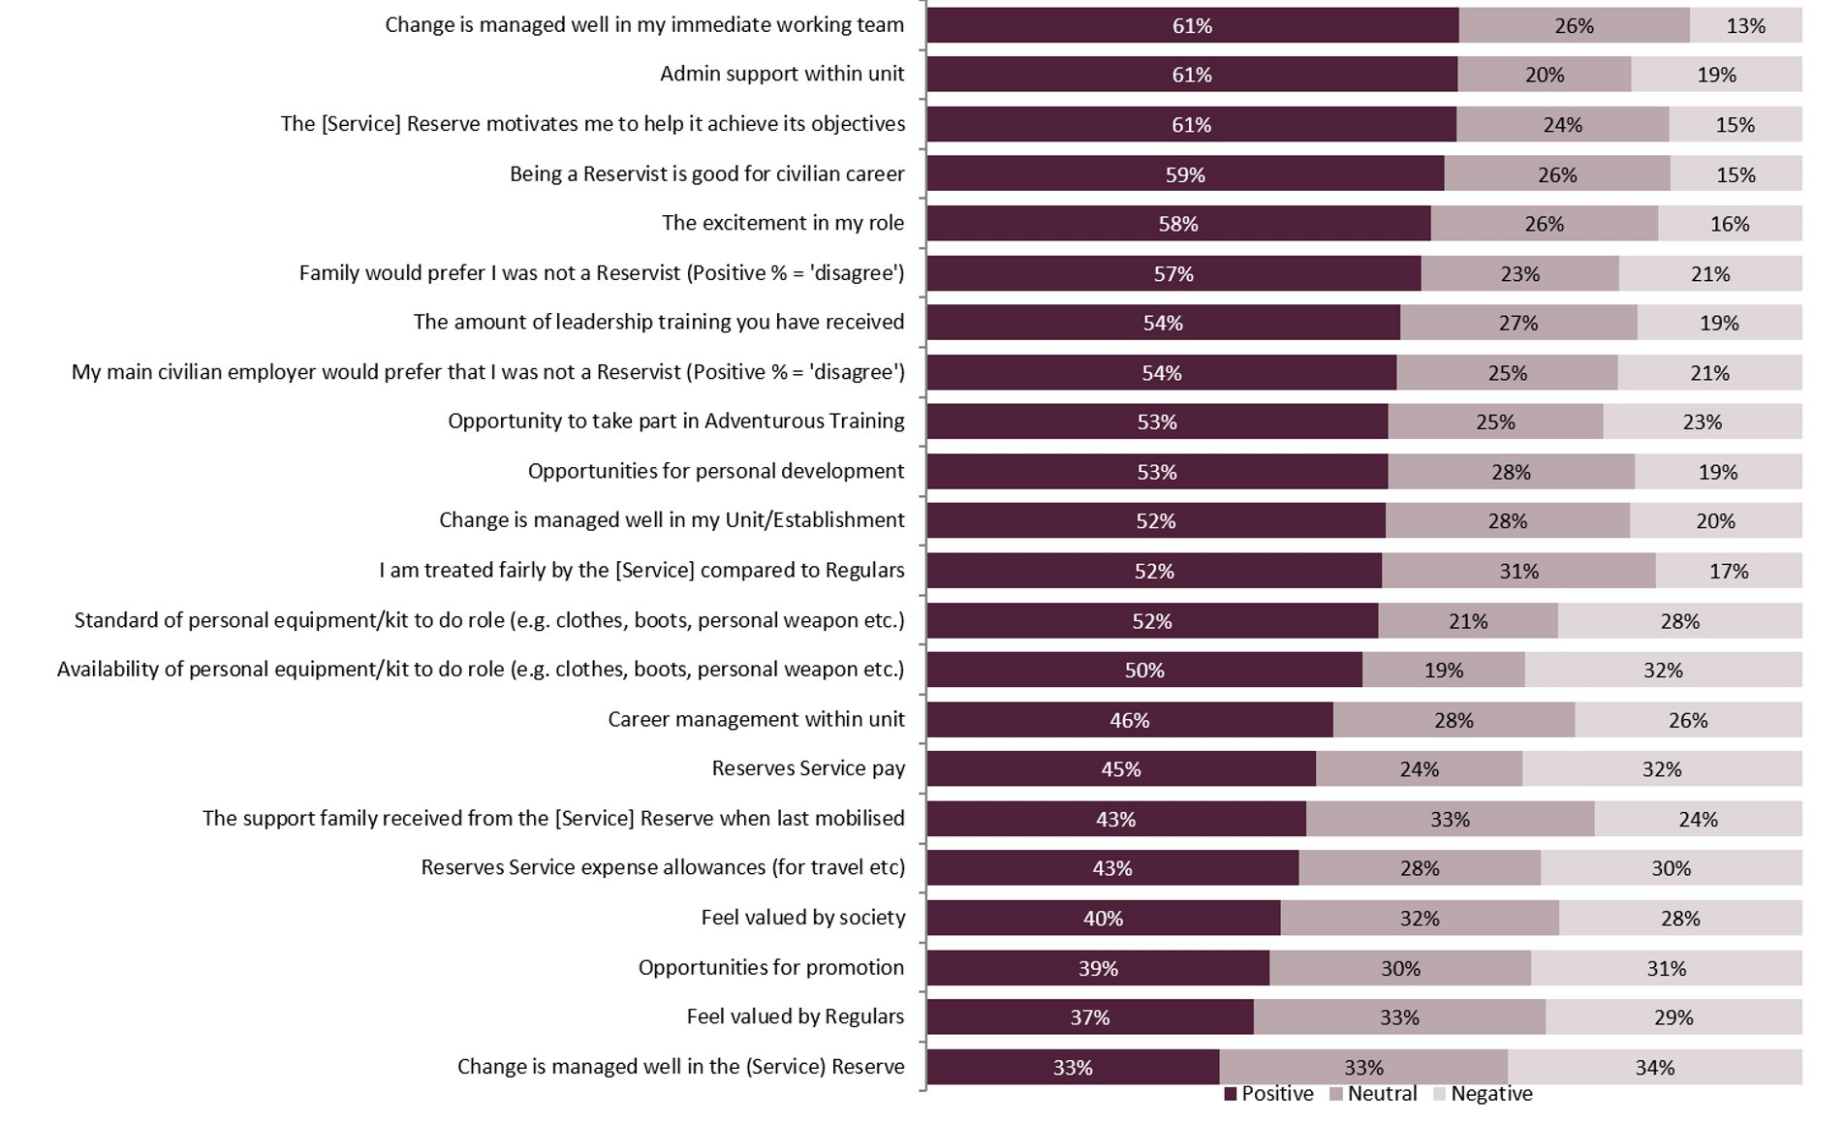
Figure 6 shows a stacked bar chart showing part two of the highest positive scoring attitudinal questions in descending order. Change is managed well in the [Service] Reserve is the lowest scoring, with only 33% agreeing.
4. Summary of changes compared to baseline (attitudinal questions only: % Positive responses)
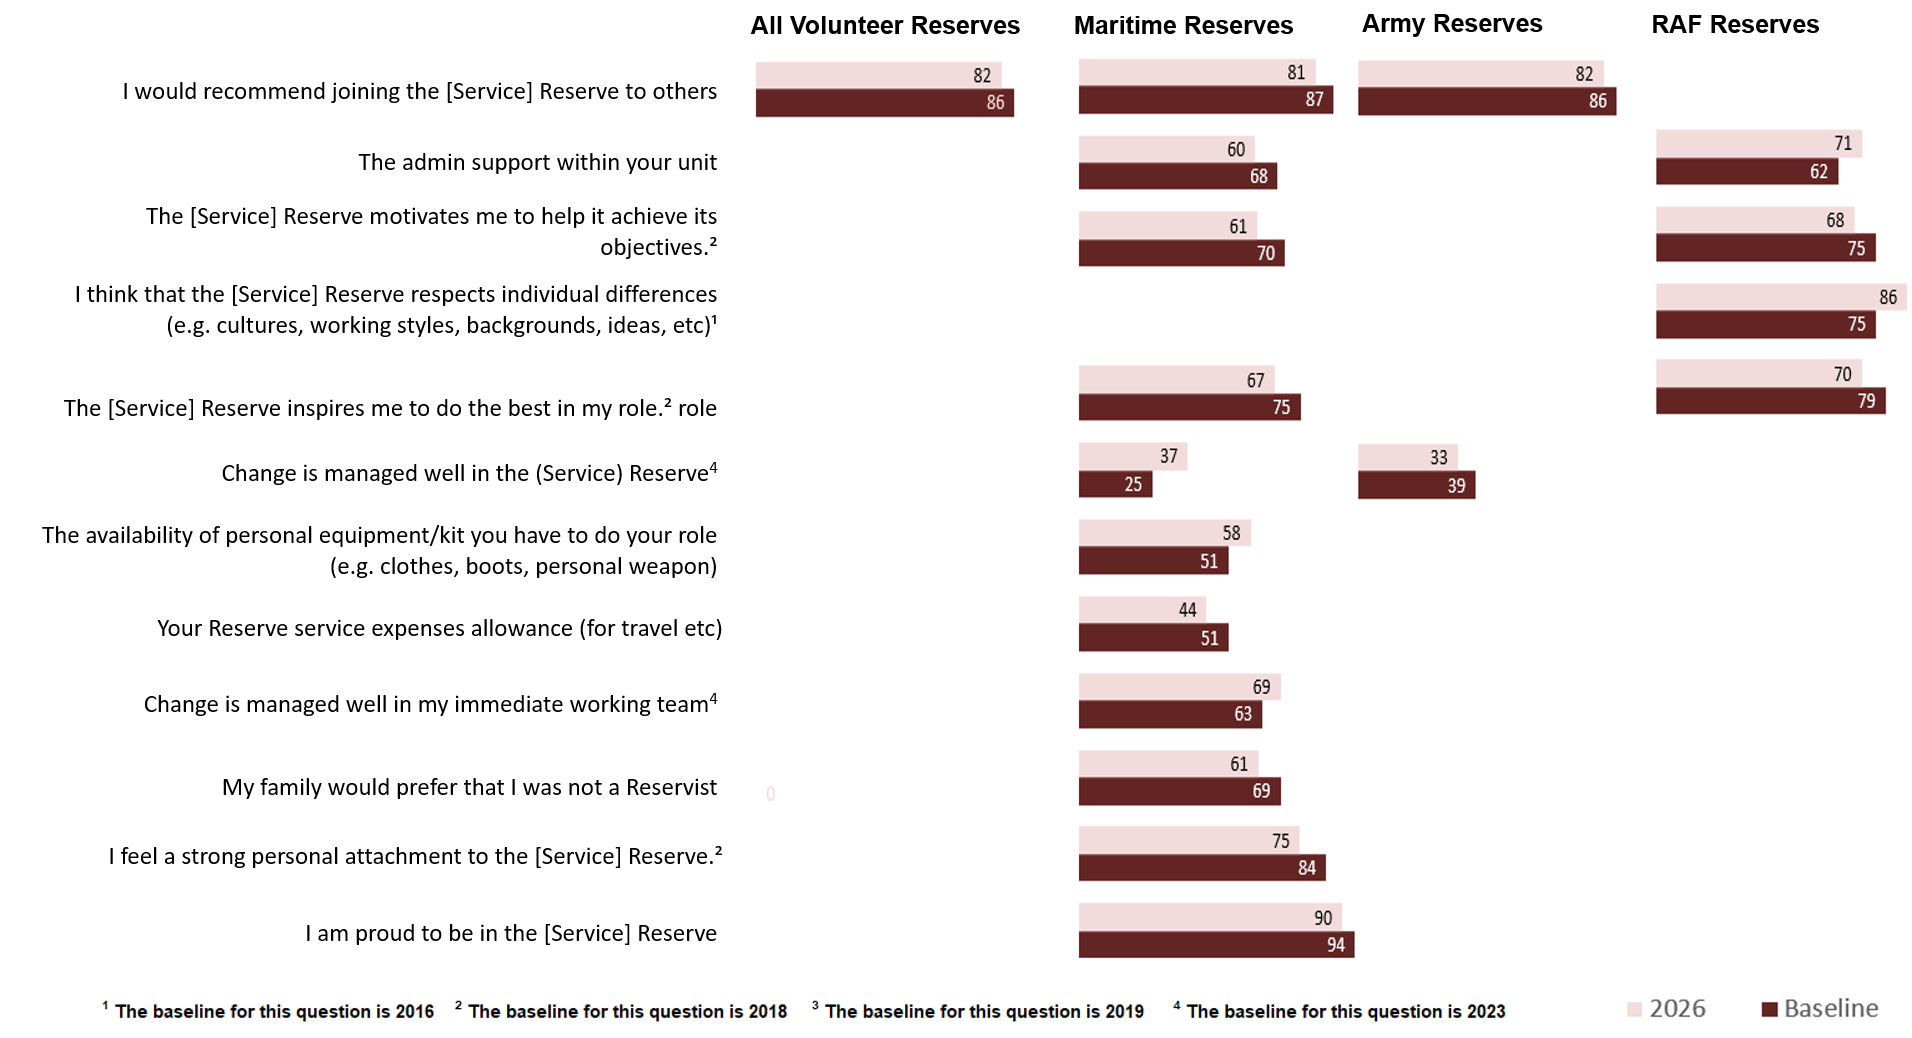
Figure 7 through to Figure 9 below show the statistically significant increases and decreases in percent of positive responses compared to the baseline year (in no particular order). Tri-Service changes are largely driven by the Army Reserve, as the Army Reserve is a large constituent of the total Volunteer Reserves population. The largest improvements since the baseline year continue to relate to civilian employment and employer support.
Figure 7: Summary of changes against the baseline (Part 1 of 3)
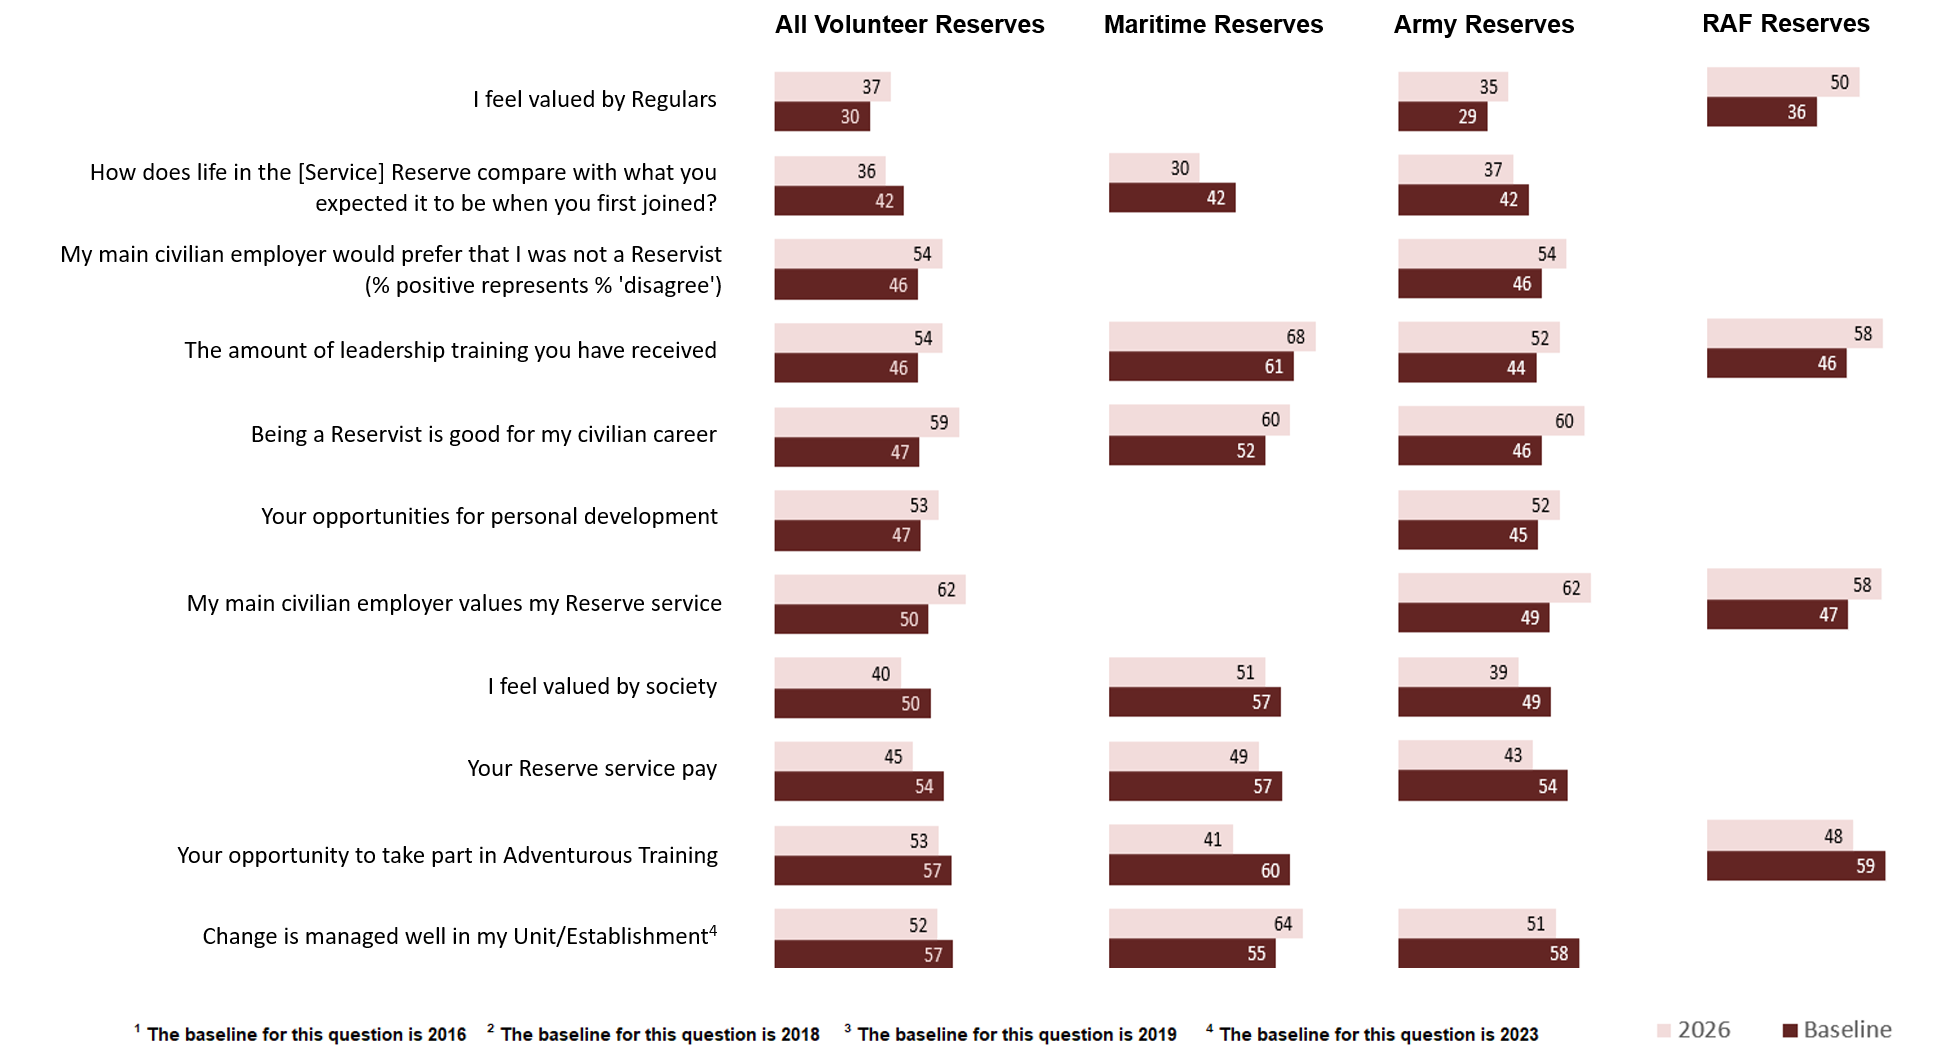
Figure 8: Summary of changes against the baseline (Part 2 of 3)
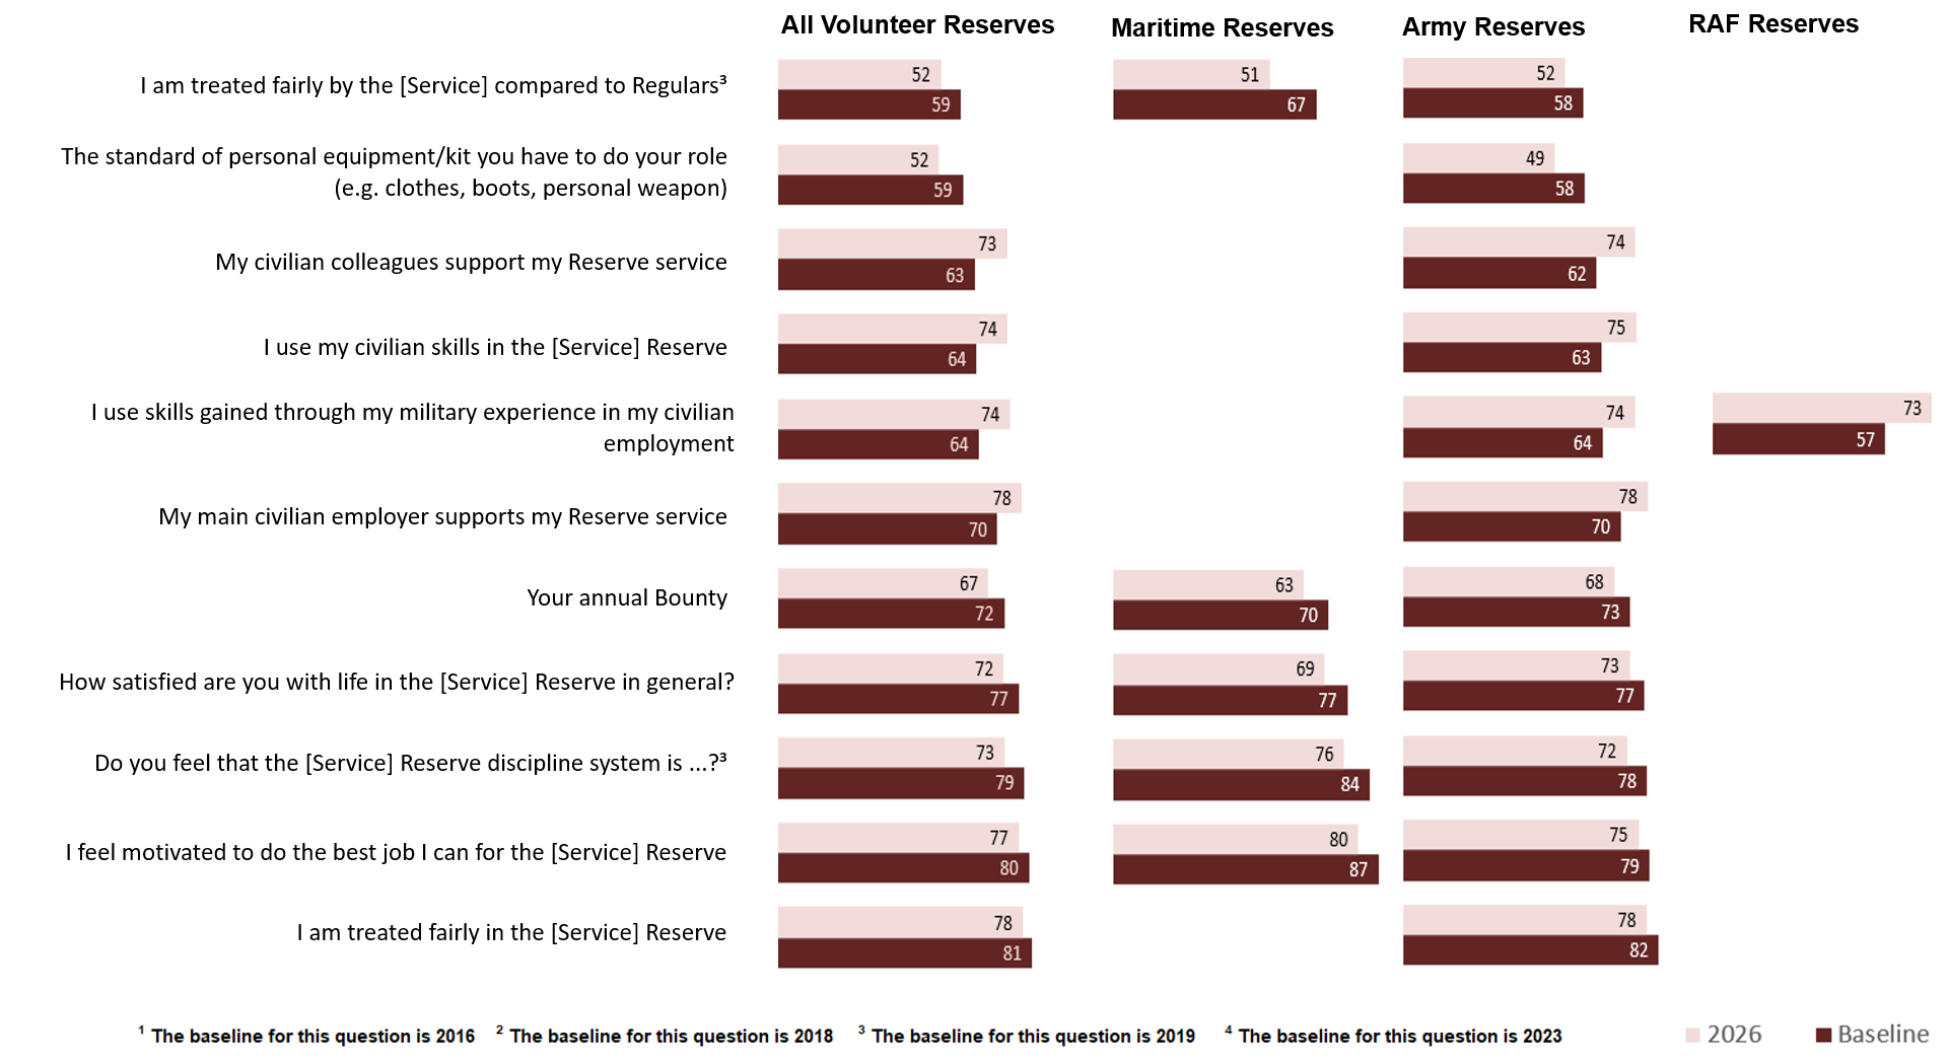
Figure 9: Summary of changes against the baseline (Part 3 of 3)
5. Summary of Service differences (attitudinal questions only: % Positive responses)
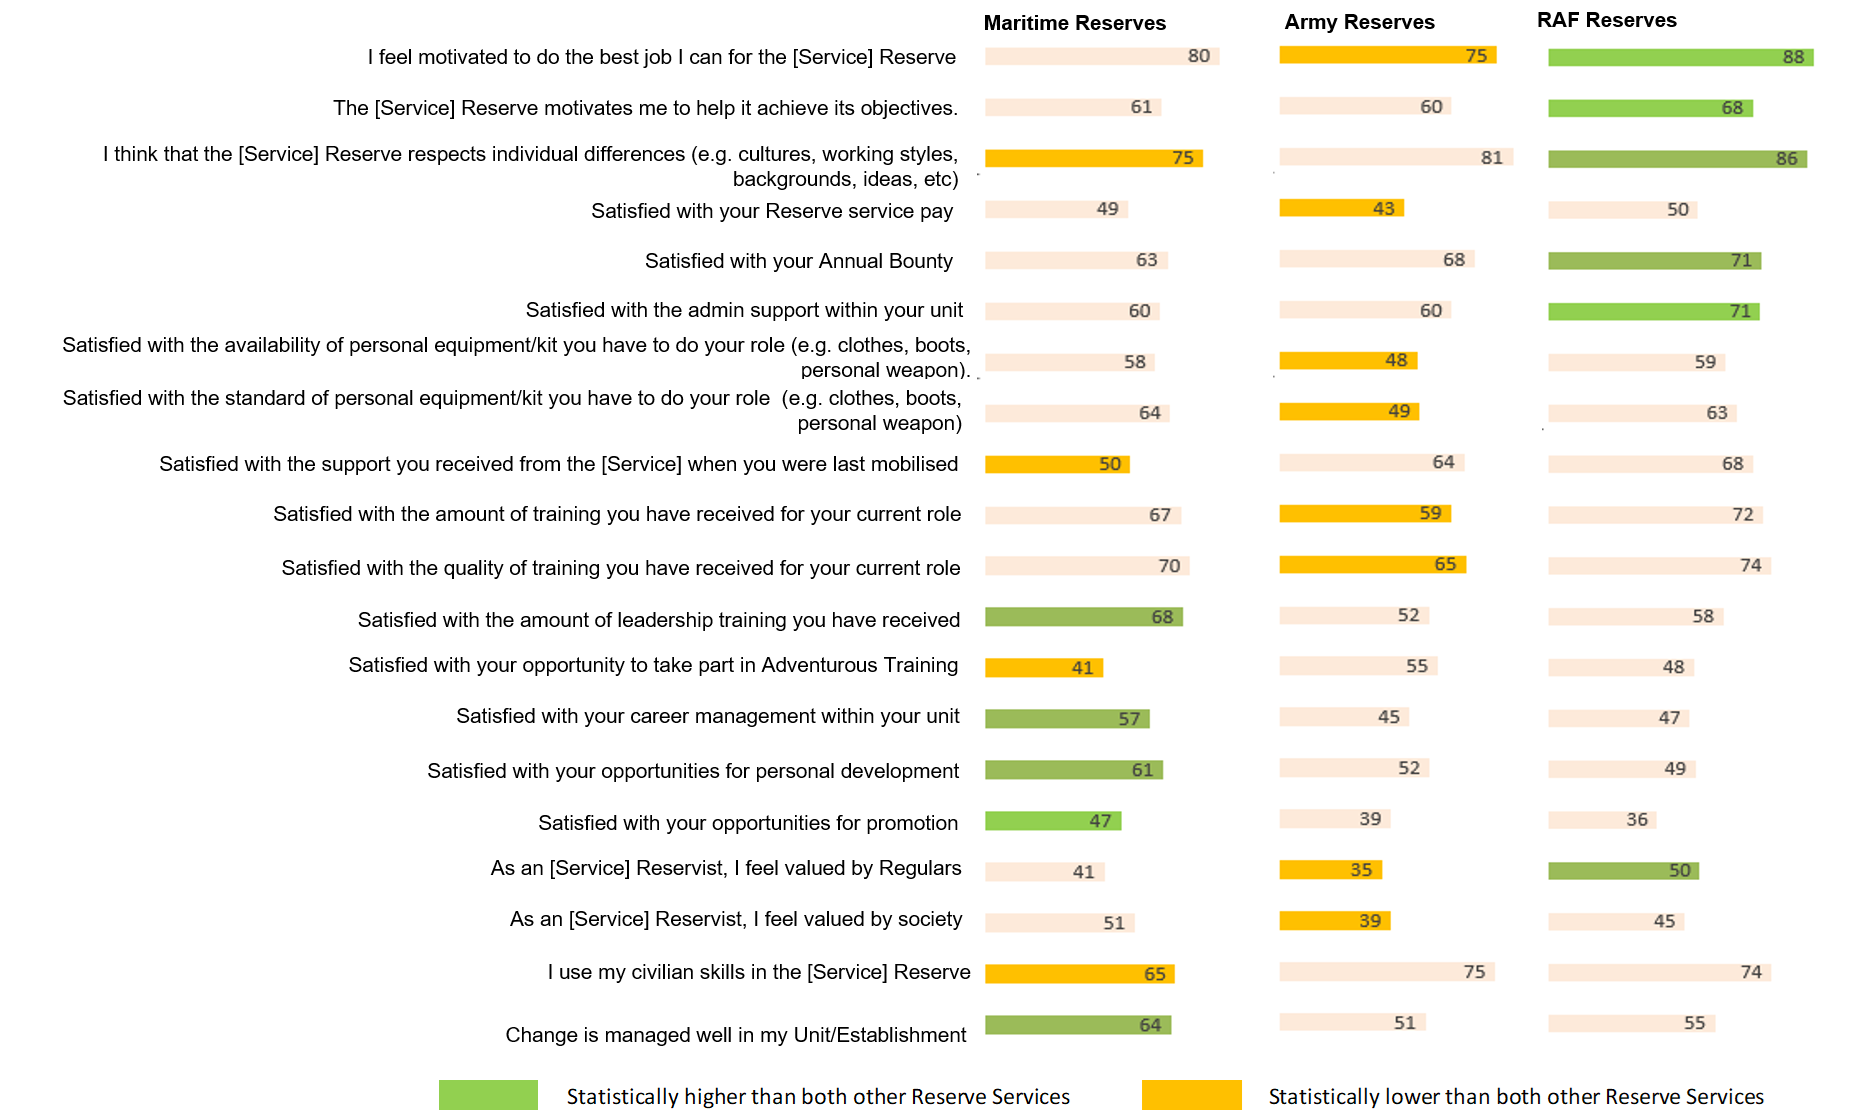
Figure 10 below shows the results to questions where one Reserve Service has scored significantly higher than both the other two Reserve Services, or where one Reserve Service has scored significantly lower than both the other two Reserve Services.
The Army Reserves do not score higher than both the Maritime and RAF Reserves for any question, and score lower than both eight times. Conversely, the RAF Reserves do not score lower than both of the other two Services for any question, scoring higher than both six times.
Figure 10: Summary of Service differences
6. Summary of Officer and Other Rank differences (attitudinal questions only: % Positive responses)
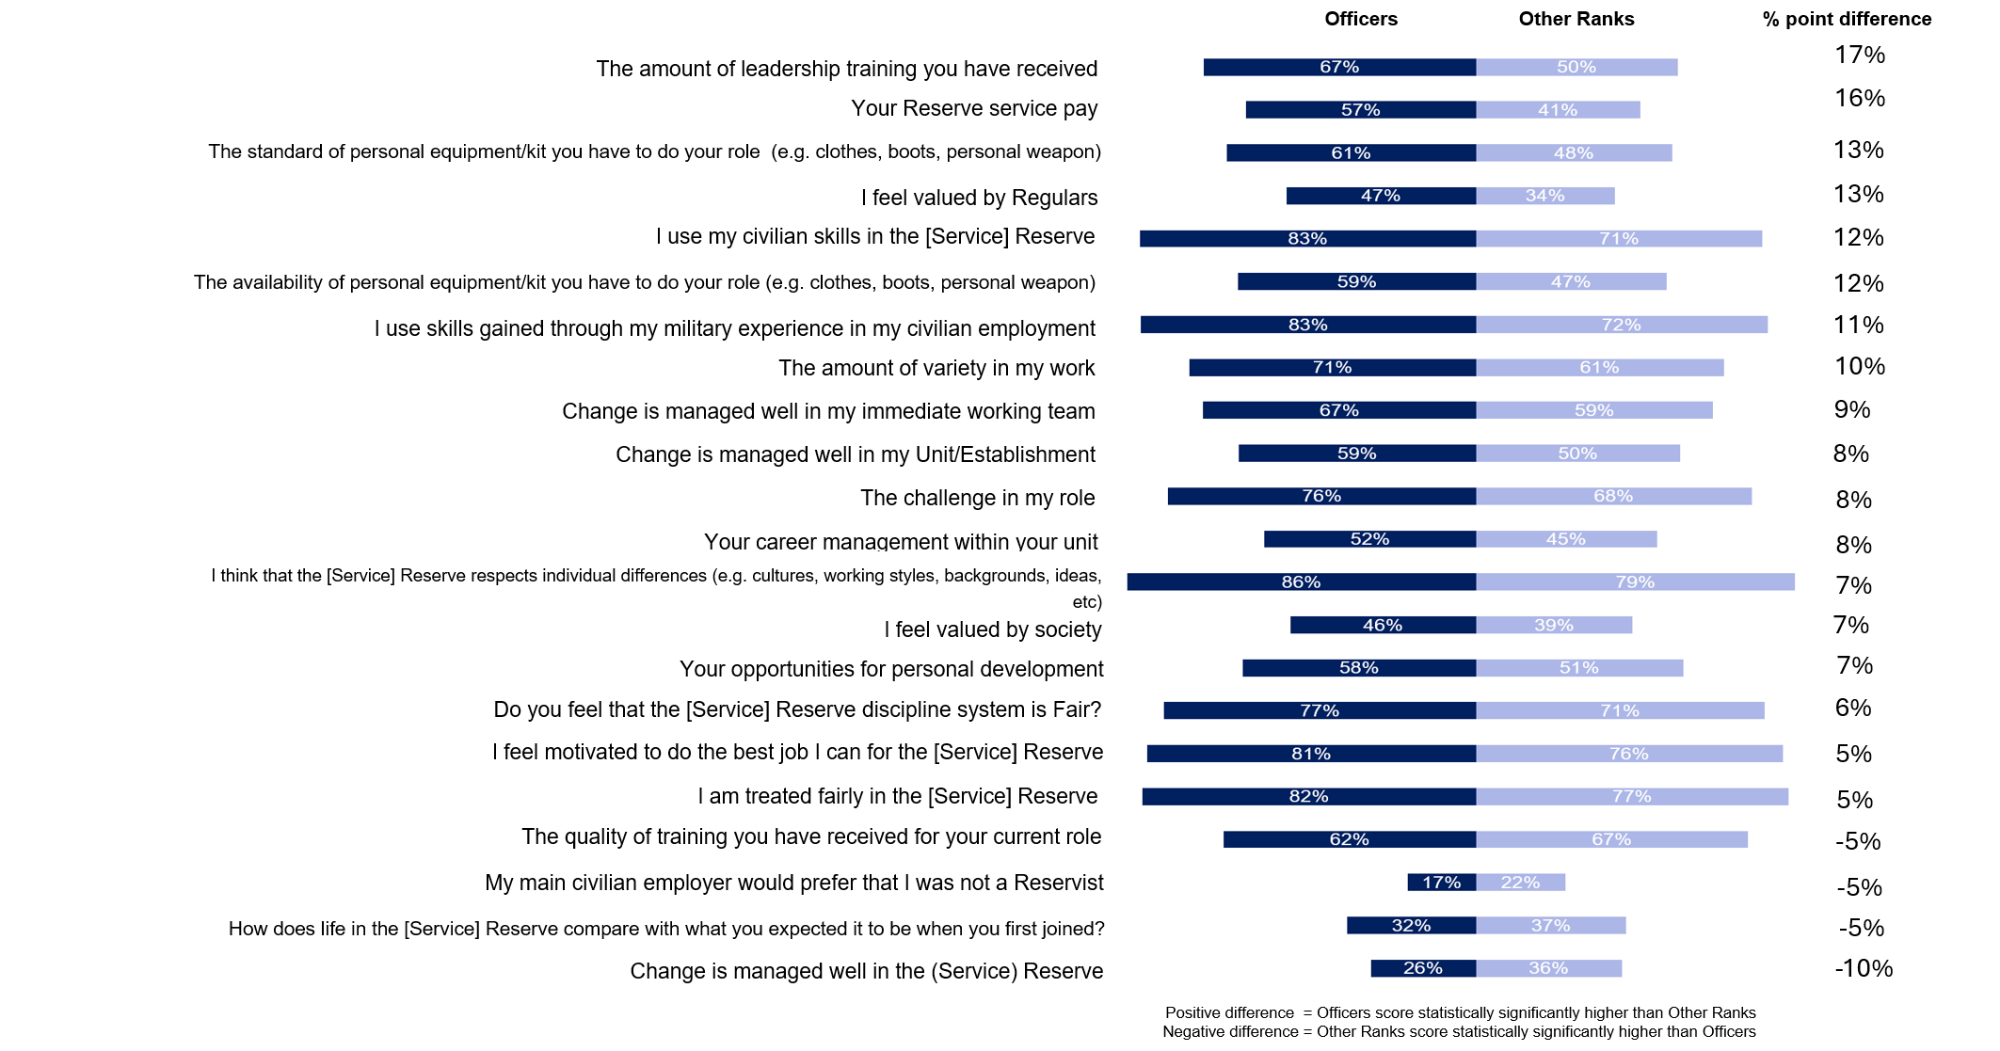
Figure 11 below is a bar chart showing the difference in attitudes between Officers and Other Ranks. There are many aspects of serving in the Volunteer Reserves where Officers report higher levels of satisfaction compared to Other Ranks. These include satisfaction with leadership training received, satisfaction with pay, satisfaction with the quality of personal equipment required for their role, feeling valued by Regulars and the application of civilian-acquired skills in their Reserve Service. Conversely, Other Ranks are more likely to feel change is effectively managed within their Reserve Service.
Figure 11: Summary of Officer and Other Rank differences
7. Overall satisfaction and commitment
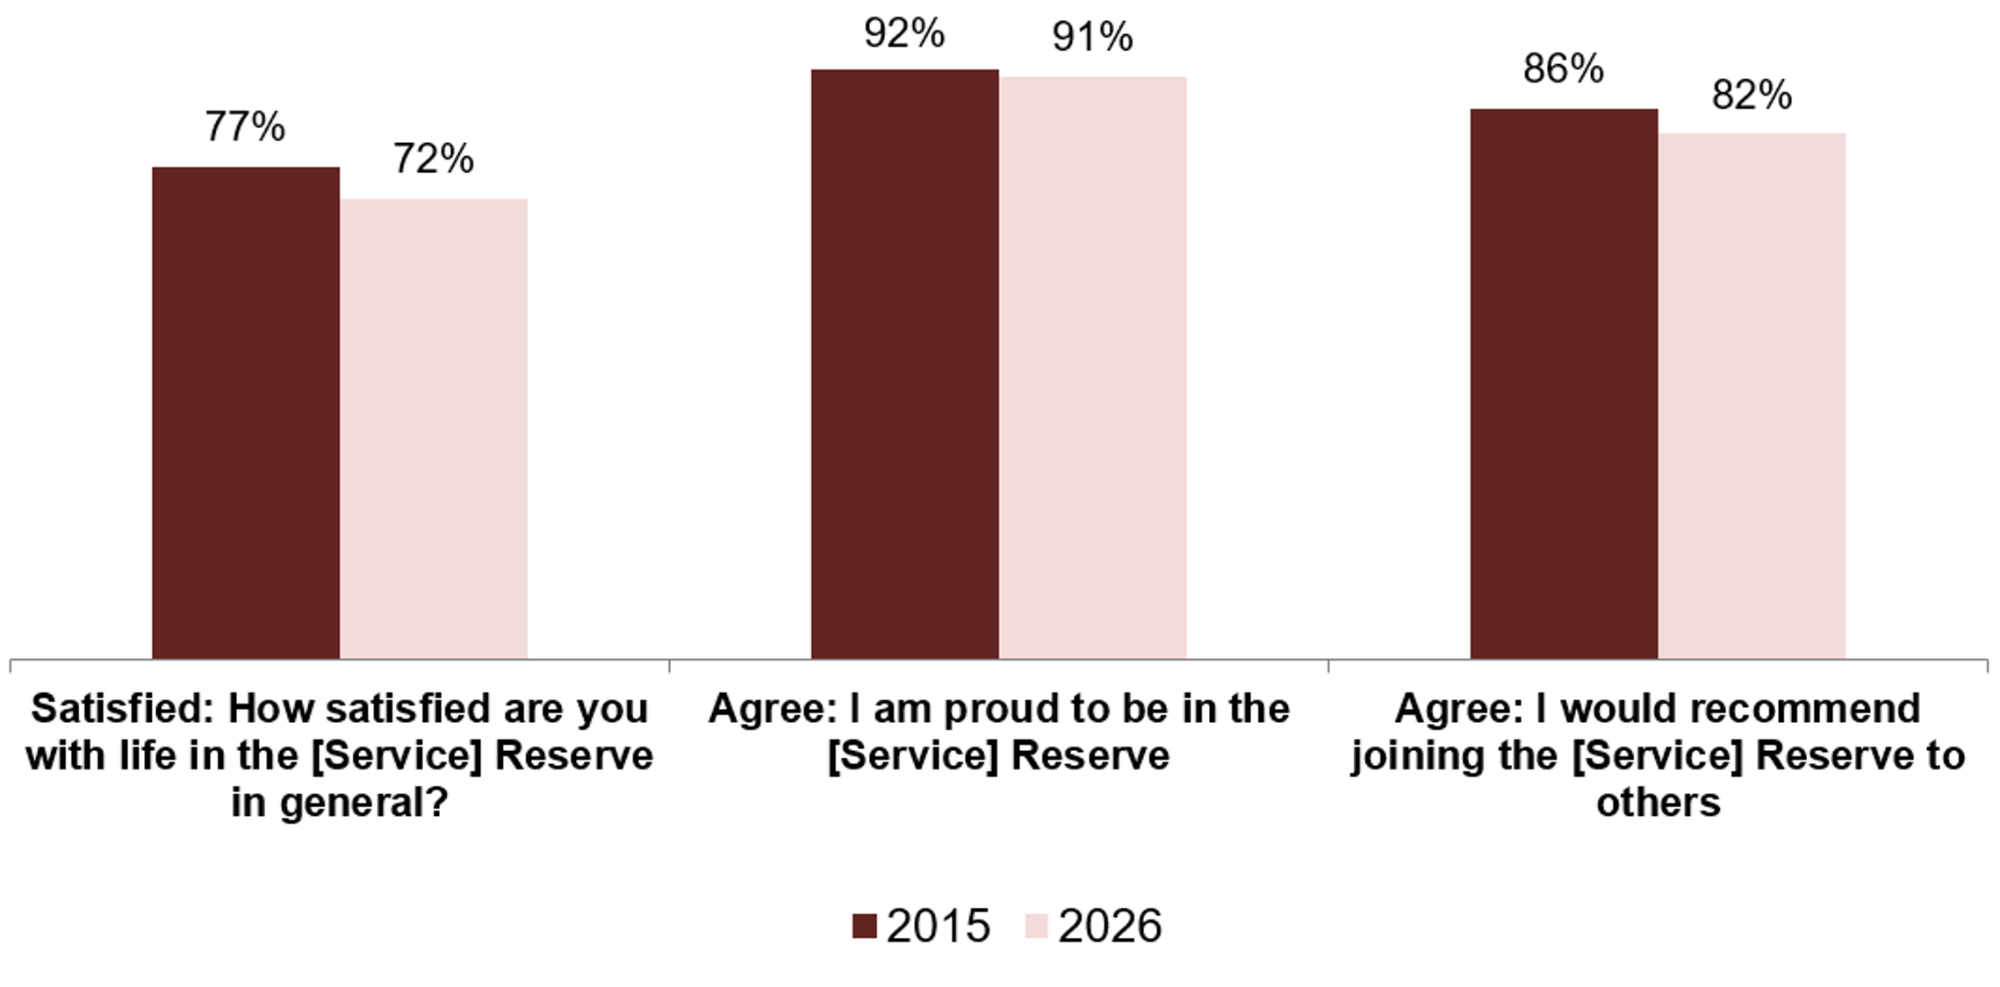
Volunteer Reserves have moderately high levels of satisfaction with life in their Service in general (72%), are very proud to be part of their Reserve Service (91%), and would recommend joining the [Service] Reserves to others (82%).
All three attitudinal measures are at a similar level to last year, but are down from 2022 levels (77%, 93% and 85% in 2022 respectively).
Figure 12 below shows these three measures against 2015 baseline levels. Satisfaction with Service life and advocacy for joining the Reserves are both lower than they were in 2015.
Figure 12: Satisfied: Satisfaction with life in the [Service] Reserve in general & Agree: Proud to be in the [Service] Reserve & Agree: I would recommend joining the [Service] Reserve against baseline year
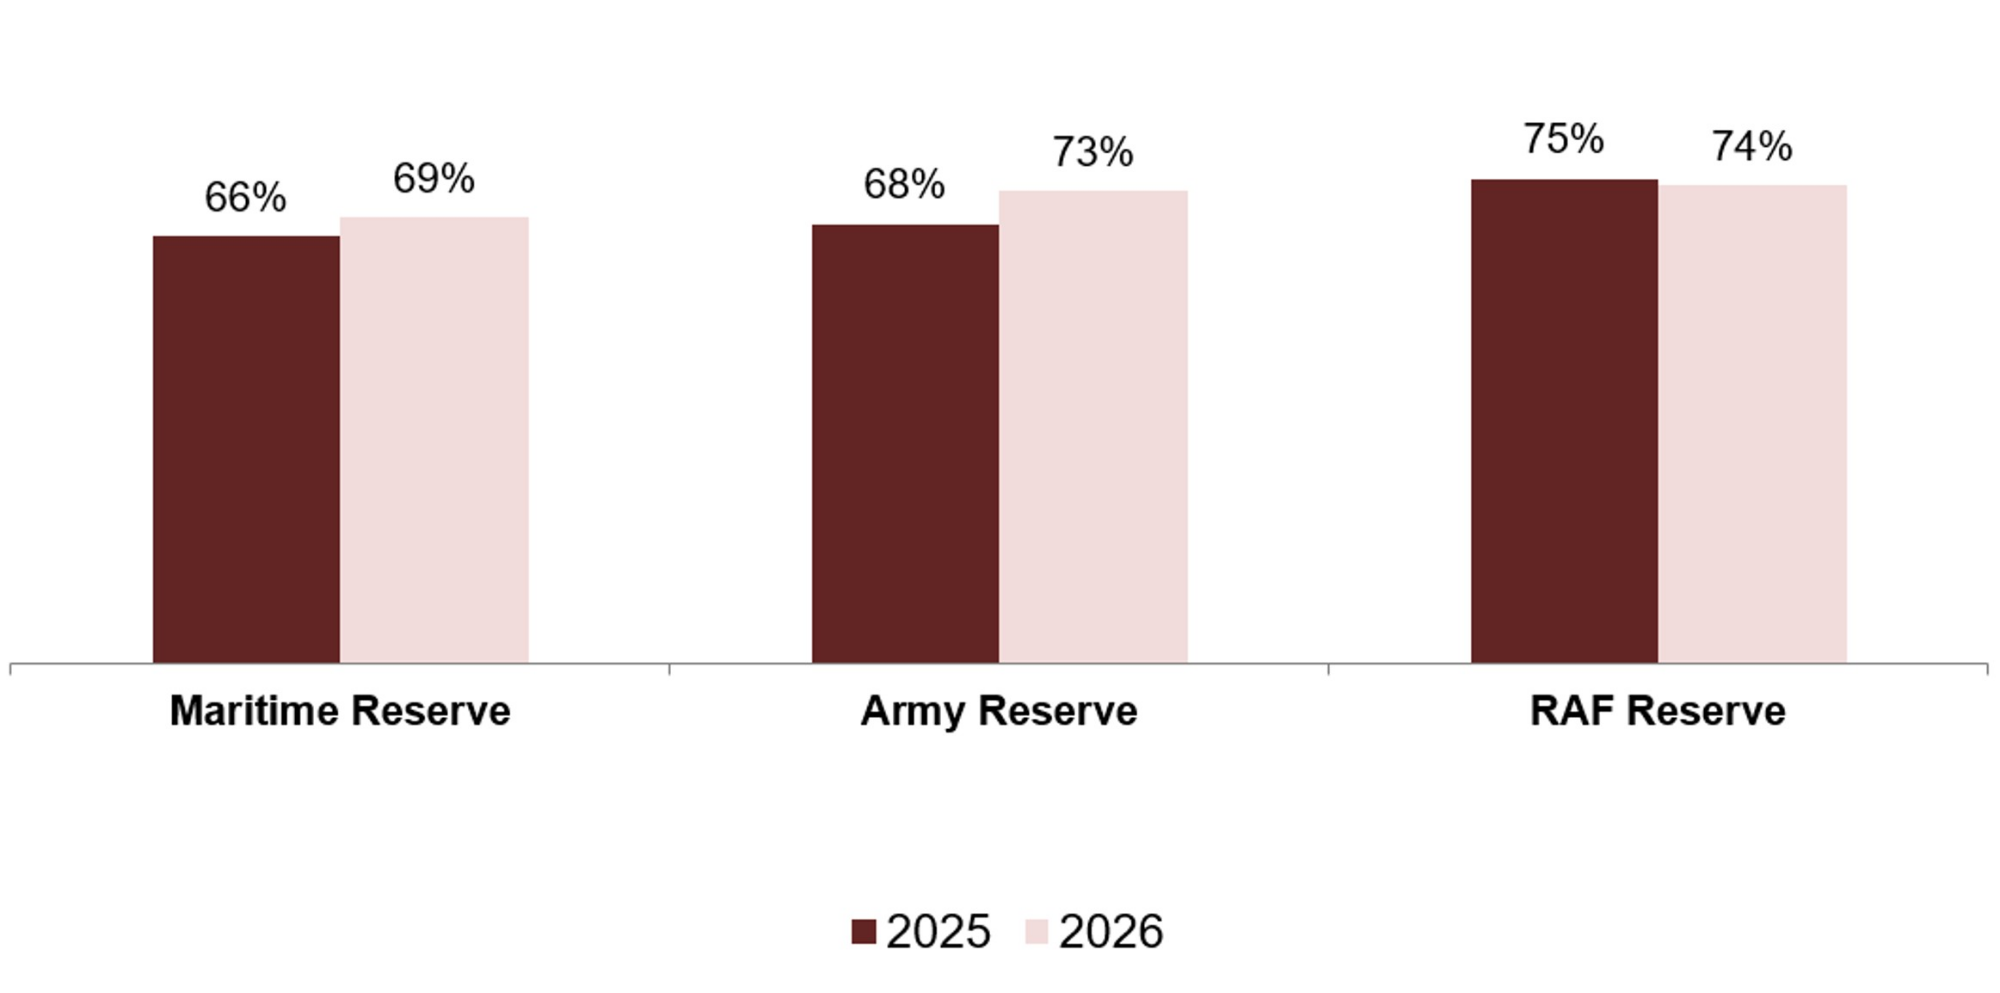
Maritime Reserves satisfaction of Service life (69%) has remained stable since 2023, and is up from 2022 levels (60%). The Maritime Reserves’ pride in being part of their service (90%) has remained stable since 2023, but advocacy for their service has increased (up to 81% from 74% last year).
Army levels of satisfaction with Service life (73%) have remained similar to last year. The Army Reserve also reported similar levels in pride (90%) and advocacy (82%) for their service compared to last year.
RAF Reserve levels of satisfaction with life in the Service have remained relatively stable this year (74%). Pride (93%) and advocacy (84%) for their Service are both also unchanged since last year.
Figure 13 shows the changes in general satisfaction with Service life for each Service since last year. General satisfaction levels for all three Services have remained stable.
Figure 13: Satisfied: Satisfaction with life in the [Service] Reserve in general by Service against last year
Nearly three quarters of Volunteer Reserves report having a strong personal attachment to their Service (72%), up from 68% last year. 66% of Reservists feel inspired by their Service to perform the best in their job (similar to 2025), whilst 61% report feeling motivated to help their Service achieve its objectives (up from 56% last year).
Army Reserve levels of personal attachment (71%), inspiration to do the best in your role (65%) and motivation to achieve Service objectives (61%) have all remained stable compared to baseline 2018 levels. Army Reserve levels of personal attachment have increased since last year (65% in 2025).
The Maritime Reserves have experienced a drop in all three measures since 2018 baseline levels, whilst the RAF Reserves inspiration to do the best in their role and motivation to achieve Service objectives have decreased over the same period.
Figure 14: Agree: The [Service] Reserve inspires me to do the best in my role, motivates me to help it achieve its objectives and I feel a strong personal attachment to the [Service] Reserves by Service
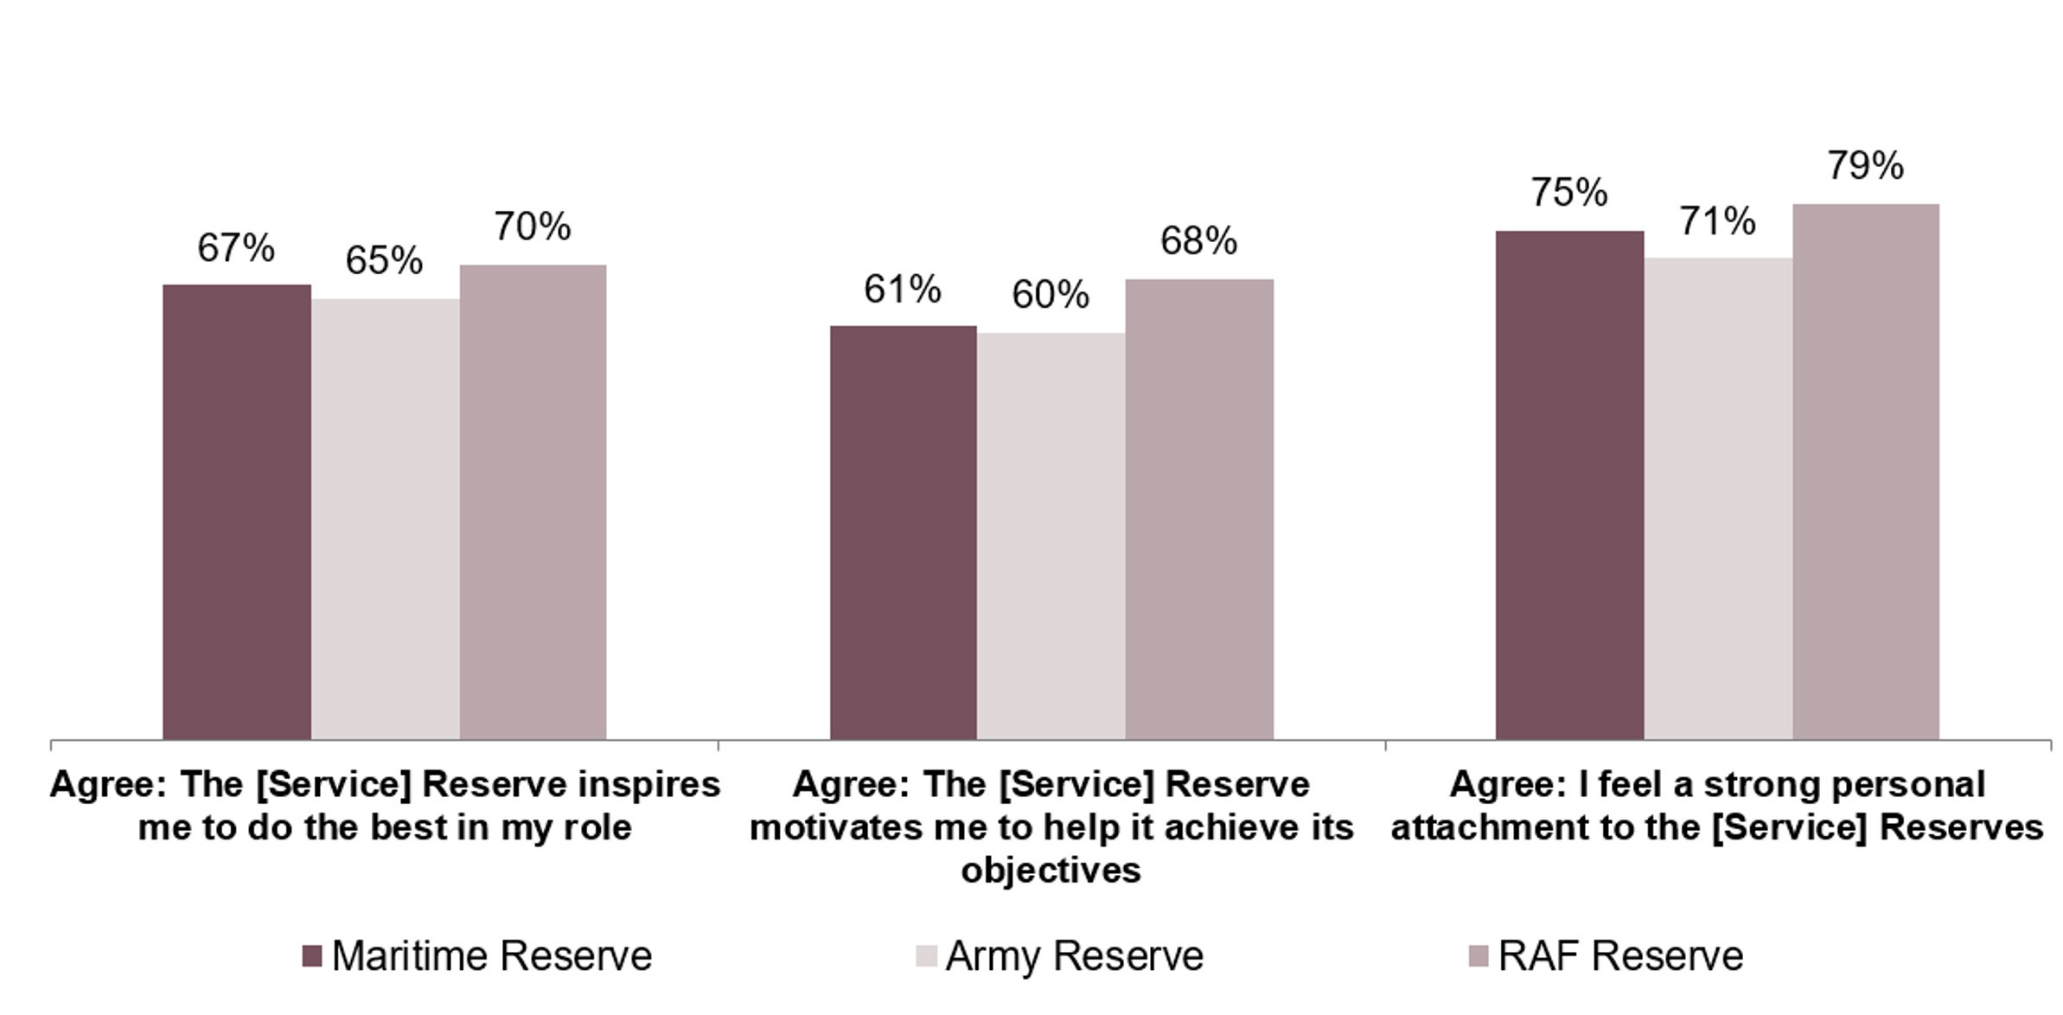
Figure 14 shows the levels of agreement that the [Service] Reserve inspires personnel to do the best in their role, motivates them to help it achieve its objectives and feeling a strong personal attachment to the [Service] Reserves broken down by Service.
Army Reserves reported the lowest proportion agreeing that they feel a strong personal attachment. Inspiration to do the best job for the Reserves is relatively stable across the three Services. RAF Reserves have higher levels of motivation to help the Service achieve its objectives compared to the two other Services.
8. Your current role
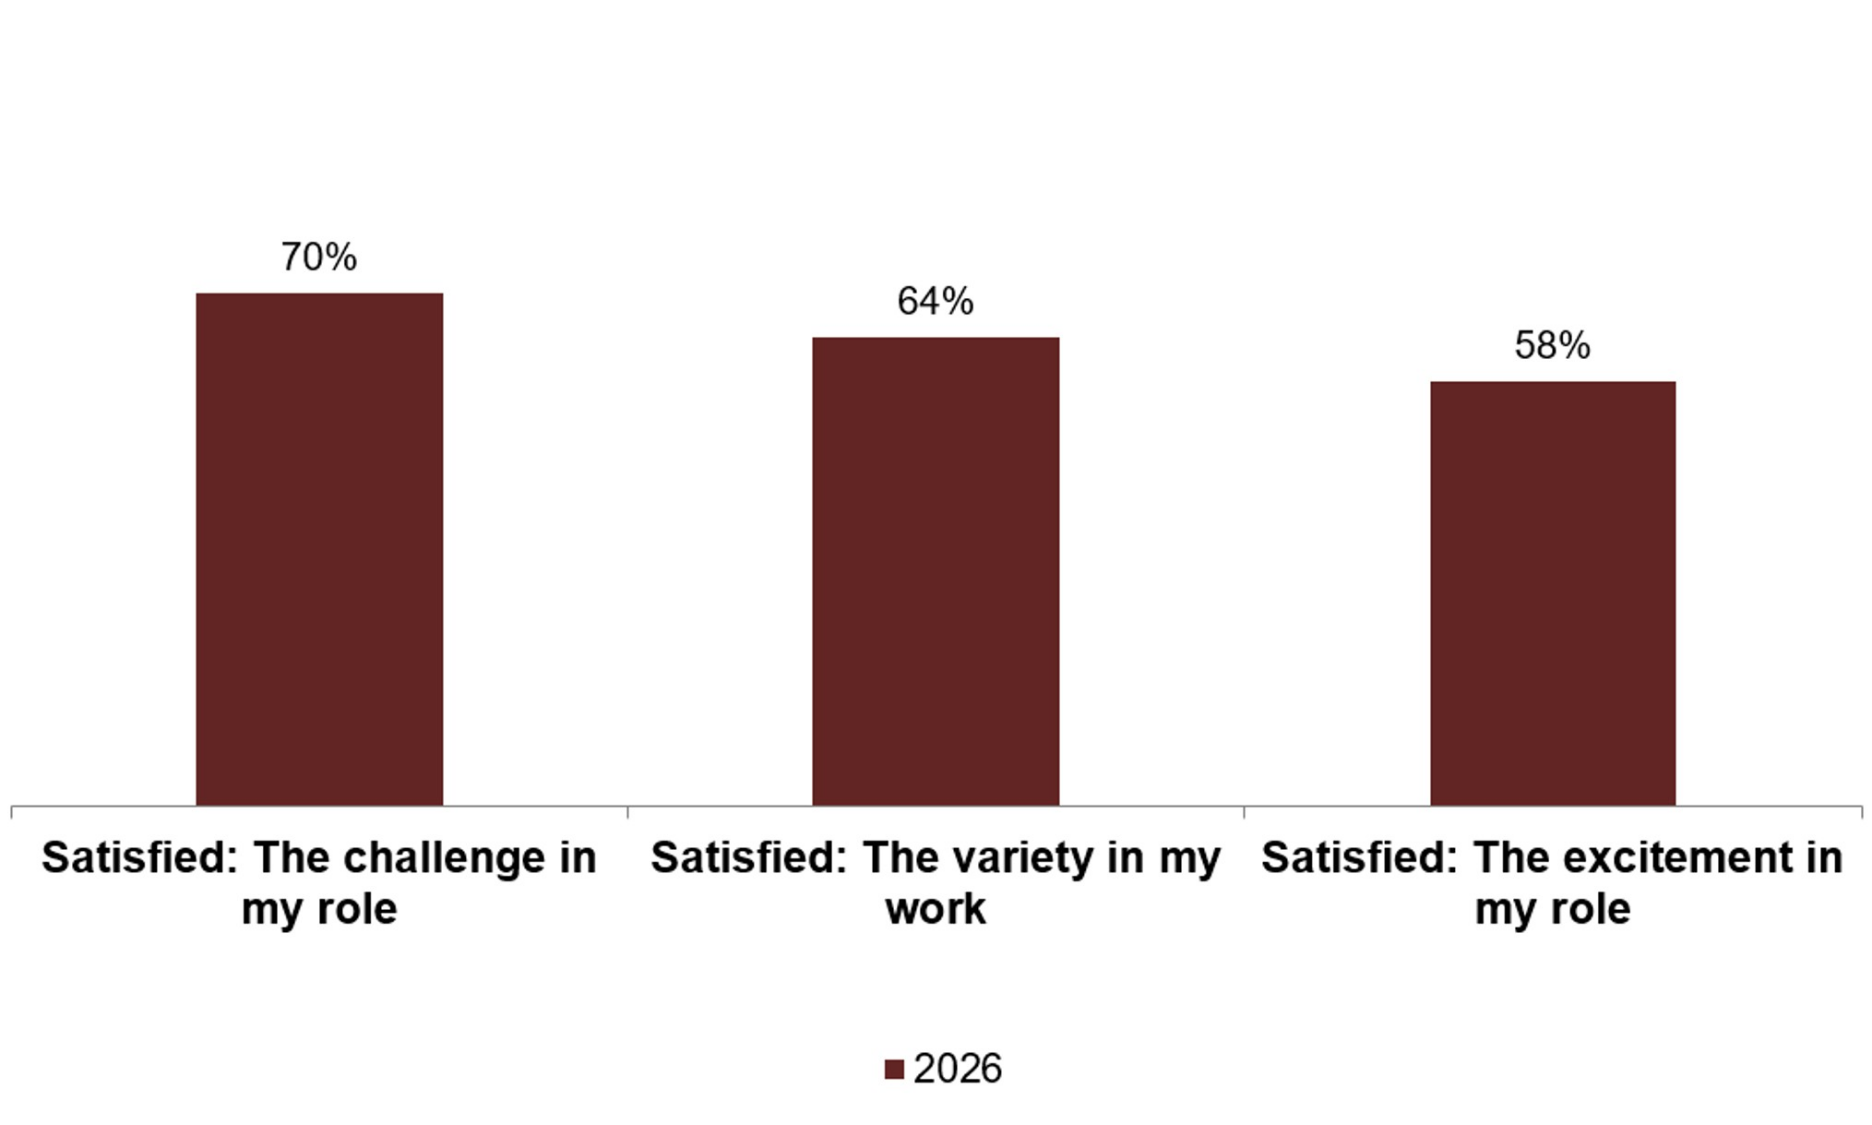
At a Tri-Service level, 70% of Reservists feel satisfied with the challenge in their role, 64% feel satisfied with the amount of variety in their work and 58% feel satisfied with the excitement in their role.
Figure 15 below compares satisfaction with challenge in your role, variety in your work and excitement in your role.
Figure 15: Satisfied: Satisfaction with the challenge in your role, the variety in your work & the excitement in your role
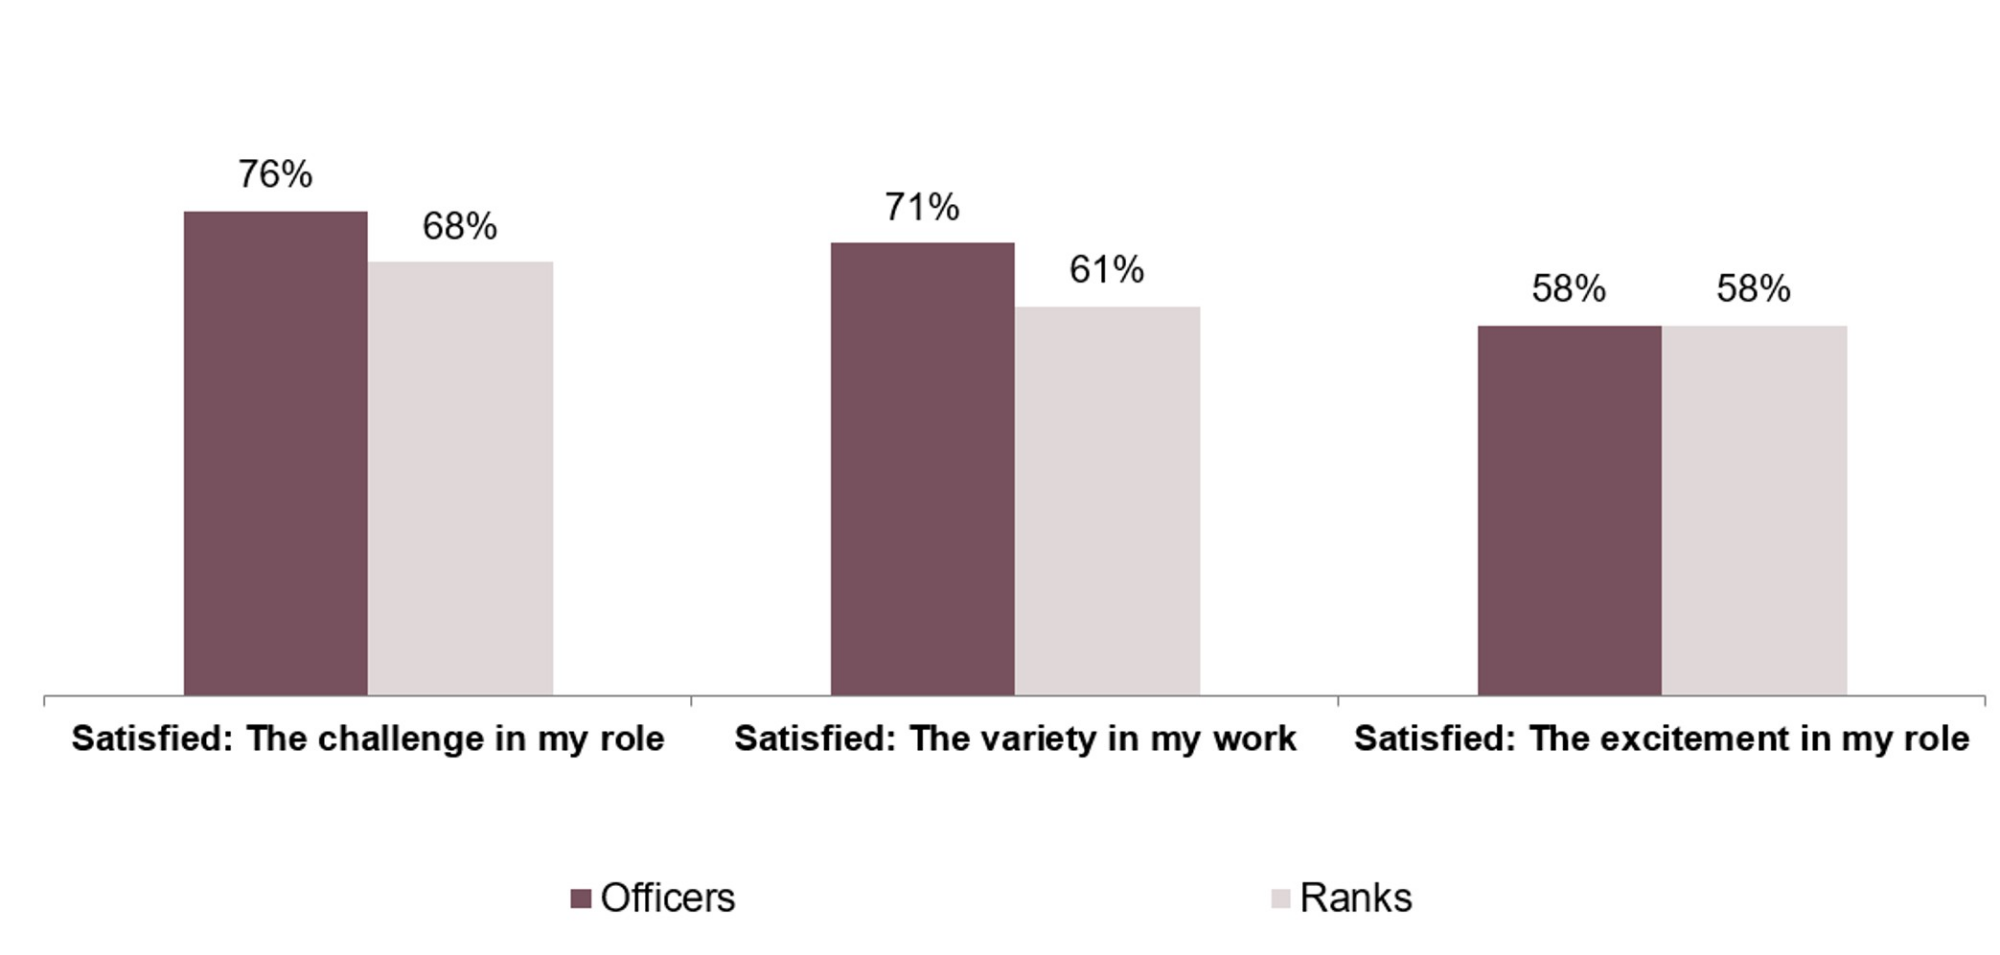
Officers (76%) reported higher levels of satisfaction with the challenge in their role compared to Ranks (68%). The same is true for satisfaction with the variety in your work (71% for Officers compared to 61% for Other Ranks). There is no difference between Officers and Ranks in levels of satisfaction with excitement in their role (58%).
Figure 16 below compares satisfaction with challenge in your role, variety in your work and excitement in your role by Rank.
Figure 16: Satisfied: Satisfaction with the challenge in your role, the variety in your work & the excitement in your role by Rank
At the single Service level, generally the Services report similar levels of satisfaction across all three metrics. However, Army Reserves express greater levels of satisfaction (65%) with the variety in their work compared to the Maritime Reserve (58%), and they also report greater levels of satisfaction with the excitement in their role (58%) compared to the RAF Reserve (50%).
9. Feeling valued in the Reserves
Nearly four in ten (37%) of Volunteer Reserves agree that they feel valued by Regulars, whilst just under three in ten (29%) disagree, showing consistent levels compared to last year. One in three Reservists (33%) neither agree nor disagree that they feel valued by Regulars which may, at least in part, reflect a lack of contact between Reservists and Regulars (AFCAS 2026 results show that 43% of Regulars have had working contact with Reserves in the last 2 years, down from 46% in 2025).
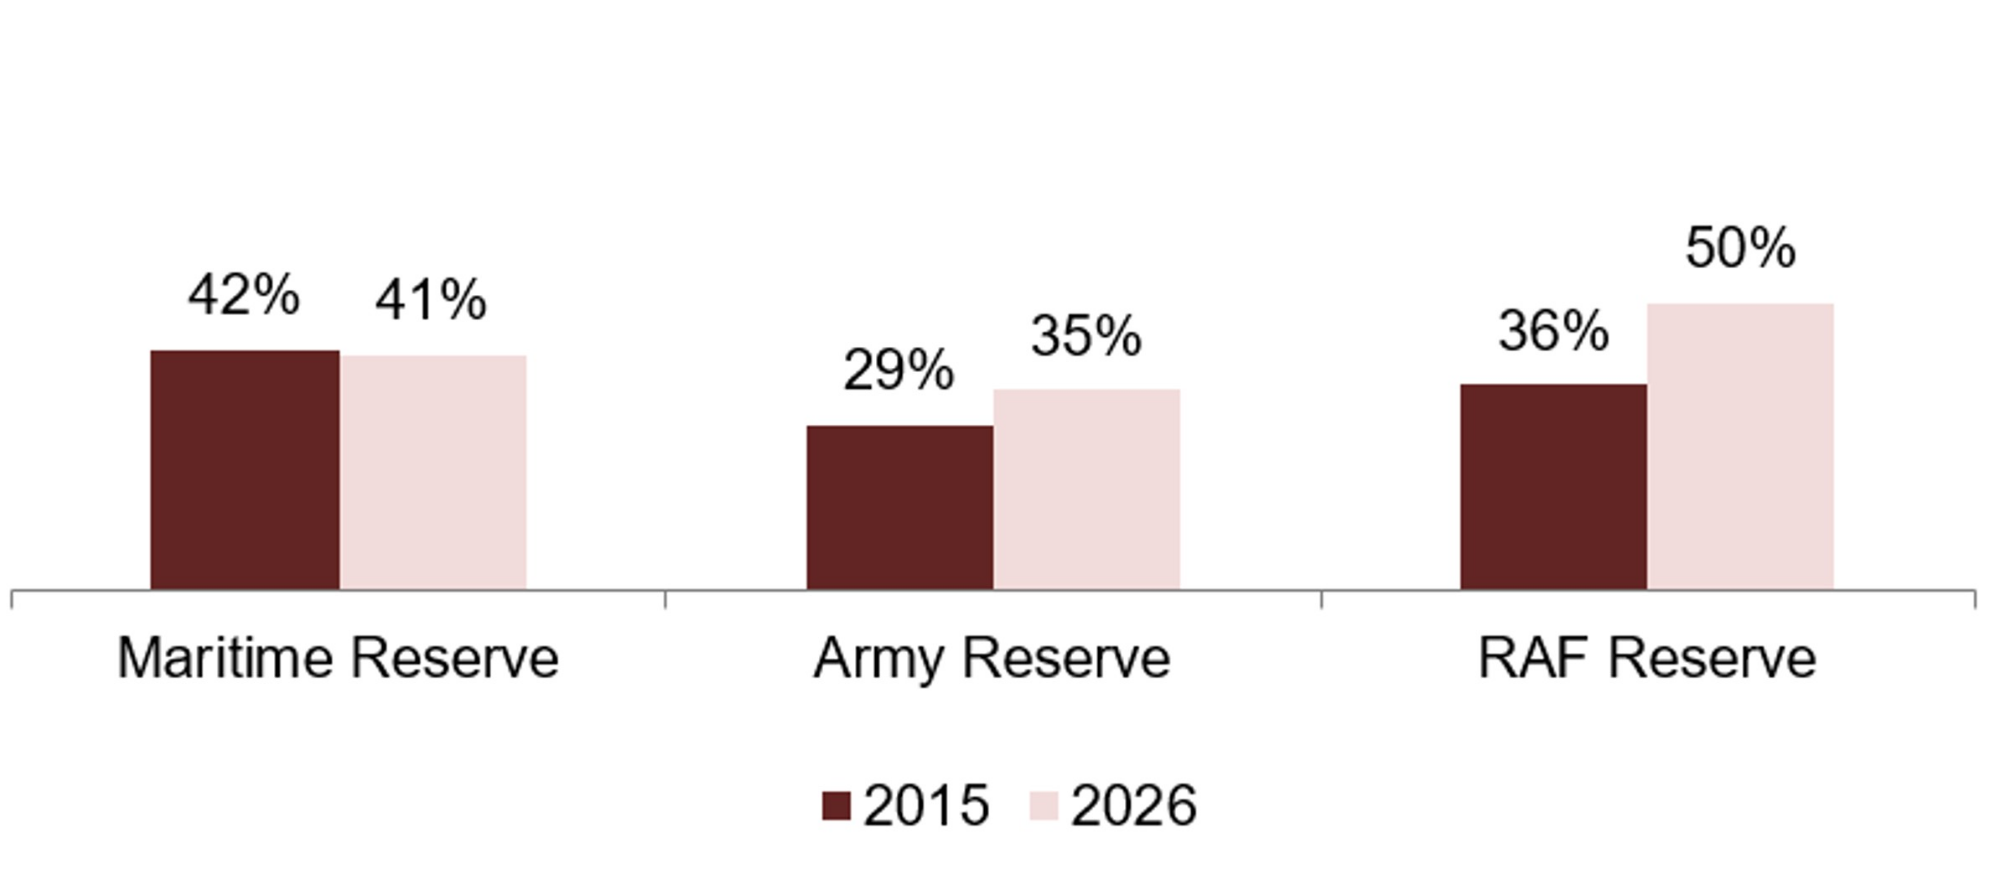
Army Reserves feel the least valued by Regulars (35% in 2026) compared to the other two Services (41% for the Maritime and 50% for the RAF Reserves respectively). Although, there has been an increase in Army Reserves feeling valued by Regulars since the baseline year (29% in 2015). There has also been an increase in feeling valued by Regulars since the baseline for the RAF Reserve, up from 36% in 2015 to 50% in 2026.
Figure 17 shows how valued by Regulars the Reserves feel by Service against the baseline year. The Maritime Reserves are the only Service to not feel more valued now than in 2015.
Figure 17: Agree: I feel valued by Regulars broken down by Service against baseline year
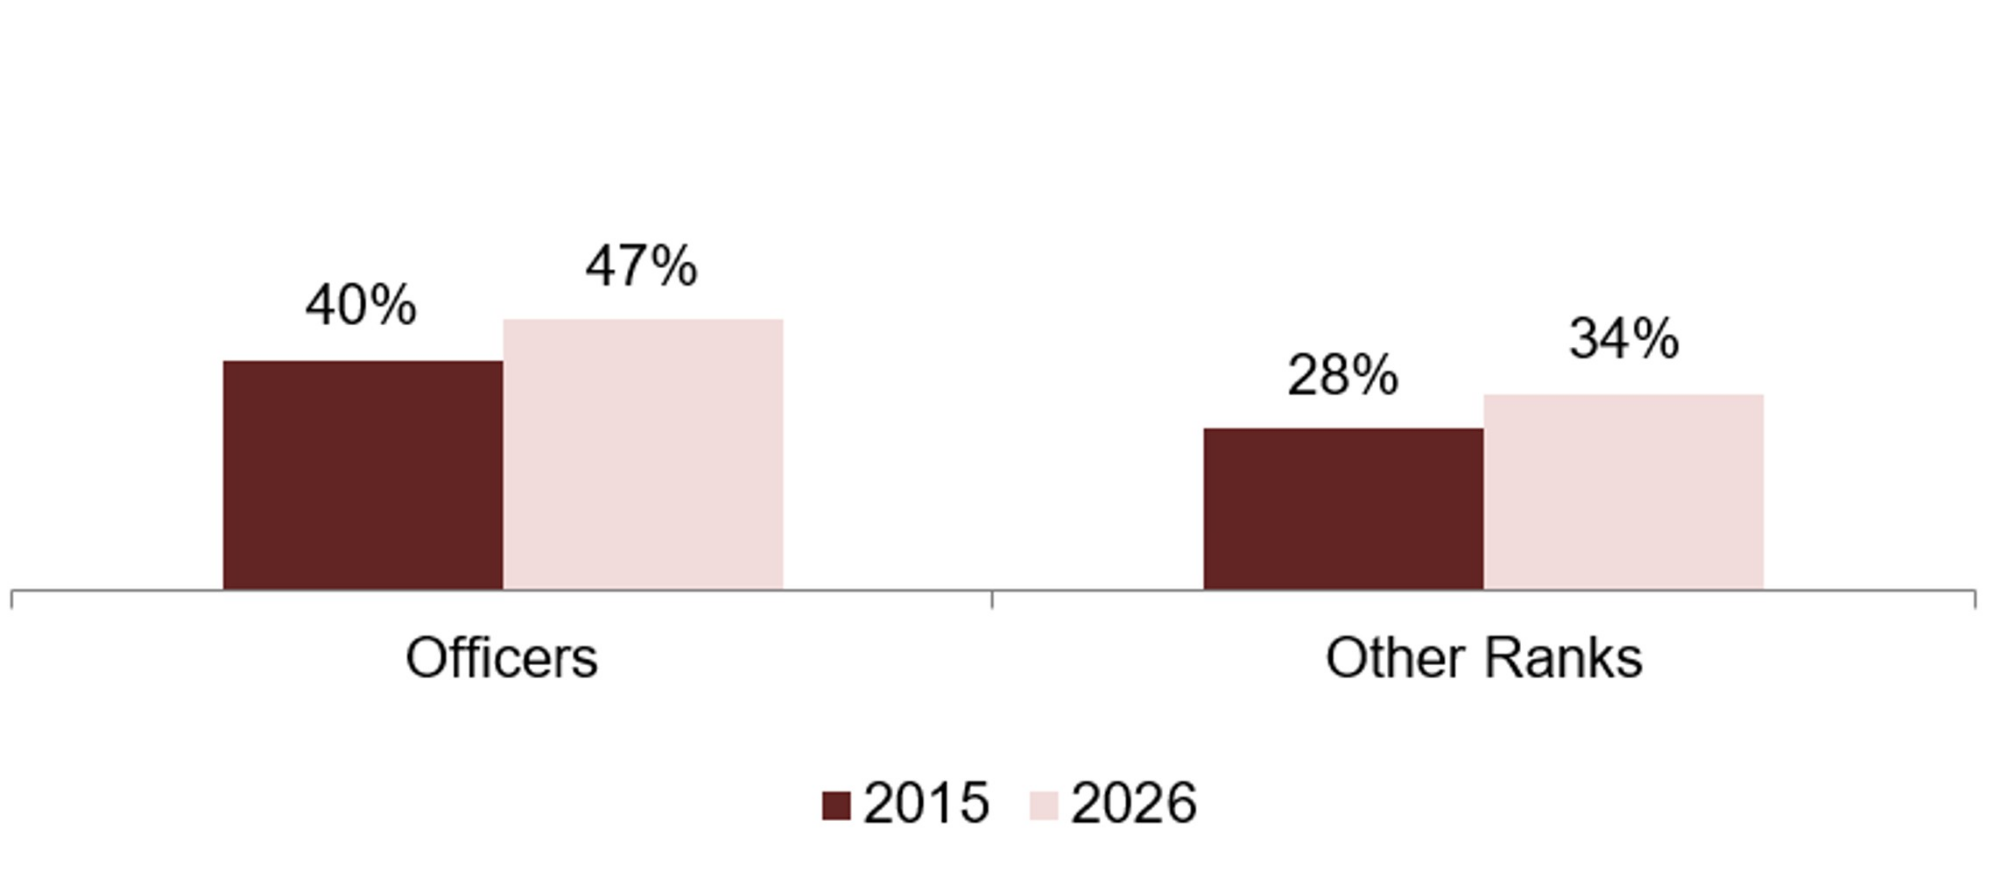
The proportion of Officers feeling valued by Regulars (47%) is higher than the baseline (40% in 2015). This level has remained stable since last year. The proportion of Other Ranks feeling valued by Regulars (34%) has also increased compared to the 2015 baseline (28%) and has also remained stable since last year. This comparison of Officers and Other Ranks to the baseline year can be seen in Figure 18.
Officers (47%) are more likely to feel valued by Regulars compared to Other Ranks (34%).
Figure 18: Agree: I feel valued by Regulars broken down by Rank against baseline year
Four in ten (40%) of Volunteer Reserves feel valued by society. This is lower than 2015 baseline levels (50%) and is at the same level as last year. At an individual Service level, feeling valued by society has remained stable since last year, but is at a lower level than the 2015 baseline for the Maritime and Army Reserves.
Figure 19: Agree: I feel valued by society by Service against baseline year
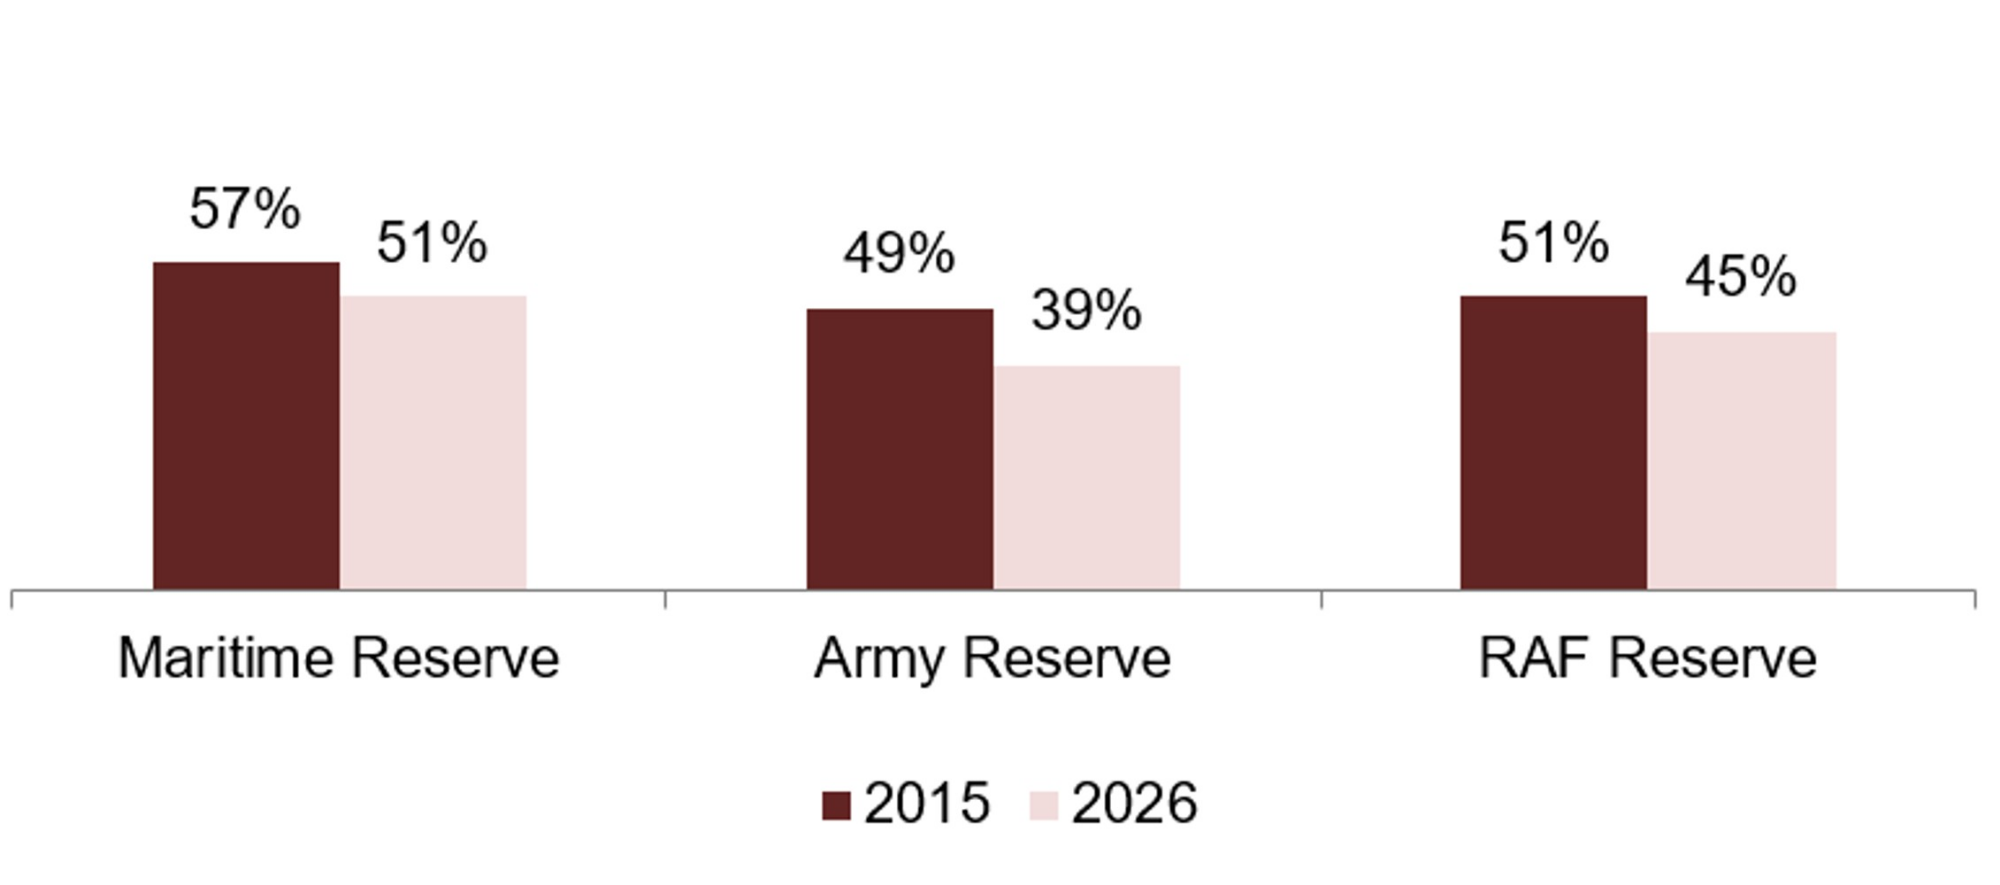
Figure 19 shows how valued by society the Reserves feel by Service against the baseline year of 2015. 51% of Maritime Reservists, 39% of Army Reservists and 45% of RAF Reservists feel valued by society in 2026. Army Reserves have seen the largest percentage point decrease since the baseline year from 49% to 39%.
10. Fairness in the Reserves
The majority of Volunteer Reserves agree that they are treated fairly (78%) and that Service discipline is fair (73%). Both measures are similar to levels reported in the last two years but lower than in 2023 (82% and 78% respectively).
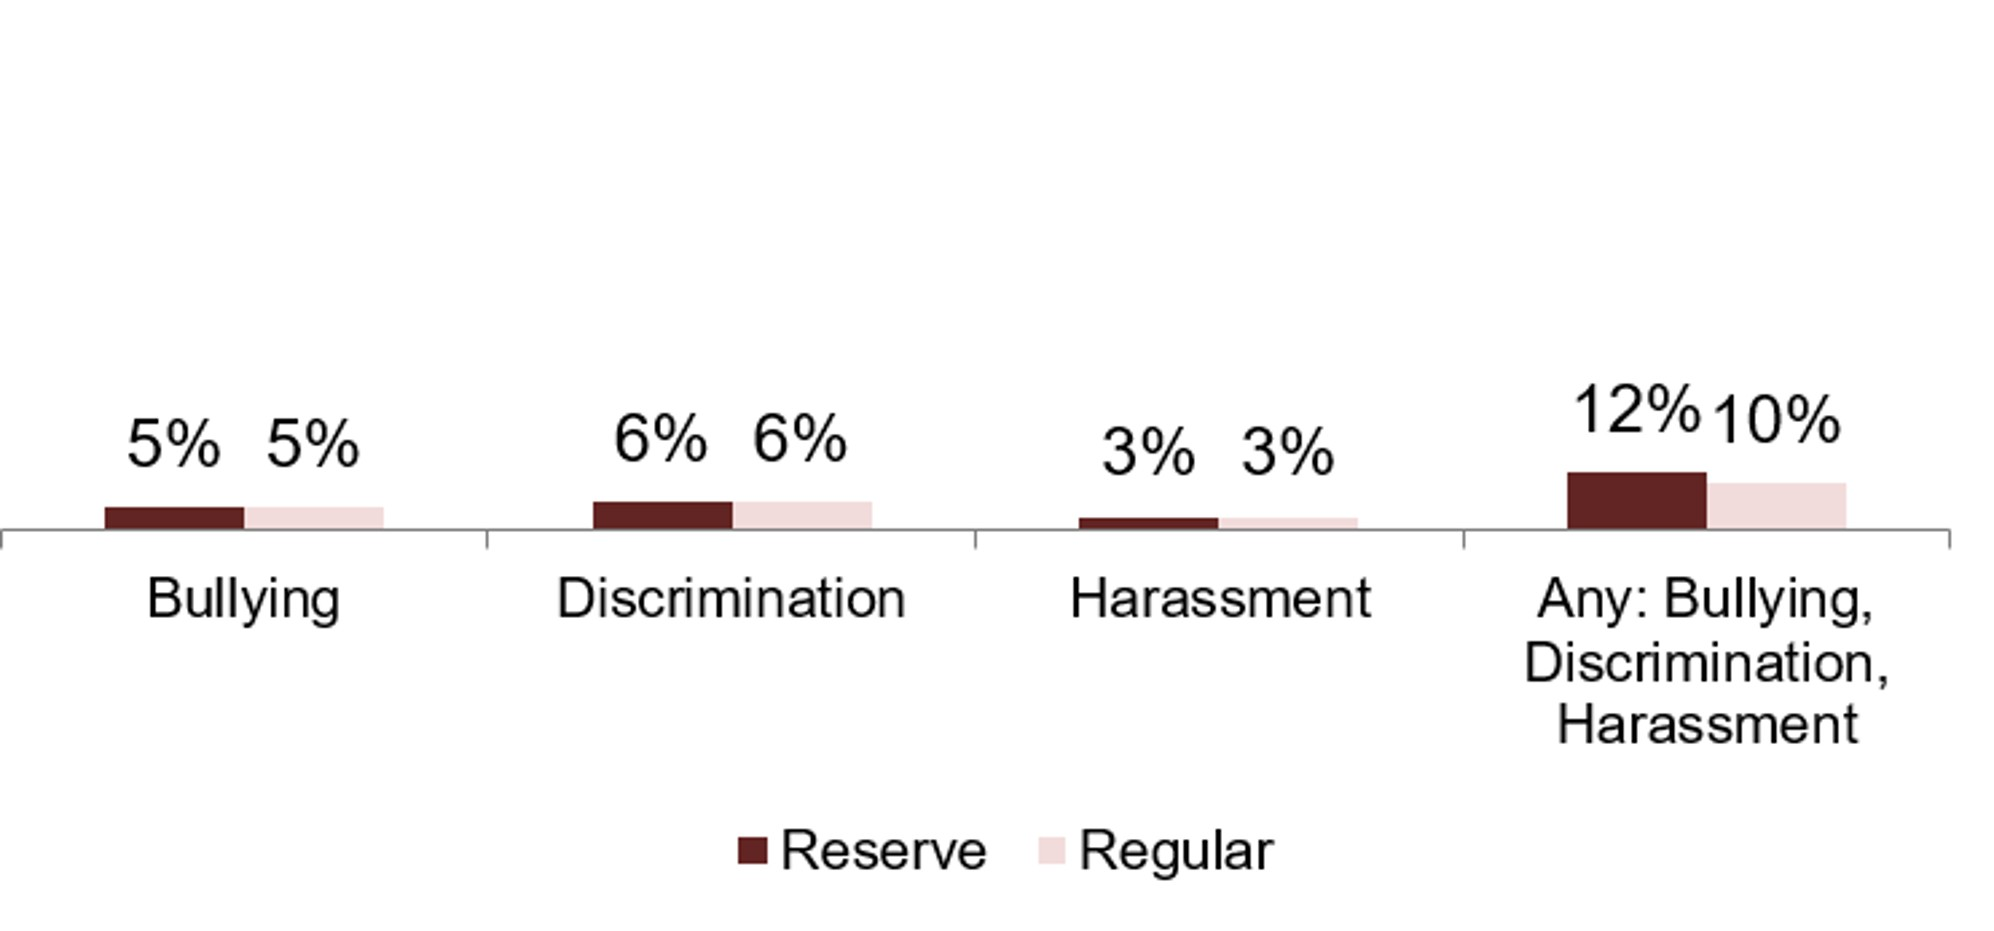
Under one in eight (12%) Volunteer Reservists reported that they had been subjected to bullying, discrimination or harassment in a Service environment in the last 12 months. Reported levels have remained stable at both the Tri-Service level and within each individual Reserve Service over the last two years, but are higher than when the question was first introduced in 2019 (9%).
Maritime Reserves reported lower levels of bullying, discrimination and harassment than in 2023 (down from 14% in 2023 to 6% in 2026). In 2026, Army Reserves reported higher levels of bullying, discrimination or harassment (13%) than both the Maritime Reserves (6%) and RAF Reserves (8%).
Although direct comparisons have not been made, AFCAS 2026 results are presented in Figure 20 for contextual information. In 2026, 12% of Reservists and 10% of Regulars reported experiencing at least one of bullying, harassment or discrimination in the previous 12 months.
Figure 20: Yes: Believe you have been subject to bullying, discrimination, harassment or any of the above in a Service environment in the last 12 months broken down by Reserves and Regulars
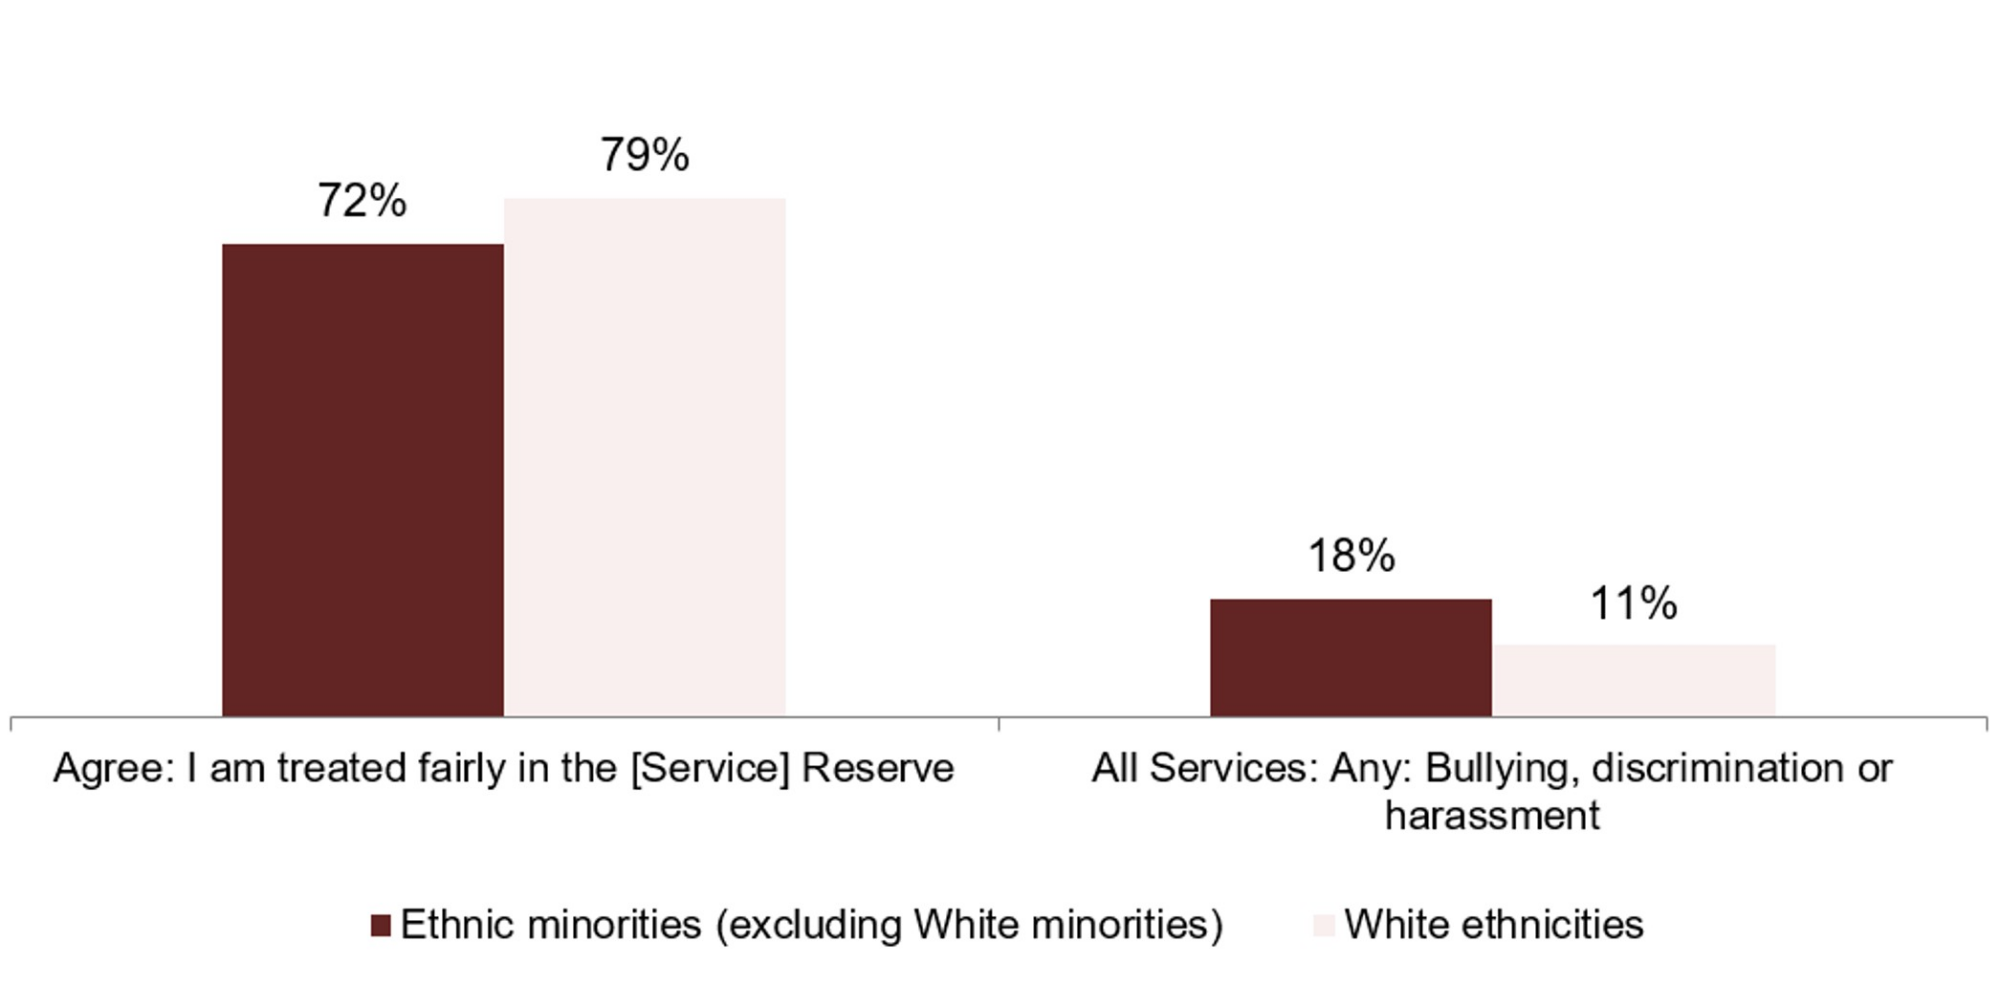
Since the question was introduced in 2019, there have been no changes in reported levels for Ethnic minorities (excluding white minorities) in feeling that they are treated fairly (72%) or felt that they had experienced bullying, harassment or discrimination in the last 12 months (18%). This is similar to White personnel, where 79% feel they were treated fairly in the [Service] Reserve and 11% feel they experienced at least one of bullying, harassment and discrimination in the last year. This can be seen below in Figure 21.
Figure 21: Agree: Treated fairly in the [Service] Reserve & Yes: Believe you have been subject to bullying, discrimination, harassment or any of the above in a Service environment in the last 12 months broken down by ethnicity
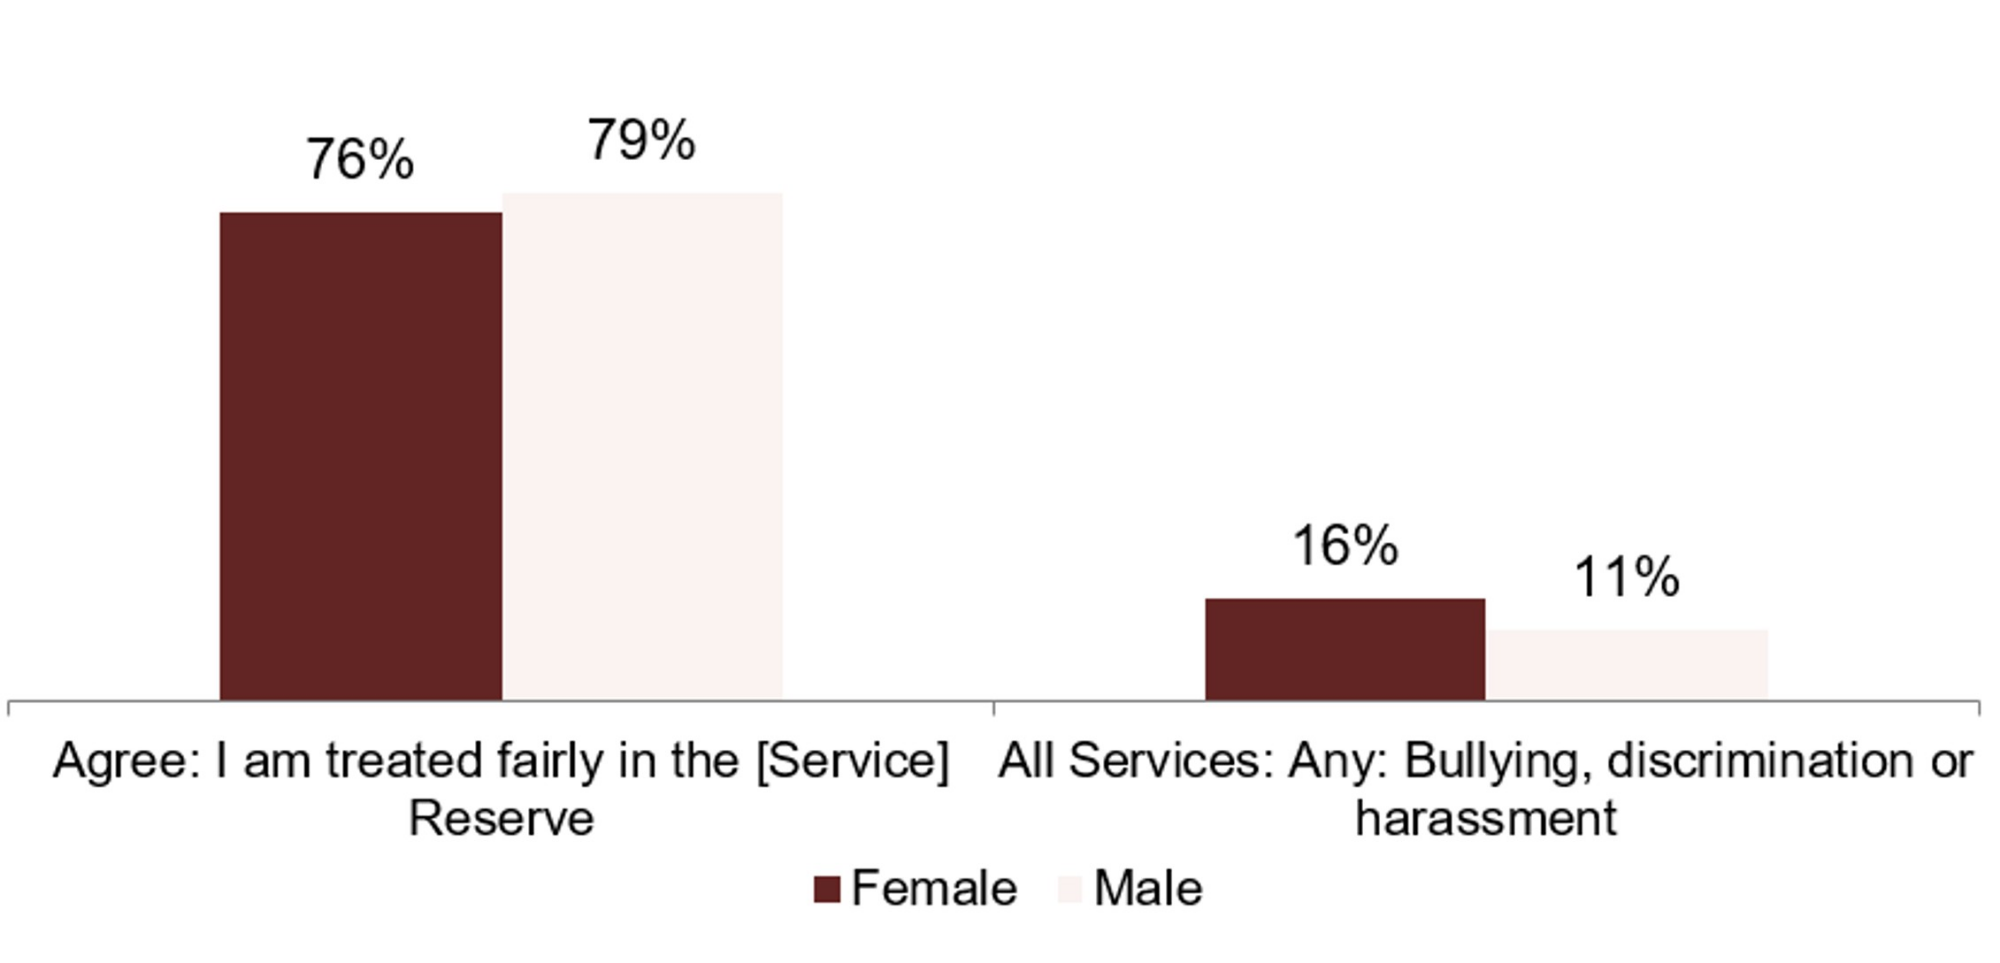
There was no difference between female and male Reservists in feeling that they are treated fairly in the Reserves. However, females (16%) are more likely to report being subject to bullying, discrimination or harassment in a Service environment in the last 12 months compared to males (11%). This can be seen in Figure 22.
Figure 22: Agree: Treated fairly in the [Service] Reserve & Yes: Believe you have been subject to bullying, discrimination, harassment or any of the above in a Service environment in the last 12 months broken down by gender
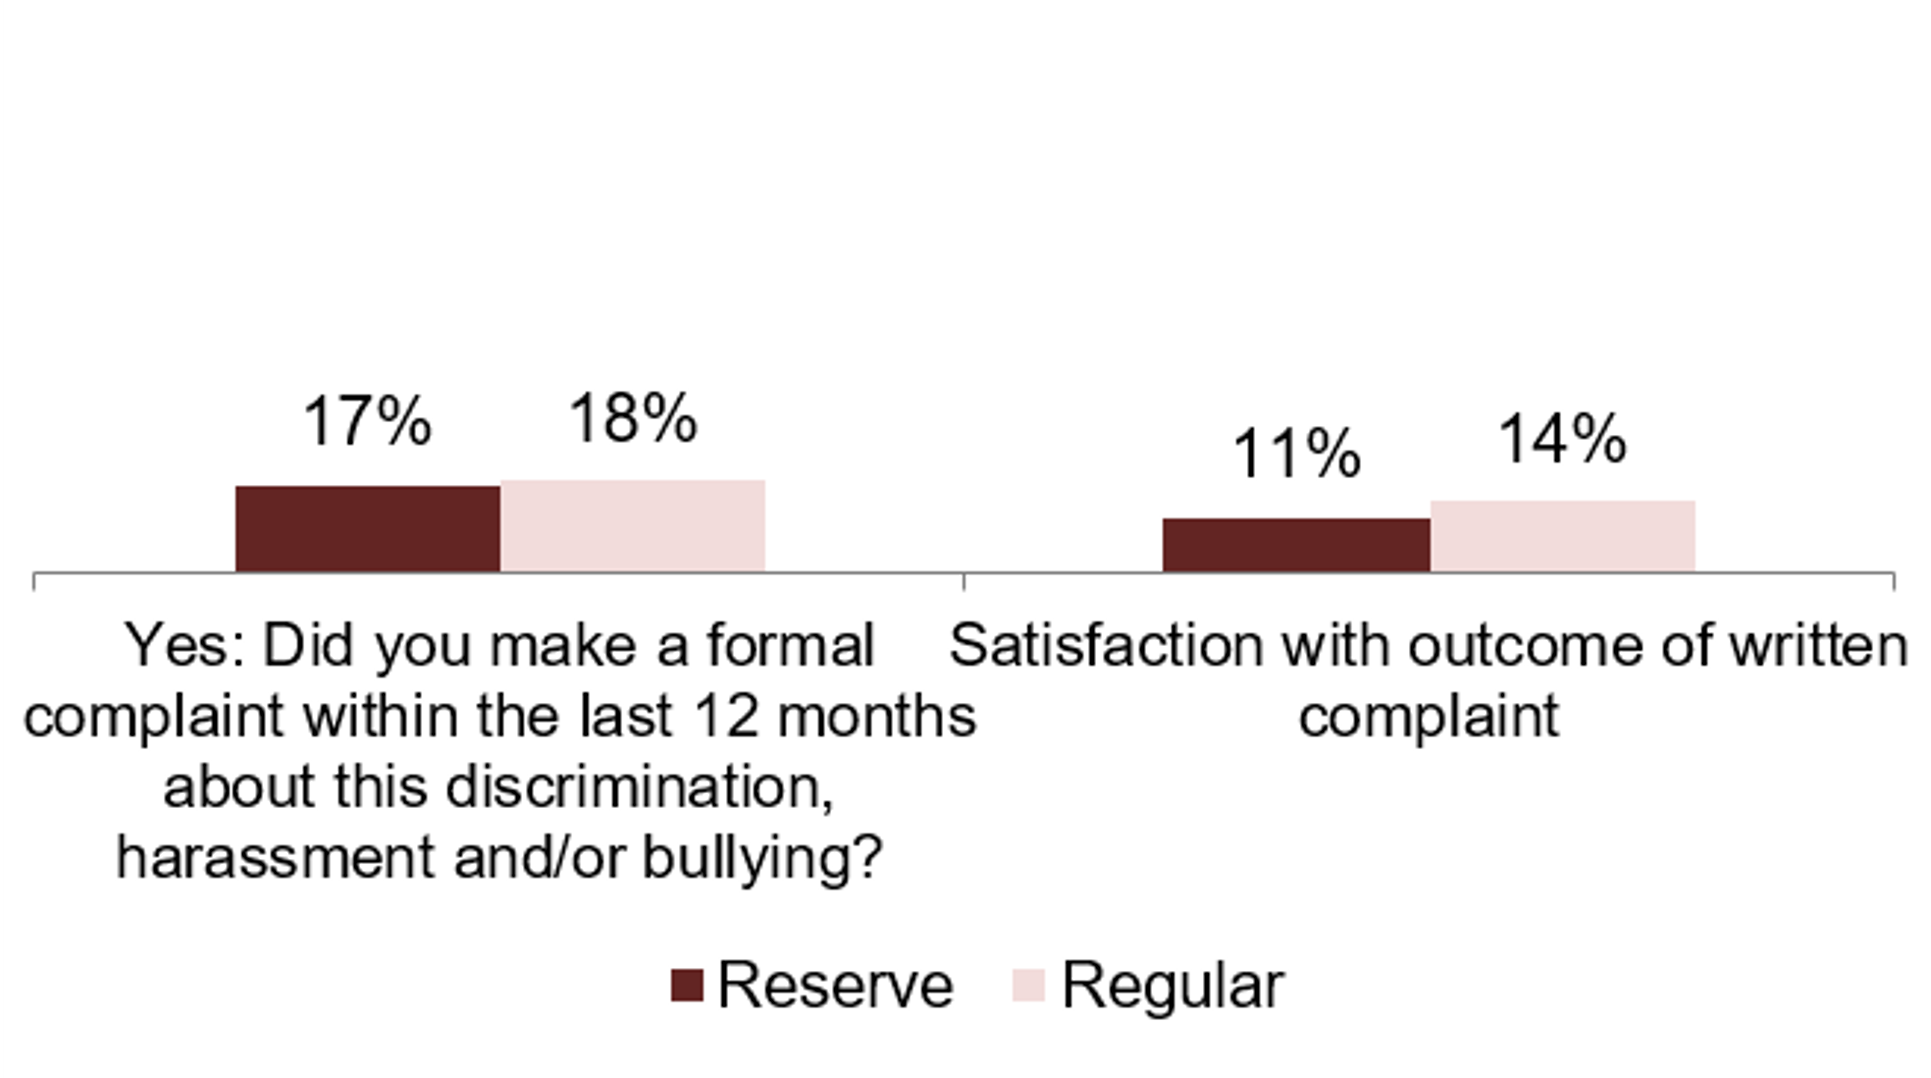
Of those Reservists that believe they have been subject to bullying, discrimination or harassment in a Service environment in the last 12 months (12%), around one in six (17%) made a formal written complaint.
Of those Reservists that had made a formal written complaint about a perceived incidence of bullying, discrimination, or harassment, 11% were satisfied with the outcome of the complaint while 67% were dissatisfied. Dissatisfaction with the outcome has remained stable since last year.
Although direct comparisons have not been made, figures from AFCAS 2026 have been provided in Figure 23 below for contextual information. 18% of Regulars who reported experiencing bullying, harassment or discrimination made a formal complaint. 14% of Regulars were happy with the outcome, compared to 11% of Reserves.
Figure 23: Yes: Made a formal complaint within the last 12 months about this bullying, discrimination and/or harassment & Satisfied: Satisfaction with the outcome broken down by Reserves against Regulars
16% of Reservists have heard of the Service Complaints Ombudsman (SCO) and know a lot about it, 49% have heard of SCO and know a little about it and 19% have heard of the SCO and know nothing about it. 16% have never heard of the SCO. Nearly half (46%) of Officers know a lot about the Service Complaints process compared to only 21% of Other Ranks and similarly with the Ombudsman, more Officers know a lot about it (27% of Officers compared to 12% of Other Ranks).
11. Civilian employment
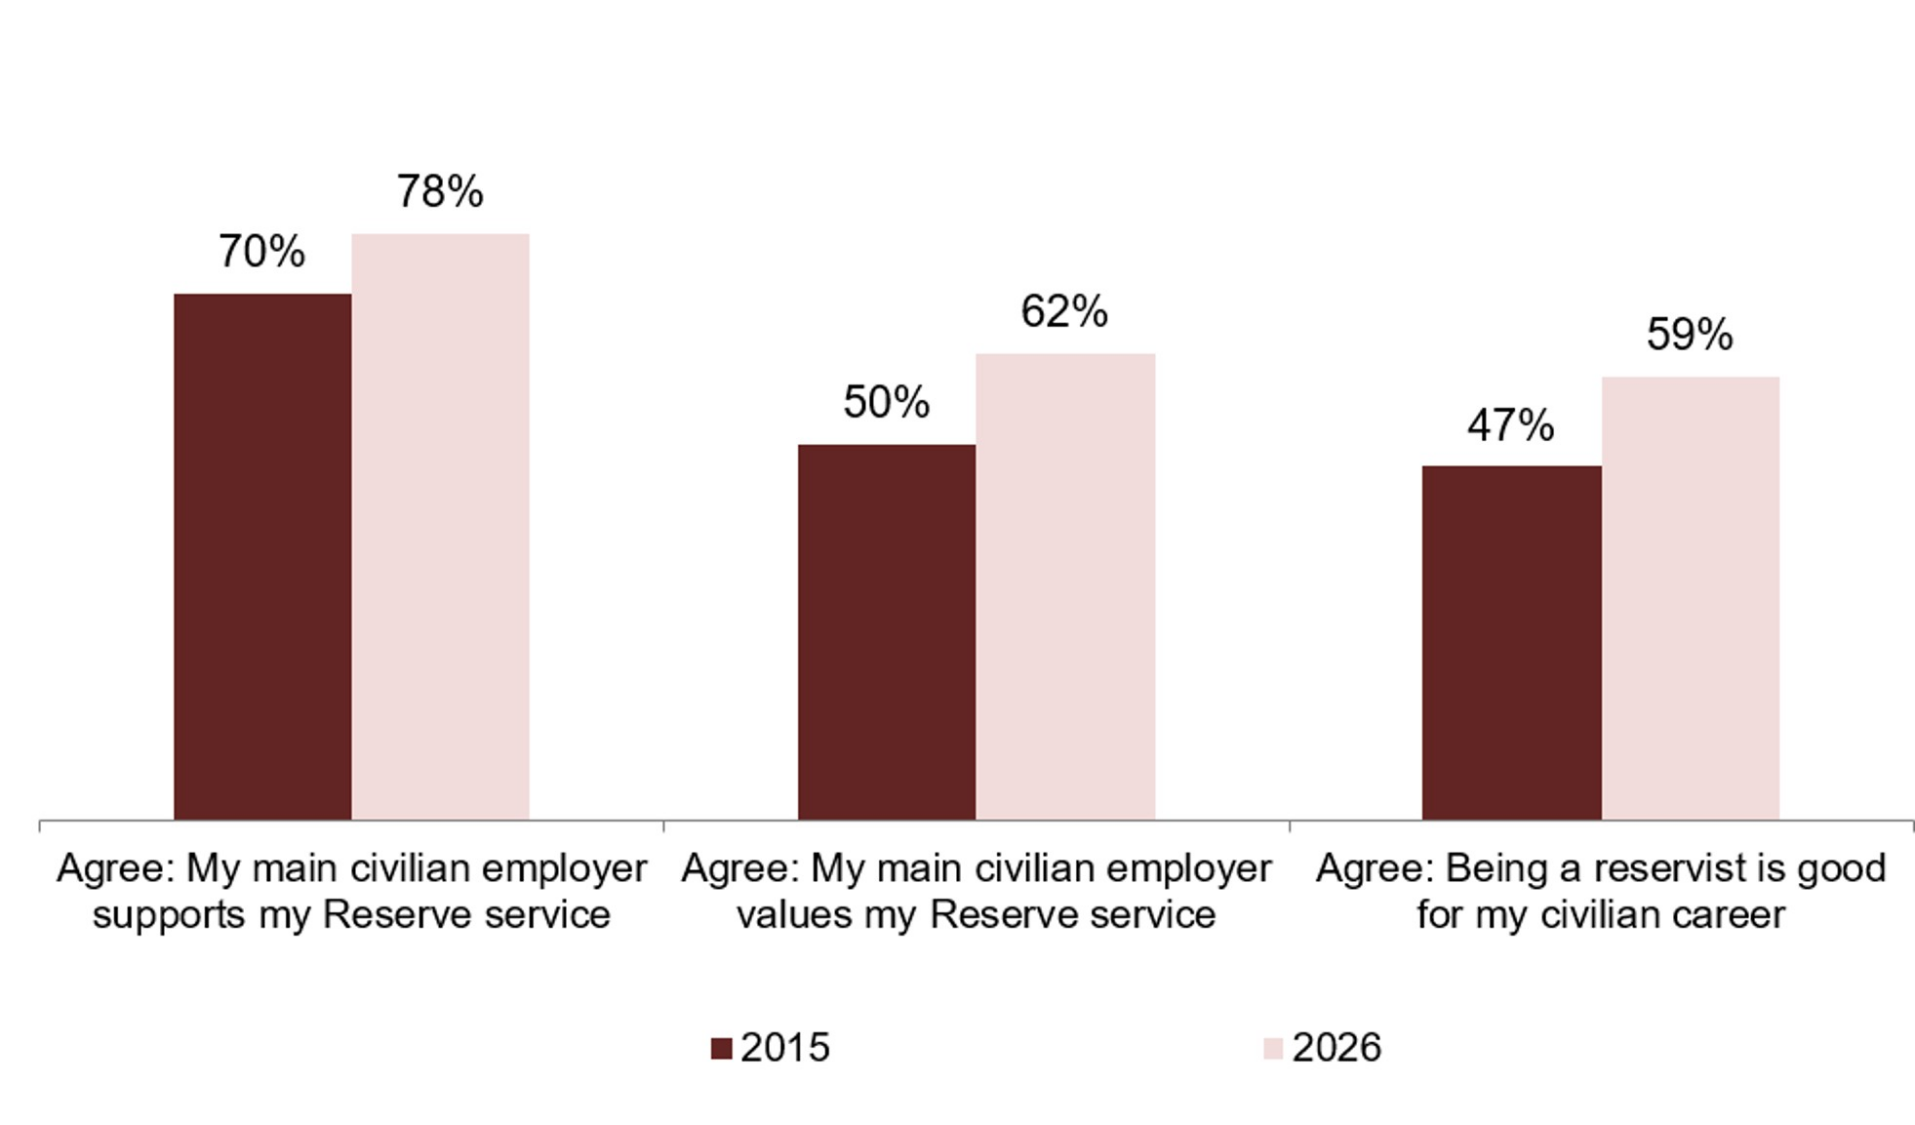
Compared with the 2015 baseline, there has been an increase in the proportion of Volunteer Reserves who report that their civilian employer supports (70% in 2015 up to 78% in 2026) and values (50% in 2015 up to 62% in 2026) their Reserve Service. There has also been an increase in the proportion of Reservists who report that being a Reservist is good for their civilian career over the same period (47% in 2015 up to 59% in 2026). However, these measures have all remained stable since last year. The changes in these measures since the baseline year can be seen in Figure 24 below.
Figure 24: Agree: My main civilian employer supports my Reserve Service, values my Reserve service and being a Reservist is good for my civilian career against the baseline year of 2015
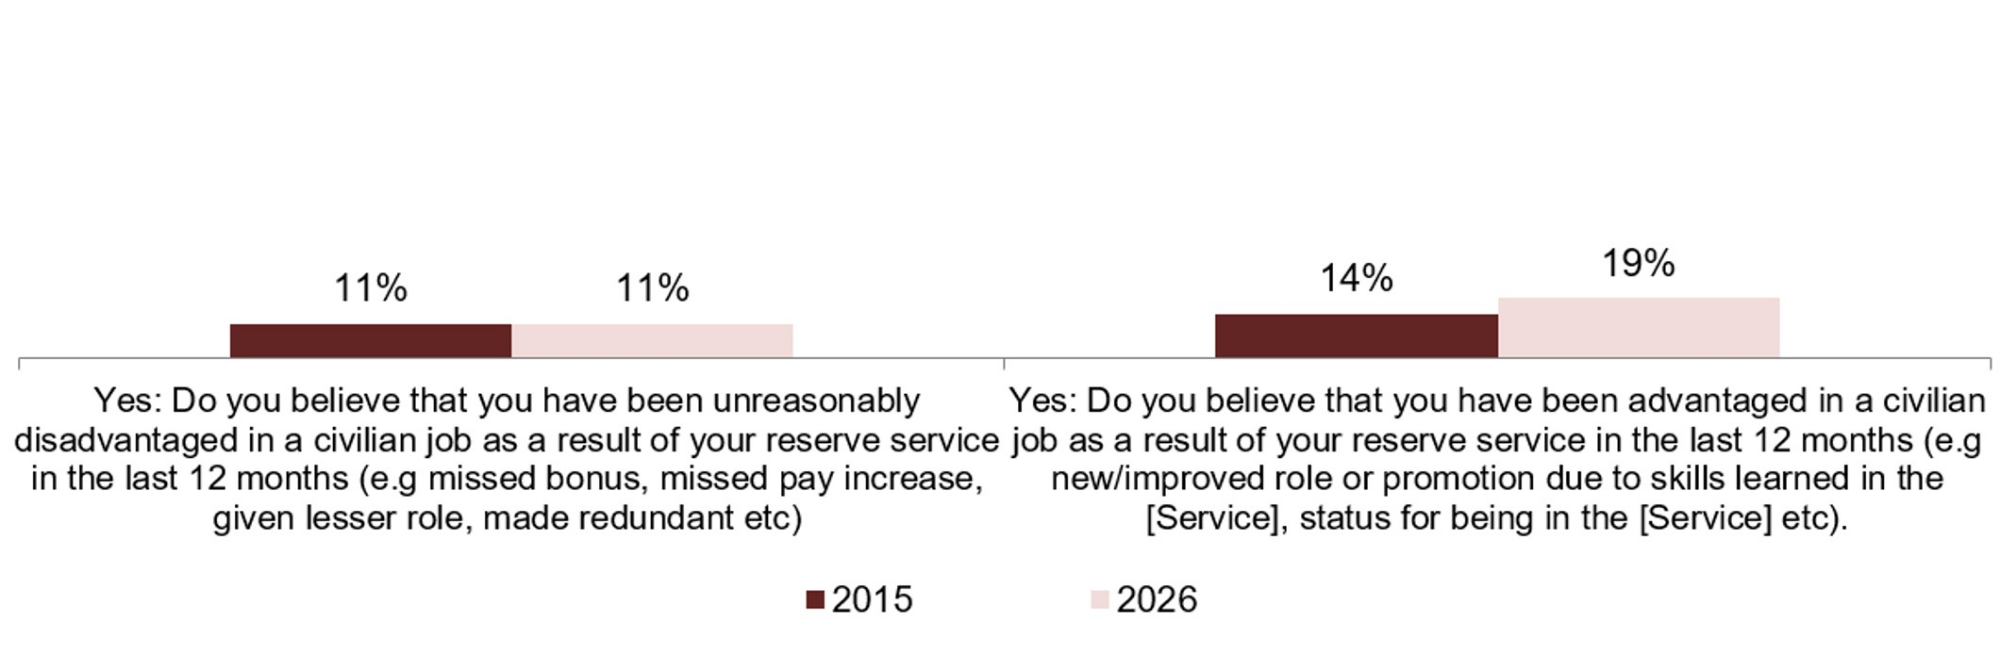
A greater proportion of Reservists reported that they have been advantaged in a civilian job as a result of their Reserve Service in the last 12 months (19%) compared to the number of Reservists that feel that they have been disadvantaged in a civilian job as a result of their Reserve Service (11%).
The proportion of Reservists who feel that they have been unreasonably disadvantaged in a civilian job as a result of their Reserve Service over the last 12 months is similar to the 2015 baseline (both 11%).
The proportion of Reservists who feel that they have been advantaged in a civilian job as a result of their Reserve Service over the last 12 months has increased compared to the 2015 baseline (up from 14% in 2015 to 19% in 2026). This can be seen in Figure 25 below.
Figure 25: Yes: Do you believe that you have been unreasonably disadvantaged or advantaged in a civilian job as a result of your Reserve Service in the last 12 months against the baseline year
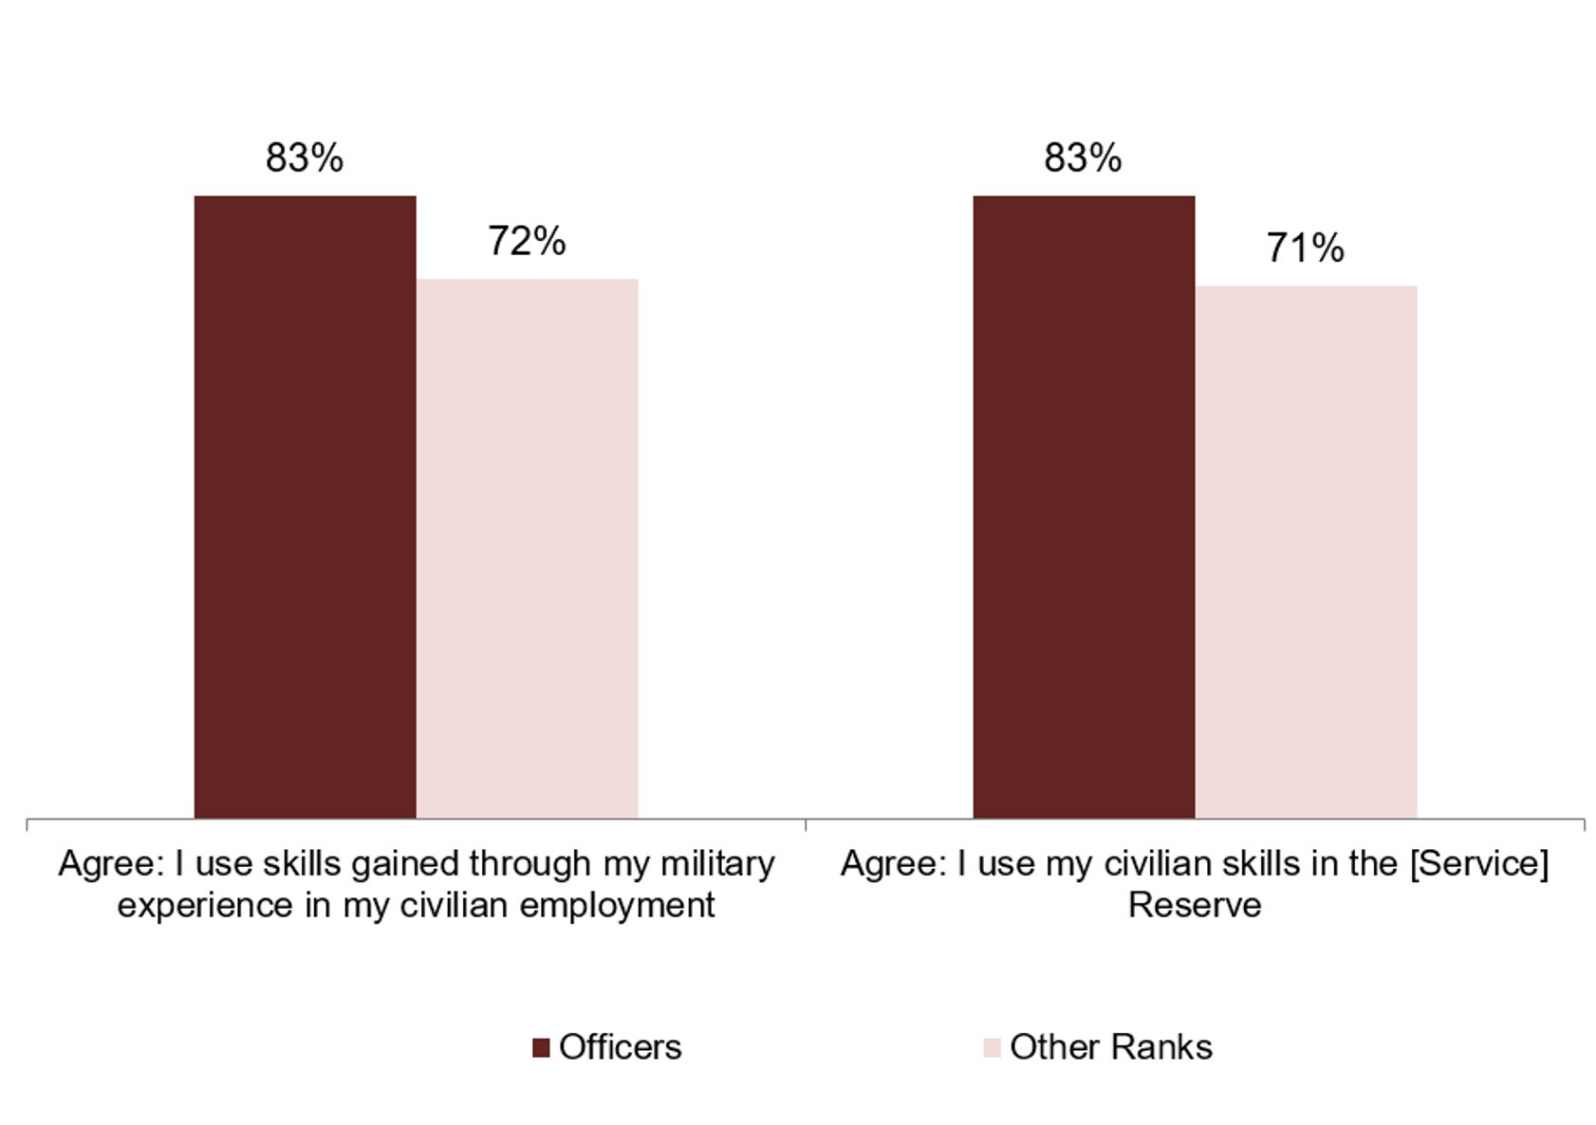
Compared to Other Ranks, Officers are more likely to use skills gained through their military experience in their civilian employment (83% of Officers and 72% for Other Ranks) and to use their civilian skills in their Reserve Service (83% of Officers and 71% for Other Ranks). This is shown in Figure 26 below.
Figure 26: Agree: I use skills gained through my military experience in my civilian employment and civilian skills in the [Service] Reserve broken down by Rank
60% of Volunteer Reservists reported that their civilian employer has signed the Armed Forces Covenant, with 26% saying that their employer hadn’t. 14% of Volunteer Reserves didn’t know. Levels compared to last year (when the question was first introduced) have remained stable at both a Tri-Service and single Service level.
12. Pay, allowances and admin support
Satisfaction with Reserve Service pay has fallen compared with earlier years, but has remained stable since 2023.
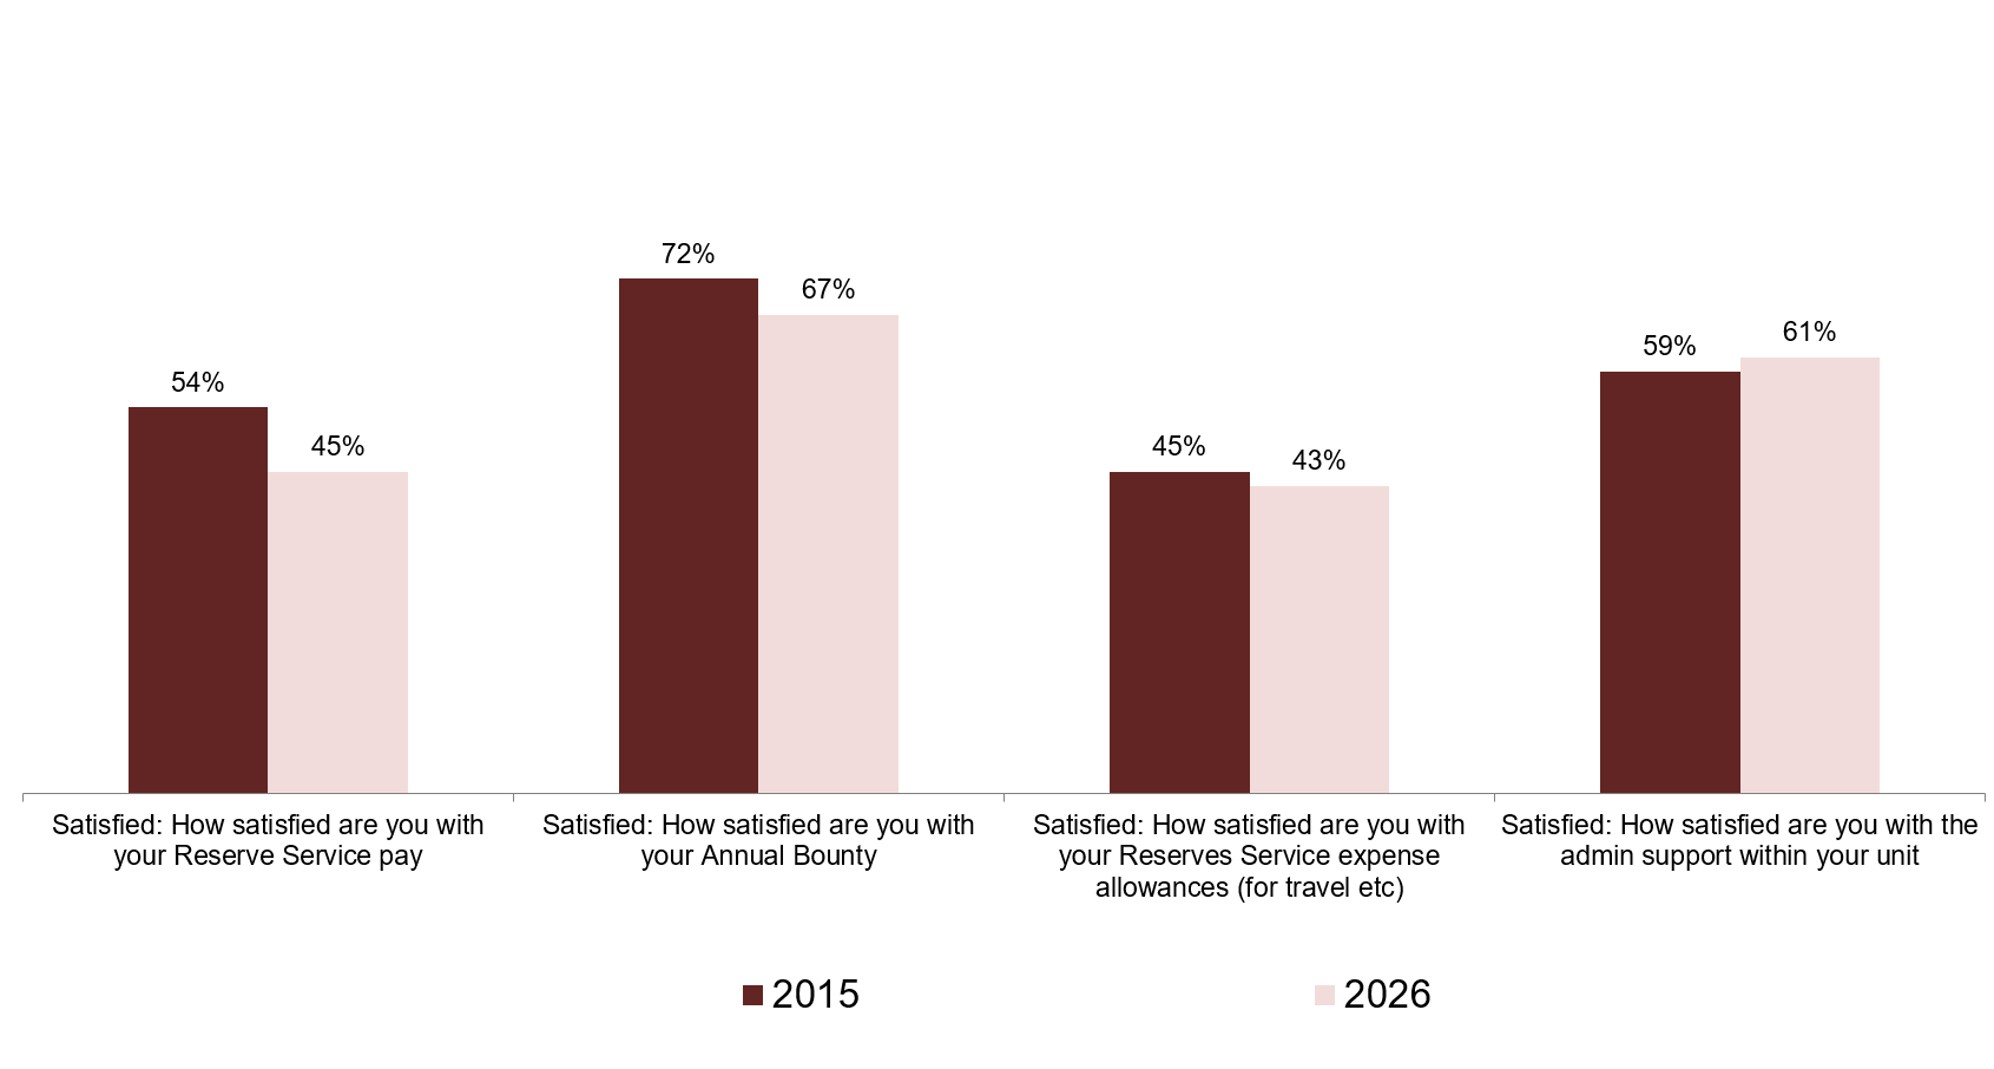
In 2015, 54% of Volunteer Reserves were satisfied with their Service Pay, which has decreased to 45% in 2026. This is at a similar level to the lowest recorded level in the Survey so far (43% in 2024). Satisfaction with Pay peaked in 2021 at 57%. Satisfaction with the Annual Bounty has decreased from 72% in 2015 to 67% in 2026.
Satisfaction with Service expense allowances remains similar to 2015 levels (43% in 2026).
Likewise, satisfaction with admin support within the unit is at a similar level in 2026 (61%) as it was in 2015.
These comparisons with the baseline year can be seen in Figure 27 below.
Figure 27: Satisfied: Satisfaction with Reserve Service pay, Annual Bounty, Reserves Service expense allowances and the admin support within your unit against the baseline year
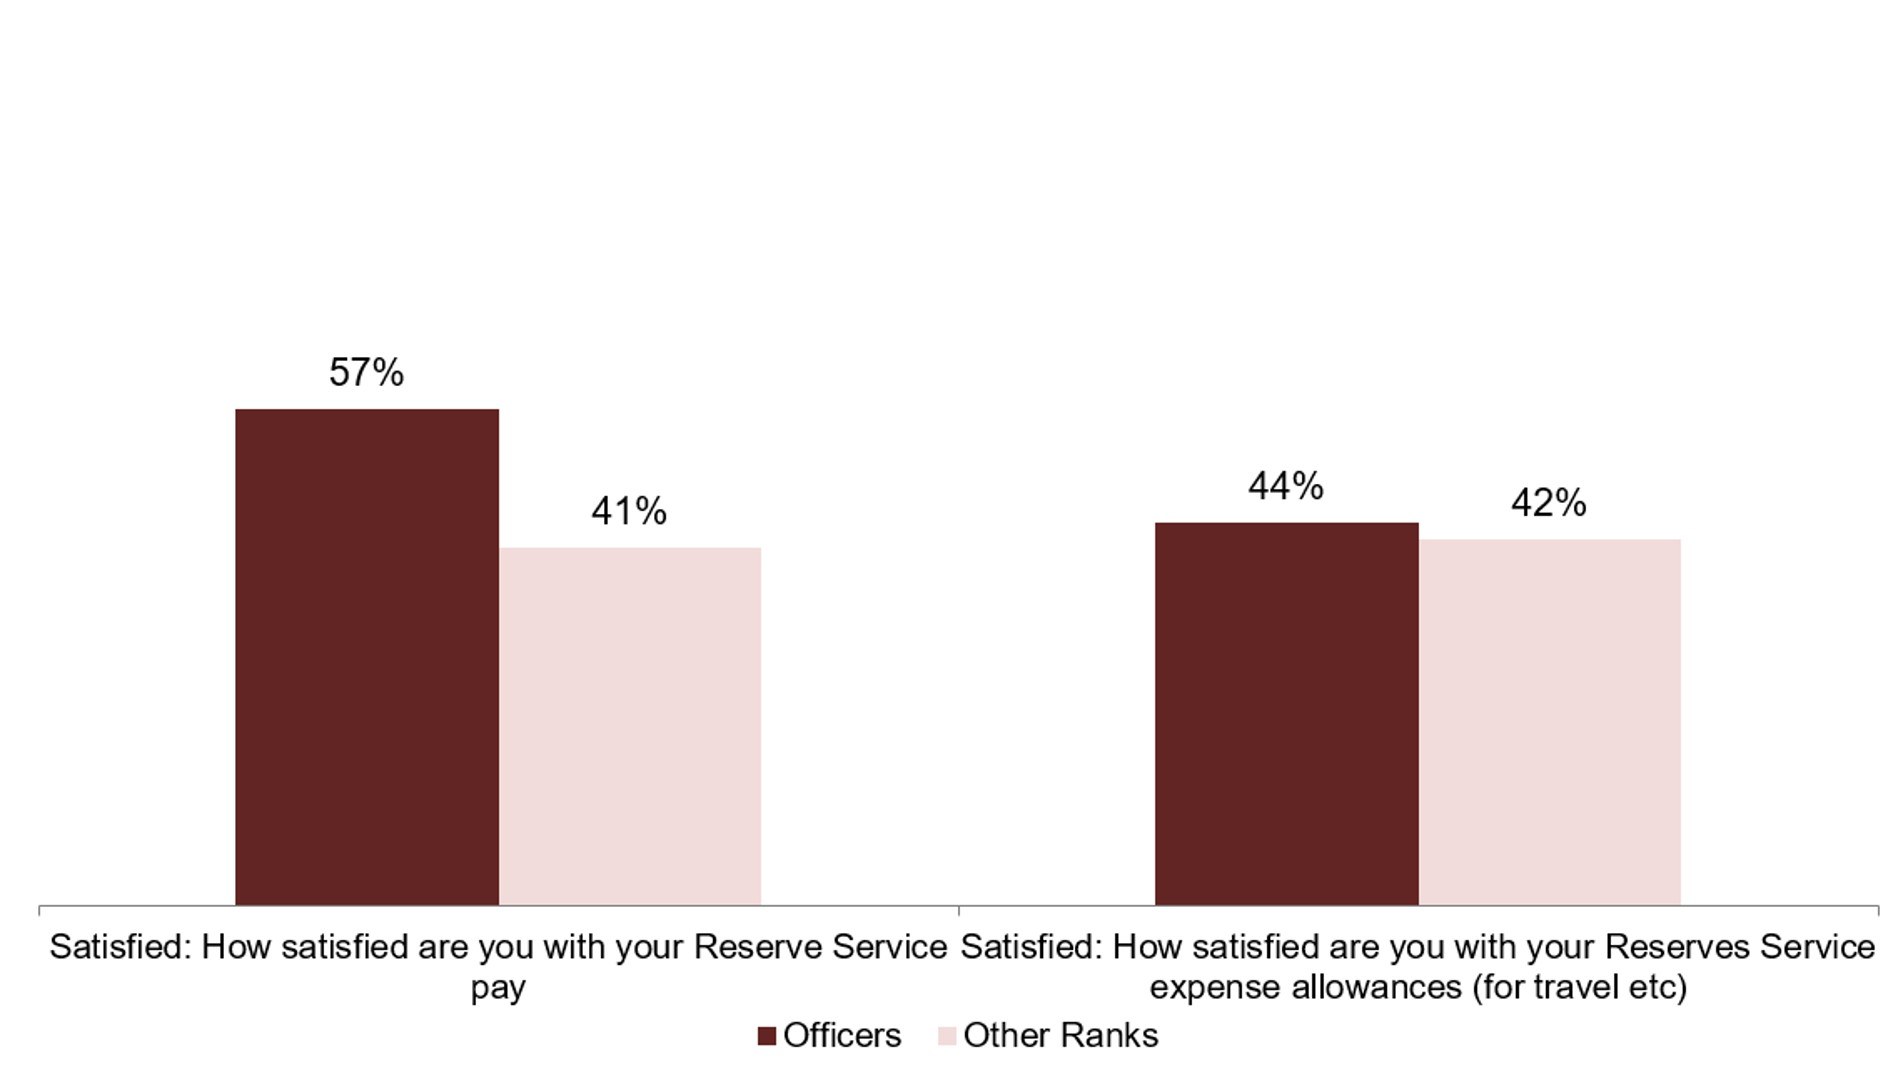
Just over half (57%) of Officers are satisfied with their Reserve Service pay compared to 41% of Other Ranks. Satisfaction with pay has decreased since 2022 for both Officers (62% in 2021 to 57% in 2026) and Other Ranks (47% in 2021 to 41% in 2026).
There is minimal difference between Officers and Other Ranks in satisfaction with the Reserve Service expense allowances (44% and 42% respectively). Likewise, the same proportion of Officers and Other Ranks are dissatisfied with Reserve Service expense allowances (both at 30%).
Figure 28 below shows this parity between Officers and Other Ranks in satisfaction with expense allowances, and also shows the large disparity in pay satisfaction (57% for Officers and 41% for Other Ranks).
Figure 28: Satisfied: Satisfaction with your Reserve Service pay and expense allowances broken down by Rank
Officers are more satisfied with their Reserve Pay compared to Other Ranks for all of the Services. This is shown in Figure 29 below. This chart shows satisfaction with Reserve pay by Service and Rank.
Figure 29: Satisfied: Satisfaction with Reserve Service pay by Service and Rank
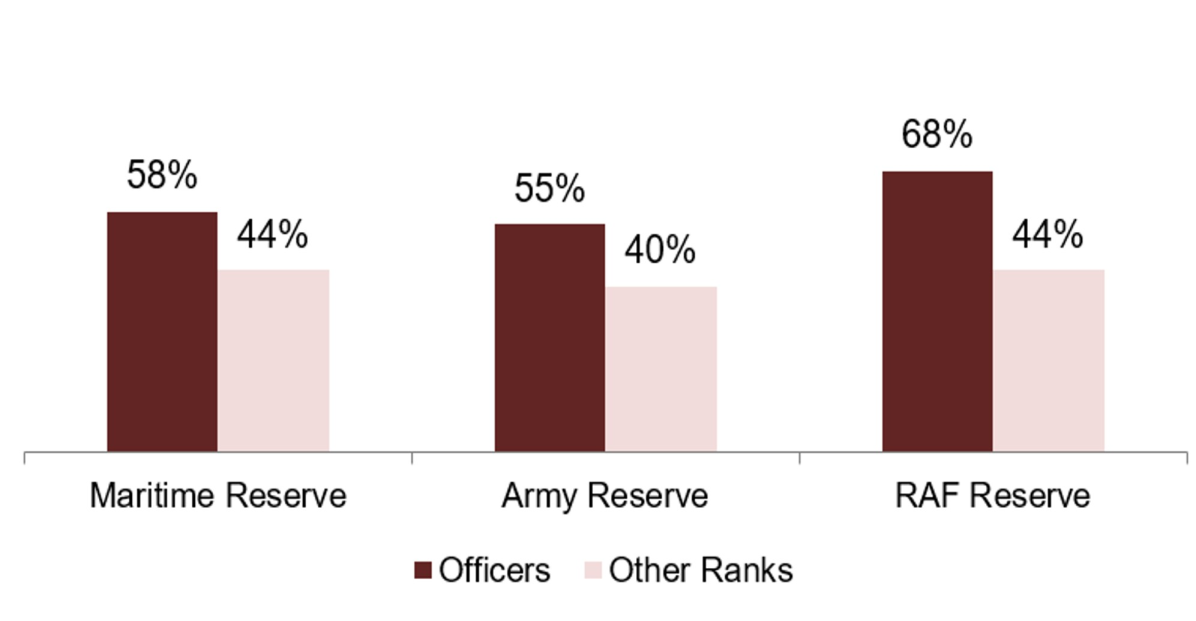
Army Other Ranks have the lowest satisfaction, with 40% being satisfied, 15 percentage points less than Army Officers. 44% of both RAF and Maritime Other Ranks were satisfied with Reserve Service pay. The RAF Reserves have the largest percentage point disparity in levels of satisfaction between their Officers and Other Ranks when it comes to their Reserve pay, with 68% of their Officers and 44% of their Other Ranks satisfied.
13. Personal equipment/kit
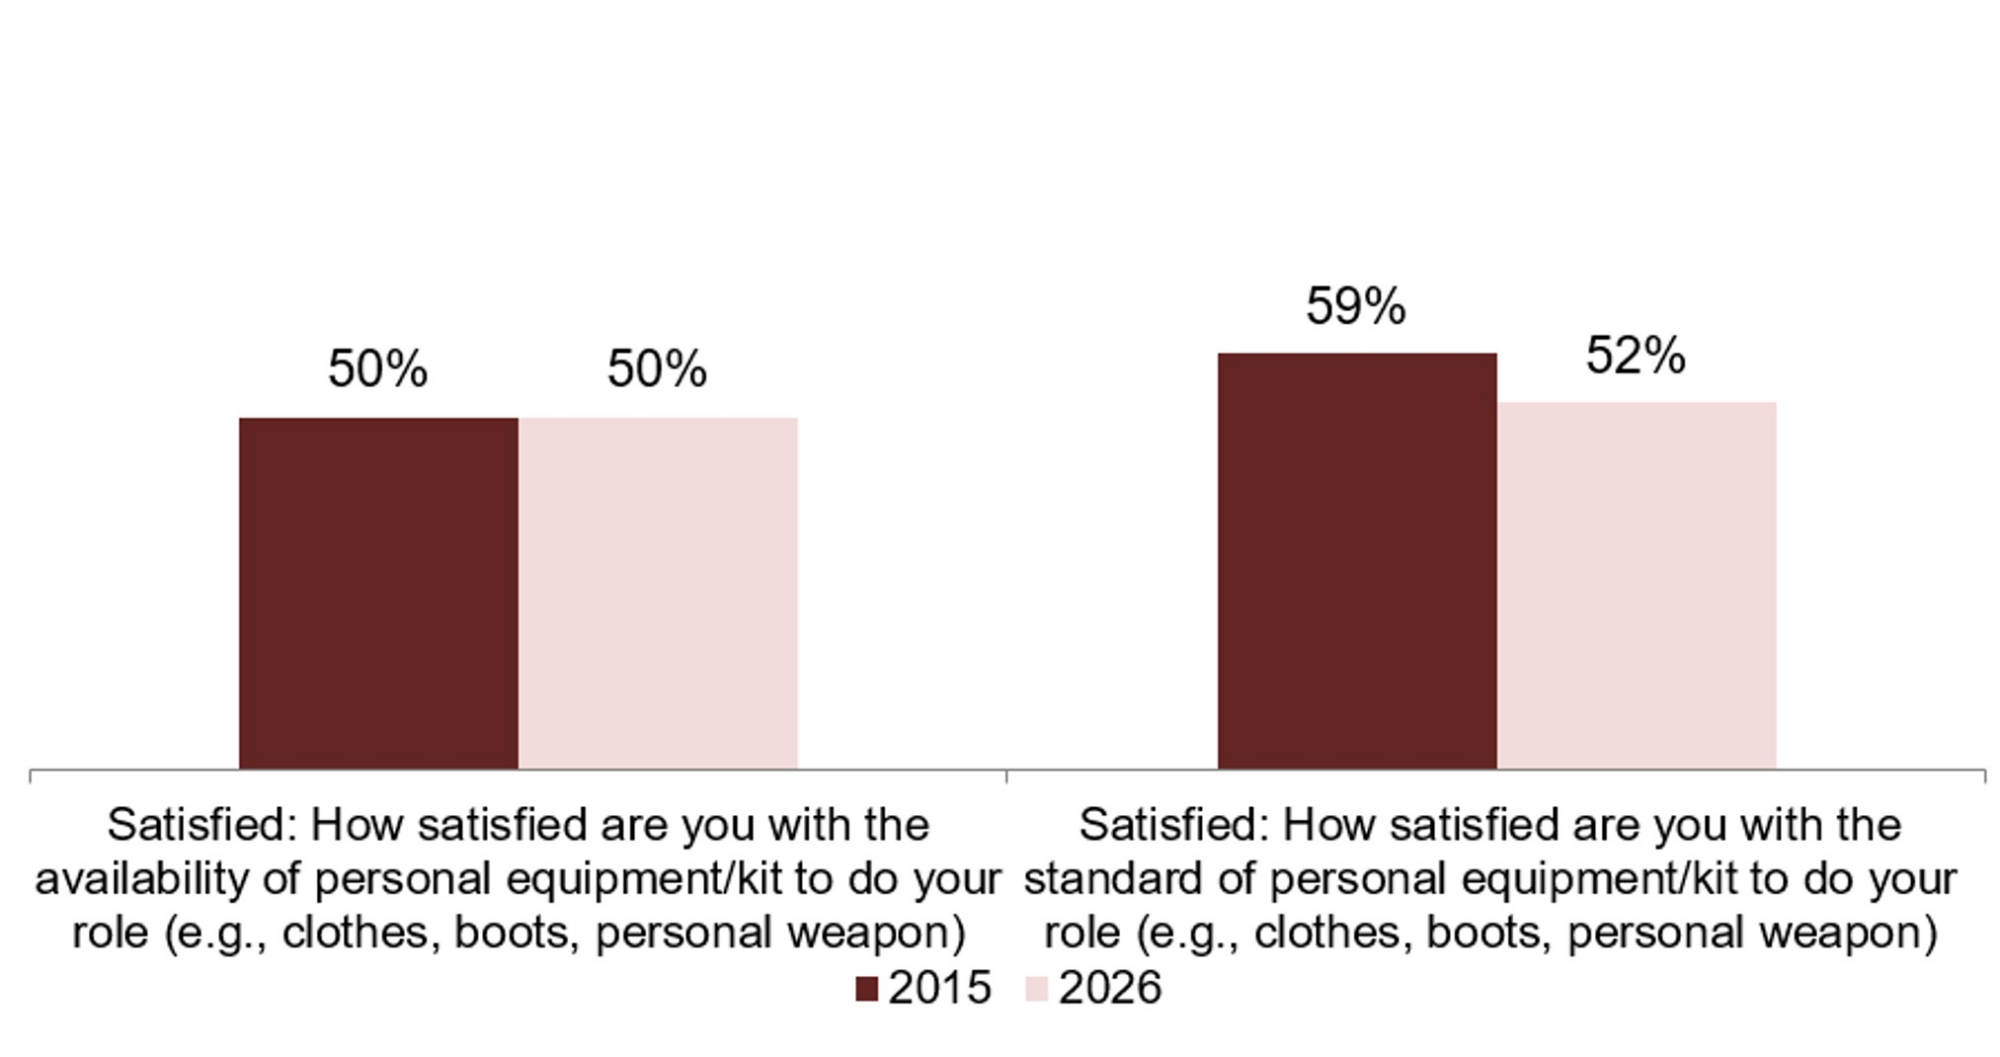
Satisfaction with the availability of personal equipment/kit at a Tri Service level is the same in 2026 (50%) as it was in 2015. However, satisfaction is lower than the levels reported between 2019 and 2021 (55% to 57%). Satisfaction with the standard of personal equipment/kit (52%) has remained broadly stable since 2022 and is lower than all levels reported prior to 2022. Satisfaction was 57% in 2015 and peaked at 58% in 2021.
Figure 30 compares satisfaction with the availability and standard of personal equipment/kit against the 2015 baseline.
Figure 30: Satisfied: Satisfaction with the availability and standard of personal equipment to do your role compared against the baseline year
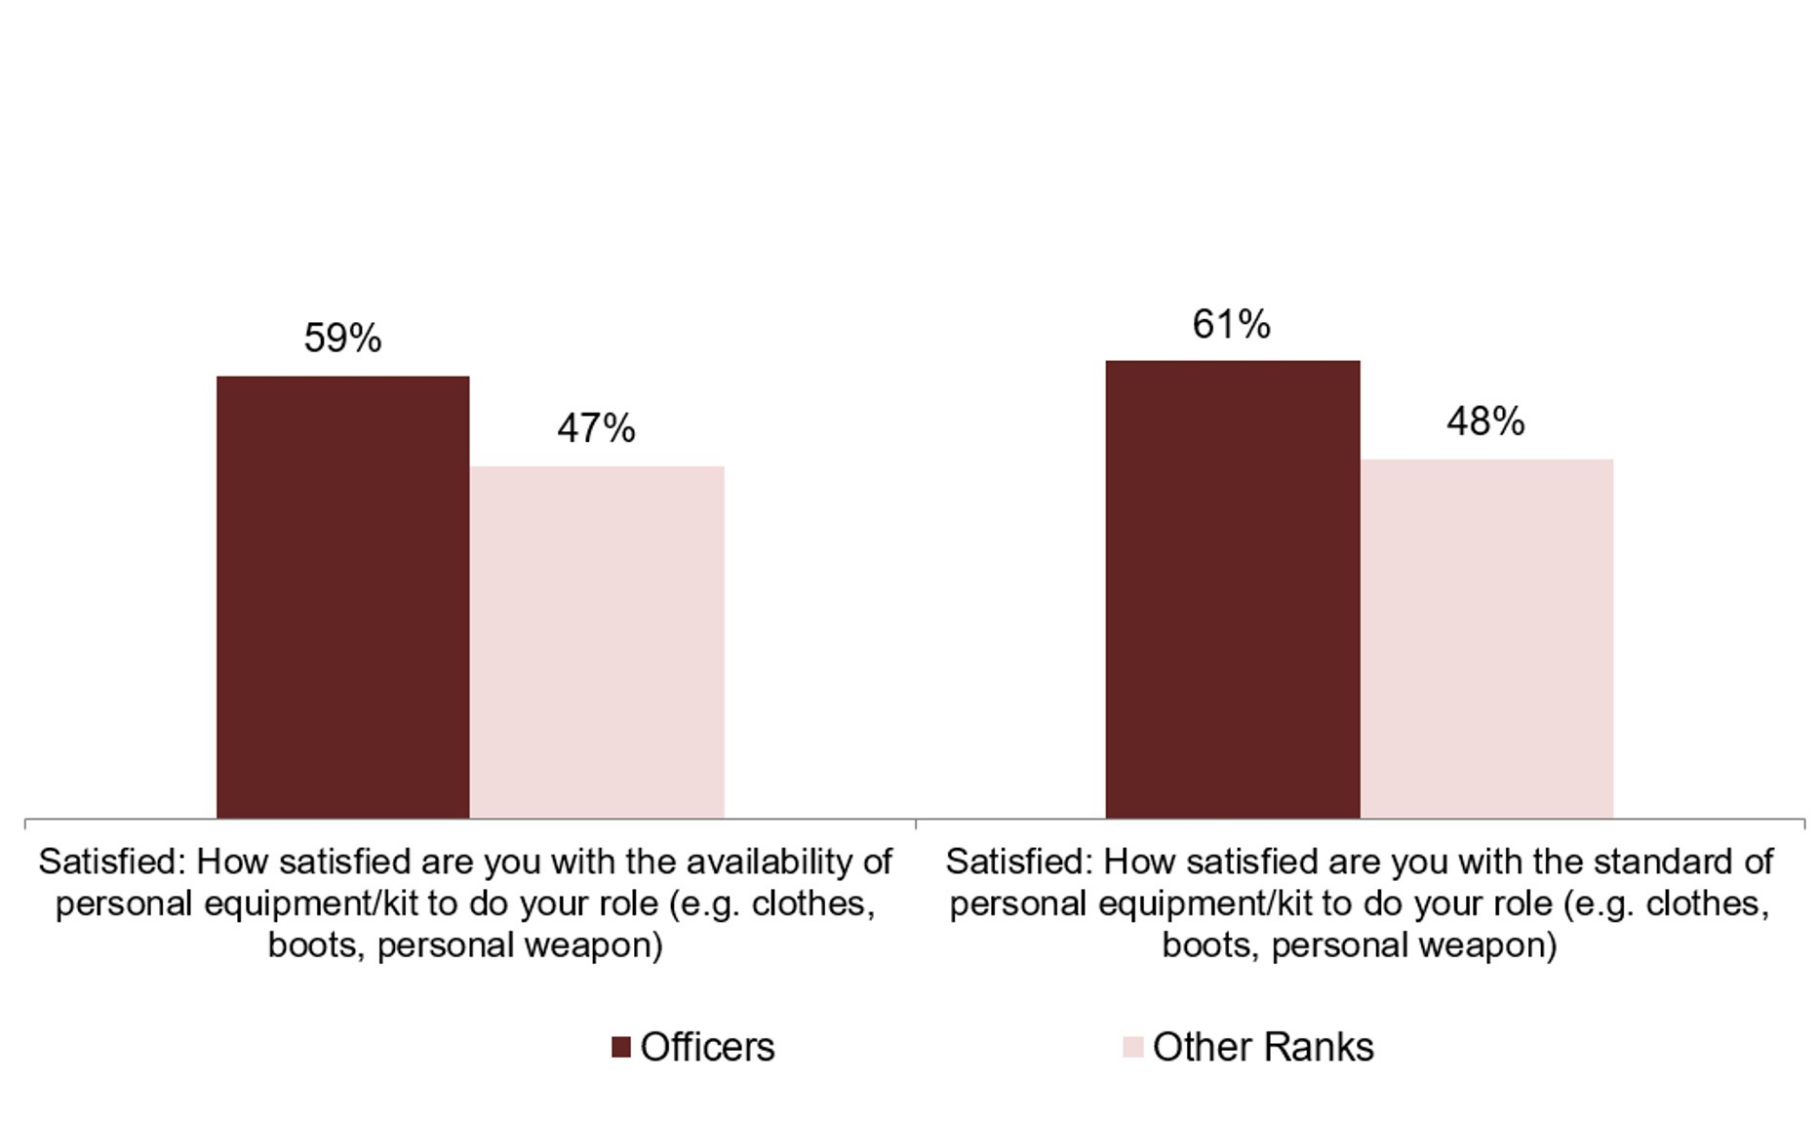
A larger proportion of Officers are satisfied with the availability of personal equipment (59%) compared to Other Ranks (47%). Satisfaction for both Officers and Other Ranks has remained at a similar level to last year. Similarly, a larger proportion of Officers are happy with the standard of the personal equipment/kit (61%) compared to Other Ranks (48%). Again, satisfaction for both Officers and Ranks remains similar to last year. There has been a decrease from the 2015 baseline in satisfaction with the standard of personal kit/equipment for both Officers and Other Ranks (70% to 61% and 57% to 48% respectively).
The differences in satisfaction between Officers and Ranks in 2026 can be seen in Figure 31.
Figure 31: Satisfied: Satisfaction with the availability and standard of personal equipment to do your role by Rank
Army Reserves are less satisfied with the availability of their equipment/kit (48%) compared to the Maritime Reserve (58%) and RAF Reserve (59%). Maritime Reserves are also more satisfied with the availability of equipment compared to the 2015 baseline (51% in 2015). Army Reserves are less satisfied with the standard of their equipment/kit (49%) compared to Maritime Reserves (64%) and RAF Reserves (63%). Army Reserves are also less satisfied with the standard of equipment (50%) compared to the 2015 baseline (58%).
Figure 32: Satisfied: Satisfaction with the availability and standard of personal equipment to do your role by Service
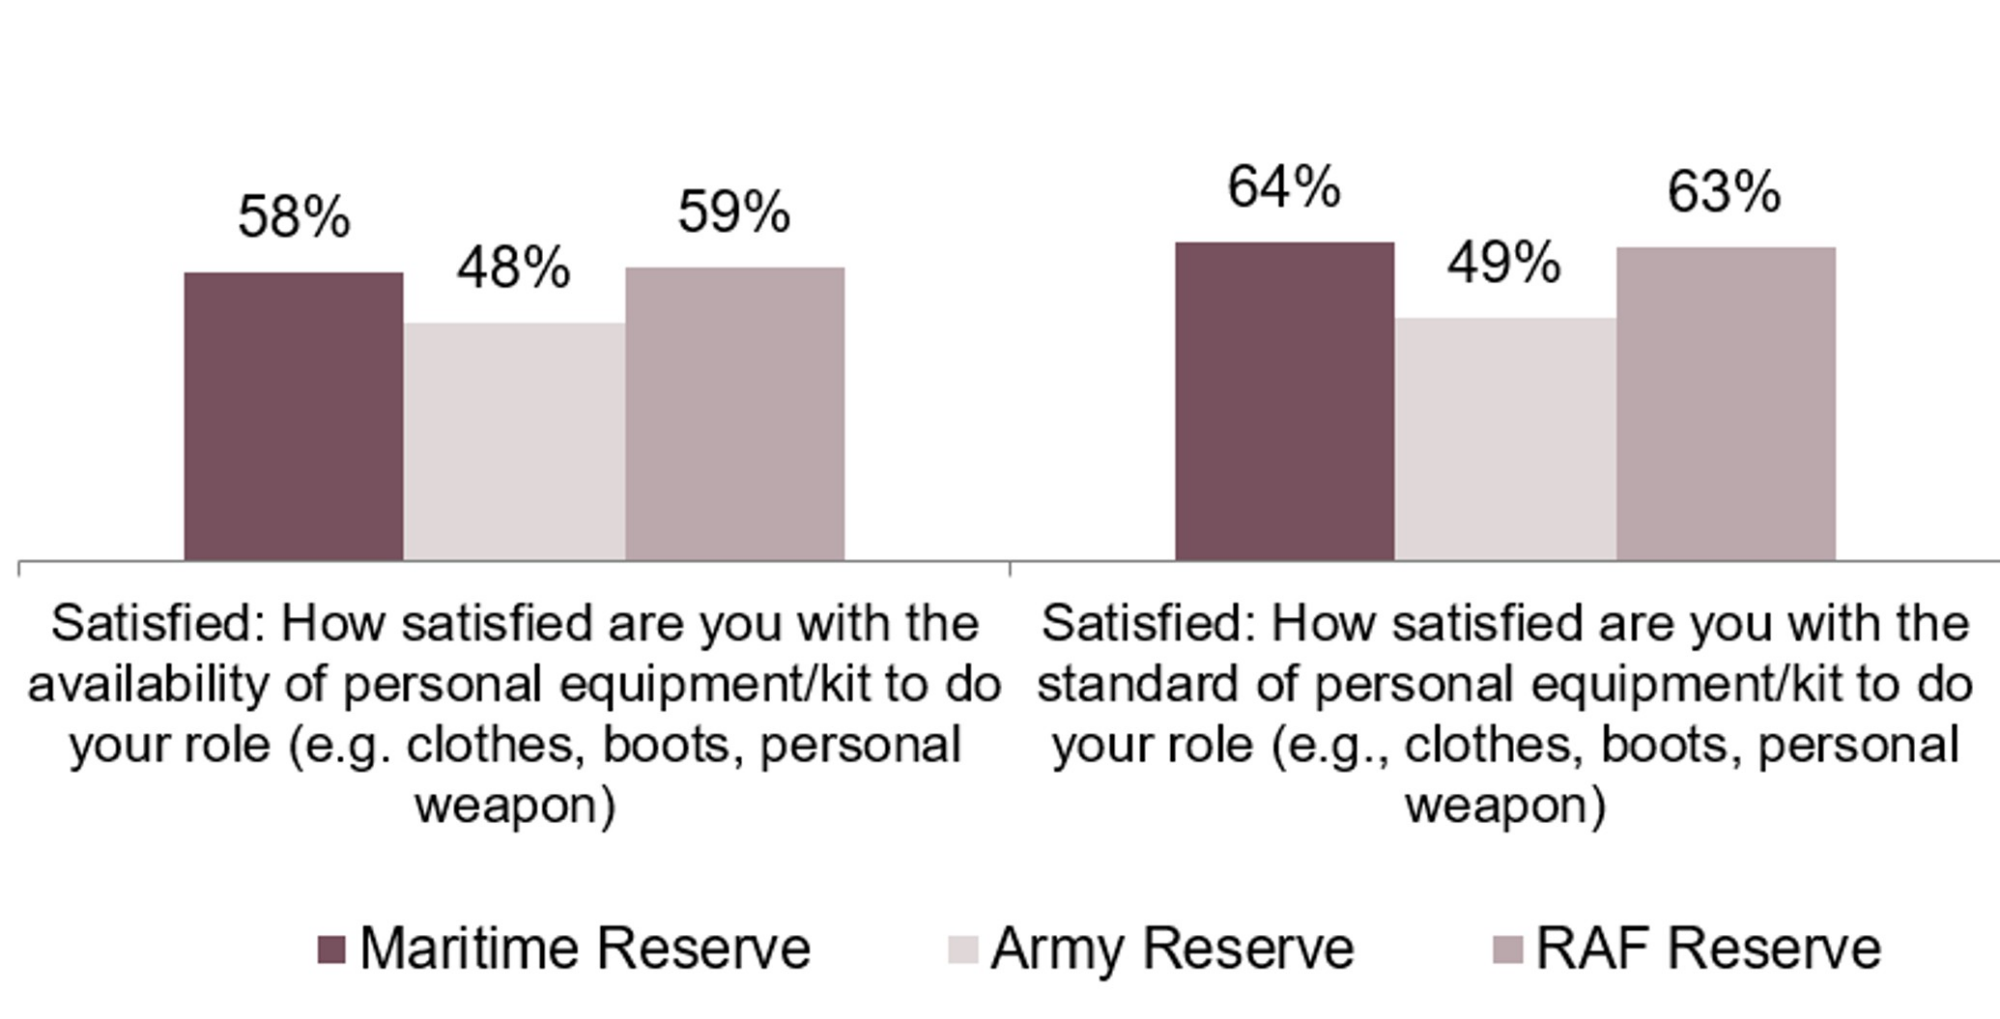
Figure 32 shows the satisfaction with the availability and standard of personal kit and equipment by Reserve Service. It shows that Army Reserves are less satisfied than the other two Services with the availability and standard of personal equipment.
14. Career progression
Just under half (46%) of Volunteer Reserves are satisfied with their career management within their unit,whilst just over a quarter (26%) are dissatisfied.
The proportion of Volunteer Reserves that are satisfied with their career management in their unit in 2026 is at a similar level to what it was in 2015 (44%). Each of the three Services also have similar levels of satisfaction with their career management within their unit compared to the baseline year of 2015.
Satisfaction with opportunities for promotion has remained similar to last year (39% in 2026) and similar to the baseline year (40%).
Figure 33: Satisfied: Satisfaction with career management within your unit and opportunities for promotion compared against the baseline year
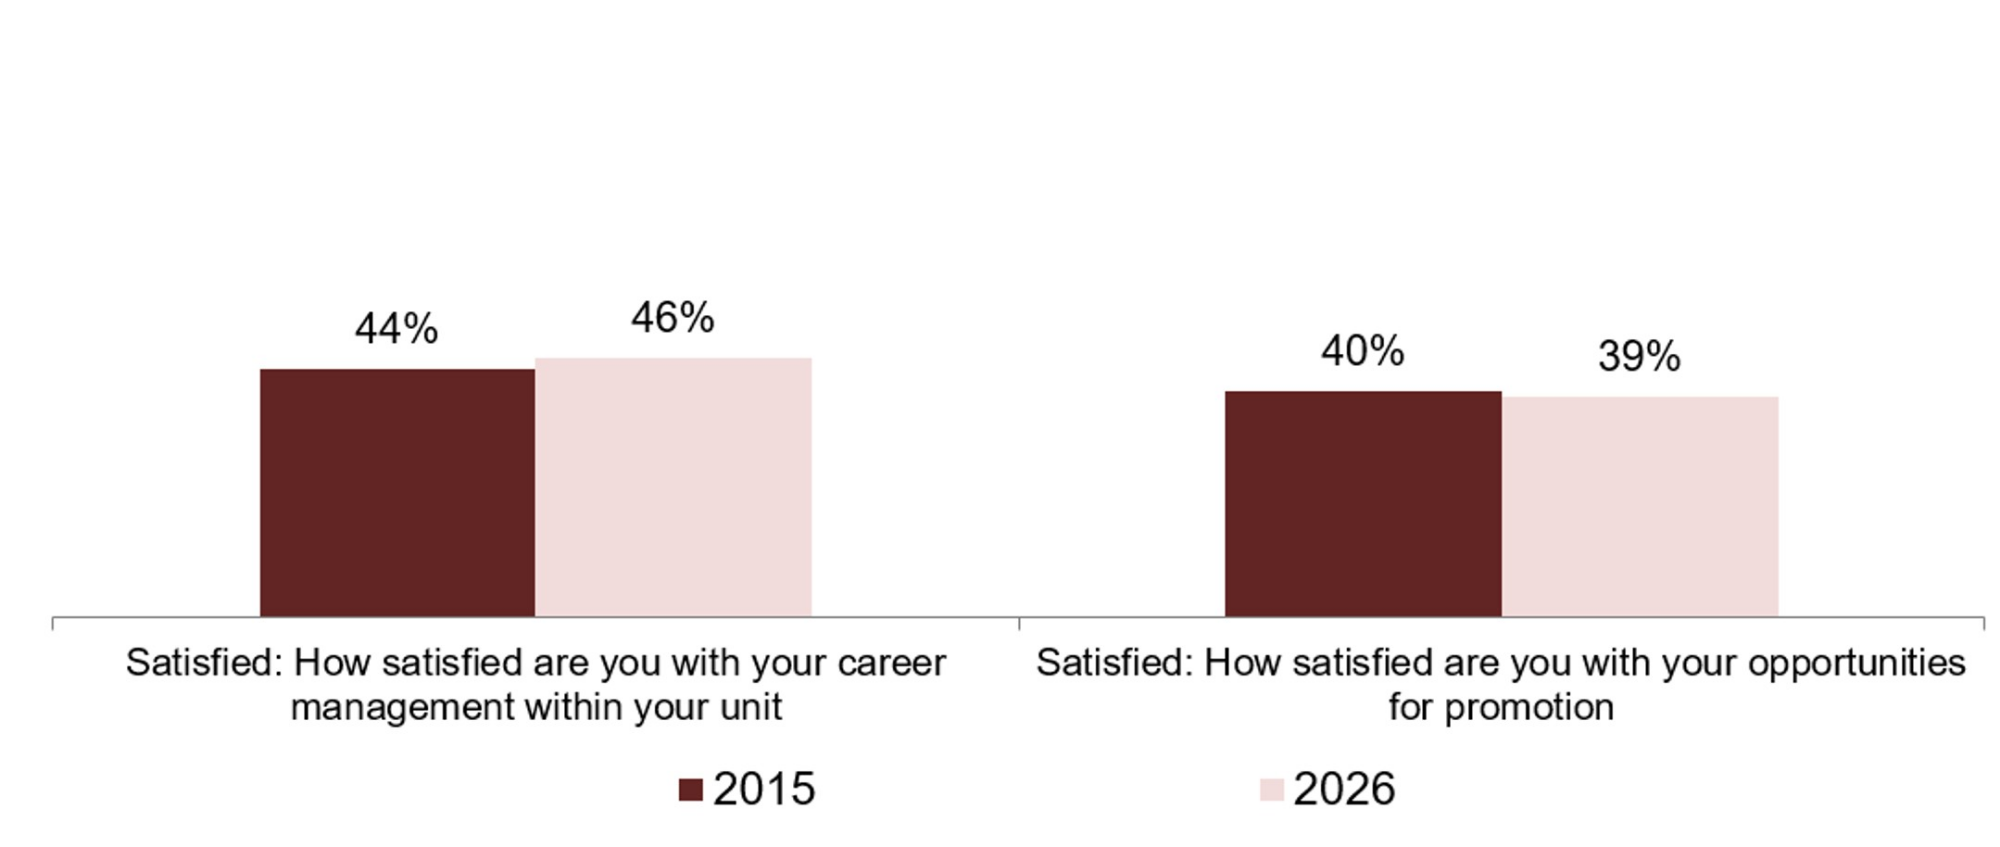
Figure 33 shows satisfaction with career management and opportunities for promotion against 2015 levels. Satisfaction with both career management within units and promotion opportunities have remained relatively stable since 2015 baseline levels.
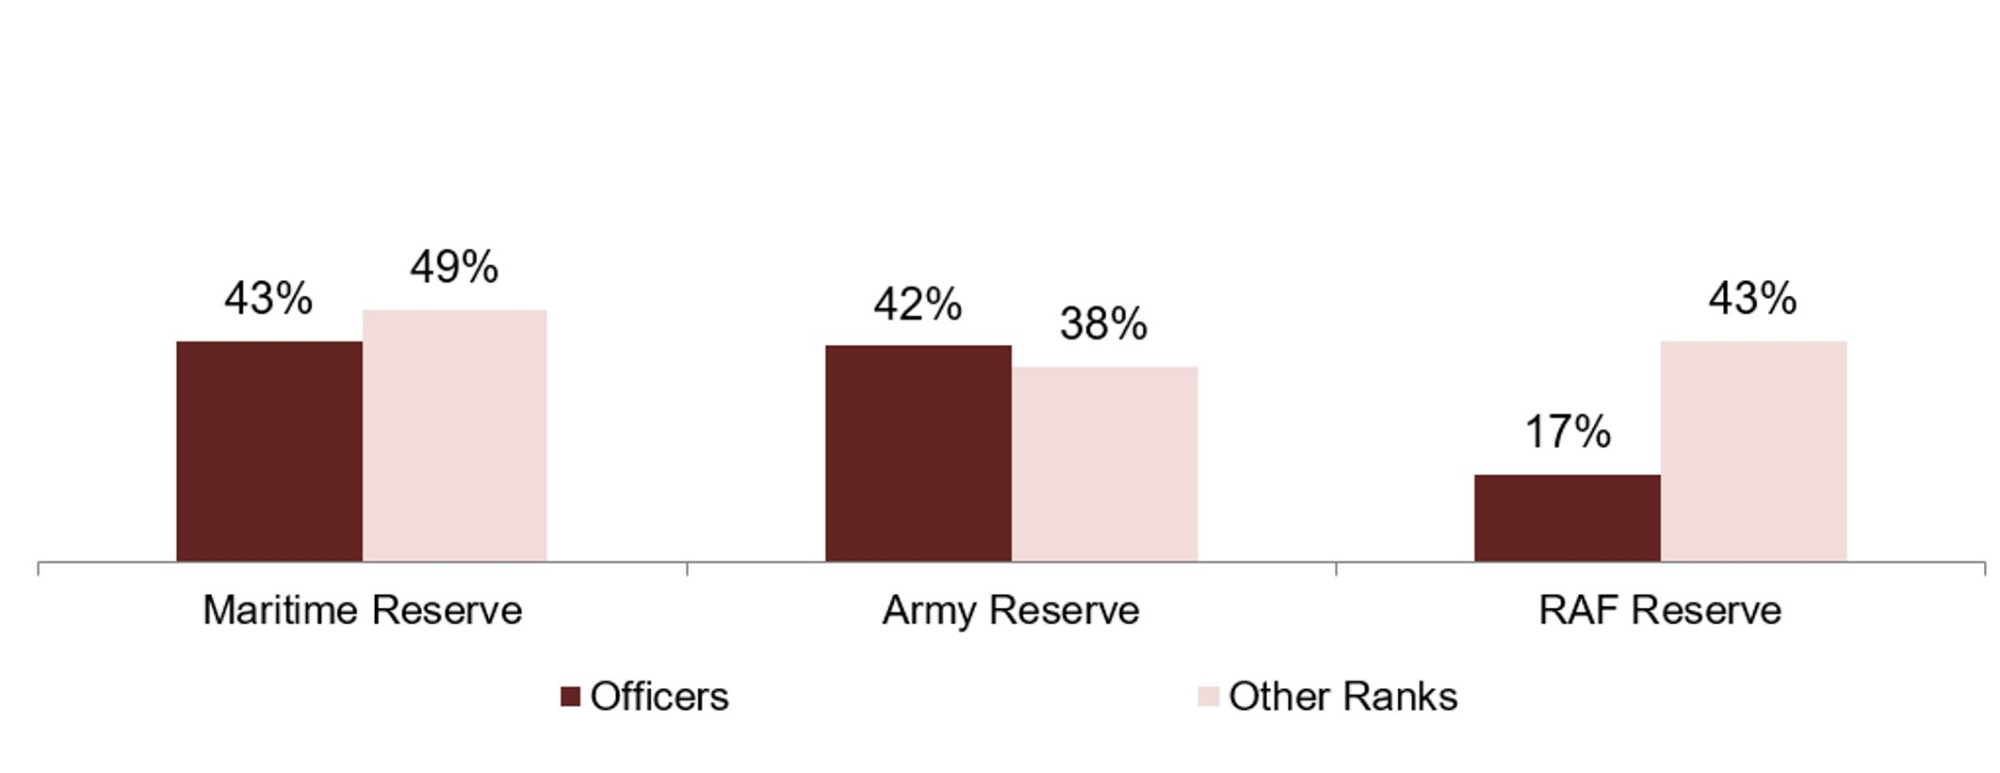
RAF Reserve Officers are less satisfied with opportunities for promotion (17%) compared to Maritime Reserve Officers (43%) and Army Reserve Officers (42%). Among the Other Ranks, the Army Reserve are less satisfied with their opportunities for promotion (38%) than Maritime Reserve (49%). 43% of RAF Reserve Other Ranks are satisfied with opportunities for promotion.
Overall, the Maritime Reserves are more satisfied with opportunities for promotion (47%) than the Army and RAF Reserves (39% and 36% respectively).
Figure 34 shows the satisfaction with opportunities for promotion by Service and Rank in 2026.
Figure 34: Satisfied: Satisfaction with opportunities for promotion by Service and Rank in 2026
Just over half of Volunteer Reserves (53%) are satisfied with their opportunities for personal development, which is higher than baseline 2015 levels (47%). Satisfaction with opportunities for personal development remains at similar levels to last year (52% in 2025).
Opportunities for personal development is consistently one of the most popular reasons given by respondents for joining the Volunteer Reserve and their reasons for staying — see the Reasons for joining and staying in the Reserves section.
Figure 35: Satisfied: Satisfaction with opportunities for personal development by Service against the baseline year
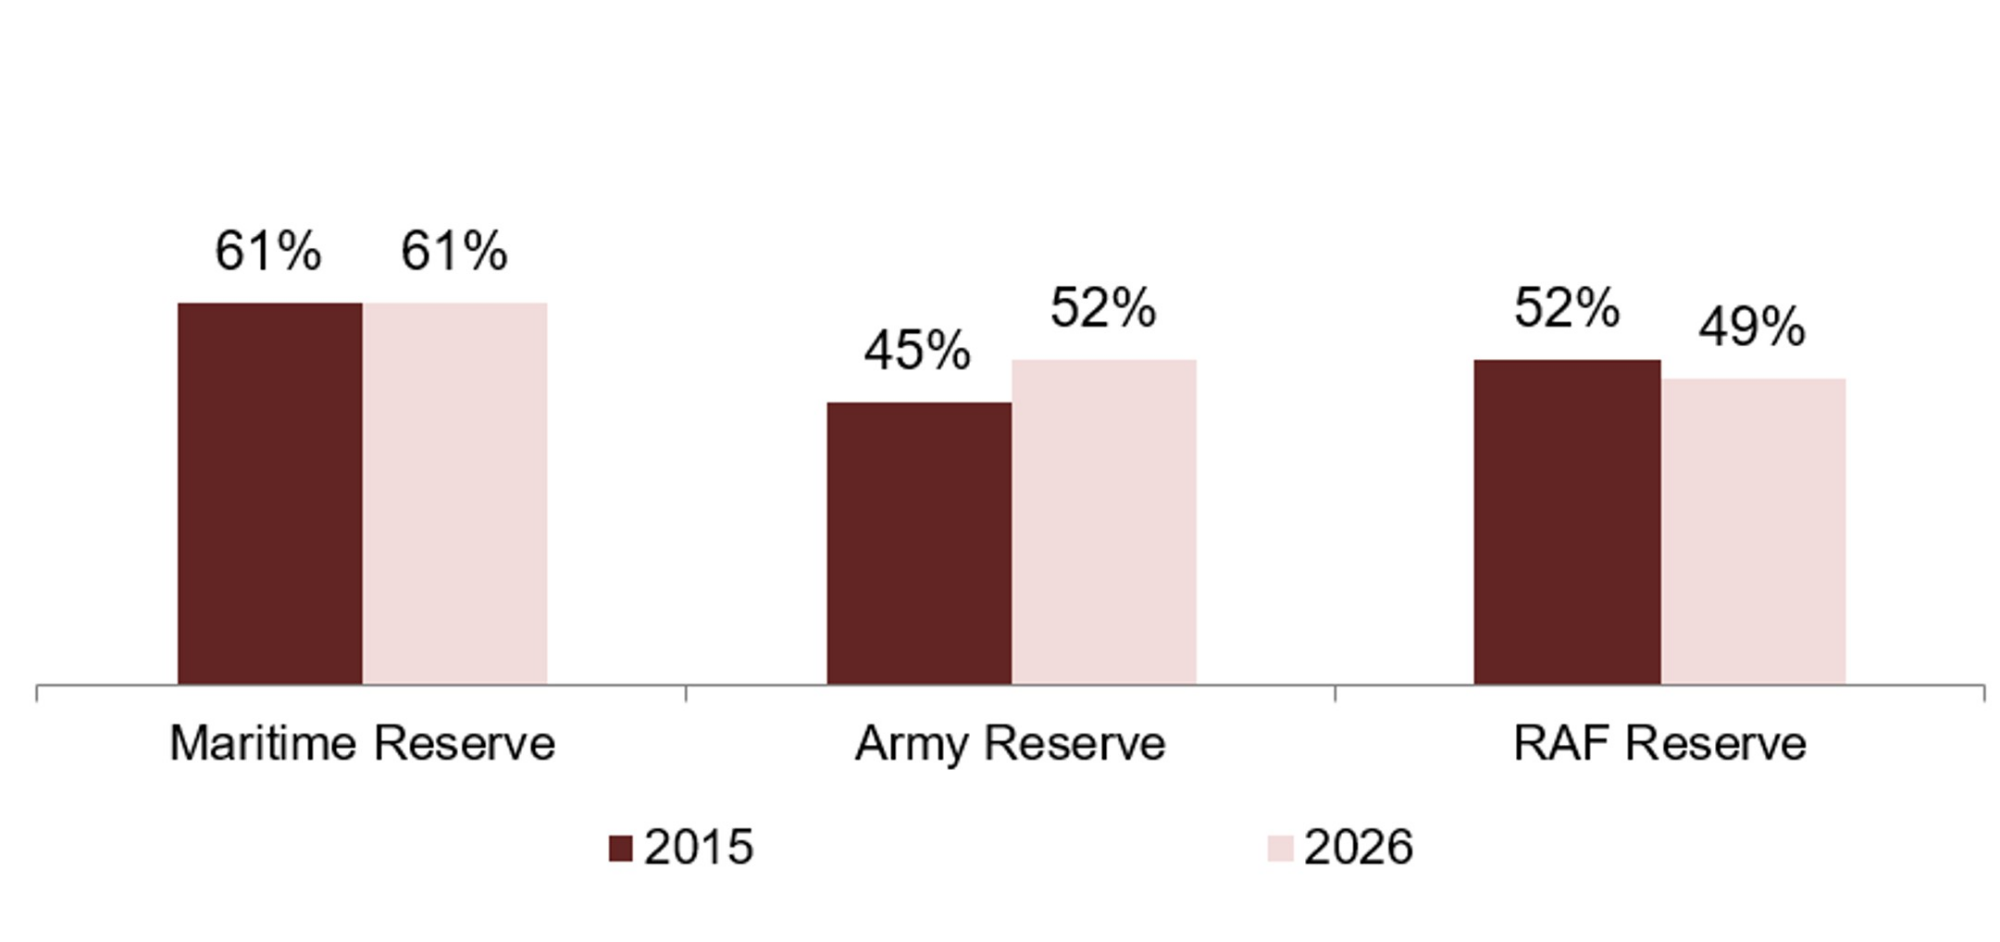
Figure 35 shows satisfaction with opportunities for personal development by Service against baseline levels. The Maritime and RAF Reserves (61% and 49% respectively) show similar levels of satisfaction compared to baseline levels, whilst the Army Reserves (52%) report an increase since the baseline year (45% in 2015).
15. Training and development
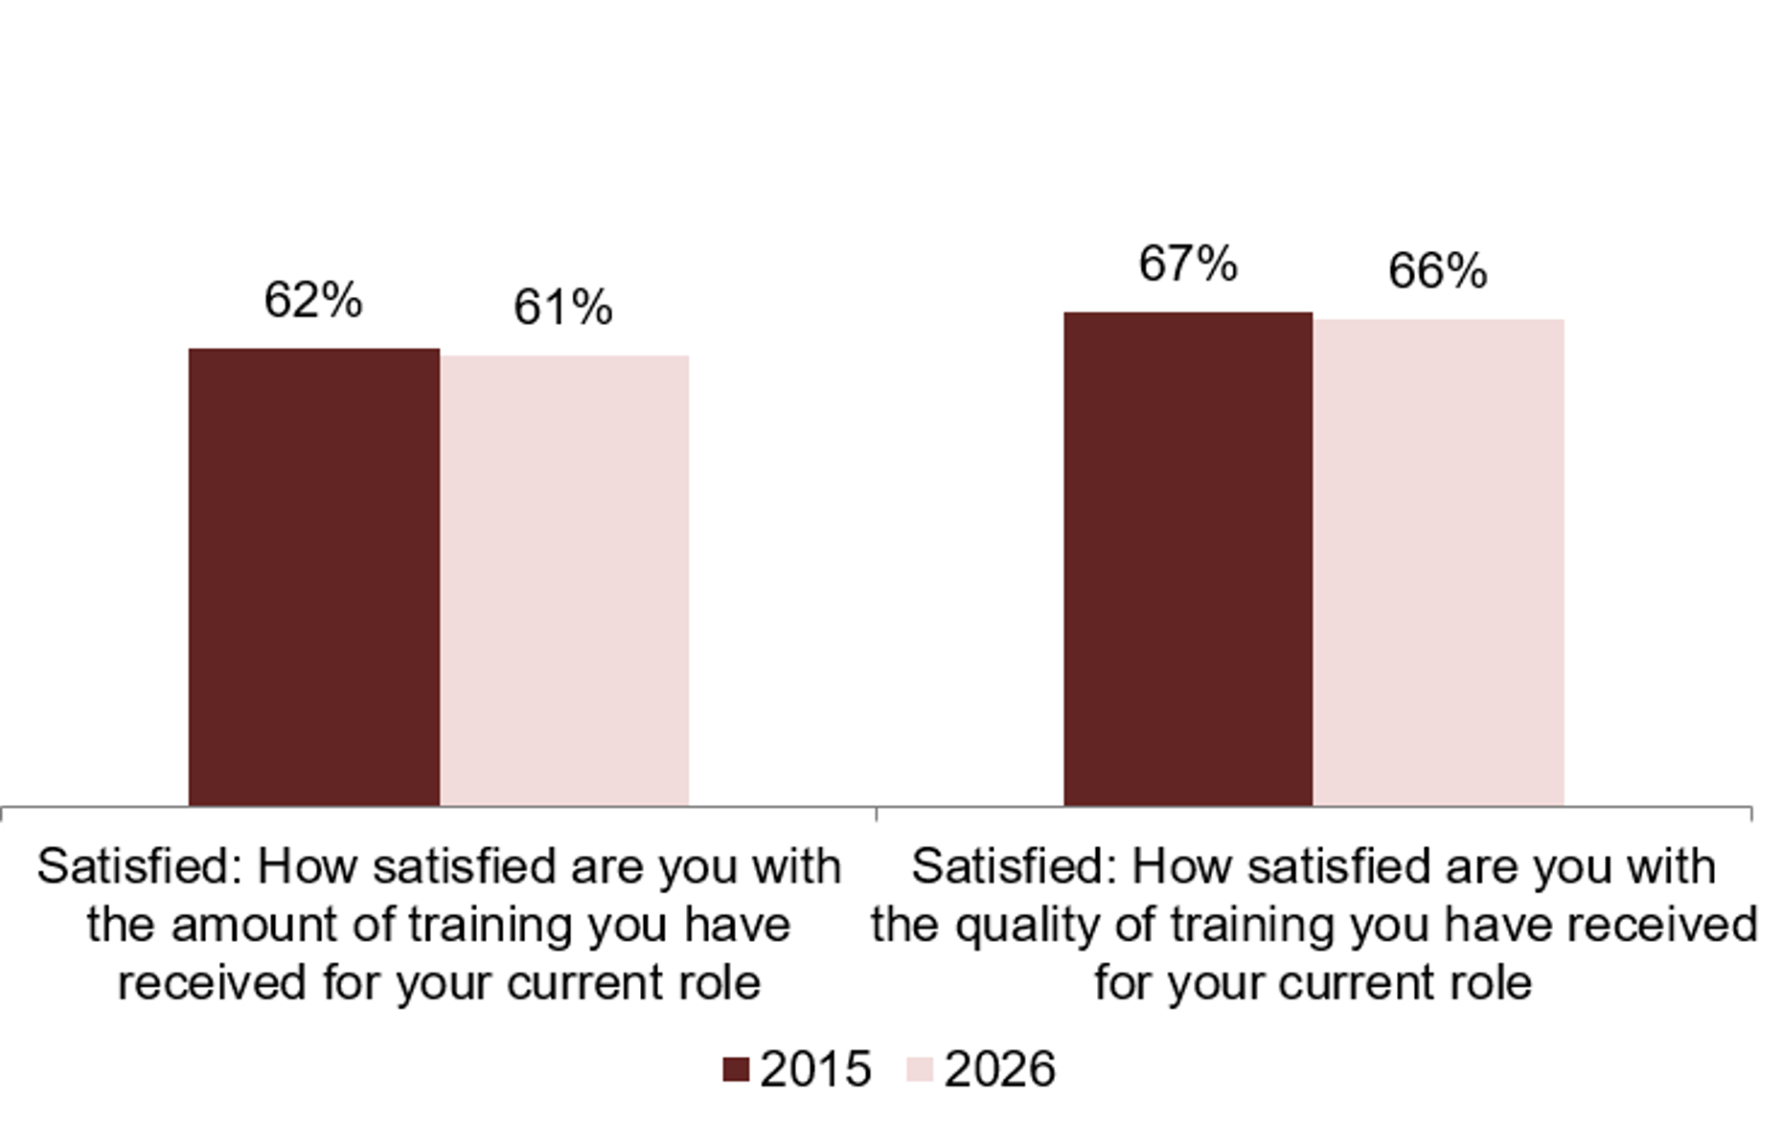
Over six in ten Volunteer Reserves are satisfied with the amount (61%) and quality (66%) of training they have received for their current role. Satisfaction with the amount of training is at a similar level to both the baseline year of 2015 (62%) and last year (58%). Satisfaction with the quality of training has remained the same since last year (64% in 2025), and is at a similar level to the 2015 baseline level (67%).
Figure 36 shows satisfaction with the amount and quality of training received for current role against the 2015 baseline year. Both remain at a similar level to the baseline year.
Figure 36: Satisfied: Satisfaction with the amount and quality of training received for current role against the baseline year
Around half (54%) of Volunteer Reserves are satisfied with the amount of leadership training received, which has increased since the 2015 baseline (46%).
There has been a decrease in Volunteer Reserves being satisfied with their opportunities to take part in Adventurous Training since the 2015 baseline (from 57% in 2015 to 53% in 2026).
Figure 37: Satisfied: Satisfaction with the amount of leadership training received and opportunities to take part in Adventurous Training against the baseline year
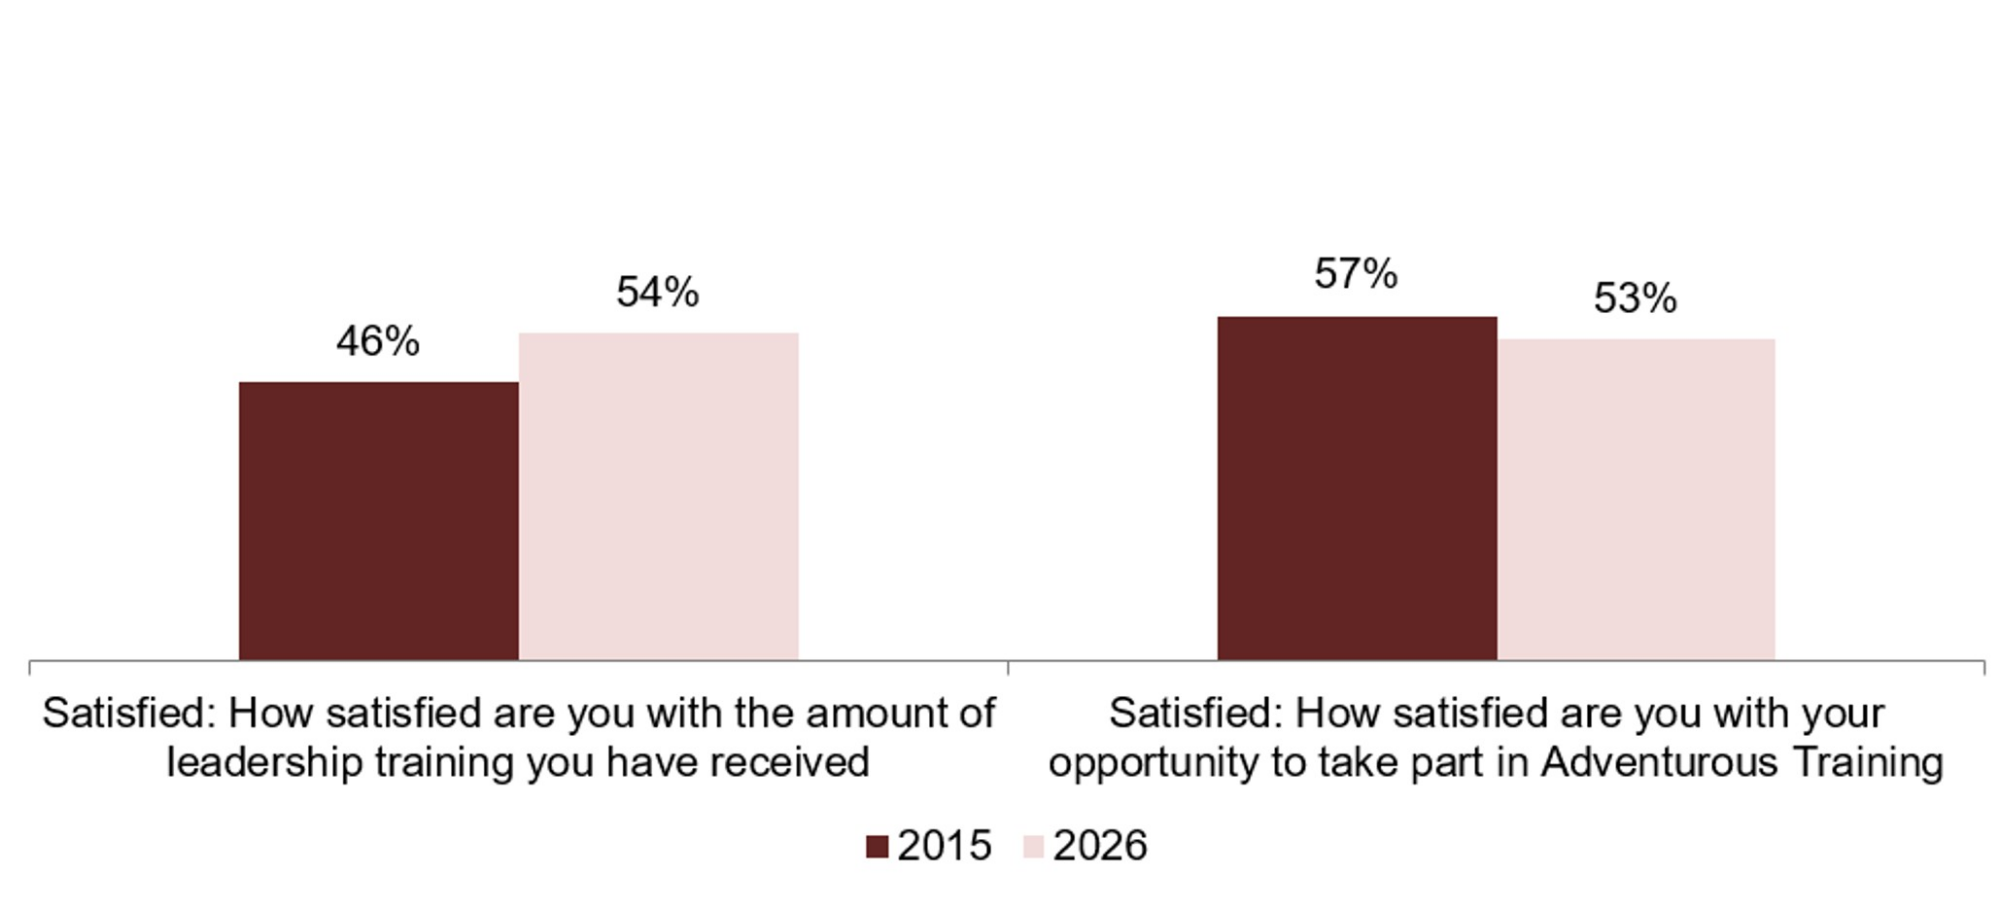
Figure 37 shows satisfaction levels with the amount of leadership training and opportunities for taking part in Adventurous Training against baseline levels.
The Maritime Reserve (68%) has the highest level of satisfaction with the amount of leadership training they have received compared to the Army Reserve (52%) and the RAF Reserve (58%).
At a Tri-Service level, more Officers (67%) are satisfied with the amount of leadership training they have received compared to Other Ranks (50%).
There has been an increase in Maritime Officers and Army Officers satisfaction with the amount of leadership training they have received compared to the 2015 baseline (63% to 74% and 54% to 65% respectively).
Figure 38: Satisfied: Satisfaction with amount of leadership training received broken down by Service and Rank
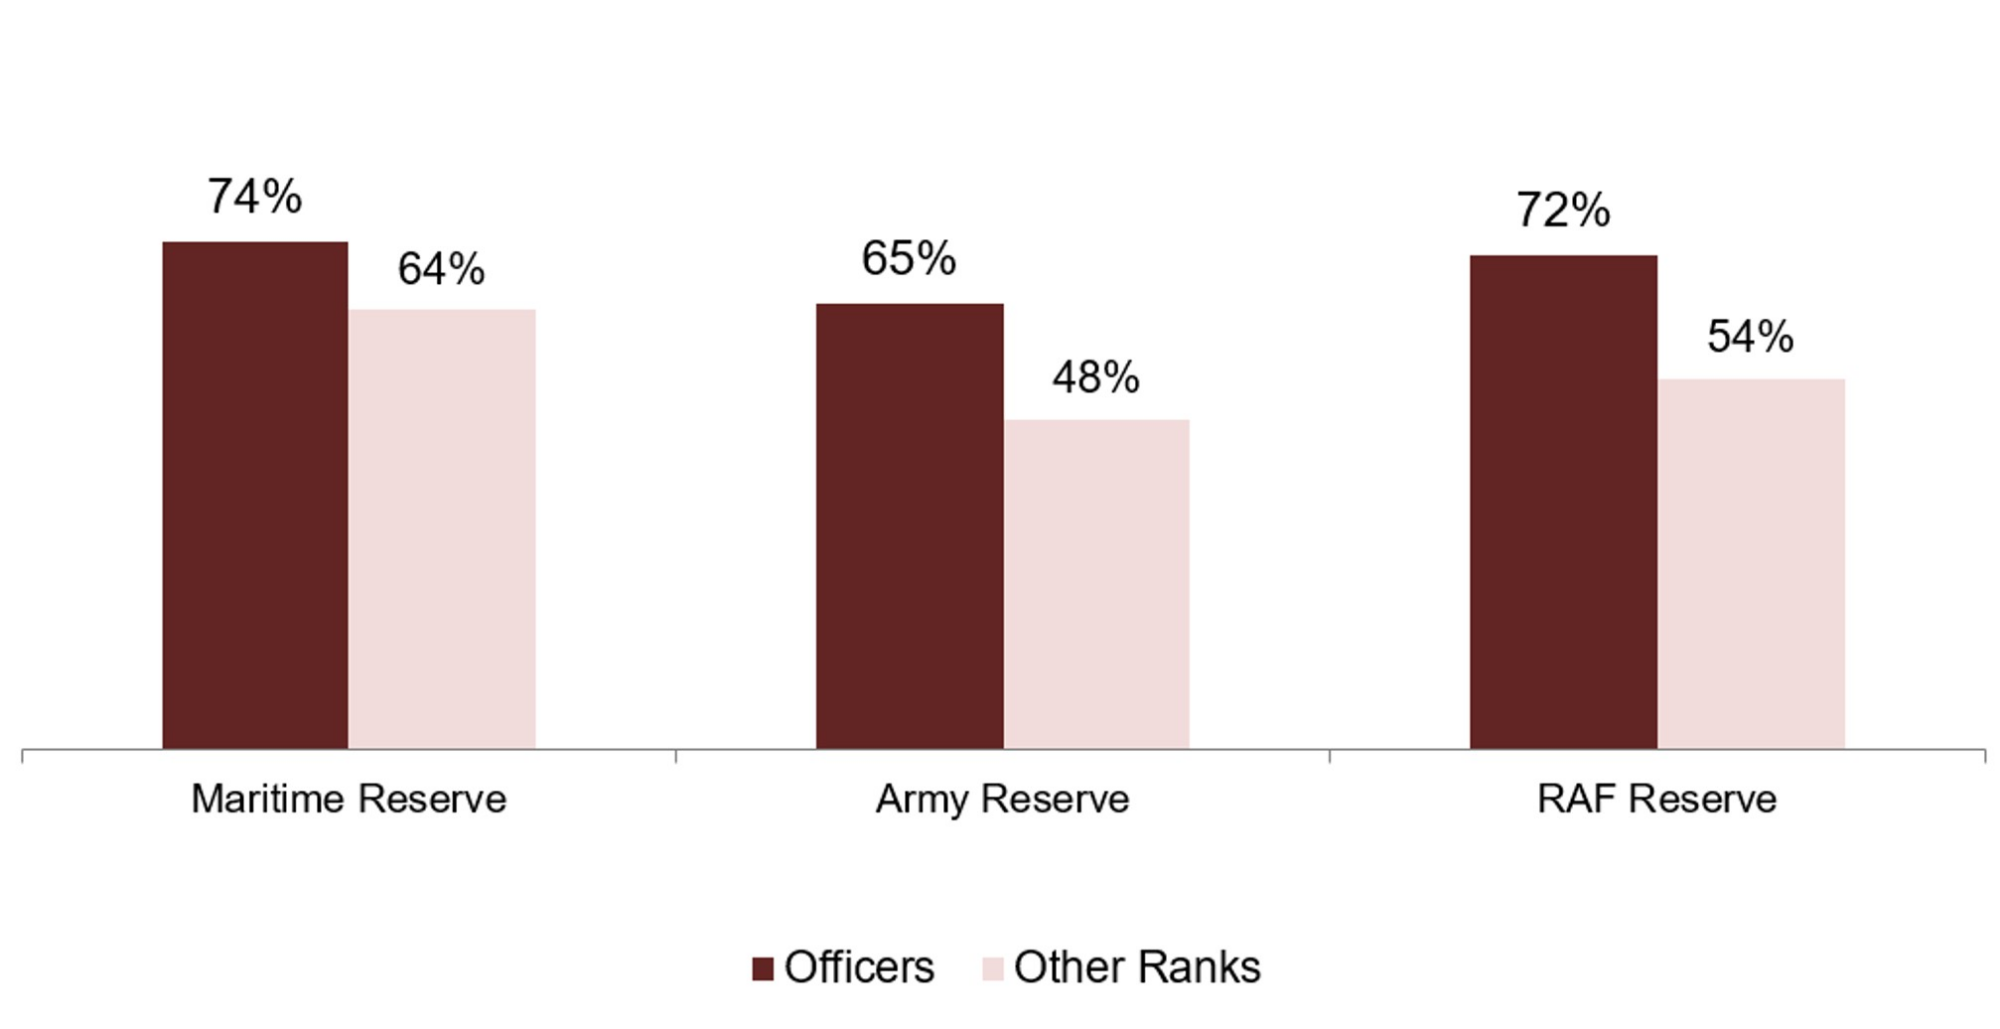
Figure 38 shows satisfaction with the amount of leadership training by Service and Rank. Other Ranks are less satisfied with amount of leadership training in the Maritime Reserves and Army Reserves. Maritime Reserve Other Ranks (64%) are the most satisfied with opportunities for leadership training, reporting higher levels than Army Reserves Other Ranks (48%) and RAF Reserves Other Ranks (54%).
16. Family Support
Nearly nine in ten (87%) Volunteer Reservists feel that their family supports their Reserve Service, which is similar to 2015 baseline levels. Furthermore, nearly four out of five (79%) of Volunteer Reserves feel that their family values their Reserve service, similar to 2015 baseline levels and last year’s levels. Overall, levels of family support and valuation of Reserve Service have remained relatively stable over time. 21% of Reservists report that their families would prefer that they were not a Reservist, the same level as 2015 baseline levels and last year.
Figure 39: Agree: My family supports and values my Reserve Service against the baseline year
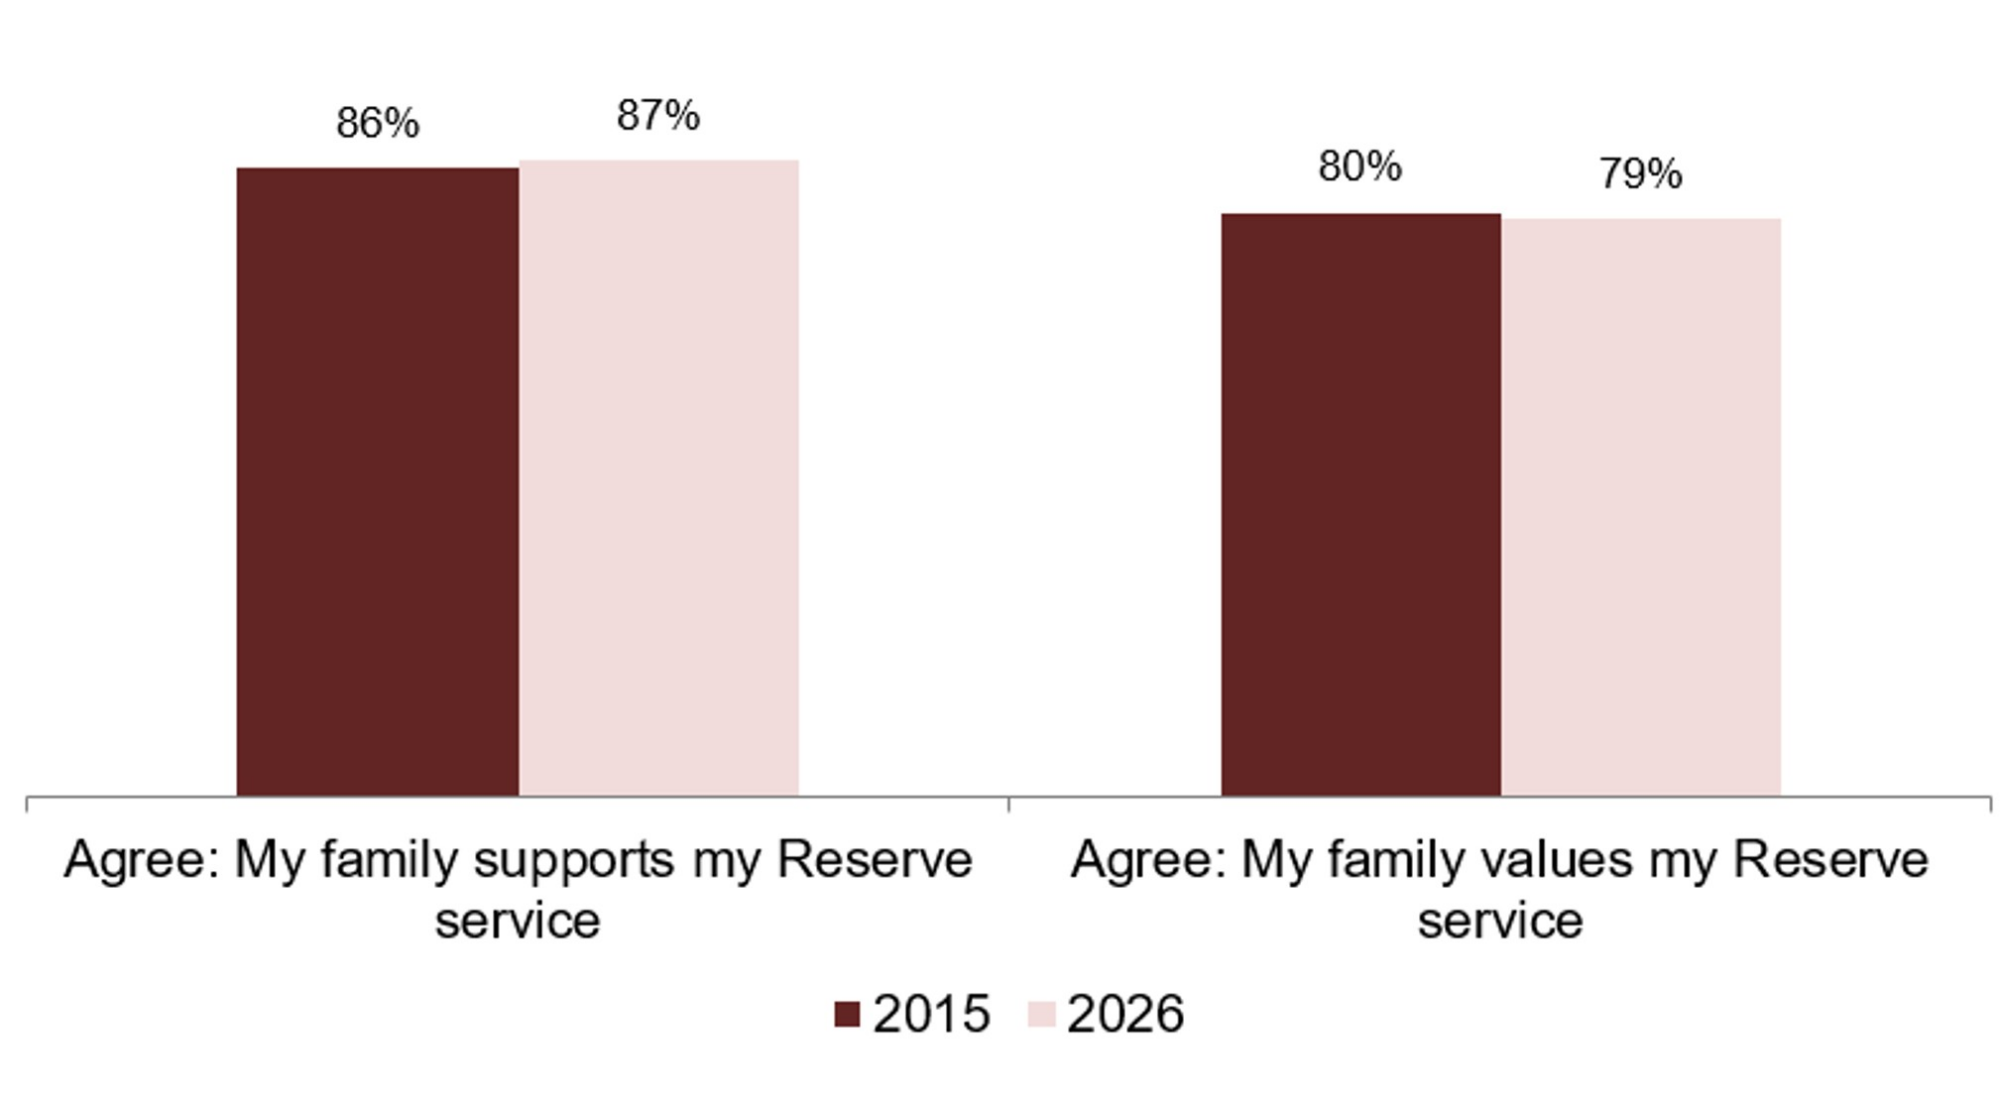
Figure 39 shows levels of agreement that families support and value Reserve Service against the baseline year.
17. Mobilisation
Overall, the percentage of Volunteer Reservists mobilised has increased since 2020 from 26% to 34% in 2026. 2026 levels are below baseline 2015 levels (40%), and similar to last year (38%).
The percentage of Army Reserves being mobilised is lower than the 2015 baseline (39% in 2015 to 34% in 2026). A larger proportion of Officers at a Tri Service level (39%) have been mobilised compared to Other Ranks (33%).
The proportion of Reservists responding yes to being mobilised in the last three years remained stable between 2018 (when the question was first asked) and 2020. From 2020 (6%), there was an increase to 17% in 2021, but this has since decreased in 2026 (15%).
Figure 40: Yes: Been mobilised as a Reservist compared against the baseline year
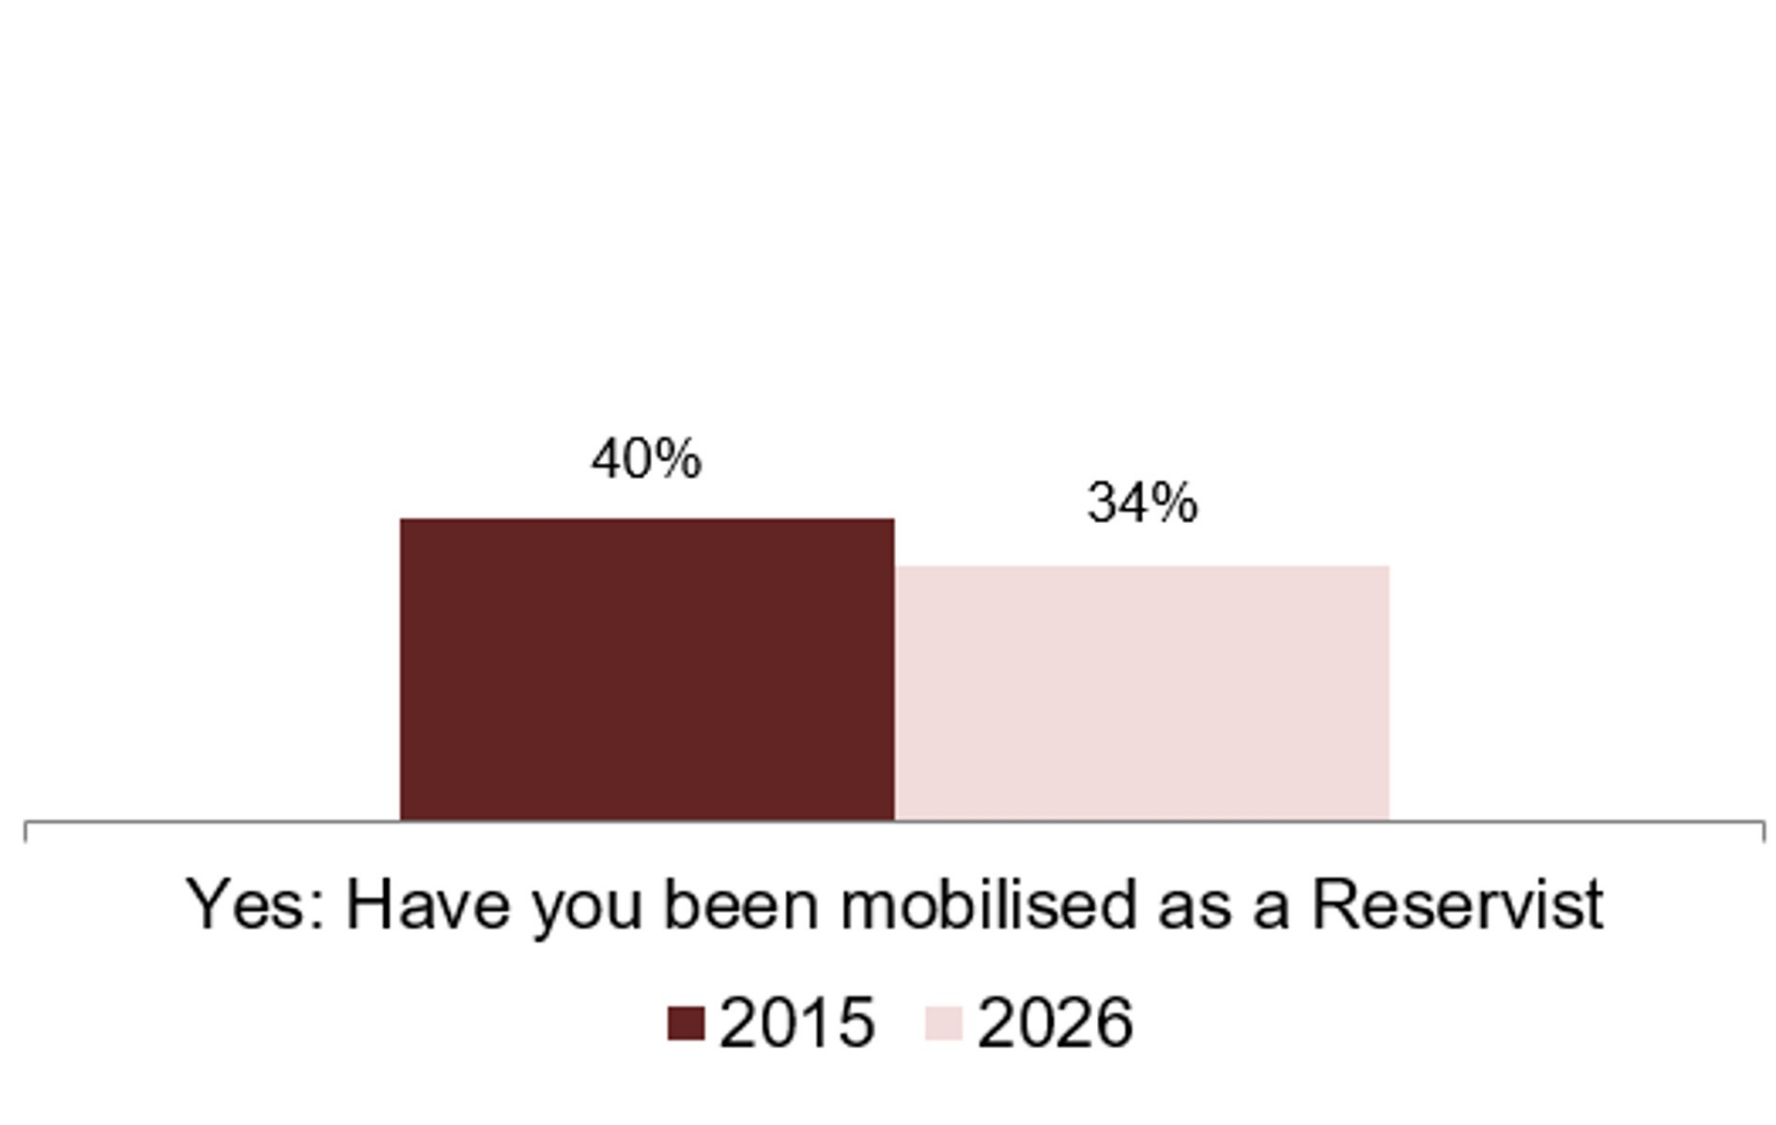
Figure 40 shows the percentage of Reserves who have been mobilised compared with the baseline year. This has decreased in 2026 to 34%, down from 40% in 2015.
Of those Volunteer Reserves that have been mobilised (34%), 62% are satisfied with the support they received from the Service when they were last mobilised.
Half (50%) of the Maritime Reserves are satisfied with the support they received from the Service when they were last mobilised, significantly lower than the other two Services (64% in the Army Reserve and 68% for the RAF Reserves respectively).
Under half (43%) of Volunteer Reserves are satisfied with the support their family received from the Service when they were last mobilised.
Figure 41: Satisfied: Satisfaction with support you received from the [Service] when last mobilised and with the support your family received from the [Service] when you were last mobilised broken down by Service
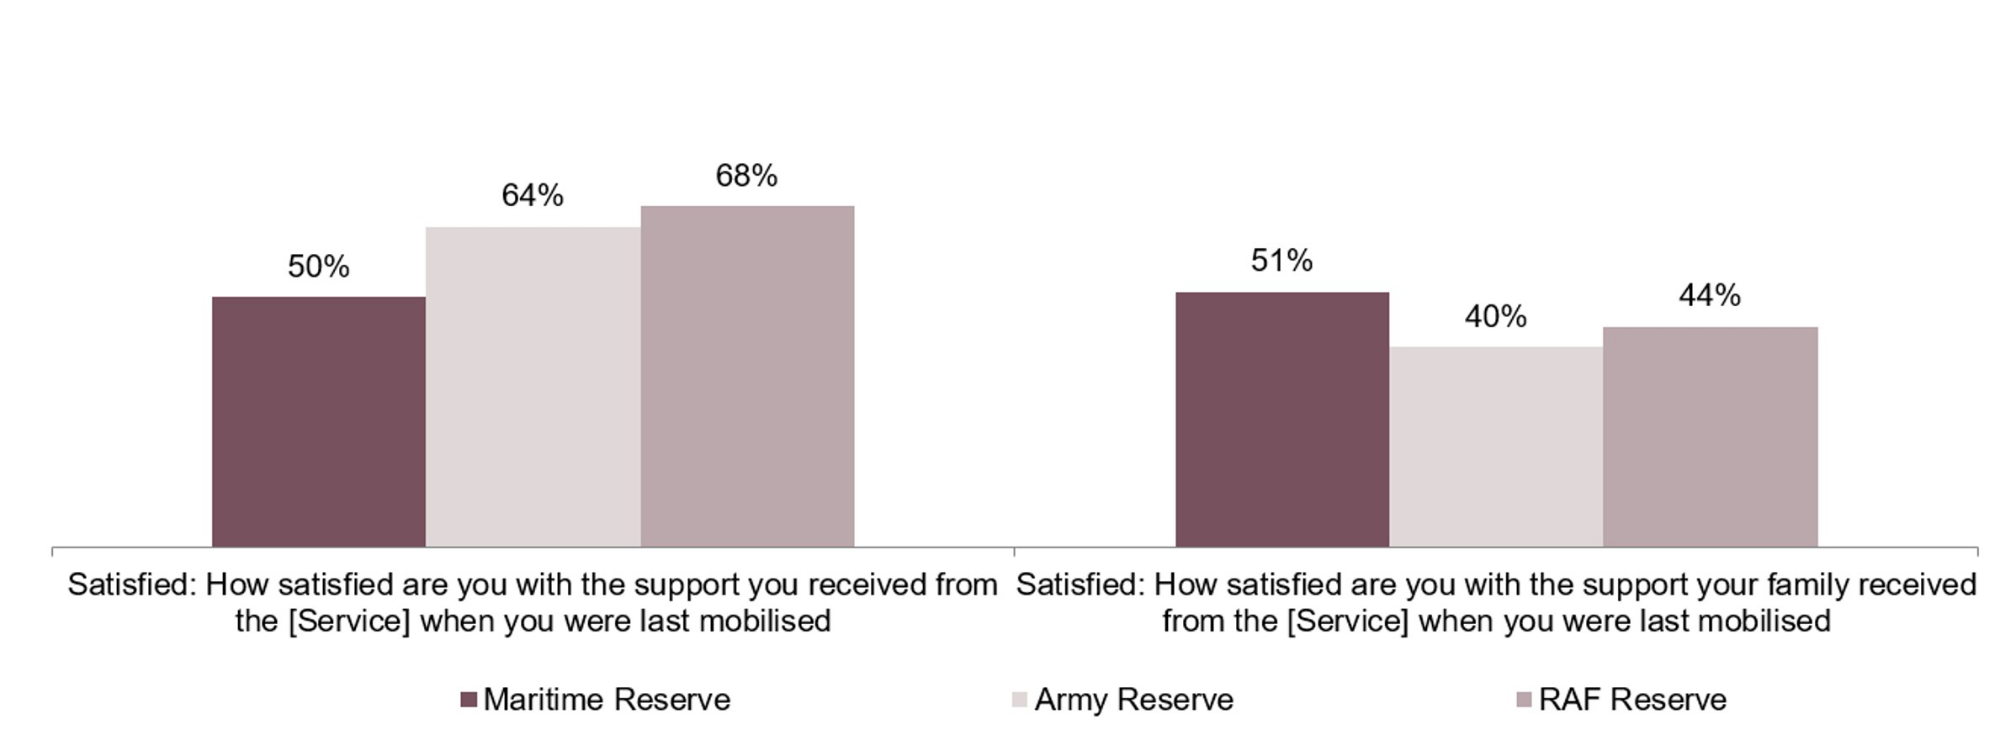
Figure 41 shows satisfaction with support received from the Service directly and for family when last mobilised. Satisfaction with the support their family received was 51% for the Maritime Reserve, 40% for the Army Reserve and 44% for the RAF Reserve.
18. Reasons for joining and staying in the Reserves
The top 5 reasons for joining the Volunteer Reserve and the top 5 reasons for staying in the Volunteer Reserve are almost identical and feature most of the same top 5 reasons as the 2025 survey.
The top 5 reasons for joining the Reserves are: to serve my country (67%), for the challenge (58%), personal development (57%), to make a difference/do something worthwhile (54%) and for the excitement and adventure (52%).
The top 5 reasons for staying in the Reserves are: to serve my country (59%), the people, friends and camaraderie (51%), personal development (50%), to make a difference/do something worthwhile (47%) and for the challenge (46%).
Taking a closer look at the reasons for joining, the data suggests that the reasons can be clustered in the following ways, where reasons within a cluster have a stronger association with each other than with reasons that appear in a different cluster:
-
To serve my country, and to make a difference/do something worthwhile.
-
For the challenge, personal development, and to do something different.
-
For the excitement and adventure, to travel and experience new places, and to go on exercise or be deployed.
-
For fitness and to do something active, and the courses/skills training on offer.
-
To meet like minded people and make new friends, and the experience of Service life.
-
Reserve pay or bounty, for the type of work, former Regular and wanted to carry on serving.
-
Career opportunities in the [Service] Reserves, to develop my civilian career, interested in joining the Regulars in the future, recommended by friends, family or colleagues.
Figure 42: Main reasons for joining and staying in the [Service] Reserves
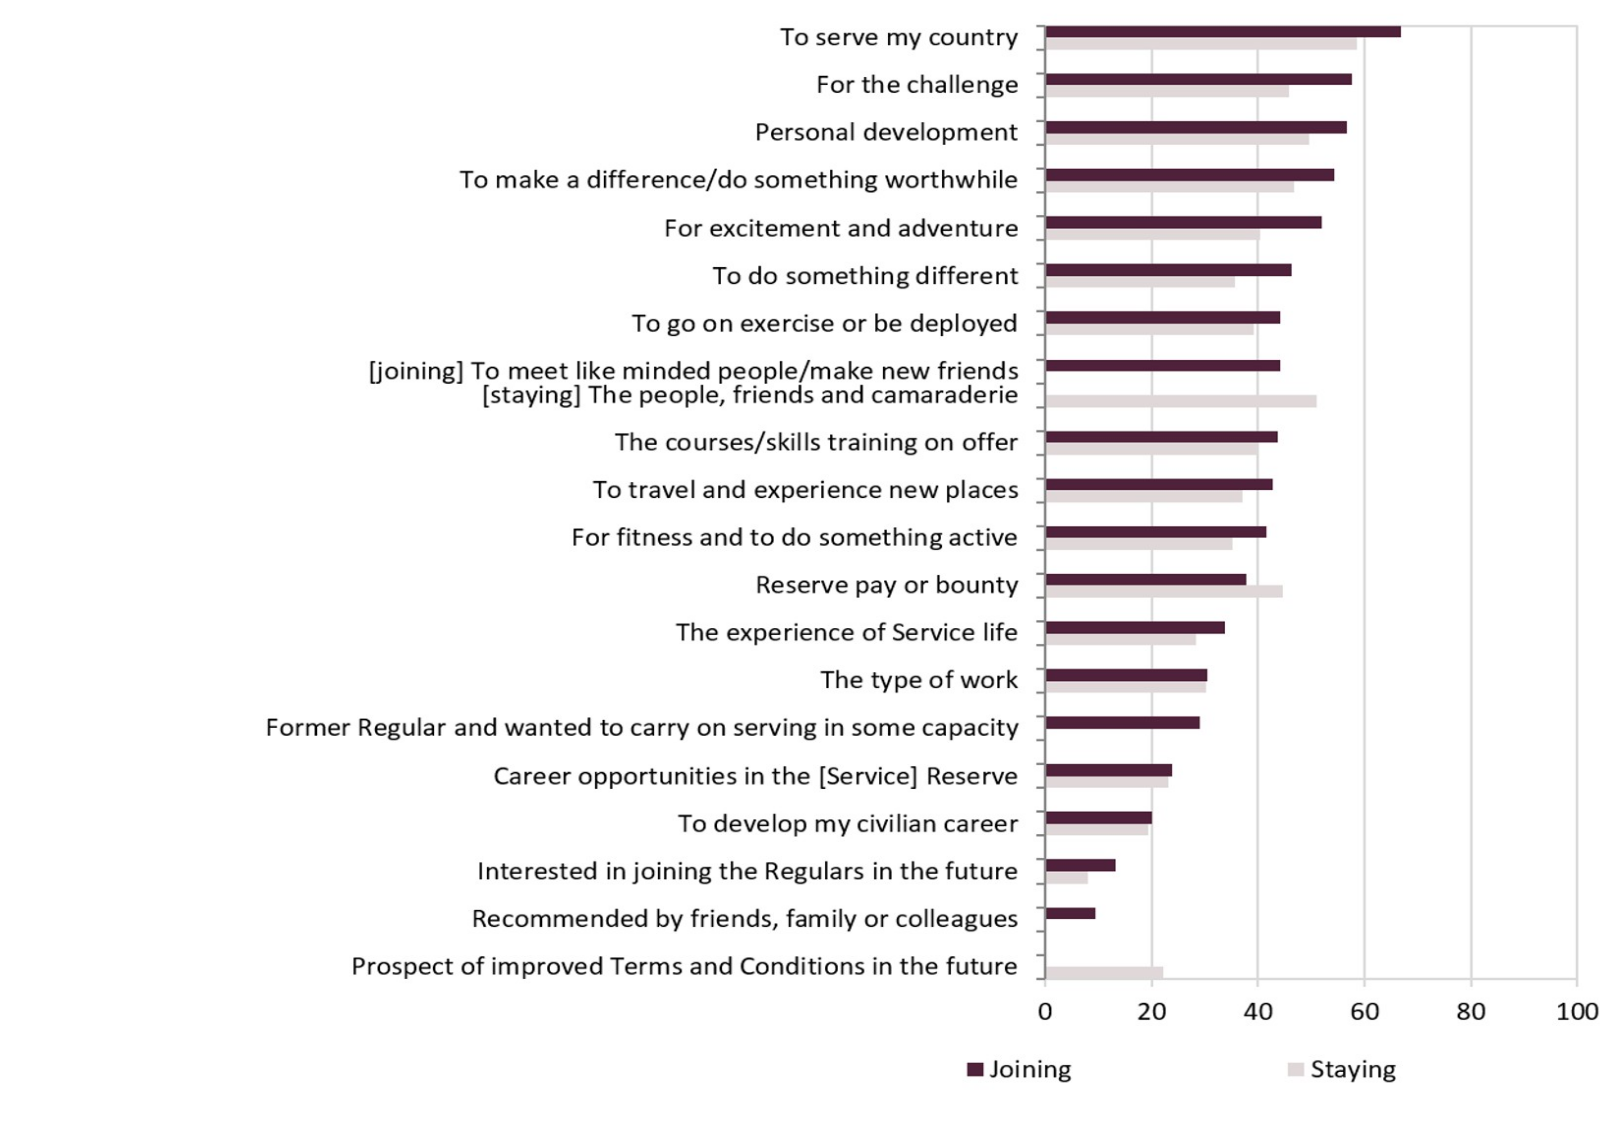
Figure 42 shows the main reasons for joining and staying in the Reserves. To serve my country scores top in the reasons for joining and staying. Personal development scores high in reasons for joining and staying.
19. Reasons for leaving the Reserves
Of the 5% of Reservists that intended to leave the Reserves within the next year, the most commonly selected reasons that played a part in their decision were:
- 43% reported poor management and leadership
- 38% reported they’re bored with the [Service] Reserve.
- 37% reported they don’t feel valued by the Service
- 37% reported a lack of promotion opportunities
Results are not presented by Service or by Officers and Other Ranks due to the small number of Reservists intending to leave the Reserve within the next year.
Figure 43: Reasons for leaving the [Service] Reserves
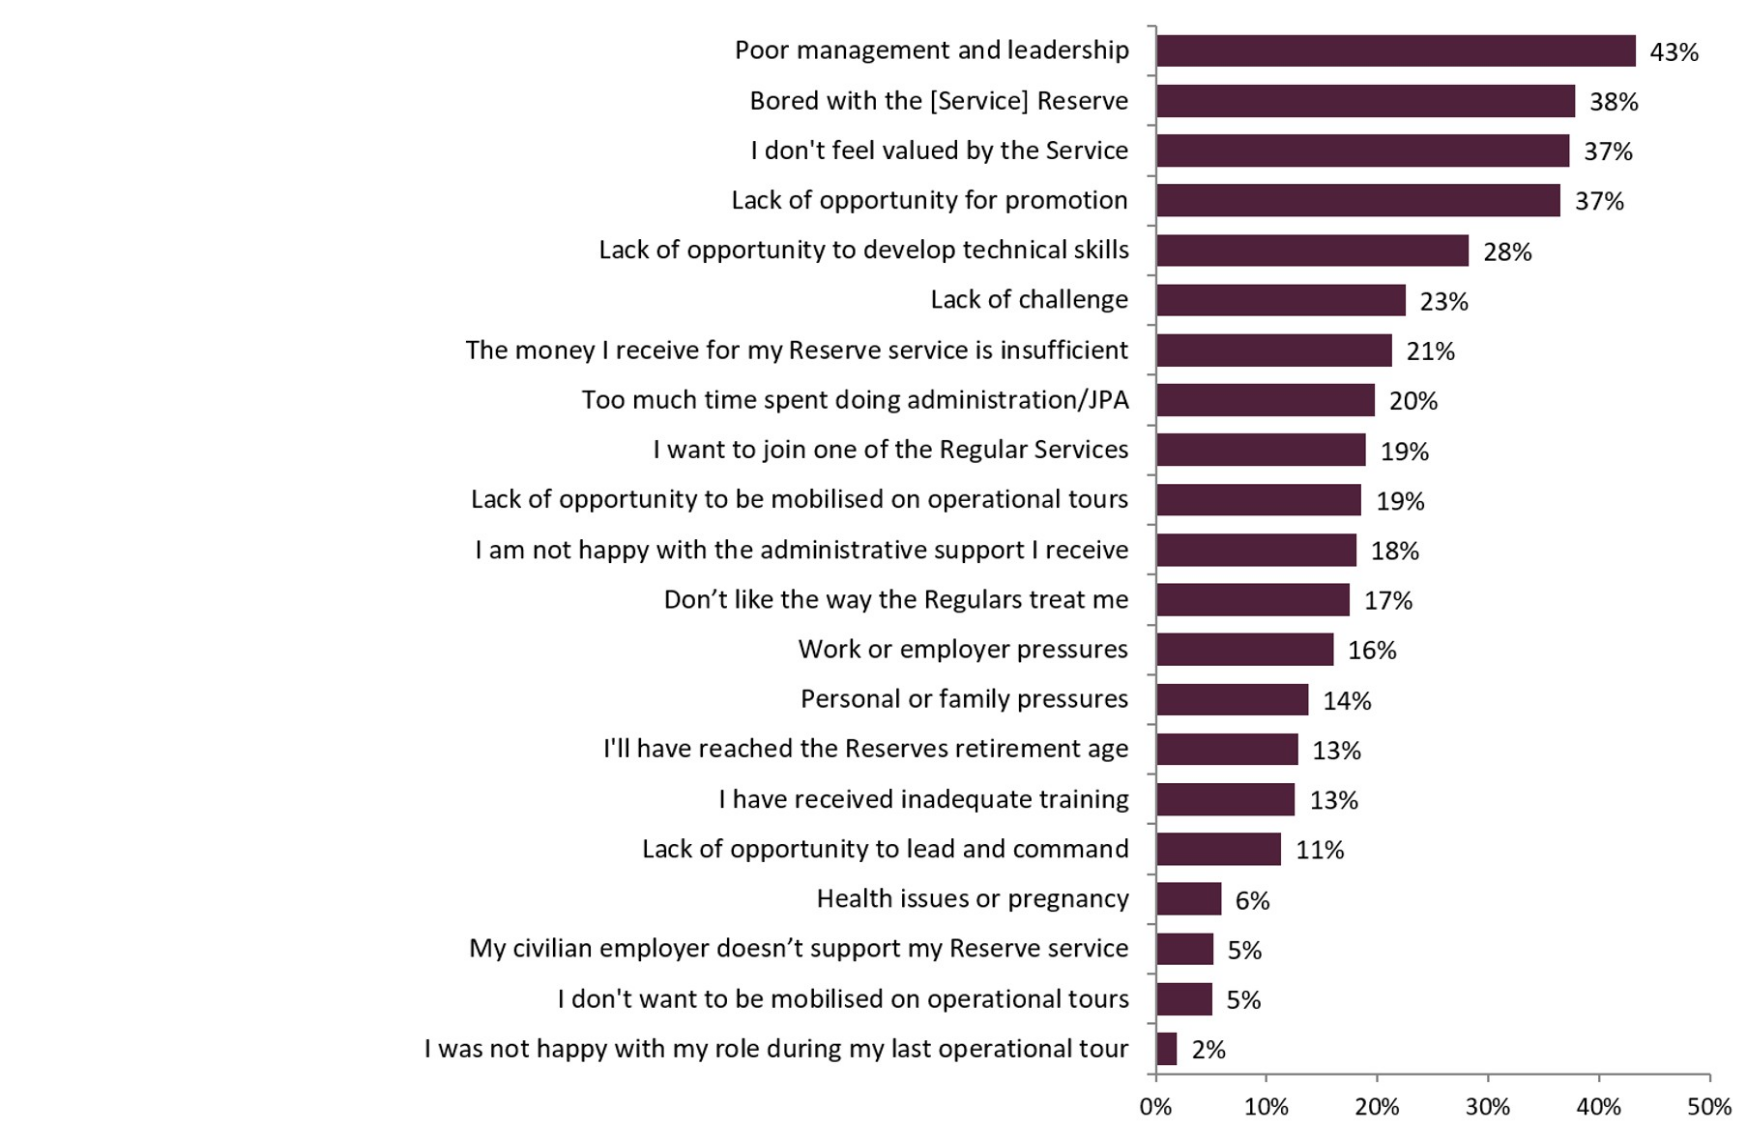
Figure 43 shows a bar chart explaining the main reasons given for leaving the Reserves. Poor management and leadership was the most given reason for leaving for the second year running, at 43% in 2026. Being bored with the [Service] Reserve was the second most selected reason this year at 38%, up from third place last year.
20. About you
This section provides some insight into the demographics of Reservists.
It should be noted that these statistics are survey estimates of the Volunteer Reserves based on weighted survey data.
-
RAF Reservists are more likely to be married/in a civil partnership (60%) compared to Maritime (51%) and Army (47%).
-
The RAF Reserves are less likely to be aged between 25 and 34 years old (14%) compared to the Maritime Reserves (29%) and the Army Reserves (28%). They are also more likely to be aged between 55 and 64 (29%) compared to the Maritime (15%) and Army (13%) Reserves respectively.
-
Around three in ten (31%) of Maritime Reservists have a higher university degree/doctorate/MBA or equivalent, more than the Army Reserves (23%) and at a similar level to the RAF Reserves (29%).
-
There has been no significant change in full time civilian employment over the last twelve months (61%), both overall and for Officers (50%) and Other Ranks (65%).
-
Other Ranks (65%) are more likely to be in full-time employment compared to Officers (50%).
-
More Maritime Reservists (73%) are in full-time employment compared to the Army Reserve (59%) and RAF Reserve (64%).
-
RAF Reservists (10%) are more likely to not be in civilian employment whilst not seeking employment compared to Maritime Reservists (6%) and Army Reservists (4%).
21. Well-being in the Reserves
The average well-being scores are out of ten and mean averages have been calculated for analysis.
Measuring well-being
The Office for National Statistics collects data on well-being for the UK population in their Annual Population Survey. Average scores and threshold groupings are released in their Personal Well-being in the UK report.
Well-being is measured on a scale of 0 (Not at all) to 10 (Completely).
For the anxiety question, ratings are grouped differently to reflect the fact that higher anxiety is associated with lower personal well-being.
Army Reserves’ average well-being ratings for life satisfaction (7.3) scored higher compared to Maritime and RAF Reserves (both 7.2). The RAF Reserves scored the highest levels of happiness felt yesterday at 7.3 compared to the Maritime and Army Reserves (both 7.2). Maritime Reserves reported the lowest average score (7.3) for feeling the things they do in life are worthwhile, with the Army and RAF Reserves scoring 7.4 respectively.
Figure 44: Wellbeing average scores by Service
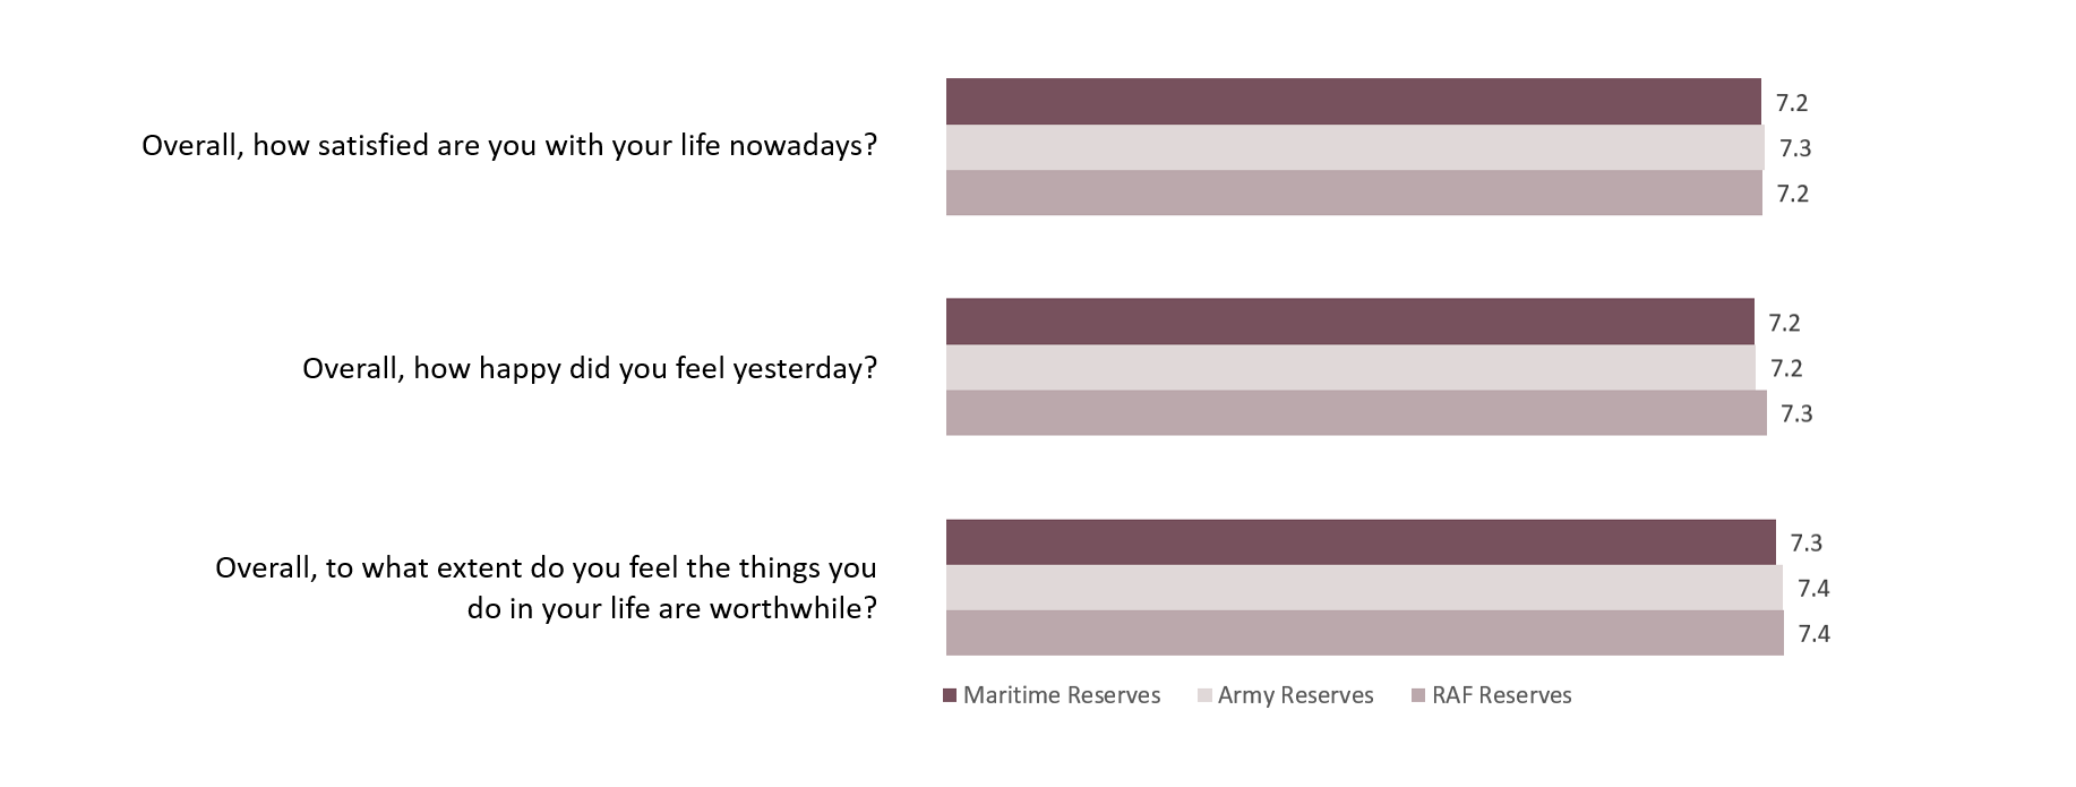
Figure 44 shows the average wellbeing scores for life satisfaction, happiness and feeling things in life are worthwhile by Service. For overall satisfaction with life, Army Reserves average 7.3 out of 10, compared to Maritime Reserves and RAF Reserves who both average 7.2 out of 10.
The following percentages and comparisons have been calculated by summing the “Very high” and “High”estimates and comparisons are not based on statistical tests.
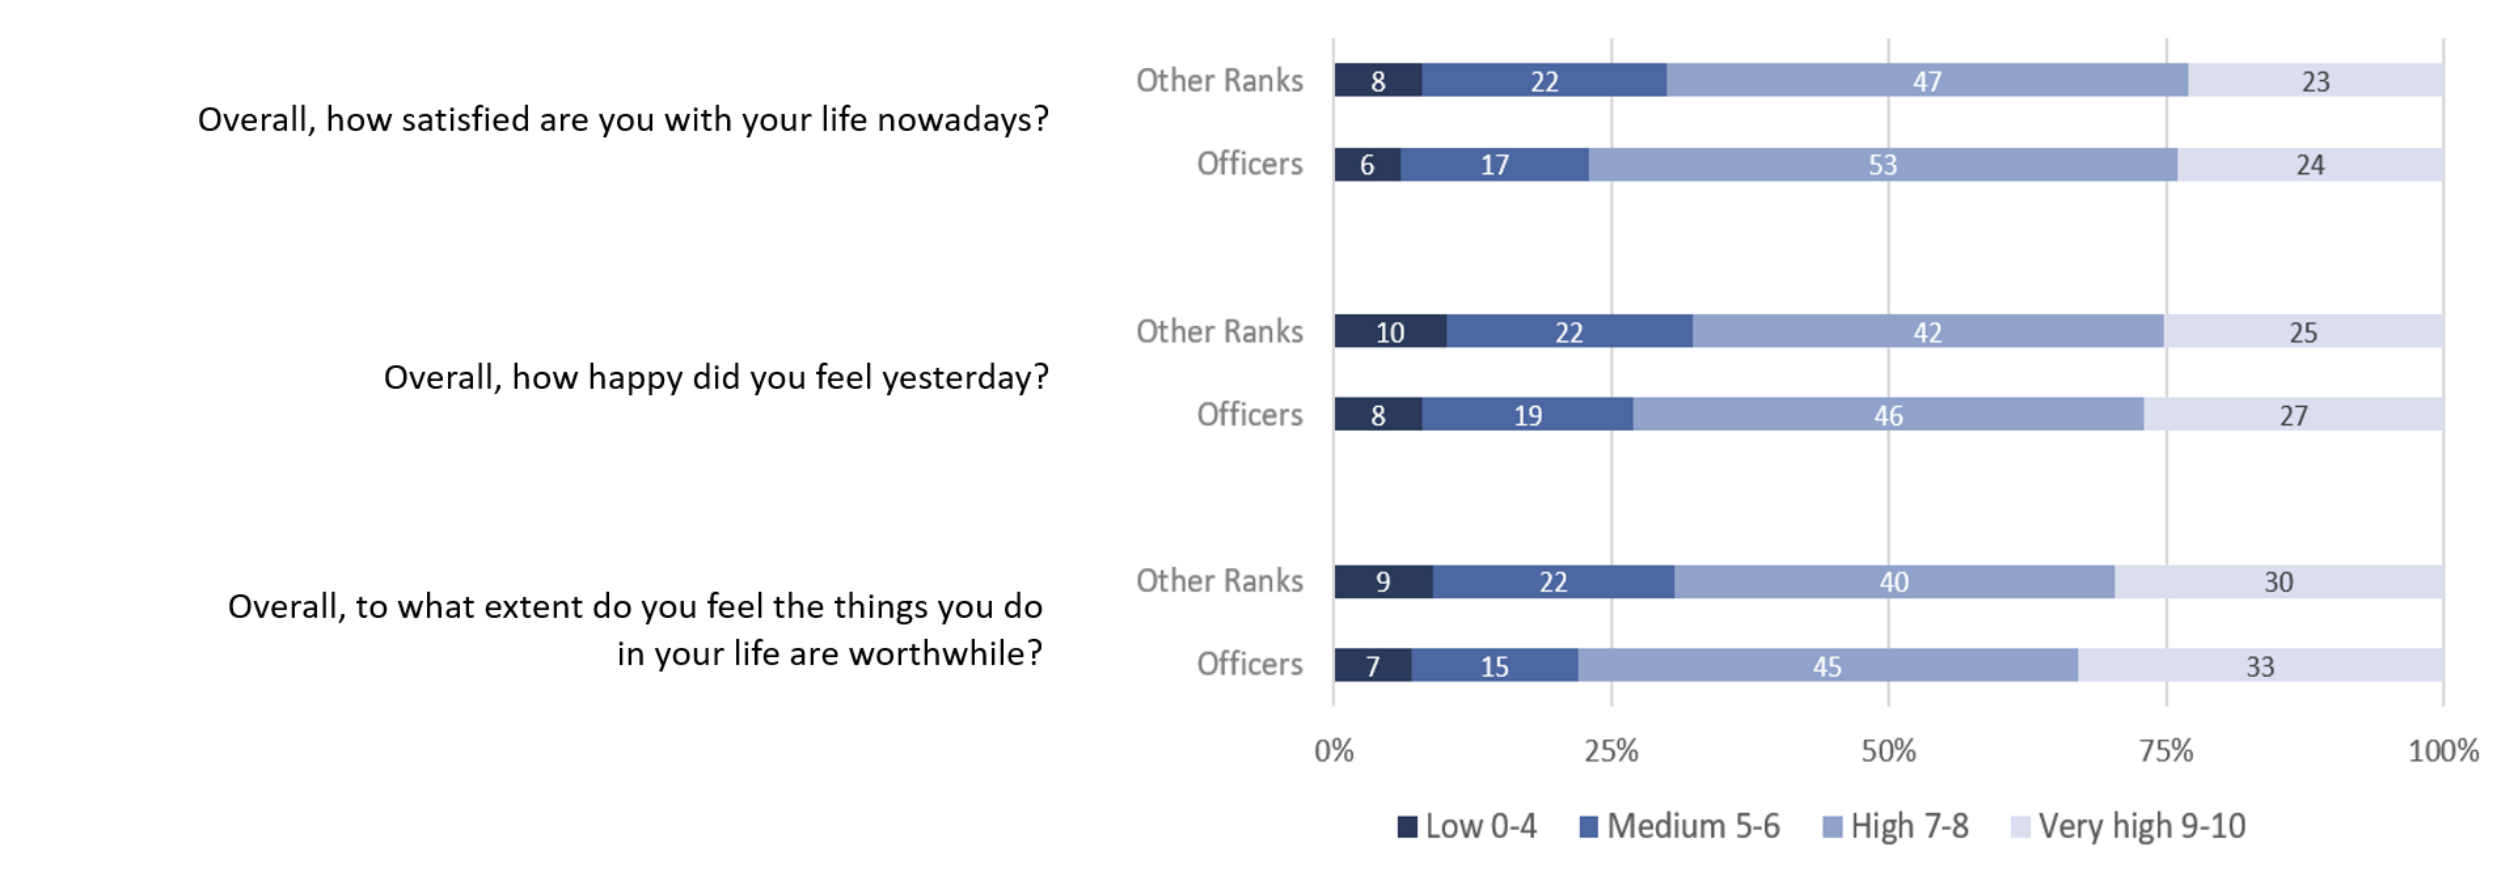
71% of Reservists reported high to very high levels of satisfaction with life nowadays, 69% reported high to very high levels of happiness felt yesterday and 72% felt that the things they do in their life are worthwhile.
Wellbeing scores were broadly similar across Services. Army Reservists reported higher levels of “Very High 9-10” (24%) when rating how satisfied they are with life nowadays compared to Maritime (20%) and RAF (22%) Reservists.
Officers have higher levels of happiness (73% for Officers, 67% for Other Ranks), life satisfaction (77% for Officers, 70% for Other Ranks) and feeling things in life are worthwhile (78% for Officers, 70% for Other Ranks) compared to Other Ranks. Officers having higher levels of well-being across the board can be seen in Figure 45 below.
Figure 45: Wellbeing scores grouped from low to very high by Rank
The following percentages and comparisons have been calculated by summing the “Very low” and “Low” estimates and comparisons are not based on statistical tests.
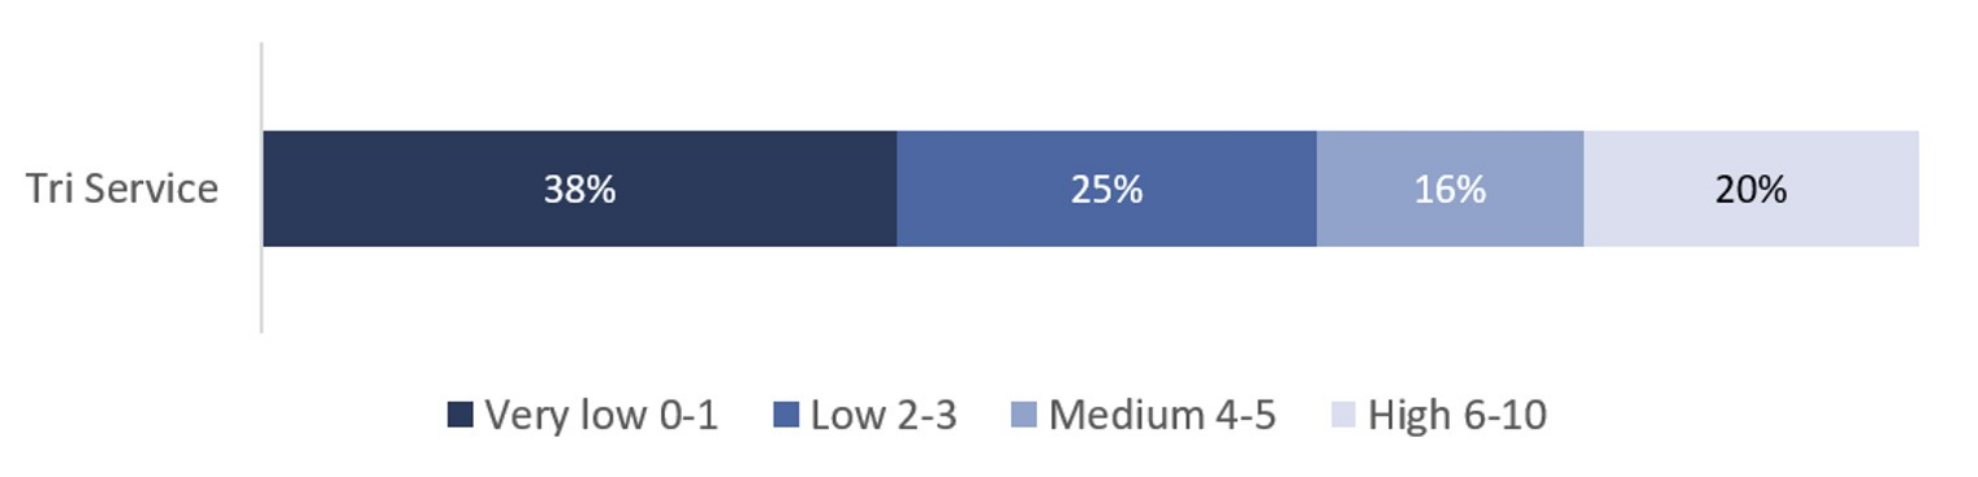
63% of personnel felt low levels of anxiety yesterday, with Officers (64% reporting low anxiety) having slightly higher levels of low anxiety compared to Other Ranks (63% reporting low anxiety). In Figure 46 below, a stacked bar chart shows the grouped wellbeing scores for levels of anxiety felt yesterday. 38% of personnel felt very low levels of anxiety yesterday.
Figure 46: Levels of anxiety scores grouped from very low to high by Rank
National comparison
National well-being results are not directly comparable to those of Reserve Service personnel due to differences in demographics i.e. the majority of Reserve Service personnel are male. Furthermore, national figures include a larger proportion of over 60s who generally score their well-being higher than younger people.
22. Managing Change
At a Tri-Service level, agreement that change is managed well at an immediate working team, unit and Service Reserve level has remained at similar levels to last year.
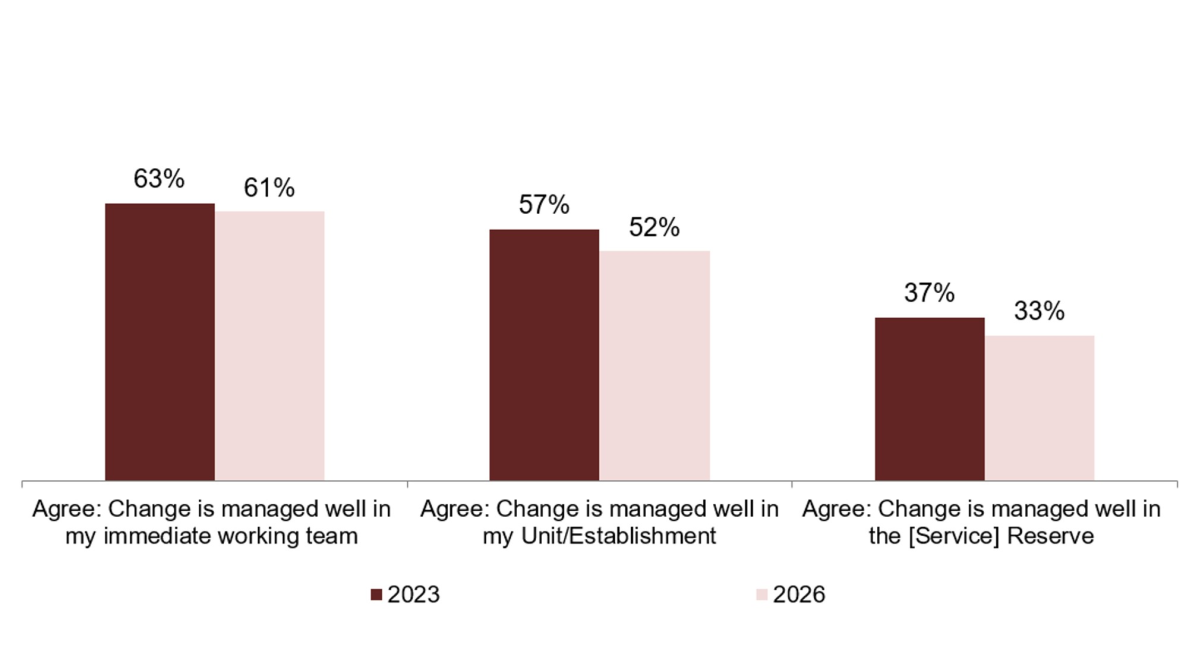
Around six in ten (61%) agree change is managed well in their immediate team, over half (52%) agree change is managed well in their unit/establishment and one in three (33%) agree change is managed well in their Service Reserve.
Figure 47 below compares satisfaction with change management at a team, unit and Service Reserve level against 2023 baseline levels. Agreement that change is managed well at the unit level has decreased since 2023, whilst at a team and Service level, agreement has remained similar.
Figure 47: Agree: Change is managed well in my immediate working team, Unit/Establishment and the [Service] Reserve compared against the baseline year
23. Methodology
1. Target population
The target population is all Volunteer Reservists excluding Non-Regular Permanent Staff (NRPS), Special Forces and those deployed at the time the surveys were administered.
2. The survey
Data collection took place between January 2026 and April 2026.
For the Maritime Reserve and RAF Reserve a census approach was used. After exclusions, 2,514 questionnaires went out to Maritime Volunteer Reserves and 2,777 questionnaires went out to RAF Volunteer Reserves.
Maritime Reservists were able to complete an online self-completion questionnaire, via generic web link distributed to their Defence Gateway addresses from their Unit. Links were also posted on all Units Defence Gateway pages which can be accessed by unit ships company.
Army Reservists were directed to complete the survey solely through an online questionnaire.
The Army sample excluded Special Forces, Mobilised, Unposted List, Army Reserves Reinforcement Group and anyone who had not received pay in the preceding 6-month period.
The Army sample was designed to provide sufficient responses to yield estimates with a margin of error of plus or minus 3% by four rank groups: Officers - Major and above; Officers - Captain and below; Soldiers – Sergeant and above; Soldiers – Corporal and below.
RAF Reservists were able to complete an online self-completion questionnaire.
3. The sample and respondents
The ResCAS 2026 sample consisted of 18,953 Volunteer Reservists. 4,587 responses were used in the ResCAS 2026 analysis, giving an overall response rate of 24%, down nine percentage points since 2020 (2021 was down seven percentage points from 2020). The table below contains information on the number of questionnaires issued and received along with corresponding response rates.
| Volunteer Reserve Service | Officer/Other Rank | Sample size | Respondents (No of useable returns) | 2026 Response rate |
|---|---|---|---|---|
| Maritime | Officer | 973 | 383 | 39% |
| Maritime | Other Rank | 1,541 | 439 | 28% |
| Maritime | Total | 2,514 | 822 | 33% |
| Army | Officer | 3,220 | 1,201 | 37% |
| Army | Other Rank | 10,442 | 2,095 | 20% |
| Army | Total | 13,662 | 3,296 | 24% |
| RAF (RAUXAF) | Officer | 686 | 103 | 15% |
| RAF (RAUXAF) | Other Rank | 2,091 | 366 | 18% |
| RAF (RAUXAF) | Total | 2,777 | 469 | 17% |
| Tri-Service | Officer | 4,879 | 1,687 | 35% |
| Tri-Service | Other Rank | 14,074 | 2,900 | 21% |
| Tri-Service | Total | 18,953 | 4,587 | 24% |
Note that percentages have been rounded to the nearest whole % for ease of interpretation.
The counts for the RAF Volunteer Reserve responses are determined by the question “Are you…?”, where the former of the two response options (“RAF Volunteer Reservist” and “RAF Regular Reservist”) is used for this calculation. Based on these options respondents are allocated to either response group, with those serving on a RAuxAF Squadron, Unit, or elsewhere in the RAF/Defence being allocated to “RAF Volunteer Reserve” (RAFVR) and those serving on a fixed-term Reserve contract being allocated to “RAF Regular Reserve” (RAFR, FTRS, ADC, VeRR, SR).
The calculation of RAF Volunteer Reserve response rates is based on the population figures of the Royal Auxiliary Air Force (RAuxAF) at the closest available time to the sampling date. This population encompasses FTRS and ADC personnel without prior service history. This may result in a slight misalignment between Volunteer Reserve response counts and the corresponding population figures used in the response rates calculation.
4. Weighting methodology and non-response
Due to the sample design and the differences in prevalence of non-response between the Service and rank strata, the distribution of characteristics amongst the ResCAS respondents did not reflect the distribution in the whole Volunteer Reserve population. Response rates tend to vary by rank, therefore responses are weighted by rank in order to correct for the bias caused by over or under-representation.
The weights were calculated simply by:
- Calculating the population size within weighted class (p)
- Dividing by the number of responses within weighted class (r)
Weighting in this way assumes missing data are missing at random (MAR) only within weighting classes. This means we assume that within a single weighting class the views of non-respondents do not differ (on average) to the views of respondents.
| Weighting Class | Weighting Applied |
|---|---|
| RMR Officer | 3.48 |
| RMR Ratings/ORs | 4.47 |
| RNR Officer | 3.17 |
| RNR Ratings/ORs | 4.50 |
| Weighting Class | Weighting Applied |
|---|---|
| Army Col and above - OF5 and above | 2.48 |
| Army Major / Lt Col - OF3/OF4 | 3.83 |
| Army LCpl / Cpl - OR3/OR4 | 7.83 |
| Army Capt - OF2 | 5.19 |
| Army Officer Cadet/ Untrained 2Lt (not completed Ph2 training)/ Trained 2Lt (completed Ph2 training)/ Lt - OF(D)/ OF1 | 10.23 |
| Army WO2 / WO1 - OR8/OR9 | 3.70 |
| Army Sgt / SSgt - OR6/OR7 | 6.78 |
| Army Trained Private soldier (completed Ph2 training) - OR1/OR2 | 17.66 |
| Army Untrained Private (not completed Ph2 training) - OR1/OR2 | 102.28 |
| Weighting Class | Weighting Applied |
|---|---|
| RAF Volunteer Reserve Wg Cdr or above - OF4+ | 12.61 |
| RAF Volunteer Reserve Sqn Ldr - OF3 | 5.79 |
| RAF Volunteer Reserve Flt Lt - OF2 | 6.44 |
| RAF Volunteer Reserve Officer Cadet/FG Off/Plt Off - OF(D)/OF1 | 7.33 |
| RAF Volunteer Reserve WO or MACR - OR9 | 8.81 |
| RAF Volunteer Reserve FS/ChfTech - OR7 | 5.21 |
| RAF Volunteer Reserve Sgt - OR6 | 6.61 |
| RAF Volunteer Reserve Recruit/AC/LAC/SAC/Jnr Tech/Cpl - OR1/OR2/OR3/OR4 | 6.12 |
Note: Weights have been rounded in the tables above to 2 decimal places. Non-rounded weights were applied during analysis. The rank OR-8 does not exist in the RAF and there is no equivalent OR-5 rank in the UK AF.
5. Analysis and statistical tests
Attitudinal questions in the questionnaires have generally been regrouped to assist in analysing results and to aid interpretation. For example, questions asked at a 5-point level (e.g. Strongly agree – Agree – Neither Agree nor Disagree – Disagree – Strongly Disagree) have been regrouped to a 3-point level (e.g. (Agree – Neutral – Disagree).
Missing values, where respondents have not provided a response/valid response, have not been included in the analysis. In addition, some questions are filtered to exclude invalid responses. As a result the unweighted counts (or ‘n’) will vary from question to question and these are shown within the reference tables published alongside this report on the ResCAS webpage (see 6. Format of the reference tables below for a link to the tables).
Unless otherwise specified, “Don’t know” and “Not applicable” responses are ignored and percentages are based only on the numbers of respondents who chose the remaining item response options.
Where applicable, Z-tests at a 1% alpha level were used to test whether observed estimates were significantly different to estimates from previous surveys. A statistically significant difference means that there is enough evidence that the change observed is unlikely to be due to chance variation (less than a 1% probability that the difference is the result of chance alone).
If those Volunteer Reservists that did not respond to the survey would have had different responses to those that did then the survey results will be biased.
6. Format of the reference tables (published separately to the report can be found on the ResCAS webpage)
Each reference table refers to a question asked in the survey and includes estimates of the proportion of the population by category as well as margins of error associated with those estimates.
Tables are arranged generally in the order in which they were asked in the questionnaires, which is not the same as the order of the sections in the Main Report.
An index is available within the Excel tables. Each table is broken down by Service and also by Rank Group with the Total column referring to the Officers and Other Ranks results combined.
| Section | Table Numbers |
|---|---|
| 01 Life in the Reserves | B1.1 - B1.11 |
| 01b Your Current Role | B1b.1 - B1b.3 |
| 02a Reasons for Joining the Reserves | B2a.1 - B2a.19 |
| 02b Reasons for Staying in the Reserves | B2b.1 - B2b.18 |
| 02c Reasons for Leaving the Reserves | B2c.1 - B2c.21 |
| 03 Pay, Allowances and Admin Support | B3.1 - B3.4 |
| 04 Kit and Equipment | B4.1 - B4.2 |
| 05 Mobilisation | B5.1 - B5.4 |
| 06 Training | B6.1 - B6.4 |
| 07 Career Progression | B7.1 - B7.3 |
| 08 Perception of Reserves | B8.1 - B8.2 |
| 09 Family Support | B9.1 - B9.3 |
| 10 Your Civilian Employment | B10.1 - B10.14 |
| 11a Fairness at Work ; Rank | B11a.1 - B11a.12 |
| 11b Fairness at Work ; Ethnicity | B11b.1 - B11b.2 |
| 11c Fairness at Work ; Gender | B11c.1 - B11c.2 |
| 12 About You | B12.1 - B12.15 |
| 13 Well-being | B13.1 - B13.4a |
| 14 Managing Change | B14.1 - B14.3 |
24. Glossary
Additional Duties Commitment Reservists who undertake part-time work with the Armed Forces with a minimum commitment of 13 weeks - at least one day a week throughout this period.
Adventurous Training Training undertaken in an outdoor environment intended to develop skills and abilities required in operational deployment.
AFCAS Armed Forces Continuous Attitude Survey.
Air Training Corps The Air Training Corps is a British youth organisation sponsored by the Ministry of Defence and the Royal Air Force.
Annual Bounty A tax-free lump sum paid on completion of an annual training commitment.
Army Cadet Force The Army Cadet Force is a national youth organisation sponsored by the United Kingdom’s Ministry of Defence and the British Army.
Army Personnel Centre The APC is the administrative centre for Army personnel records, formed in December 1996, and which formally ceased to be a Defence Agency as at 1 April 2004.
Combined Cadet Force The Combined Cadet Force is a Ministry of Defence sponsored youth organisation in the UK. Its aim is to “provide a disciplined organisation in a school so that pupils may develop powers of leadership by means of training to promote the qualities of responsibility, self-reliance, resourcefulness, endurance and perseverance”.
FAMCAS Families Continuous Attitude Survey.
Full-Time Reserve Service (FTRS) Those on FTRS fill Service posts on a full-time basis while being a member of one of the reserve services, either as an ex-regular or as a volunteer. In the case of the Army and the Naval Service, these will be posts that would ordinarily have been filled by regular service personnel. In the case of the RAF, FTRS personnel also fill posts designated solely for them.
JPA Joint Personnel Administration is the system used by the Armed Forces to deal with matters of pay, leave and other personal administrative tasks.
Maritime Reserves A term that covers the combined Royal Navy Reserve (RNR) and Royal Marine Reserve (RMR).
Missing at Random (MAR) An assumption that non-response within each weighting class is random, such that the views of respondents are representative of the views of non-respondents within that class.
Missing Values Refers to the situation where a respondent has not submitted an answer or a valid answer to a question.
MOD Ministry of Defence.
n Letter that represents ‘Unweighted Count’. This is the actual number of Volunteer Reservists that provided a valid response to a question in the survey.
N/A Not applicable.
NATO North Atlantic Treaty Organisation.
Neutral In Key Results and Tables, refers to the situation where there is neither agreement or disagreement, satisfaction or dissatisfaction, positions taken in response to a question.
Non-response Refers either to a person who although sampled and sent a questionnaire did not reply or to a respondent who did not reply to a question.
OF Officer NATO rank designation ranking from OF1 (lowest) to ‘OF10’ (highest).
Officer(s) All Officers of NATO ranks OF1 to OF10.
OR Other Ranks NATO rank designation ranking from OR1 (lowest) to OR9 (highest).
Other Rank(s) Other Ranks are members of the Royal Marines, Army and Royal Air Force who are not Officers. The equivalent group in the Royal Navy is known as “Ratings”.
RAF Royal Air Force.
Regular Reserve Former members of the UK regular forces who have a liability for service with the Reserve forces. Includes the Royal Fleet Reserve, Army Reserve and Royal Air Force Reserve as well as other individuals liable to recall.
Reserves Continuous Attitude Survey (ResCAS) Refers to the questions asked on a Tri-Service basis in each of the single-Services Reserves Continuous Attitude Surveys.
Royal Marines Reserve (RMR) Approximately 10% of the RMR are working with the Regular Corps on long term attachments, mostly FTRS. The remainder are Volunteer Reserves.
Royal Naval Reserve (RNR) Formed in 1859 it was merged with the Royal Navy Volunteer Reserve (RNVR) in 1958, and also incorporates the former Women’s Royal Navy Volunteer Reserve (WRNVR) and QARNNS (Reserve). See Volunteer Reserves.
Sea Cadet Corps The Sea Cadet Corps is a national youth organisation sponsored by the United Kingdom’s Ministry of Defence and the Royal Navy.
Service(s) Royal Navy, Royal Marines, Army and RAF.
Standard Error A measure derived using weighting factors from the sample proportion and unweighted count in a sampling distribution and used as a benchmark in order to ascertain a range of values within which the true population proportion could lie.
Statistically significant Refers to the result of a statistical test in which there is evidence of a change in proportions between years, ranks, or Services.
Statistical tests Refers to those tests which are carried out to see if any evidence exists for a change in response proportions from one year to another.
Trained Trained Strength comprises military personnel who have completed Phase 1 and 2 training. * Phase 1 Training includes all new entry training to provide basic military skills. * Phase 2 Training includes initial individual specialisation, sub-specialisation and technical training following Phase 1 training prior to joining the trained strength.
Tri-Service (Reserve) Refers collectively to the Maritime Reserve, Army Reserve and RAF Reserve.
UK United Kingdom.
Unit A sub-organisation of the Service in which personnel are employed.
Untrained see Trained above.
Unweighted Count Refers to the actual number of Volunteer Reservists that provided a valid response to a question in the survey.
Volunteer Reserves Volunteer Reserves are civilian volunteers who undertake to give a certain amount of their time to train in support of the Regular Forces. They include the Royal Naval Reserve, the Royal Marines Reserve, the Army Reserve and the Royal Auxiliary Air Force but do not include Royal Fleet Auxiliary Service (RFA). Some Volunteer Reservists undertake (paid) Full-Time Reserve Service.
Weighting (factors) Refers to factors that are applied to the respondent data set by Service and rank group in order to make respondent Service rank groups representative of their population equivalents.
Weighting class Refers to those members of a specific rank group to whom a weighting factor is applied.
Z-test Statistical test based on a standardised distribution which allows comparison between years for populations of different sizes.
25. Further Information
Disclosure Control and Rounding
Tables with low unweighted counts and sensitive breakdowns have had their unweighted counts rounded up to the nearest 5. Where this rounding policy is applied, sub-totals and totals have been rounded separately so may not equal the sum of their parts.
Revisions
We have made the following corrections to historical data which were due to data processing errors.
A lookup issue was identified that affected the mapping of RAF question codes to Tri Service question codes for a small number of questions. The affected tables are:
-
B6.3 and B6.4 between the years 2022 and 2025.
-
B8.1 and B8.2 between the years 2023 and 2025.
These revisions have resulted in minor revisions to Tri Service estimates, with no change to the overall interpretation of the findings at the Tri-Service level. Larger revisions were observed for some RAF estimates, particularly for RAF Officers, although the magnitude of the revisions varies by question.
All identified errors have been corrected. Revised tables are marked with an ‘r’ and include footnotes explaining the nature of the revisions. We have conducted a thorough review of our processes to minimise the risk of similar errors occurring in future publications.
These revisions affect Section 6 (Training) and Section 8 (Perception of Reserves).
Contact Us
The Analysis Directorate welcomes feedback on our statistical products. If you have any comments or questions about this publication or about our statistics in general, you can contact us as follows:
Email: Analysis-Publications@mod.gov.uk
If you require information which is not available within this or other available publications, you may wish to submit a Request for Information under the Freedom of Information Act 2000 to the Ministry of Defence.
If you wish to correspond by mail, our postal address is:
Analysis Surveys, Analysis Directorate
Ministry of Defence, Main Building
Floor 3 Zone M
Whitehall
London
SW1A 2HB