Count of Traveller caravans, January 2022: England
Published 15 June 2022
Applies to England

© Crown copyright 2022
This publication is licensed under the terms of the Open Government Licence v3.0 except where otherwise stated. To view this licence, visit nationalarchives.gov.uk/doc/open-government-licence/version/3 or write to the Information Policy Team, The National Archives, Kew, London TW9 4DU, or email: psi@nationalarchives.gov.uk.
Where we have identified any third party copyright information you will need to obtain permission from the copyright holders concerned.
This publication is available at https://www.gov.uk/government/statistics/traveller-caravan-count-january-2022/count-of-traveller-caravans-january-2022-england
All comparisons refer to year-on-year changes to reflect the overall trend rather than seasonal fluctuations. For this statistical release (January 2022), comparisons have been made against January 2020 due to the January 2021 count being cancelled.
It should be noted that comparisons over this 2 year period are likely to see a larger change than previous releases which make comparisons over a 1 year period. Additionally, whilst national lockdown restrictions had been lifted before the January 2022 count took place, COVID-19 is likely to have impacted traveller movements.
1. In this release:
- Overall, the number of traveller caravans has increased since the last count in January 2020, in line with the long term trend observed over previous counts. The total number of traveller caravans in England on the count date in January 2022 was 24,371, which is 658 (3%) more than the 23,713 reported in the January 2020 count.
- The growth in number of caravans since the January 2020 count has been led mainly by a rise in the number of private caravans (with permanent planning permission), resulting in an increase in the total authorised caravans despite a reported decrease in socially rented caravans.
- The number of caravans on authorised privately funded sites was 14,786. This was 803 more (6%) than the 13,983 recorded in the January 2020 count.
- The number of caravans on authorised socially rented sites was 6,693. This is a decrease of 177 (3%) since the figures reported in the January 2020 count, which recorded 6,870.
- Overall, the January 2022 count indicated that 88% of traveller caravans in England were on authorised land and that 12% were on unauthorised land.
- The number of caravans reported on unauthorised developments on land owned by travellers was 2,377. This is an increase of 267 (13%) compared to the January 2020 count figure of 2,110.
- The number of caravans reported on unauthorised encampments on land not owned by travellers on the count date was 515. This was 235 caravans fewer (31%) than the 750 caravans reported in the January 2020 count.
- Overall, the number of unauthorised caravans reported in the January 2022 count was slightly higher (an increase of 32 caravans) than the number reported in January 2020. The increase stems from a rise in caravans on sites on land owned by Travellers, counteracting a slight decrease in the number of unauthorised caravans on sites not owned by Travellers.
Release date: 15 June 2022
Date of next release: December 2022 (provisional)
Contact: Katherine Harris
Media enquiries: 0303 444 1209 NewsDesk@communities.gov.uk
2. Introduction
This statistical release presents official statistics on the count of traveller caravans in England. The count is carried out to provide local data on the number and seasonal movement of caravans and trends over time.
This publication is compiled from information submitted by local authorities in England. Local authorities carry out the count of caravans on traveller sites twice a year, in January and July, providing a snapshot of the number of caravans on the day of the count. Information is collected about caravans on authorised socially rented sites, authorised privately funded sites, unauthorised developments (sites on land owned by travellers for which planning permission has not been granted) and unauthorised encampments (sites on land not owned by travellers and which do not have planning permission).
The traveller caravan count covers data on the number of caravans and traveller sites in England; it does not cover the number of occupants residing in these caravans or caravan sites or the potential drivers for any observed change.
The count takes place twice a year to reflect winter residence and summer travelling trends. All comparisons refer to year-on-year changes in order that changes between counts reflect the overall trend rather than seasonal fluctuations. For this statistical release (January 2022), comparisons have been made against January 2020 due to the January 2021 count being cancelled. It should be noted that comparisons over this two year period are likely to see a larger change than previous releases which make comparisons over a one year period. Additionally, whilst national lockdown restrictions had been lifted before the January 2022 count took place, COVID-19 is likely to have impacted traveller movements.
The information in this release is based on data returned to the Department for Levelling Up, Housing and Communities by local authorities in England. Users should note that revisions may have been made to figures from previous counts in this release as a result of updated data being received. This release presents the most accurate data on the number of traveller caravans in England and the accompanying live tables should be used for historic comparisons.
Further information is given in 5 accompanying live tables.
Changes to this release
A review of recent counts suggested that the England total was being moderately underestimated through the exclusion of authorities who had not submitted data in recent years[footnote 1]. To ensure that we have the best national estimate the England level totals have been revised to include imputed figures for those authorities who have not provided data for the previous 3 or more counts[footnote 2]. The inclusion of such authorities results in a 3% increase in the England estimate for January 2020 for example. See the accompanying technical note for more detail.
3. Count of Traveller caravans
Local authorities carried out the January 2022 count on or around 20 January 2022. Aggregated totals by site type are presented in Table 1 below, together with comparative figures from the previous two January counts.
At the time of the January 2022 count, the total number of Traveller caravans in England was 24,371. Of these 6,693 (27%) were on socially rented sites; 14,786 (61%) were on privately funded sites; 2,377 (10%) were unauthorised developments on land owned by travellers; and 515 (2%) were unauthorised encampments on land not owned by travellers. This information is also illustrated in Figure 1 below and in accompanying Live Table 1.
Table 1: Number of Traveller Caravans by site type, England
| Jan-19 ᴿ | Jan-20 ᴿ | Jan-22 | % of total caravans (Jan 2022) | Change from Jan 2020 to Jan 2022 | % Change from Jan 2020 to Jan 2022 | |
|---|---|---|---|---|---|---|
| Caravans on Authorised sites (with planning permission) | 20,100 | 20,853 | 21,479 | 88% | 626 | 3% |
| Socially Rented Caravans | 6,739 | 6,870 | 6,693 | 27% | -177 | -3% |
| Private Caravans | 13,361 | 13,983 | 14,786 | 61% | 803 | 6% |
| Temporary Planning Permission | 529 | 458 | 455 | 2% | -3 | -1% |
| Permanent Planning Permission | 12,832 | 13,525 | 14,331 | 59% | 806 | 6% |
| Caravans on Unauthorised Sites (without planning permission) | 2,841 | 2,860 | 2,892 | 12% | 32 | 1% |
| Caravans on sites on Traveller’s own land | 2,052 | 2,110 | 2,377 | 10% | 267 | 13% |
| Tolerated | 926 | 958 | 1,085 | 4% | 127 | 13% |
| Not Tolerated | 1,126 | 1,152 | 1,292 | 5% | 140 | 12% |
| Caravans on sites not on Traveller’s own land | 789 | 750 | 515 | 2% | -235 | -31% |
| Tolerated | 255 | 284 | 188 | 1% | -96 | -33% |
| Not Tolerated | 534 | 466 | 327 | 1% | -139 | -30% |
| Overall Total | 22,941 | 23,713 | 24,371 | 100% | 658 | 3% |
Note that the January 2021 count was cancelled due to the COVID-19 pandemic.
ᴿ Revised: England level figures have been revised to include long-term non-responders (see technical note for more details).
The total number of Traveller caravans in England has risen from 18,746 in January 2012 to 24,371 in January 2022, an increase of 30%. The growth in number of caravans has been led mainly by a rise in the number of private caravans (with permanent planning permission), resulting in an increase in the total authorised caravans despite a decrease in socially rented caravans.
Figure 1 illustrates that the number of caravans on authorised private sites has increased by 63% over the same period, with 9,096 private caravans recorded in 2012 compared to a total of 14,786 in 2022. Figure 2 below shows that caravans on authorised private sites accounted for the largest proportion of the total number of caravans across England in January 2022 (61%). Caravans on unauthorised sites accounted for 12% of the total with caravans on authorised socially rented sites accounting for 27%. The underlying figures are included in accompanying Live Table 4.
Figure 1: Number of Traveller caravans reported in January count by site type over time, England

Figure 2: Proportion of Traveller caravans reported in January 2022 by site type, England

4. Geographic distribution
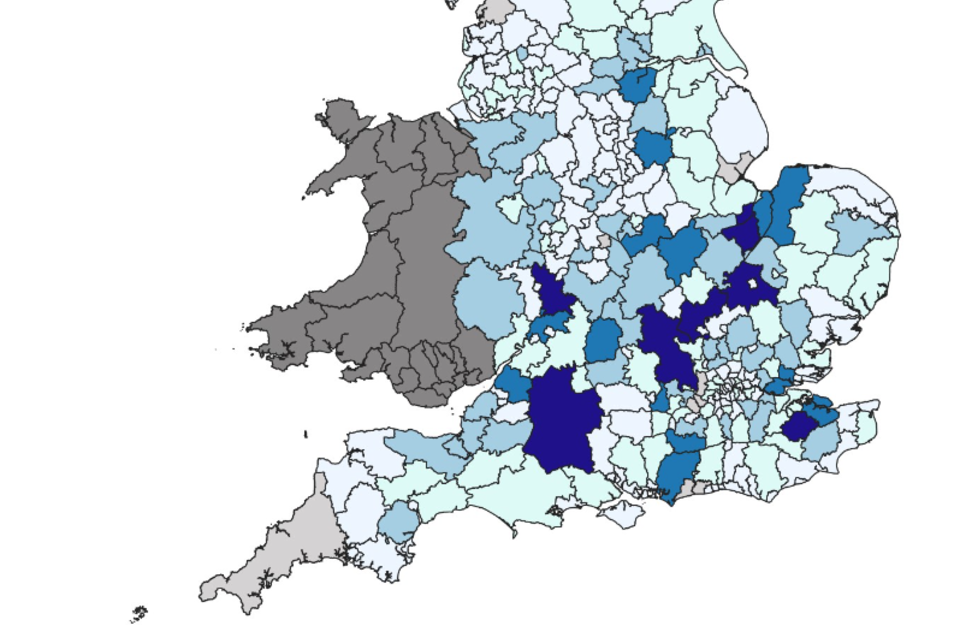
The geographic distribution of traveller caravans varies across England. Map 1 below shows the total number of caravans on authorised sites within each local authority boundary.
The data has been grouped into 5 categories for the purposes of mapping using the Jenks natural breaks classification method. This method splits the data into intervals based on the natural groupings observed within. The class breaks identified work to minimise the variance or difference between individual cases selected in each group whilst also maximising the variances between each group taken as a whole. Maps created using this method allow trends in the underlying data to be accurately represented, aiding interpretation and further analysis.
As indicated in the key, darker colours represent those local authorities that have reported a higher number of total caravans on authorised sites whereas lighter colours indicate local authorities that have reported lower numbers of caravans. Authorities who have not reported data for 3 or more consecutive counts are shaded light grey (such authorities are shown as ‘missing’ in the legend).
Map 1: Traveller caravans on authorised sites in England, January 2022
5. Historic data
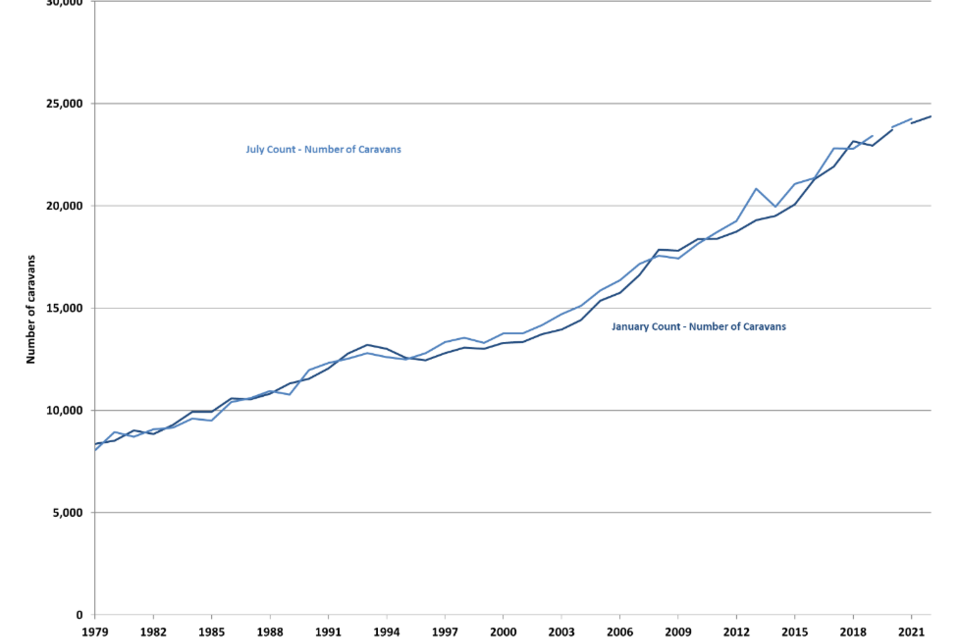
The traveller caravan count has taken place twice a year since January 1979, with the exception of collections cancelled in July 2020 and January 2021 due to the COVID-19 pandemic. Figure 3 below shows how the total number of traveller caravans in England has changed over this period across both summer (July) and winter (January) counts. National totals from each count of the main categories of authorised and unauthorised sites are presented in accompanying Live Table 4. The figures show an increase in the overall total from 8,358 caravans in January 1979 to 24,371 in January 2022.
Figure 3: Number of Traveller caravans from 1979 to 2022, England
6. Travelling Showpeople caravans
The January 2022 count also included a count of the caravans/moveable dwellings occupied by Travelling Showpeople in each local authority area in England. The results from previous years are published in Live Table 3 as ‘experimental statistics’. Further information about experimental statistics is available on the Office for National Statistics website.
The overall number of Travelling Showpeople caravans counted in January 2022 was 2,539, a decrease of 10% from 2,821 in January 2020. This remains lower than the 3,159 caravans counted in January 2015, the highest total count recorded. The total number of caravans on authorised and unauthorised sites from the most recent 8 counts are illustrated in Figure 4 below. For full disaggregated data on Travelling Showpeople caravans for the last 6 counts see accompanying Live Table 3[footnote 3].
Figure 4: Number of Travelling Showpeople caravans: January 2014 and January 2022

7. Accompanying tables and open data
Symbols used
*Imputed
.. No data supplied for at least the previous 3 counts
Tables
Accompanying tables are available to download alongside this release.
These are:
-
Table 1: Count of traveller caravans on authorised and unauthorised sites for the last 6 counts, nationally and by local authority area, based on local authority boundaries as at the time of the count(s).
-
Table 2: Location and size of traveller sites operated by local authorities and private registered providers in England
-
Table 3: Number of Travelling Showpeople caravans on authorised and unauthorised sites for the last 6 January counts nationally and by local authority area (updated as part of the January count)
-
Table 4: National totals for the main categories of authorised and unauthorised sites for all counts since January 1979
-
Table 5: Count of Traveller caravans: new affordable residential pitches constructed between July 2020 and July 2021 (updated as part of the July count)
See statistical releases and accompanying tables for previous caravan counts.
9. Technical notes
Please see the accompanying technical notes document for further details.
Information on Official Statistics is available via the UK Statistics Authority website.
Information about statistics at DLUHC is available via the Department’s website.
-
Previously, authorities who had not responded for the previous 3 counts had been assumed to be zero in the published tables, however the exclusion of such authorities from the national total is increasingly problematic in light of continued non-response from some larger authorities, as well as low response rates following the COVID-19 pandemic. ↩
-
Note that where an authority does not submit data for the count, we publish the data submitted for the previous count (of the same season) for up to 3 counts. ↩
-
Data for Travelling Showpeople caravans can be found in the accompanying Live Table 3 of previous January releases. ↩