Impact of the coronavirus (COVID-19) pandemic on travel time measures
Published 16 September 2020

© Crown copyright 2020
This publication is licensed under the terms of the Open Government Licence v3.0 except where otherwise stated. To view this licence, visit nationalarchives.gov.uk/doc/open-government-licence/version/3 or write to the Information Policy Team, The National Archives, Kew, London TW9 4DU, or email: psi@nationalarchives.gov.uk.
Where we have identified any third party copyright information you will need to obtain permission from the copyright holders concerned.
This publication is available at https://www.gov.uk/government/statistics/travel-time-measures-for-the-strategic-road-network-and-local-a-roads-july-2019-to-june-2020/impact-of-the-coronavirus-covid-19-pandemic-on-travel-time-measures
Background
The outbreak of coronavirus (COVID-19) has had a marked impact on everyday life, including on congestion on the road network. As these data are affected by the coronavirus pandemic in the UK, caution should be taken when interpreting these statistics and comparing them with previous time periods.
To understand the level of impact on congestion of the coronavirus lockdown, exploratory analysis was conducted to estimate the effects. From early March 2020 the UK government started the first of its phases in its response to the coronavirus pandemic. A fall in the number of vehicles on the roads can be seen from when the first self-isolation guidelines were announced, therefore the exploratory analysis has considered, 12 March 2020, onwards.
In April 2020, the amount of traffic fell to below 40% relative to levels measured prior to lockdown and only started to return to pre-lockdown levels in July 2020.
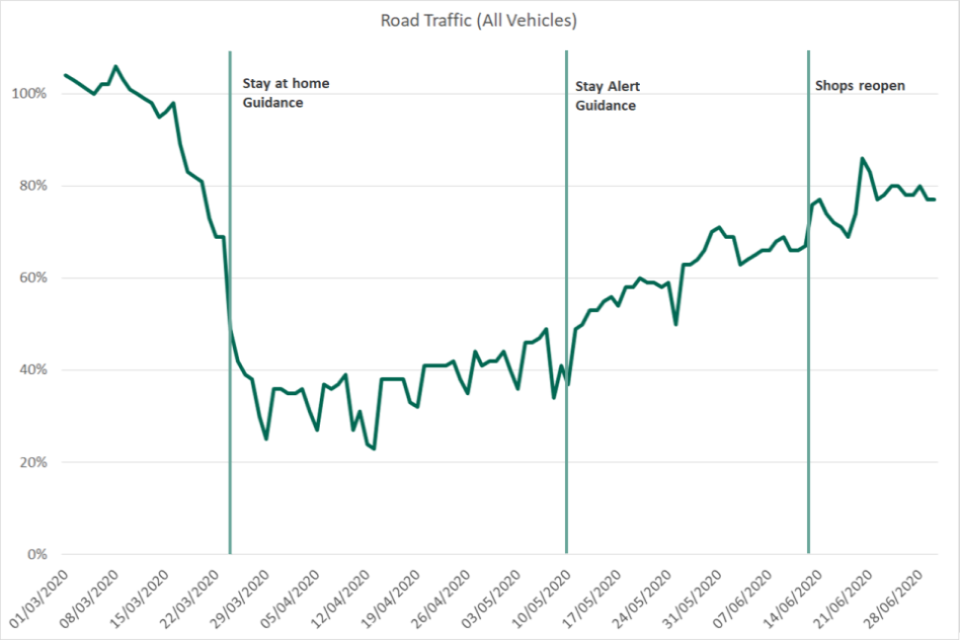
Chart 1.1 – Change in road usage, England: Indexed to first week in February 2019 up 30 June 2020
Source: Transport use during the coronavirus pandemic
The fall in traffic was also seen in the average number of trips in the congestion data sample.
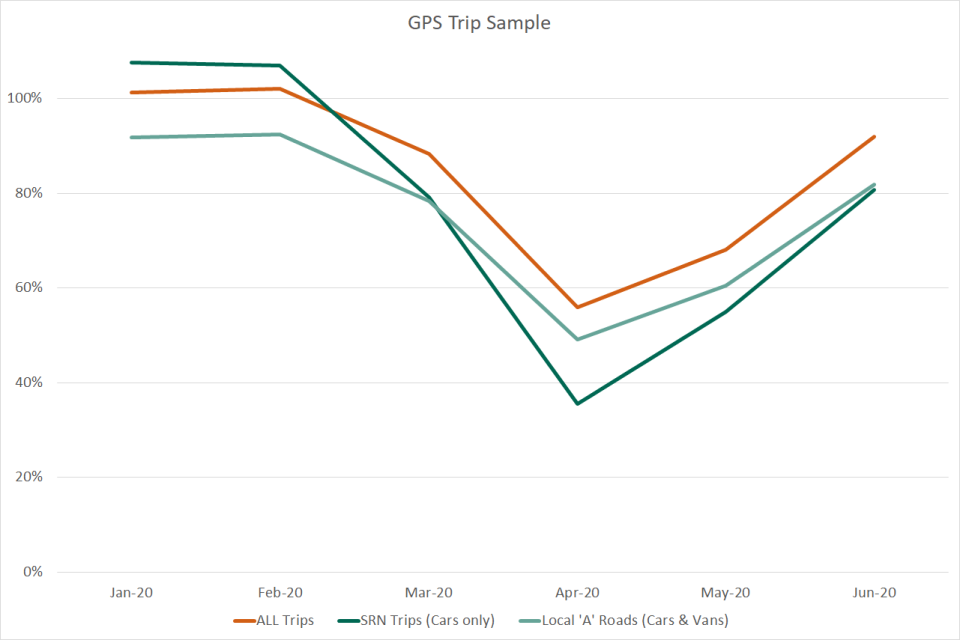
Chart 1.2 – Change in trip sample, England: Indexed to equivalent month in 2019
Source: Teletrac Navman
The change in GPS data sample size since the start of lockdown corresponds with the change in road traffic data.
Strategic Road Network (SRN)
Average speed and delay in England on the Strategic Road Network (SRN) from January 2018.
On the Strategic Road Network (SRN) congestion in the year up to June 2020, and compared to the year up to June 2019:
- average delay is estimated to be 8.6 seconds per vehicle per mile compared to speed limits, a decrease of 8.5%
- average speed is estimated to be 59.6 mph, an increase of 1.1%
- 59.7% of additional time was needed compared to speed limits, on average, on individual road sections of the SRN to ensure on time arrival. This is down 7.0 percentage points, so on average a slightly lower proportion of additional time is required
During April 2020, the month most affected by the ‘Stay at Home’ guidance of lockdown, the average delay on the SRN more than halved compared to the level estimated for the same period without the impact of the coronavirus on travel. In June 2020, the average delay on the SRN remained slightly less than half the estimated level of delay without the wider impacts of the coronavirus. Exploratory analysis suggests average delay on the SRN for the year ending June 2020 would have been 9.5 spvpm, as opposed to the observed delay of 8.6 spvpm in the year ending June 2020.
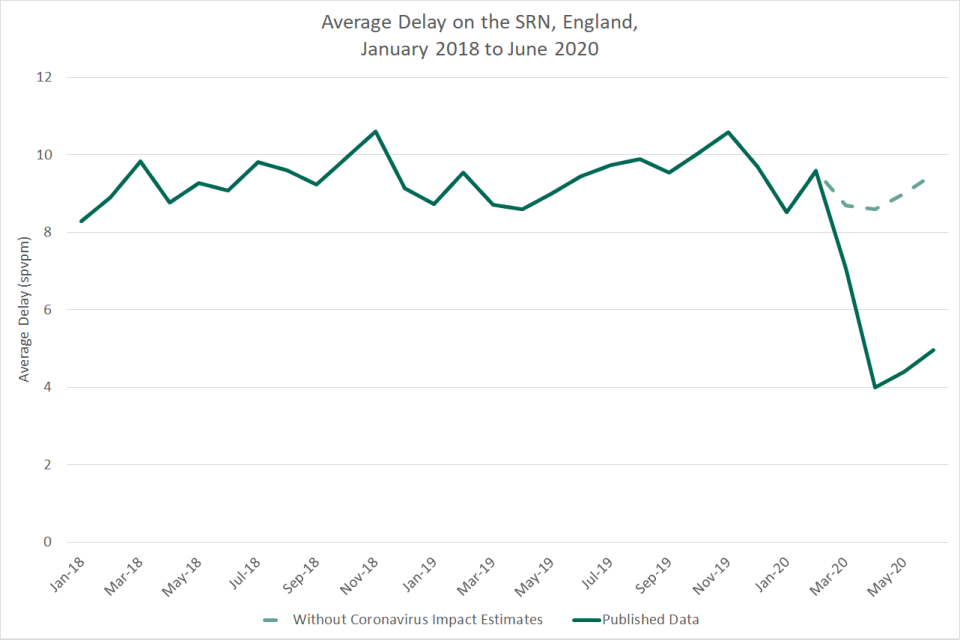
Chart 1.1 - Average delay on the Strategic Road Network, England: January 2018 to June 2020
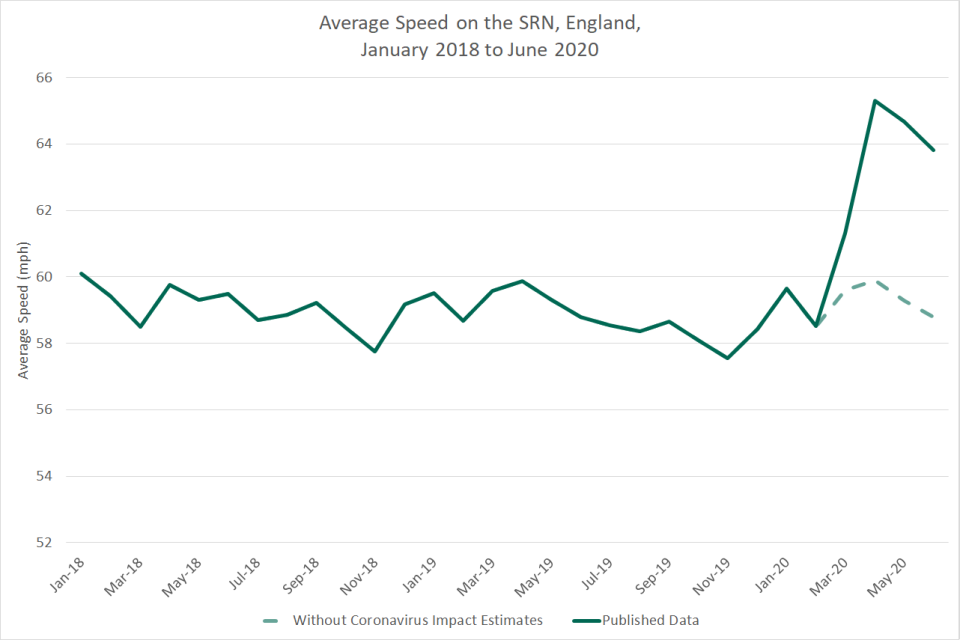
Chart 1.2 - Average speed on the Strategic Road Network, England: January 2018 to June 2020
Local ‘A’ roads
Average speed and delay in England on local ‘A’ roads from January 2018
On the local ‘A’ road network congestion in the year up to June 2020, and compared to the year up to June 2019:
- average delay is estimated to be 37.6 seconds per vehicle per mile compared to free flow, a decrease of 13.0%
- average speed is estimated to be 26.3 mph, an of 3.5% increase
In April 2020, the level of delay on local ‘A’ roads was nearly two thirds lower than the estimated delay without the impact of the coronavirus pandemic on travel. This level of delay is still just below half of what is estimated it would be for June 2020 without the wider impacts of coronavirus. Exploratory analysis suggests average delay on local ‘A’ roads for the year ending June 2020 would have been 44.0 spvpm, as opposed to the observed delay of 37.6 spvpm in the year ending June 2020.
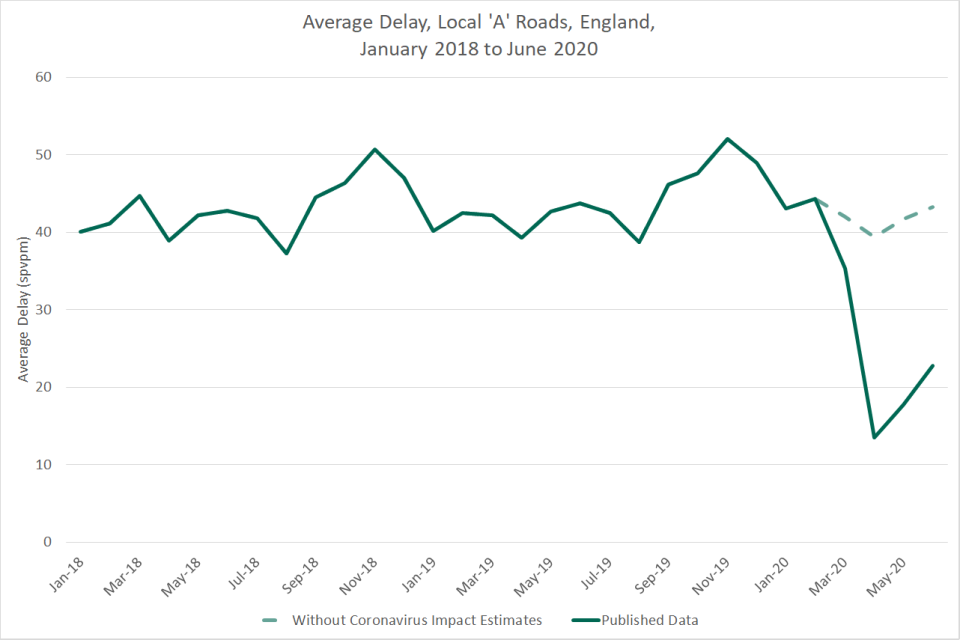
Chart 2.1 - Average delay on local ‘A’ roads, England: January 2018 to June 2020
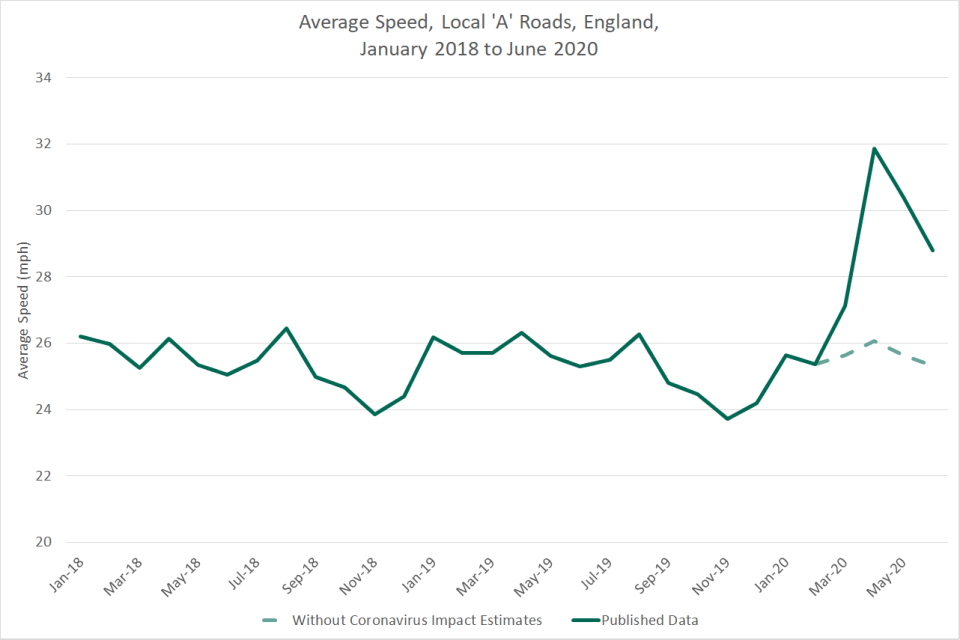
Chart 2.2 - Average Speed on local ‘A’ roads, England: January 2018 to June 2020
Methodology and Sample
After testing various methodologies for representing the values of speed and delay across the lockdown period, we decided to implement a replacement of the 2020 data across the network with the equivalent days’ data from 2019. When comparing other methodologies to estimate the known quantities of January and February 2020, we found that substitution of the previous year’s January and February data proved to be the most reliable method for predicting subsequent months’ data.
This methodology has also previously been adopted by the Road Traffic Statistics publication in the Provisional road traffic estimates, Great Britain: April 2019 to March 2020 report. Estimates of local ‘A’ roads estimate also used the most recently available annual average traffic flow weighting.
Other methodologies tested included:
- wholly using imputed values
- using the rolling average and rolling it forward
- the exponential smoothing forecast model
- replacing the 2020 values with the equivalent 2019 data
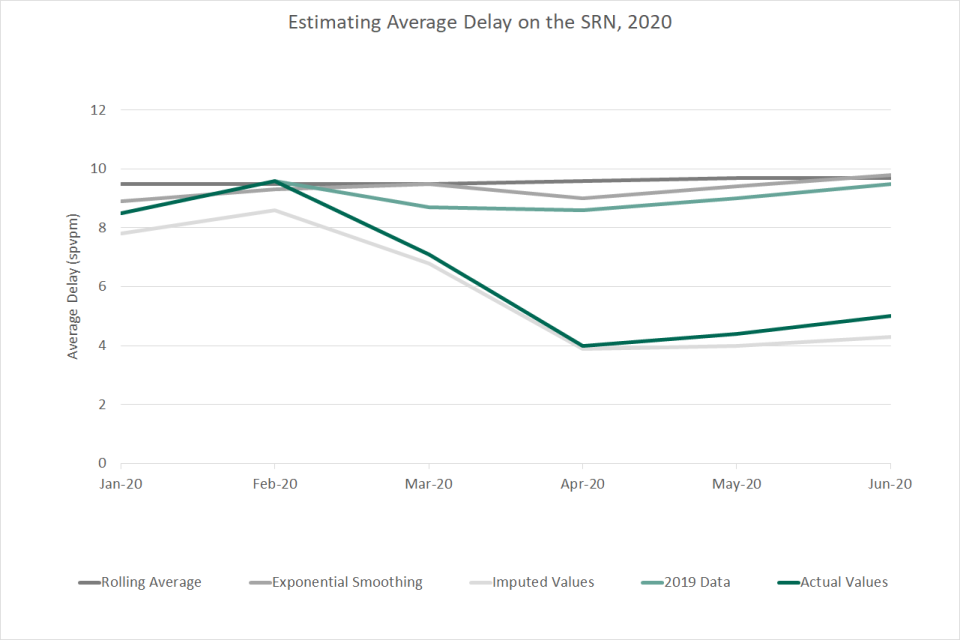
Chart 3.1 – Additional methodologies tested for the SRN, England: January to June 2020
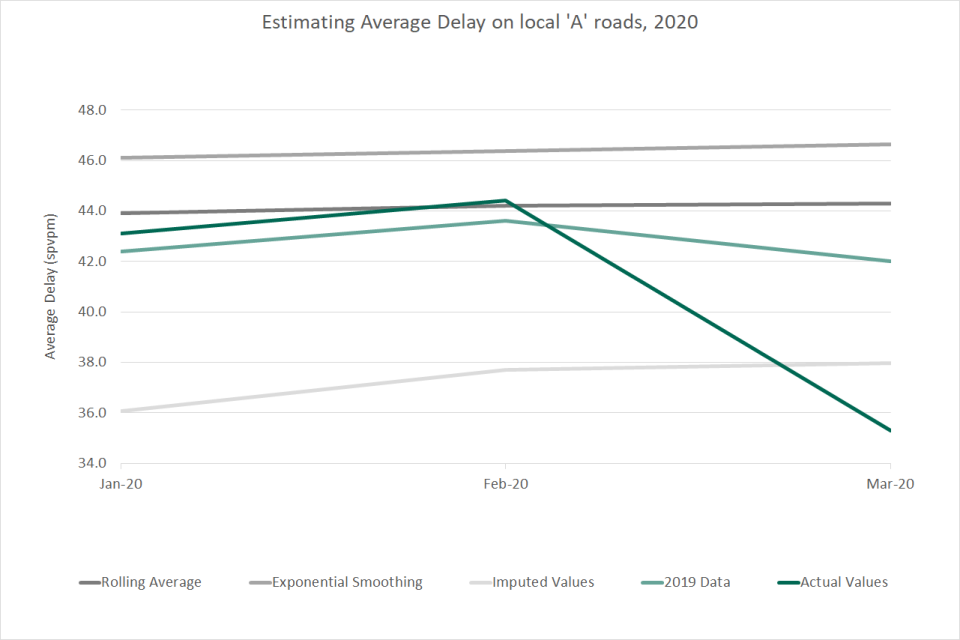
Chart 3.2 – Additional methodologies tested for local ‘A’ roads, England, January to June 2020